Category: Research & Development

  • Launchpad: handheld mapping, excavator guidance, cesium clock

    Launchpad: handheld mapping, excavator guidance, cesium clock

    A roundup of recent products in the GNSS and inertial positioning industry from the September 2022 issue of GPS World magazine.


    OEM

    Receiver Upgrade

    OSNMA anti-spoofing tech now on PolaRx5 GNSS reference receivers

    Photo: Septentrio
    Photo: Septentrio

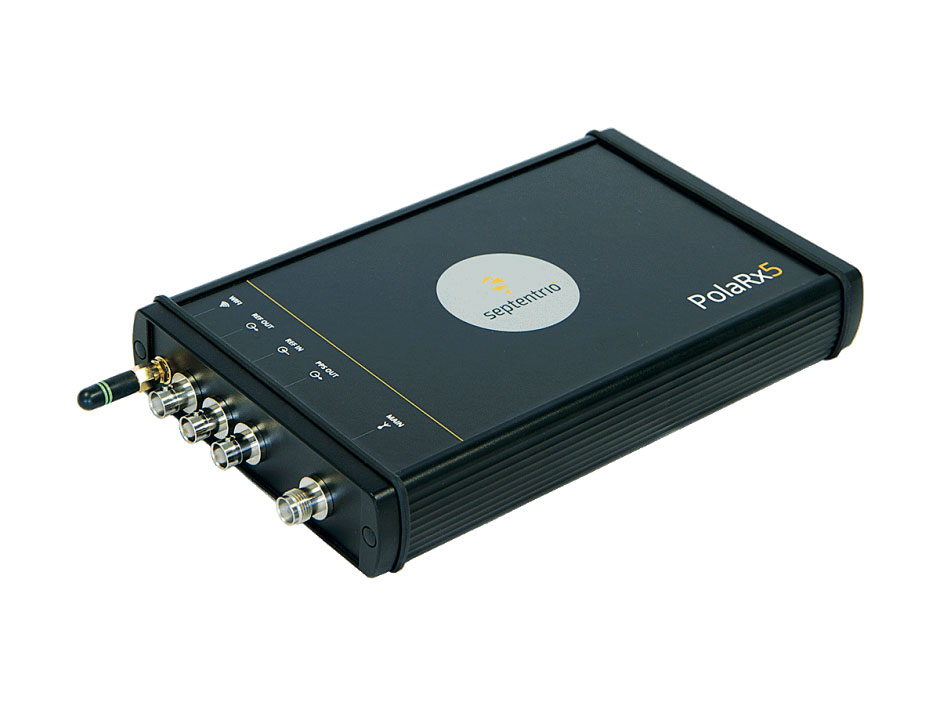
    Open Service Navigation Message Authentication (OSNMA) is now available on the high-end PolaRx5 reference receiver series. OSNMA offers end-to-end authentication on Galileo’s civilian signals, protecting receivers from GNSS spoofing attacks. OSNMA adds another layer of security to the receivers’ existing AIM+ anti-jamming and anti-spoofing technology. The PolaRx5 product range also now supports RINEX format versions 3.05 and 4.0.

    Septentrio, septentrio.com

    Anti-Jam Antennas

    Developed with the United States military

    Photo: Mayflower Communications
    Photo: Mayflower Communications

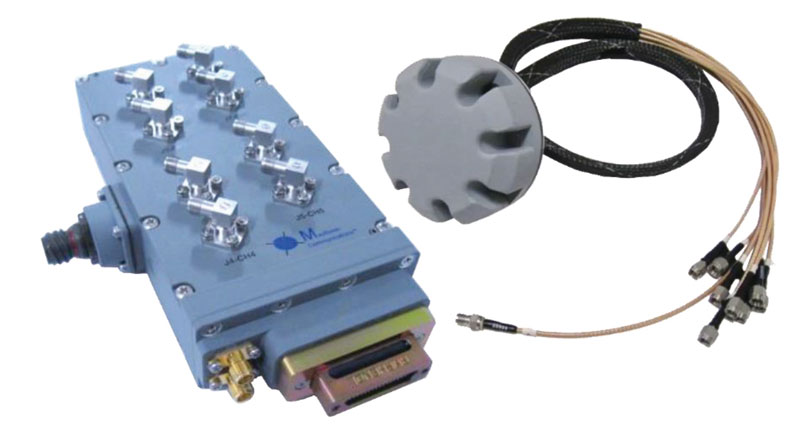
    The MAGNA-F and MAGNA-I GPS anti-jam antennas provide simultaneous L1/L2 protection and can protect commercial and military GPS receivers on aircraft. The MAGNA products were developed with sponsorship by the U.S. Navy and further improved by the U.S. Army to support GPS protection requirements for air, sea and ground platforms, such as fixed-wing/rotary aircraft, ships, UAVs and tactical vehicles. The MAGNA-F uses a 3.5-inch-diameter controlled reception pattern antenna (CRPA) compatible with existing fixed radiation pattern antenna (FRPA) footprints. The MAGNA-I (NavGuard 730) is a high-performance yet small GPS anti-jam integrated solution with a 4.5-inch diameter FRPA-compatible footprint.

    Mayflower Communications, mayflowercom.com

    Single-board computer

    Centimeter-level GNSS for mass-market applications

    Photo: ArduSimple
    Photo: ArduSimple

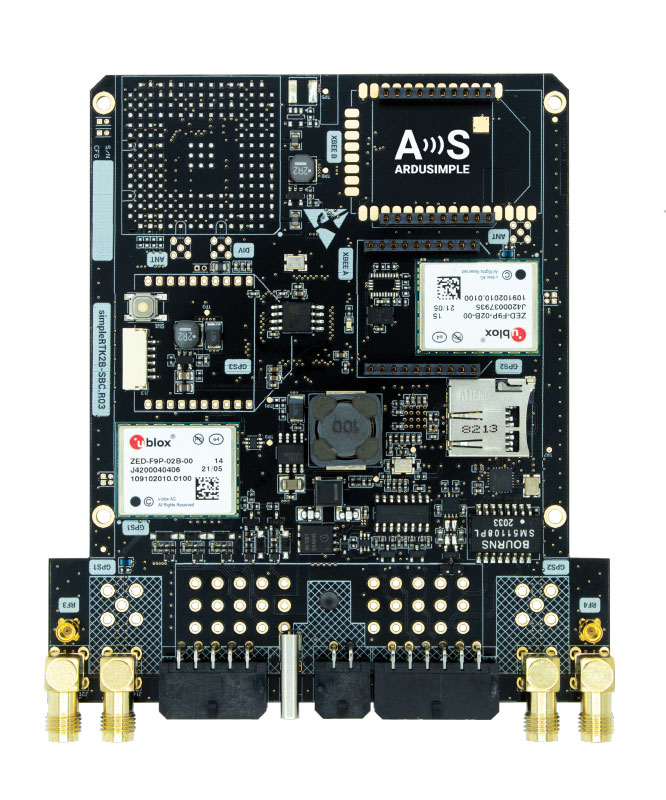
    The SimpleRTK2B single-board computer (SBC) is built around up to three u-blox ZED-F9P high-precision GNSS receivers. It simplifies development of centimeter-level positioning solutions supporting real-time kinematics (RTK), making the technology accessible to broader audiences. The SimpleRTK2B-SBC was developed to make RTK technology as close to plug-and-play as possible. In addition to working as a stand-alone solution, customers can program their own applications with the company’s microPython API. The SimpleRTK2B-SBC delivers mechanical integration with centimeter position on three axes (heading, pitch and roll), outputting on NMEA, RTCM, RS232 and CANBus interfaces via Ethernet, Bluetooth, Wi-Fi and 2G/3G/4G communication. It offers configurable input/output and an inertial measurement unit.

    u-blox, u-blox.com; ArduSimple, ardusimple.com

    Optical cesium clock

    For assured positioning, navigation and timing (PNT)

    Photo: ADVA
    Photo: ADVA

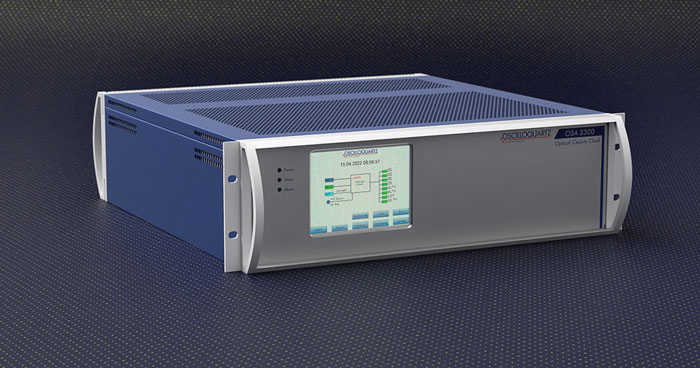
    The OSA 3300-HP is a high-performance optical cesium clock with a 10-year lifetime compared to the five-year lifetimes of high-performance magnetic clocks. It provides the resilience required for PNT assurance in critical infrastructure and empowers service providers to deliver differentiated service-level-agreement timing offerings with integrated GNSS backup. The OSA 3300-HP has embedded Ethernet- and IP-based management as well as a user-friendly touchscreen graphical user interface.

    ADVA, adva.com

    Vehicle Navigation System

    With M-Code capabilities and upgrade paths for other GNSS systems

    Photo: Collins Aerospace
    Photo: Collins Aerospace

    NavHub-200M is a vehicle navigation system for the international market with military code (M-code) receiver capabilities. NavHub-200M provides assured positioning, navigation and timing (APNT) while improving overall resistance to threats to GPS, such as jamming and spoofing. Its message formats and signal modulation techniques ensure faster and more accurate performance for ground vehicles on the connected battlespace, while advanced security features prevent unauthorized access or exploitation. NavHub-200M also includes the open interface standards and sensor-fusion capabilities required for a GNSS upgrade path, such as that for Europe’s Galileo constellation, as well as the ability to interface with key vehicle sensors such as the inertial measurement unit (IMU) and odometer.

    Collins Aerospace, collinsaerospace.com


    MAPPING

    Mapping Handheld

    High-performance data collector

    Photo: Trimble
    Photo: Trimble

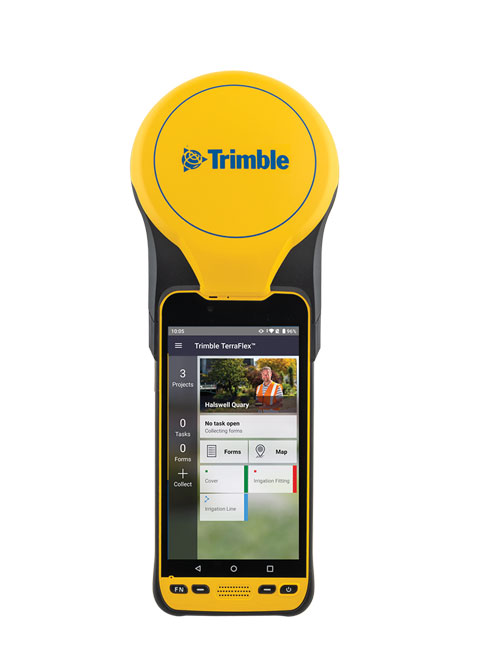
    The Trimble TDC650 handheld is built for data collection, inspection and asset management activities. The rugged solution provides scalable high-accuracy GNSS positioning for professional field workflows, including apps such as Esri ArcGIS Field Maps and Trimble TerraFlex software. The TDC650 is scalable, allowing customers to choose their desired accuracy down to the centimeter level.

    Trimble, trimble.com

    Lidar Scanner

    Powerful solution for manned and unmanned aircraft

    Photo: YellowScan
    Photo: YellowScan

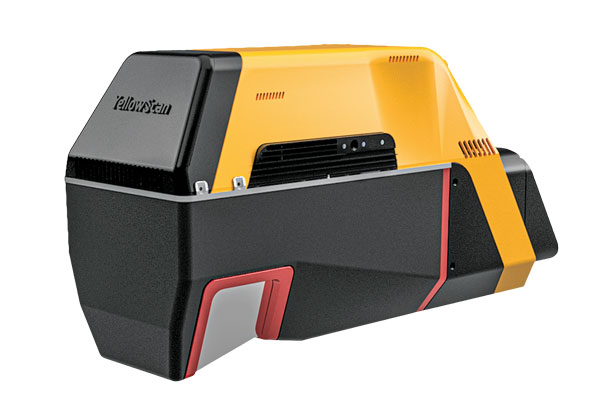
    The Voyager long-range lidar scanner has a wide field of view, with all points collected oriented toward the ground so there is no loss of points. In all, 1.5 million points per second will be usable. Voyager combines a Riegl VUX-120 laser scanner with a Trimble Applanix AP+ 50 AIR or Applanix AP+ 30 AIR GNSS-inertial board, providing a precision of 0.5 cm and an accuracy of 1 cm. Voyager’s detection and processing of up to 15 target echoes per laser pulse allows for excellent vegetation penetration. It has an extremely fast data-acquisition rate of up to 1,800 kHz, suitable for projects requiring the highest point density. The laser scanner’s specifications can be customized and can be combined with YellowScan’s software solutions.

    YellowScan, yellowscan-lidar.com

    ArcGIS Pro Add-In

    Extends 3D Tiles Next workflow into Esri ArcGIS Pro

    Photo: ArcGIS
    Photo: ArcGIS

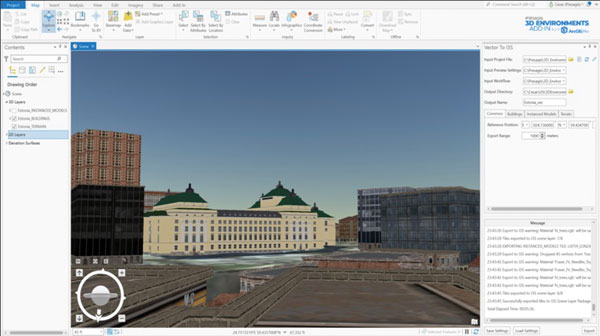
    The 3D Environments Add-In application for Esri ArcGIS Pro allows ArcGIS users to rapidly transform 3D Tiles Next data formats, such as One World Terrain, into ArcGIS Pro projects to create 3D scenes from 2D vector data and 3D models. The add-in leverages Presagis’ building templates and texture libraries that analysts use to create enhanced 3D visualizations of GIS environments, helping increase collaboration across the enterprise. The 3D Environments Add-In contains tools to create, transform and extract a wide variety of 3D formats to provide seamless interoperability between ArcGIS Pro and modeling and simulation applications. It is available on the Esri ArcGIS Marketplace.

    Presagis, presagis.com

    Cloud-Based GIS

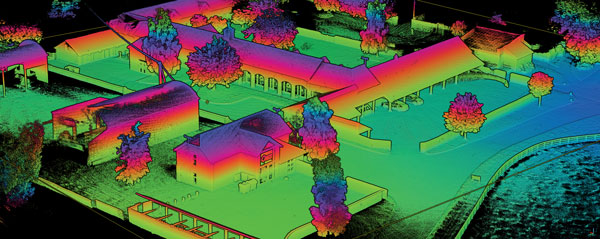
    Energy performance data helps tackle climate change

    Photo: XMAP
    Photo: XMAP

    Municipal geographic information system XMAP can now incorporate the energy-performance ratings of individual properties to help local authorities tackle climate change, improve housing standards, and ensure landlords comply with legislation. The Energy Performance Certificate (EPC) data layer uses a rating system similar to the one used on new appliances, ranging from A (very efficient) to G (inefficient). It allows tenants and house buyers to make informed decisions. In addition to a color-coded visualization of current ratings, the XMAP EPC layer contains enhanced analysis including generalized ratings and the potential for improvement. Bath and North East Somerset Council, UK (pictured), has embraced this resource and is looking at how the data can be used to raise housing standards.

    XMAP, xmap.geoxphere.com

    Caged Drone

    For mapping and inspection in dangerous areas

    Photo: Flyability
    Photo: Flyability

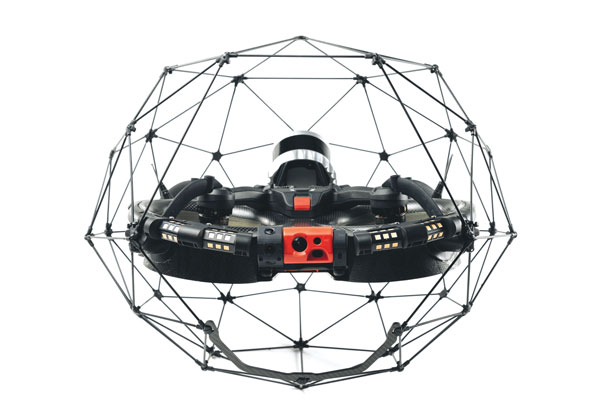
    The Elios 3 is a collision-tolerant drone equipped with a lidar sensor for indoor 3D mapping. The drone is powered by a new SLAM engine called FlyAware that lets it create 3D models as it flies. It also hosts a new version of Flyability’s software for inspectors, Inspector 4.0. The Elios 3 comes with an Ouster OS0-32 lidar sensor, allowing inspectors to collect data for the creation of survey-grade 3D models using Connect software from Flyability’s partner GeoSLAM. Protected by a cage, the Elios 3 has advanced collision-tolerance features that allow inspectors to fly it inside dangerous confined spaces such as boilers, pressure vessels and mines.

    Flyability, flyability.com


    SURVEYING

    Data Collector

    Ergonomic yet rugged for fieldwork

    Photo: ComNav
    Photo: ComNav

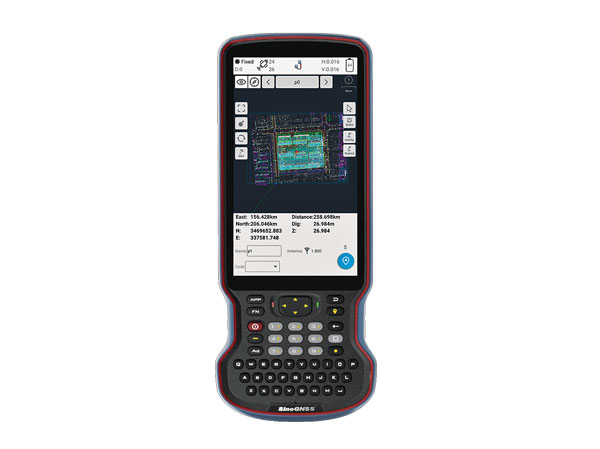
    The R60 is a powerful handheld with an ergonomic design. It runs on Android 12 OS, providing a suitable workhorse for surveying professionals in the field. Survey Master field software works seamlessly on the R60, which features a Qualcomm 8-core processor for massive data processing. Its 64-GB memory allows ample data storage and enables the opening of CAD drawings in seconds. Other features include a QWERTY keyboard, a 5.5-inch sunlight-readable high-resolution screen, an IP67 rating (dustproof and waterproof), and a 9,000 mA Li-ion battery for more than 30 hours of continuous functioning.

    ComNav Technology, comnavtech.com

    Base Station

    Mobile station provides cm positioning

    Photo: HYFIX
    Photo: HYFIX

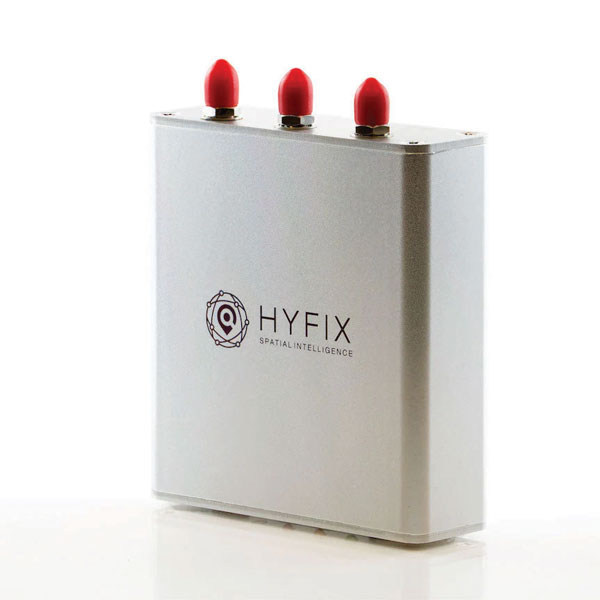
    The Mobile Centimeter (MobileCM) Space Weather Station is a ready-to-use GNSS device that will act as a real-time kinematic (RTK) base station and collect space weather data. The device is pre-configured to securely connect with the Global Earth Observation Decentralized Network (GEODNET) using a home Wi-Fi network. The full four-constellation GNSS base station has built-in NTRIP server functionality and is packaged with a survey-grade triple-band roof antenna and required cables.

    HYFIX, hyfix.ai


    MACHINE CONTROL

    Guidance System

    Upgradeable for precision agriculture

    Photo: SingularXYZ
    Photo: SingularXYZ

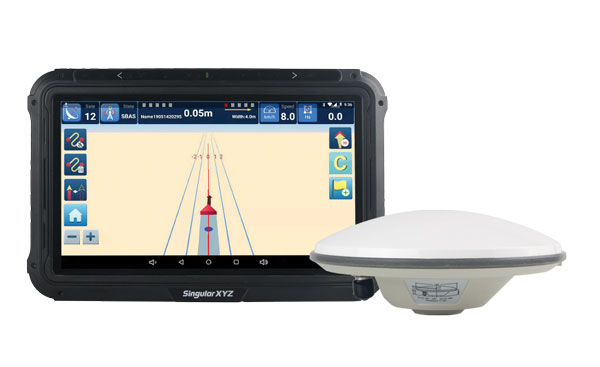
    The SAgro10 GNSS guidance system is an entry-level guidance system for precision agriculture, providing users with higher navigation precision and higher productivity, which can be upgraded to an automatic steering system. Embedded with a high-precision GNSS module, the SAgro10 system tracks all four global constellations. For users with network coverage or a UHF base station, the system provides centimeter-level accuracy navigation in real-time kinematic mode. In the absence of base stations, the SAgro10 system provides sub-meter navigation accuracy in single-point smoothing mode. Compatible with most agricultural tractors, its components can be installed within 15 minutes. The 10-inch sunlight-readable touchscreen has a clear and simple graphic interface.

    SingularXYZ, singularxyz.com

    Excavator Guidance

    Brings 3D mapping to small sites

    Photo: iDig
    Photo: iDig

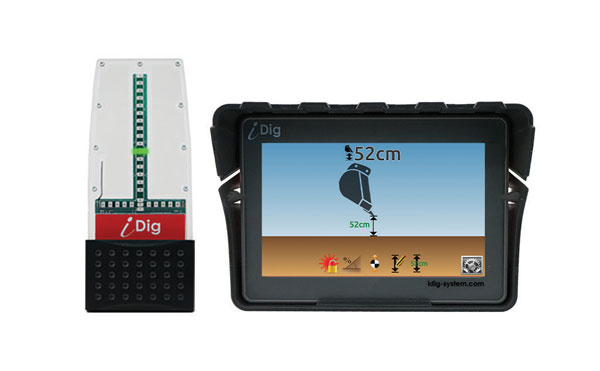
    iDig 3D Connect is a solar-powered excavator guidance system with a GNSS receiver that can be removed and used as a rover, rather than permanently installed on the machine. 3D excavator guidance has seldom been used for small projects such as house foundations because of the need for a surveyor to stake out points and map a site. The removable receiver enables contractors to complete these tasks. The software provided creates a GNSS-generated site map, enabling precision digging relative to the area and making the process quicker, simpler and more eco-friendly than with 2D.

    iDig, idig-system.com


    MOBILE

    Asset Tracking

    Cloud-based service uses GNSS and Wi-Fi

    Photo: onurdongel/iStock/Getty Images Plus/Getty images
    Photo: onurdongel/iStock/Getty Images Plus/Getty images

    The Cloud Locator service takes data from LoRa Edge-enabled devices and uses Semtech’s LoRa Cloud Geolocation and Modem services for asset tracking both indoors and outdoors. It features built-in serverless technology and enables testing of ultra-low-power asset tracking on either a private or public LoRaWAN network. It is designed to work with trackers using Semtech’s LoRa Edge LR-series chips. The LR-series chips combine Wi-Fi and GNSS to obtain the latitude and longitude of devices in any indoor or outdoor location. Once configured on the service, together with Semtech’s LoRa wireless radio frequency technology for transmission to the cloud, customers can view the tracker location on a map in less than 15 minutes.

    Semtech, semtech.com & locator.loracloud.com

    Bike Computer

    Features multi-band GNSS receiver

    Photo: Garmin
    Photo: Garmin

    The Edge 1040 bike computer features solar charging and multi-band GNSS technology. Its multi-band GNSS receiver (GPS, GLONASS and Galileo) provides accurate positioning in challenging ride environments, such as dense urban areas or under deep tree cover. Advanced navigational tools help cyclists stay on track, such as turn-by-turn navigation and alerts that notify riders of sharp curves ahead. Route guidance and off-course notifications can be paused for exploring and turned back on for return to the original route. When using the Trailforks app, Forksight mode automatically displays upcoming forks in the route and where a rider is within a trail network.

    Garmin, garmin.com


    SIMULATORS

    Simulator Upgrade

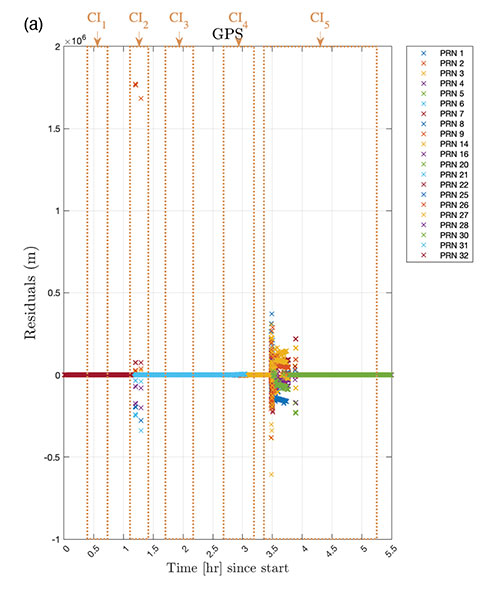
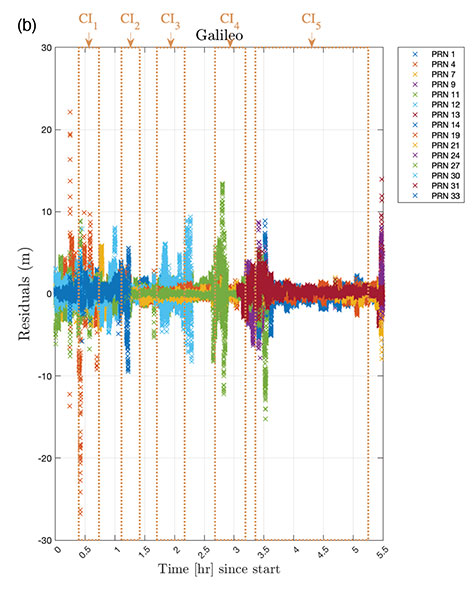
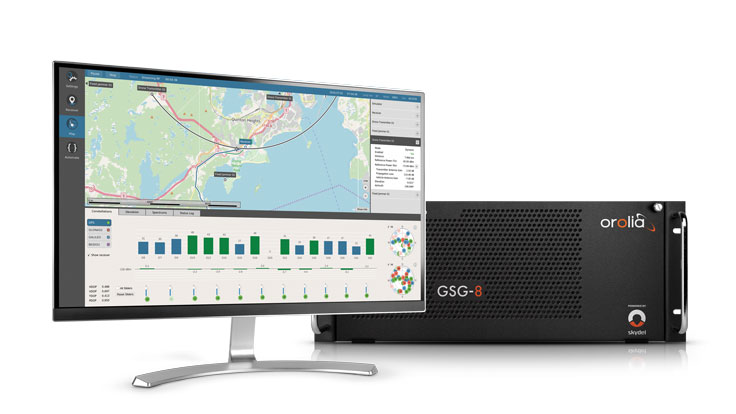
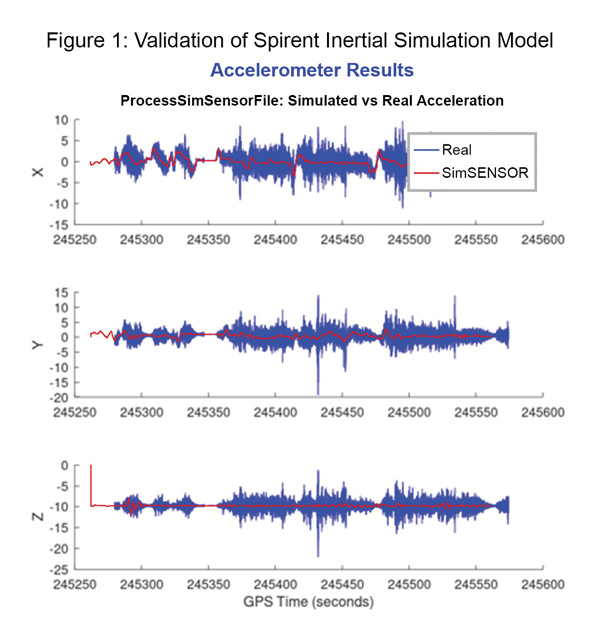
    Features advanced hardware-in-the-loop testing

    Photo: Orolia
    Photo: Orolia

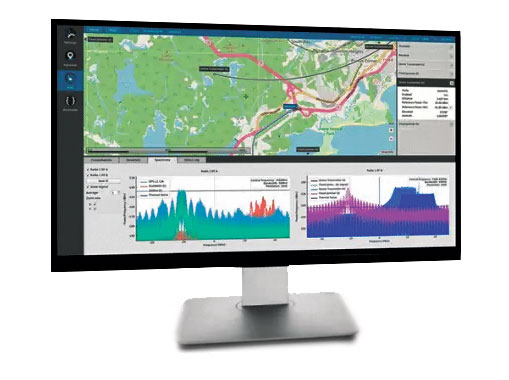
    Skydel 22.5 is a significant software upgrade to the Skydel simulation product line. It features advanced hardware-in-the-loop (HIL) testing solutions providing very low to zero effective latency. Enhanced visualization tools can monitor internal latency through real-time curves showing when the data is generated and sent to the RF signal. Users can also review the transmission of HIL packets for optimizing the entire network’s latency, checking its stability (jitter), and that data is available and used at the right time in Skydel. HIL testing is an essential step in the verification process of the model-based design approach because it involves all the hardware and software that will be used operationally.

    Orolia, orolia.com

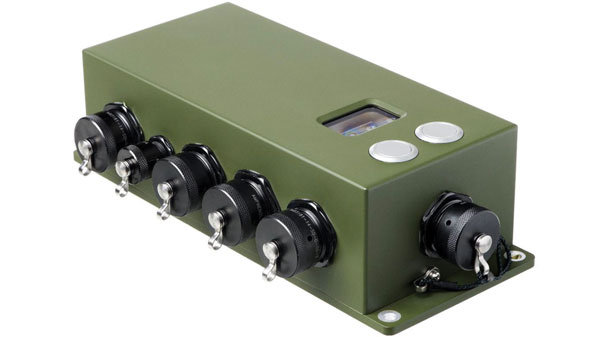
    Synchronizer and Simulator

    Contained in an easily deployable suitcase

    Photo: Focus Telecom
    Photo: Focus Telecom

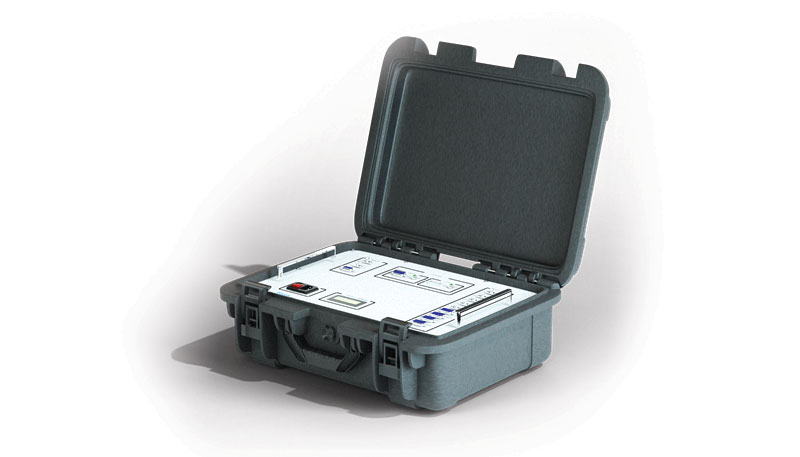
    The Time-Loader is designed for defense and mission-critical applications, for deployment in environments where GNSS signals are denied or disrupted. It supports any ground, naval or airborne system that needs real time of day (TOD) and 1PPS external synchronization aligned to the UTC or GNSS. It generates a GPS L1 C/A code RF output as if the signal were coming from a live-sky GPS antenna. It provides full-constellation GPS output and is compatible with external GNSS receivers. Its GPS-disciplined oscillator (GPSDO) is the Microsemi MAC-SA53/55, which provides excellent UTC accuracy with outstanding hold-over rubidium clock performance. A self-contained, miniature GPS simulator provides real-time extremely accurate signals. The 18-channel full-constellation simulator stores location/time/date data in internal memory and stores complex vector data to simulate dynamic scenarios. The simulator also can be used to transcode NMEA or SCPI position/ velocity/time (PVT) data into GPS RF signals.

    Focus Telecom, focus-telecom.com

  • IFEN releases new NCS Nova RF signal simulator

    IFEN releases new NCS Nova RF signal simulator

    Release V2.8 provides advanced interference, spoofing, encryption and authentication simulation capability

    Photo: IFEN
    Photo: IFEN

    IFEN GmbH has released a new version of its NCS Nova RF signal simulator, offering a full package of advanced simulation capabilities.

    With its now-integrated interference generation capability (AWGN, CW, pulsed and chirp), NCS Nova version 2.8 can generate coherent interference signals with a signal power of up to –30 dBm.

    The ability to assign two users to one RF output enables integrated spoofing scenarios with a single RF output (one user is the original simulated user; the other is the target spoofing user). Thus, spoofing is available even with an entry-level single RF Nova.

    The key feature of this new release is the new navigation message authentication (NMA) simulation capability, compliant to User ICD 1.0 for the Galileo E1-B OSNMA. Beyond basic authentication-testing capability, specific OSNMA events can be simulated. Testing OSNMA-enabled receivers under these specific events is key to ensuring compliant receiver behavior. The supported events include both a public key renewal and revocation and TESLA keychain renewal and revocation. Also, GPS cross-authentication is fully supported.

    Finally, the new release fully supports generation of Galileo E6-C encrypted codes. This enables users to take full advantage of the Galileo third-frequency pilot signal.

  • Innovation: Monitoring GNSS interference and spoofing — a low-cost approach

    Innovation: Monitoring GNSS interference and spoofing — a low-cost approach

    Innovation Insights with Richard Langley
    Innovation Insights with Richard Langley

    AS CAT STEVENS (yes, he’s back to using his old name) famously sang on “Wild World”:

    “… take good care
    Hope you make a lot of nice friends out there
    But just remember there’s a lot of bad and beware
    Beware.”

    While he was talking about a girlfriend leaving him, the warning can just as well apply to GNSS users — especially those relying on GNSS for safety-of-life navigation and the maintenance of critical public infrastructure systems.

    GNSS signals are relatively weak and they are susceptible to unintentional and intentional jamming that can make reception of the signals difficult or impossible. The jamming of radio signals to hinder reception is nothing new. It’s been used by those wanting to interfere with the use of the radio spectrum ever since radio became an important tool for communication and navigation in the early 20th century. Jamming has been used in hot wars to try to defeat military communication as well as in cold wars to try to prevent a perceived enemy from broadcasting to a particular country’s citizens. Notably, the shortwave radio broadcasts from Western countries were jammed by the former Soviet Union. And even today, broadcasts directed at China, Cuba and some other countries are regularly jammed.

    GNSS is also being intentionally jammed on a regular basis in some parts of the world for various purposes including the protection of politicians and civilian infrastructure and to foil GNSS-guided munitions. But while directed at supposed threats, the jamming affects all GNSS receivers in a certain radius of the jammer. Such jamming activities are being reported in the popular press with an increasing frequency.

    While GNSS jamming is receiving increased attention in our troubled world, even more pernicious is GNSS spoofing. Spoofing is the attempt to mimic GNSS signals to try to trick a receiver into tracking them and thereby compute a wrong position and/or time at the receiver. This can have disastrous consequences if not detected immediately and the use of GNSS deactivated.

    So, how do you detect GNSS signal jamming and spoofing? We have discussed this issue in several columns over the years, but in this month’s column, a team of researchers from Stanford University and the University of Colorado describe how they are using relatively inexpensive equipment and sophisticated software and analyses to detect and warn of GNSS jamming and spoofing. Clearly, they are heeding Cat Stevens’ warning.


    By Leila Taleghani, Fabian Rothmaier, Yu-Hsuan Chen, Sherman Lo, Todd Walter, Dennis Akos and Benon Granite Gattis

    GNSS signals are extremely low power by the time they reach users on Earth and are easily overwhelmed by nearby terrestrial signals. Such signals can interfere with a user’s ability to receive the desired GNSS signals or, even worse, replace them with simulated signals that cause the user to obtain the wrong position or time estimate. Two major types of radio-frequency interference (RFI) threats have been identified: jamming and spoofing. Jamming results from emissions that do not mimic GNSS signals, but interfere with the receiver’s ability to acquire and track GNSS signals. Spoofing is the emission of GNSS-like signals that may be acquired and tracked in combination with, or instead of, the intended signals.

    Both threats have been studied at length by researchers, and their presence around the globe has been reported even in the popular press. Some research has been done into the prevalence of spoofing. Even so, there is no well-developed understanding of how widespread these threats are.

    Terrestrial interfering signals may be fairly weak and only effective in a limited area. Complex environments with buildings or terrain may further limit their effective area of influence and hinder the ability of external interference detection. To create a better understanding of the presence and characteristics of jamming and even spoofing, we are developing a low-cost RFI detector based on a commercial, off-the-shelf GNSS receiver: the u-blox F9. We are pairing this receiver with a Raspberry Pi computer and are developing custom software to monitor the receiver outputs and store data surrounding interesting events.

    We are developing a toolset in MATLAB and C/C++ with the intention of processing and analyzing the u-blox data. The toolset includes functionality to decode selected u-blox messages that contain parameters of interest. These metrics include automatic gain control (AGC), carrier-to-noise-density ratio (C/N0) and spectral power. They also include raw pseudoranges from multiple constellations and internal u-blox interference metrics. With the volume of data that can be gathered from continuous monitoring, we have begun characterizing nominal performance and developing approaches to spoofing and jamming detection. The publicly available code can be accessed through our Git Repository at https://github.com/stanford-gps-lab/navsu.

    With the raw pseudoranges and downloaded broadcast ephemeris data, we compute navigation solutions using different combinations of constellations and frequencies. When the individual and multi-constellation position solutions are compared to each other, discrepancies can be flagged and investigated for possible interference. We have begun characterizing nominal power metrics such as AGC and C/N0. With the quantity of data that we can get from the RFI monitor, we are working to characterize other receiver-specific parameters such as the u-blox continuous wave (CW) jamming indicator. We leverage data collected under nominal and jammed conditions to understand and identify a threshold for what can be considered interference.

    Many different methods have been proposed for GNSS interference detection and mitigation with large-scale data at multiple locations. In this article, we present our data-selection process, our development of thresholds for determining interference, and results from three u-blox receivers set up at different locations in the United States to glean information about nominal (non-spoofed) conditions. We inform our thresholds and analysis tools using datasets from nominal conditions, and then compare their performance to a dataset containing RFI events from a government-sanctioned jamming and spoofing test. Our results display how we leverage simple and powerful metrics informed by a low-cost receiver to understand nominal noise environments and successfully identify jamming and spoofing events.

    Data and Metrics

    We collect and analyze a variety of data types and metrics to help identify and characterize jamming and spoofing occurrences. The receiver model we started with, u-blox ZED-F9P-02B, can monitor two different RF bands and many signals, including GPS L1C/A, L2C; GLONASS L1OF, L2OF; Galileo E1B/C, E5b; BeiDou B1I, B2I; QZSS L1C/A, L1S, L2C; and SBAS L1C/A. It has 184 channels, which can be configured to sweep through an array of signals to be monitored. We are also developing monitors based on the recently released ZED-F9T-10B, which is capable of L1 and L5 signal reception. TABLE 1 describes which version of the u-blox receivers each dataset comes from.

    TABLE 1. Locations of u-blox monitor for nominal noise environment characterization and jam/spoof test. (Data: Authors)
    TABLE 1. Locations of u-blox monitor for nominal noise environment characterization and jam/spoof test. (Data: Authors)

    L1 and L5 are the primary frequencies used for aviation, hence a monitor for these frequencies would be more useful for protecting aviation than the F9P, which is only capable of L1 and L2 reception. The available data includes raw measurements such as code and carrier phase, position estimates, power level estimates including C/N0, AGC and spectral power. It also has active CW interference detection. These metrics are all necessary for the consistency checks and power monitoring methods we summarize in this article. Consult our conference proceedings paper for details (see Acknowledgments). By examining all of these signals and measurements, we can observe changes in the RF environment and detect inconsistencies in the received signals.

    Data Logging. The u-blox receiver logs messages in a specific format. The message types important to log are selected based on the desired data. Due to limited bandwidth, we prioritized messages that efficiently include all desired parameters for the interference detection methods we describe in this article. We have used both the u-blox F9P and the u-blox F9T. 

    To characterize nominal noise environments, u-blox receivers were set up at three locations: Stanford University, the University of Colorado (CU) in Boulder, and at the Colorado Springs airport. All measurements from satellites below an elevation angle of 5 degrees were ignored. The results from these locations are summarized below. Results from a jamming/spoofing test sanctioned by the U.S. Department of Homeland Security are presented and labeled with the acronym “GET-CI” (GPS Testing for Critical Infrastructures) in the subsequent discussion. Table 1 describes the parameters of the u-blox receiver at each location.

    Positioning Metrics Development. The nominal error of the single- and multi-constellation position solutions is made by noting the difference between the computed position and the known truth. The inter-constellation consistency check is defined as the difference between the positions computed from two constellations, with no reference to a known truth position. To analyze the nominal differences in the north, east and down (NED) directions, we use the position covariance matrix, R, computed in the least-squares solver, to set a covariance-bound threshold. The covariance for each constellation is assumed independent. We present our results using this threshold in our results sections. 

    Our results in FIGURE 1 show that the Galileo position solution variance is higher than the dual-constellation and GPS-only solution. This is attributed in part to the fact that Galileo, while operational, has not filled out all planned satellite slots and therefore has fewer satellites and worse geometry than GPS. 

    FIGURE 1a. Map visualization of the comparison among position solutions computed using only GPS, only Galileo and a combined GPS plus Galileo dual-constellation solution at Colorado Springs. (Image: Authors)
    FIGURE 1a. Map visualization of the comparison among position solutions computed using only GPS, only Galileo and a combined GPS plus Galileo dual-constellation solution at Colorado Springs. (Image: Authors)
    FIGURE 1b. Map visualization of the comparison among position solutions computed using only GPS, only Galileo and a combined GPS plus Galileo dual-constellation solution at CU Boulder. (Image: Authors)
    FIGURE 1b. Map visualization of the comparison among position solutions computed using only GPS, only Galileo and a combined GPS plus Galileo dual-constellation solution at CU Boulder. (Image: Authors)
    FIGURE 1c. Map visualization of the comparison among position solutions computed using only GPS, only Galileo and a combined GPS plus Galileo dual-constellation solution at Stanford. (Image: Authors)
    FIGURE 1c. Map visualization of the comparison among position solutions computed using only GPS, only Galileo and a combined GPS plus Galileo dual-constellation solution at Stanford. (Image: Authors)

    Nominal Noise Results

    Here are some of our positioning and power monitoring results under nominal reception conditions.

    Positioning. Based on the methods described earlier, we present a selection of our results from the positioning consistency checks. We present several informative visualizations of the error between the computed position solution and the known truth of each u-blox receiver and use the covariance threshold to bound the raw error. The error for dual-constellation, single-constellation and inter-constellation consistency checks are all displayed and compared to one another. The pseudorange residuals and their accompanying chi-squared (χ2) statistic are also evaluated and compared for the GPS and Galileo single-constellation position solutions.

    Positioning Consistency Comparison Maps. From the maps in Figure 1, we observe that Galileo has the highest error, followed by GPS, and then the dual-constellation solution. The map also serves as a method to spatially visualize the tails of the error distribution.

    NED Time Histories. We compare the time history of the dual-constellation, GPS and Galileo position solution error to the three sigma (3σ) covariance bound computed at each epoch (see FIGURE 2). We also compare the GPS vs. Galileo inter-constellation difference to the 3σ covariance bound. The covariance bound is never crossed, indicating that 3σ threshold is conservative for both the error and the inter-constellation difference between GPS and Galileo.

    Photo:FIGURE 2a. Dual-constellation north-east-down error vs. known truth, bounded by a 3σ threshold, at Colorado Springs. (Image: Authors)
    FIGURE 2a. Dual-constellation north-east-down error vs. known truth, bounded by a 3σ threshold, at Colorado Springs. (Image: Authors)
    FIGURE 2b. Dual-constellation north-east-down error vs. known truth, bounded by a 3σ threshold, at CU Boulder. (Image: Authors)
    FIGURE 2b. Dual-constellation north-east-down error vs. known truth, bounded by a 3σ threshold, at CU Boulder. (Image: Authors)
    FIGURE 2c. Dual-constellation north-east-down error vs. known truth, bounded by a 3σ threshold, at Stanford. (Image: Authors)
    FIGURE 2c. Dual-constellation north-east-down error vs. known truth, bounded by a 3σ threshold, at Stanford. (Image: Authors)

    Pseudorange Residuals and χ2 Statistic Threshold. Pseudorange residuals have a long history of being used as a consistency check between range measurements. As an example, the pseudorange residuals for the GPS position solutions are shown in FIGURE 3, and their corresponding χ2 statistic is shown in FIGURE 4.

    FIGURE 3a. GPS pseudorange residuals at Colorado Springs. (Image: Authors)
    FIGURE 3a. GPS pseudorange residuals at Colorado Springs. (Image: Authors)
    FIGURE 3a. GPS pseudorange residuals at Colorado Springs. (Image: Authors)
    FIGURE 3b. GPS pseudorange residuals at CU Boulder. (Image: Authors)
    FIGURE 3c. GPS pseudorange residuals at Stanford. (Image: Authors)
    FIGURE 3c. GPS pseudorange residuals at Stanford. (Image: Authors)
    FIGURE 4a. GPS χ2 and probability of false alert (PFA) threshold for the nominal noise environments at Colorado Springs. (Image: Authors)
    FIGURE 4a. GPS χ2 and probability of false alert (PFA) threshold for the nominal noise environments at Colorado Springs. (Image: Authors)
    FIGURE 4b. GPS χ2 and probability of false alert (PFA) threshold for the nominal noise environments at CU Boulder. (Image: Authors)
    FIGURE 4b. GPS χ2 and probability of false alert (PFA) threshold for the nominal noise environments at CU Boulder. (Image: Authors)
    FIGURE 4c. GPS χ2 and probability of false alert (PFA) threshold for the nominal noise environments at Stanford. (Image: Authors)
    FIGURE 4c. GPS χ2 and probability of false alert (PFA) threshold for the nominal noise environments at Stanford. (Image: Authors)

    The χ2 statistic is computed using the finite pseudorange residuals at each epoch, where the degrees of freedom are n − 4, where n is the number of satellites used at that epoch and 4 is the number of variables solved for (x, y, z, and the receiver time offset) when using a single constellation. A p-value is computed using the cumulative distribution function (CDF) of the χ2 statistic, and indicates the probability that the χ2 statistic at each epoch would be greater than the observed value. The statistic is compared to a theoretical 10−9 probability of false alert (PFA) based on the theoretical χ2 and the actual degrees of freedom of each epoch. Very low values for the χ2 statistic, such as those obtained with Galileo, are attributed to regions where very few satellites are in view, thus decreasing the degrees of freedom. Any spikes in the pseudorange residuals are also reflected with a higher χ2 statistic and low p-value, though those residuals are de-weighted in the position solution and ultimately do not trigger the 10−9 PFA threshold or the 3σ threshold, thus indicating that a 10−9 PFA is a conservative threshold. 

    Power Monitoring. For each nominal location with a u-blox receiver, we analyze results from the power-monitoring metrics mentioned earlier. We also observe results from the internal u-blox jamming indicators in a region where a possible RFI event was observed.

    For power monitoring, we analyze spectral power and programmable gain amplifier (PGA) results. 

    For the nominal noise environments, the spectral power, PGA and corresponding C/N0 results indicated no significant anomalies.

    Threshold and Metric Validation Results

    An examination of thresholds and other metrics are important for characterizing RFI.

    GPS Testing for Critical Infrastructure. From a DHS-sanctioned RFI testing event, we identify five regions of interference or spoofing. To identify the interference, we use a combination of the power and positioning metrics as well as the thresholds we developed through the characterization of the nominal noise environments described in the previous sections of this article.

    We use the thresholds and tests we’ve developed to identify regions of spoofing and RFI events (labeled C I1–C I5) in the GET-CI dataset. For ease of comparison, all regions are labeled on plots that display the full 5.5 hours of data collection. All details as to the truth location and time of the test have been removed. C I1 is identified through the power metrics. C I2–C I5 are identified as regions that the NED difference between GPS and Galileo clearly crossed the 3σ threshold in all three directions, as visualized in FIGURE 5.

    FIGURE 5a. Map view of solutions using GPS, Galileo and GPS plus Galileo for the DHS-sanctioned RFI testing event (identifying coordinates and physical features removed). (Image: Authors)
    FIGURE 5a. Map view of solutions using GPS, Galileo and GPS plus Galileo for the DHS-sanctioned RFI testing event (identifying coordinates and physical features removed). (Image: Authors)
    FIGURE 5b. Corresponding log-scale visualization of the GPS vs. Galileo position solution difference in the north-east-down directions. (Image: Authors)
    FIGURE 5b. Corresponding log-scale visualization of the GPS vs. Galileo position solution difference in the north-east-down directions. (Image: Authors)

    From our pseudorange residuals, it appears as though the most significant interference events happened on the GPS constellation, as indicated by the high pseudorange residuals that fall into the C I2 and C I5 regions. Using the GPS χ2 statistic and p-value computations, we determined that the regions that crossed the 10−9 PFA threshold line are consistent with the regions of interference identified in Figure 5. The Galileo χ2 statistic, p-values and pseudorange residuals all show signs of possible interference. These regions are explored more in the power monitoring discussion below. 

    Since the GPS pseudorange residuals and χ2 statistic results show more signs of spoofing than the Galileo ones, we explore the Galileo-only position solution. Because the truth position is unknown, we take a point during the non-C I regions and define this as the “truth,” that is, a point in the position solution we believe has not been subject to spoofing. Any references to a truth position are from a position recognized as “truth” through post-processing rather than from a pre-determined and known location.

    The p-values dip in each of the C I regions, but are lowest in regions C I5. Combined with the fact that the pseudorange residuals and NED error are the highest in C I5, we identify this as the region that likely experienced a significant spoofing event. We determined from an outlier at the beginning of the C I5 region (see Figure 5) that even the Galileo constellation is not immune to the spoofing in this scenario.

    To further check the accuracy of our determination that GPS was spoofed, we evaluated the histograms of the Galileo error. With the biggest outlier in C I5 removed, we saw that the error appears relatively Gaussian, with some outliers and possible multi-modal behavior that were also seen in the nominal locations. The variance was higher than was observed at nominal locations, which could be attributed both to the presence of known RFI events, the fact that the nominal noise environment at the RFI event test has not been characterized (that is, it is possible there is a noisier nominal environment at this location), and that the “truth” position was not a known truth but obtained through post-processing of a dataset with increased RFI. Normalized error indicates that the error does not cross the 3σ threshold in any NED direction, further supporting the assertion that 3σ is a conservative threshold.

    Important to note is that the major outlier around T+3.5 hours is visible in the NED plot (Figure 5), but the corresponding histograms do not contain that outlier. This indicates that the covariance also increases at that point. It dictates a need to monitor the covariance bound itself, as well as the positioning error. The NED time history plot and the raw error histograms serve this purpose, since it is clear that if we were to be only looking at the error normalized by 3σ, we would not have found significant evidence of the outlier, since the normalized error barely passes the 3σ threshold. This further supports our methods of combining multiple metrics, thresholds and visualizations rather than relying on a single metric to identify jamming and spoofing.

    From the Galileo solution analysis, we increase our confidence that we have identified the regions with interference. We removed those areas and looked at the GPS vs. Galileo inter-constellation consistency difference. The normalized differences were now mostly within the 3σ threshold, and the raw error displayed some Gaussian behavior and is no longer on the order of the 105-meter error we were seeing in Figure 5. While these regions still have a higher error than nominal conditions and thus still display signs of interference, we are able to use our spoofing analysis to identify epochs in which we should not trust the GNSS. Using times outside those regions, we are able to figure out a reasonable truth position within 20 meters rather than 200 kilometers.

    Positioning analysis using the inter-constellation consistency check is a powerful tool for determining the reliability of a position solution, even when the truth location is unknown. With the power metrics, we can further corroborate the positioning results, as well as find events indicating interference that the positioning metrics were unable to track. 

    FIGURE 6a. GPS pseudo range residuals for position solutions computed using only the GPS constellation. (Image: Authors)
    FIGURE 6a. GPS pseudo range residuals for position solutions computed using only the GPS constellation. (Image: Authors)
    FIGURE 6b. Galileo pseudorange residuals for position solutions computed using only the Galileo constellation for the DHS-sanctioned RFI testing event. (Image: Authors)
    FIGURE 6b. Galileo pseudorange residuals for position solutions computed using only the Galileo constellation for the DHS-sanctioned RFI testing event. (Image: Authors)

    Next Steps and Summary

    Leveraging the raw data collected by u-blox receivers in multiple locations with different nominal noise environments, we have developed the toolsets to do inter- and intra-constellation consistency checks to monitor for jamming and spoofing. Many further observables usable for RFI detection are being recorded by the u-blox receivers. Several power monitoring metrics have been evaluated in a preliminary analysis. The next step is to further characterize metrics such as C/N0, AGC and u-blox internal jamming metrics under nominal conditions. 

    In summary, the tools we have developed so far show that the u-blox receiver will allow for many different consistency checks on a variety of parameters to be running simultaneously. It would be difficult for a spoofer to interfere with all the dimensions we have covered in our detector. Continuously monitoring a wide variety of parameters will increase the chance that we are able to detect interference, thus lowering the chance that a spoofer is able to evade detection.

    Acknowledgments

    We gratefully acknowledge the support of both the FAA Satellite Navigation Team and The Aerospace Corporation under their university partnership program. We especially wish to thank Steve Lewis of Aerospace for his support and guidance throughout the development of this project. This article is based on the paper “Low Cost RFI Monitor for Continuous Observation and Characterization of Localized Interference Sources” presented at ION ITM 2022, the 2022 International Technical Meeting of the Institute of Navigation, Jan. 25–27, 2022. 


    LEILA TALEGHANI recently graduated with her MS degree from Stanford University in aeronautics and astronautics and is now a navigation engineer at Trimble.

    FABIAN ROTHMAIER is a navigation research and development engineer at Airbus Defence and Space in Munich, Germany, and a former a Ph.D. student at the Stanford GPS Laboratory. 

    YU-HSUAN CHEN is a research associate at the Stanford GPS Laboratory. 

    SHERMAN LO is a senior research engineer at the Stanford GPS Laboratory.

    TODD WALTER is a research professor in the Department of Aeronautics and Astronautics at Stanford University. 

    DENNIS AKOS is a professor with the Aerospace Engineering Sciences Department at the University of Colorado, Boulder.

    BENON GRANITE GATTIS is a laboratory assistant and undergraduate student in the Aerospace Engineering Sciences Department at the University of Colorado, Boulder.

  • Ultra-wideband brings signals indoors

    Ultra-wideband brings signals indoors

    Other sources, such as lidar, can be used to aid navigation in the absence of GNSS signals. (Photo: OxTS)
    Other sources, such as lidar, can be used to aid navigation in the absence of GNSS signals. (Photo: OxTS)

    We discussed complementary PNT with Peter Rylands, senior product manager at OxTS.

    What are some of the most promising approaches to complementary PNT and how does simulation technology help?

    There are two approaches of particular interest. The first is looking at LEO satellite systems that can provide supplementary and potentially more secure methods of navigation, with global coverage from a single system. But these will still suffer from some of the issues GNSS systems experience, namely, what happens when you can’t obtain a signal?

    The second is the use of visual aiding through sensor fusion, such as lidar and cameras, that can provide relative positioning (or absolute positioning once you have a space mapped) using SLAM algorithms. While this may increase onboard hardware dependencies, it creates a localized navigation system that can be better protected from malicious actors.

    In contrast, closed-loop systems can look to an infrastructure-based system, allowing free movement within the specific area in which the infrastructure is located and a potentially more reliable source of PNT, especially indoors, where GNSS is not available. Ultra-wideband is definitely the up-and-coming technology here, but systems using Wi-Fi, cameras, Bluetooth and others also are being used.

    Simulation, as within many domains, allows users to test on a large scale with fewer barriers to entry than real-world testing and an ease in making iterative changes to find an optimal solution. Whether that is to benchmark performance in locations of interest or to change configuration settings to improve visibility or positioning, simulation allows you to do this without the expense of going straight into the environment itself or configuring the actual vehicle under test.

    How does OxTS fit in that mix?

    OxTS provides customers with the ability to navigate anywhere; whether for reference data in R&D, georeferencing for survey and mapping, or active navigation of autonomous solutions. To do this we provide an IMU-first offering that we then complement with other technologies. Traditionally, this is with GNSS, to form an INS that can provide centimeter-level accuracy. However, we are also aware of the vulnerabilities of GNSS. For us, this is when it becomes an unreliable source of PNT in denied areas, such as indoors, in urban canyons or under tree canopies.

    Because of this, we are also investigating and developing complementary solutions that can enhance our offering for users who need confidence in their position even when GNSS is not available. Whether that is through sensor fusion, our Pozyx UWB solution for indoor navigation or other proprietary software and firmware capabilities.

    What kinds of complementary PNT are most useful in addressing specifically the challenges posed by jamming and spoofing and how does simulation help?

    We need to look at systems that cannot be impacted by, or have mitigations from, the impact of jamming and spoofing. Solutions that are independent of radio communications or satellite use are then valuable in providing this layer of protection. This is where we could look toward OxTS’s use of IMU technology and visual aiding systems. Simulation technologies would then allow you to run hardware-in-the-loop testing, where the primary GNSS solution can have simulated jamming and spoofing to understand the performance of your complementary and protected systems when GNSS cannot be trusted.

  • 5G promises deeper connections

    5G promises deeper connections

    Orolia developed the Skydel GSG-8, a PNT test solution in its GSG family of simulators, to deliver GNSS signal testing and sensor simulation performance in an easy to use, upgradable and scalable platform. (Photo: Orolia)
    Orolia developed the Skydel GSG-8, a PNT test solution in its GSG family of simulators, to deliver GNSS signal testing and sensor simulation performance in an easy to use, upgradable and scalable platform. (Photo: Orolia)

    We discussed complementary PNT with Erik Oehler, marketing director at Orolia.

    What are some of the most promising approaches to complementary PNT and how does simulation technology help?

    5G is the most promising for the future. I believe the benefits in infrastructure, speed, precision, reliability, and the industry incentives 5G offer are superior to GNSS. Alternative signals of opportunity and new commercial satellite-based providers are always valuable as extra layers of resilience. However, PNT from 5G is not quite ready yet. There will be a transition period during which systems use GNSS and these signals of opportunity simultaneously, so simulation enables receivers of any complementary signal to be tested in the same environments and with the same potential threats faced by primary constellation signals.

    How does Orolia fit in that mix?

    Orolia has the most atomic clocks in orbit, including those aboard the Galileo constellation. We integrate anti-jam antennas and build Interference Detection and Mitigation (IDM) into our products. We partner with companies that offer alternative signals, such as STL from Satelles. Our SecureSync NTP and PTP time servers live in the world’s biggest data centers and support encrypted signals, such as M and Y code for our militaries. We innovate with industry leaders such as Meta on building a better PCIe Time Card. We offer edge time servers with the ability to automatically add Hoptroff’s Traceable Time as a Service. If 5G PNT becomes a standard, we are already providing industry leaders such as Anritsu with solutions for acceptance testing on a major carrier’s backbone. With our pending acquisition by Safran and access to a world-leading portfolio of INS components, we are one of the most qualified companies in the world to solve nearly any PNT challenge.

    What kinds of complementary PNT are most useful in addressing specifically the challenges posed by jamming and spoofing, and how does simulation help?

    In two technical notes published by NIST, they recognize STL as one of four recommended solutions for PNT resilience and the only one being both independent of GNSS and capable of sub-microsecond accuracy. Being closer to Earth, it is a stronger signal, making it 1,000 times less susceptible to jamming. Additionally, because it is encrypted it is inherently immune to spoofing. The aforementioned Hoptroff TTaS is time delivered over VPN, removing the outside environment component completely. For positioning and navigation, the integration of an IMU provides a contiguous PNT solution even during periods of GNSS denial, analogous to how an atomic clock provides precise time holdover during these denial periods. Combined with anti-jam antenna technology and IDM software, a robust PNT solution is always available.

    Simulation helps by (1) identifying the vulnerabilities your PNT system might have (or could have in the future to evolving threats) and (2) verifying the total integrated resilient system. Our GSG-8 Advanced GNSS Simulator supports hundreds of GNSS full spectrum signals, custom signals, and hardware-in-the-loop testing of integrated IMUs at up to 1000 Hz iteration rate. Our Skydel Wavefront and Anechoic simulators can verify the most complex GNSS anti-jam antenna systems.

  • Exclusive: Controlling the GNSS test environment

    Exclusive: Controlling the GNSS test environment

    Editor-in-Chief Matteo Luccio sat down with experts from Spirent Federal Systems to discuss how simulation technology helps improve positioning, navigation and timing (PNT) and GNSS products and systems.

  • High-powered satellites go beyond

    High-powered satellites go beyond

    Jackson Labs Technologies PNT-6200 Series, an STL-based time and frequency reference system installed in a 5G application. Photo: Satelles
    Jackson Labs Technologies PNT-6200 Series, an STL-based time and frequency reference system installed in a 5G application. Photo: Satelles

    We discussed Satellite Time and Location (STL) services and complementary PNT with Michael O’Connor, CEO at Satelles.

    What is the problem with GPS/GNSS that Satelles aims to solve?

    GPS and GNSS are amazing. We designed Satellite Time and Location (STL), the service that we offer, to complement those capabilities. We have focused on three unique aspects in the areas where GPS could use complementary service. First, we provide a fully independent backup. We all know that things can happen, so we aim to provide an independent source of position navigation, and timing (PNT). Second, we focused the high-power aspect of STL to enable us to reach indoors and other places where GPS does not reach. Because STL comes from low Earth orbit (LEO) satellites, the signals are naturally at a higher power.

    We also focused on improving the indoor penetration capability by enhancing the signal design and doing some other things. Third, we use modern cryptographic techniques to ensure the security and resilience of the system, specifically to intentional misdirection attacks. If you can ensure that the signal is coming from the satellite and not from a third party you can have a more secure and resilient solution.

    To what extent can you replace GPS during an extended outage?

    We have never considered LEO PNT as a replacement for MEO (medium Earth orbit) GNSS. GNSS are the primary domain of PNT but there are applications that have additional needs. The more independence you can get, the fewer the common modes of failure, if you can at least have some survivability in the absence of GNSS. That’s one of the services we can offer. It is probably not the most important thing to our customers, honestly. The service we offer is similar to GPS and GNSS in that we have a space segment (the satellites), a ground segment, and a user segment. We have space vehicles, user equipment, and ground infrastructure that supports the space infrastructure.

    What’s interesting about the way we work with the Iridium satellite constellation is that the satellites themselves include inter-satellite links. That provides a lot of resilience to ground-based events. The satellites themselves have a time transfer capability between them. So, we don’t require a direct connection to every satellite to propagate a time throughout the network. That’s one unique aspect we can take advantage of with this particular network, Iridium, which is pretty amazing.

    Additionally, we have multiple ground infrastructure and monitoring sites and multiple sources of time at those ground monitoring and control stations. For example, some of them rely on GNSS combined with atomic clocks as their master timing source but we also have one installed at the National Institute of Standards and Technology facility in Boulder, Colorado. So, we have multiple primary time sources that we can integrate into our filtering across the network. That, combined, with satellite links, allows us to maintain time for substantial periods independent of GNSS.

    How do you define “complementary PNT” and how does Satelles fit in that mix?

    Several applications have additional needs beyond what GNSS offer. There are many technologies that can come to bear on that. There’s the LEO satellite base, which is where Satelles fits in, but there are also local and wide-area terrestrial radio navigation sources, network-based time transfer, signals of opportunity, and so on. They all have something important to offer, depending on the application. Satelles’ LEO satellite solution is available today, has global coverage, and is relatively affordable. It leverages the capital investments that have been made to launch the satellites to provide this service globally. The industry is working together to make sure that an awareness of these capabilities is propagated throughout the industries that we serve.

    Besides the orbit height, which requires many more satellites, how does your system differ from GNSS?

    We do not consider LEO PNT as something that might replace MEO PNT. The fundamental difference is being in lower Earth orbit, which results in a higher received power. That is what allows us to penetrate, just based on the 1/r2 losses. The measurable Doppler signatures give additional observables for PNT calculations, and higher satellite dynamics that can help with multipath. This service relies on many of the same physics and geometry as GPS. We measure the time of arrival of a very similar signal. The signals from the Iridium satellites are even in the L band. Very often we’re using a GPS chip that’s been reprogrammed to track and utilize our service as well as GPS or instead of GPS.

    If I explained how GPS works to, say, a high school science class, how much of that basic explanation—about trilateration, spread spectrum, etc.—would also apply to your system?

    It’s fundamentally the same. It relies on a lot of the same physics and geometry. We measure the time of arrival of a very similar signal. The signals from the Iridium satellites are even in the L band. Very often we’re using a GPS chip that’s been reprogrammed to track and utilize our service as well as GPS or instead of GPS. There are subtle differences—for example, a lower Earth orbit is faster—but it is very similar.

    How would GPS user equipment have to be modified to make use of your service?

    We don’t think of STL as something where we are modifying GPS user equipment. Rather, we think about what must be done in an end-user application to meet their needs. For example, one of our partners, Orolia, has a GNSS + STL secure synchronization product that we have delivered to customers in data centers and major stock exchanges around the world. Those are operational and in service. They integrate through standard interfaces, such as PPS or PTP, depending on the type of equipment to which they are connecting.
    Ultimately, we don’t think of it is as replacing GPS user equipment. Rather, where a user has a need for PNT, they’re opting for this GNSS + STL solution because they have an indoor need, such as a data center, or they have a need for resilience in the case of a stock exchange.

    Another example is Jackson Labs. The Jackson Labs 2600 is also a GNSS + STL solution that generally is integrating with existing 5g. It has a specialized transcoder interface that can work with any existing GNSS-type equipment. In some cases, we’ve taken a chip that was originally designed for GPS and modified its firmware.

    Who are the earliest adopters?

    Satelles’ LEO satellite solution is available today, has global coverage, and is relatively affordable. It leverages the capital investments that have been made to launch the satellites to provide this service globally. Data centers, stock exchanges and cell phone providers are implementing these capabilities today. The major wireless operators are seeing that more and more of the 5G infrastructure they roll out is going indoors, where GPS doesn’t reach. We provide a solution that integrates with their existing solutions and can provide reliable timing capabilities.

    If your solution can survive on its own, why does it need GNSS at all?

    In some cases, the user is not using GNSS at all. The product itself has a GNSS capability. User equipment is very affordable and the service is taxpayer-funded. In many cases, especially for indoor installations, the equipment that is installed is capable of tracking GNSS and STL signals, but often it relies on the STL signal itself for timing.

    How do you predict STL spreading through various applications and industries?

    We have our hands full with the markets we’re going after now, but there are certainly going to be other markets in which the customers will recognize that they have a critical need to implement a backup solution.

    In the long run, could LEO satellites replace MEO ones for GNSS?

    Sometimes there have been misperceptions in the industry. I’ve never considered that LEO PNT satellites might replace MEO ones. There are excellent reasons why Brad Parkinson, Jim Spilker, Gaylord Green and others decided almost 50 years ago to put GPS in MEO. Those physics haven’t changed. You can cover a large portion of Earth with each satellite. LEO will not replace MEO, but it has unique characteristics that make it a great complement to the GNSS MEO solutions.

    Do you have any additional comments about complementary PNT?

    It’s good to see that the federal government is encouraging the adoption of complementary PNT, which they often call “GPS backup.” It is encouraging to see the amount of activity on this issue that’s been going in Washington over the last couple of years. Although our company is very focused on delivering a LEO-based PNT service, which has several advantages for customers that need a global capability, many technologies can play an important role in those solutions.

    The U.S. Department of Transportation did a fantastic job of looking at several of those technologies across those different categories. The European Union has also had a similar activity recently. Some reports will be coming out soon about that. It is very important that the government understands that this is an important issue for our society and encourages industry to adopt these solutions and is even starting to make some investments toward that. That includes executive order 13905 and some recent funding increases by Congress.

    All of that has been very important and positive, as has modifying some of the legislation to be more inclusive of multiple technologies, such as removing the words “land-based” from the National Timing, Resilience, and Security Act this year.

    I am involved in an industry consortium, the Open PNT Industry Alliance, with several other companies whose CEOs are in alignment that there is no single answer. Having a thriving ecosystem of technologies and companies trying to solve this important problem is incredibly important and it’s exciting to see.

  • New approaches improve PNT resilience

    New approaches improve PNT resilience

    Data shows how successful baseline validation testing of Spirent's inertial simulation model as compared to real world inertial system performance. Photo: Spirent Federal Systems
    Data shows how successful baseline validation testing of Spirent’s inertial simulation model as compared to real world inertial system performance. Photo: Spirent Federal Systems

    We discussed complementary PNT with Roger Hart, head of engineering and Jeff Martin, head of sales at Spirent Federal.

    What are some of the most promising approaches to complementary PNT sources and how does simulation technology help?

    Roger Hart: The vulnerabilities of GNSS have been recognized. Legacy GNSS are all operating on pretty much the same frequencies and power levels, so, they have some significant common vulnerabilities. There is great interest in finding ways to complement or even replace those capabilities.

    Dead reckoning, magnetic and inertial systems have been around for a long time. There are emerging markets to make use of alternative radio frequencies for navigation. In some cases, we are piggybacking on communications signals and deriving PNT from them. In other cases, we are using new PNT signals. A couple that we’ve been focusing on are the alternative navigation systems.

    They may be using different orbits, different frequencies, different encoding schemes that set them apart from the legacy GNSS systems, so that, used together, they provide greater resiliency and even stand alone when one or the other system may be affected by interference.

    Not to be forgotten is inertial navigation. It’s been around for a long time and is still a standard of navigation. Together with GNSS, it makes it a terrific navigation system. It almost defines complementarity because where GPS is vulnerable inertial can fill in the gaps and where inertial drifts GPS does not. So, paired, they make a very strong system.

    At Spirent, we’ve been working with customers to provide a variety of options for both those alternative navigation systems and inertial. Both are a very active field of development and we’re keeping abreast of that.

    Jeff Martin: Some good points, Roger. This is something we’ve been engaged in for quite a long time. Since we provide test equipment to the community, it’s critical that we understand what they’re worried about, what the vulnerabilities are. It keeps things exciting, it keeps us on our toes and looking ahead to what’s coming.

    What are some of the remaining challenges of integrating GNSS receivers with inertial sensors and, again, how does simulation technology help with that?

    Hart: Inertial works by integrating sensor measurements that come in. Therefore, any errors that are present just accumulate over time and can corrupt your navigation solution. So, there’s a strong focus on updating error models and on translating them so that everyday users can use them and get real-life-type performance out of them.

    There’s a tendency to think of integrating GPS-INS as putting everything together in one box. There are packages that do that. However, the push now is to go to more distributed systems that are integrated but not packaged in the same box. One example is the all-source positioning and navigation standard that is being developed by the Department of Defense. It will allow you to swap one sensor for another as long as they adhere to the standard. That information all goes back to a sensor fusion engine.

    Martin: We have known GNSS simulators well for about four decades. We have been playing in the inertial sandbox for at least a couple of decades as well. This has given us the opportunity to build relationships with the with the key manufacturers and designers of inertial systems. Those relationships have been expanding well beyond inertial to many other sensors and systems that are now coming online. It’s been exciting.

    Much work is going into using low Earth orbit satellites for PNT—whether piggybacking on the Iridium satellites or launching new ones. How does simulation help with that?

    Hart: It certainly helps with the development of the receivers. The groups that are using these alternative RF and LEO or MEO systems need simulation as they develop the receivers. It gives you the ability to try things certainly before you launch them. At this conference there is considerable interest in making things reprogrammable. We have the NTS-3 satellite, which will be running experiments for different waveforms that can be generated. Even M-code is a step in the direction of giving more flexibility to the signal. It has a lot more flexible cryptography and signal generation than the legacy system with the C/A and P/Y codes.

    Our simulation platforms are software based, so we can generate and receive data that can be useful for developing software-defined receivers. It gives you the opportunity to try different waveforms. We have already delivered a satellite-based alternative navigation system simulator. Now, we can build on that one to help the other Leo constellations as they come forward.

    Martin: Roger put it well. This is where things get fun. People are concerned with PNT vulnerabilities, so we’re seeing these alternative navigation solutions coming forward. Spirent has done a good job over its nearly 40 years of existence of manufacturing and designing its own hardware and software. It has given us the opportunity to respond quickly. These things are coming fast. People need solutions quickly. We have some solutions already and the platform that we have created gives us the flexibility to develop more. We’re seeing more and more ideas come to fruition and people need to test them. So, this is where it gets fun. We’re excited.

    Much work has gone into addressing the enduring challenge of urban canyons. How does simulation technology help?

    Hart: Urban canyons are the worst nightmare for GNSS signals. If you’re surrounded by tall buildings, signals are blocked. You may have few or even no satellites in a direct line of sight and many multipath reflections. So, diminished and corrupted signals are available to you. Of course, the more GNSS satellites you have, the better chance you have of getting good signals. But complementing that are radar and vision systems. Those are the ones that will stand out, particularly the vision systems that can read the street signs, see where the curb is, look for parked cars. All those kinds of things will help fill in when you have poor GNSS coverage.

    You can observe what’s going on in the environment and simulate it. You can also use our forecasting tool to look ahead.

    Martin: This is where things get exciting, isn’t it? In these terrible environments where GNSS is contested—whether it’s an urban environment or one with intentional jamming—there is a lot we can do to help our industry. When this happens in real life, it’s bad news. But when you create that scary situation in the controlled environment of a laboratory, it is great. You can pick things apart and see where you need to improve. I get excited about it. It’s probably the geek in me. It gives us and our partners a lot to look forward to.

    How does simulation technology help with sensor fusion?

    Hart: It definitely helps you put all the pieces together. You can’t know how your system will work by individually testing each piece. System is the key word here. Simulation enables you to generate the signals and bring them together into a sensor fusion engine. You can test different algorithms. It’s certainly much cheaper and quicker than trying to build this into a product and then test it. Over the decades, simulation has proved itself as a very valuable way in both basic development and integrating the final product.

    Martin: That system-wide fusion is where the magic happens.

    It sounds like simulation technology—and Spirent Federal in particular—are very much at the center of a lot of the current developments and discussions about complementary PNT. Do you have any final comments?

    Hart: As Jeff said, it’s an exciting time. There are many things going on—new technologies, new ways of communicating. It’s a busy time and a bit of a scramble sometimes to keep up with all the new things that are coming.

    Martin: People look to Spirent to be their testing resource and it puts us right in the middle of it.

  • 5G LBS features verified on R&S TS-LBS test solution

    5G LBS features verified on R&S TS-LBS test solution

    Photo: Rohde & schwarz
    Photo: Rohde & schwarz

    Rohde & Schwarz and MediaTek have verified new location-based services (LBS) features for 5G new radio (NR), which are now available on the R&S TS-LBS test solution.

    The features will improve emergency caller location and support LBS-related use cases in challenging indoor and outdoor environments with both satellite-based and terrestrial technologies. The R&S TS-LBS now support these and other 3GPP Release 16 network-based positioning features.

    A 5G chipset from MediaTek also has been verified for Release 16, which ensures the chip’s  positioning features.

    The two companies verified the NR positioning reference signals (NR-PRS), which are central to network-based positioning features such as round-trip time (RTT), time difference of arrival in uplink and downlink (UL- TDOA and DL-TDOA), or angle of arrival and departure (AoA and AoD), and which meet the 5G requirements for indoor and outdoor positioning use cases.

    With R&S TS-LBS supporting these features, mobile device and chipset manufacturers as well as test houses and network operators can carry out verification for GCF, PTCRB and network-operator certification using a single test solution.

    About the R&S TS-LBS System

    The R&S TS-LBS is a test system for testing GNSS and network-based positioning. It consists of an R&S CMX500 OBT one-box signaling tester as the network simulator and an R&S SMBV100B GNSS simulator.

    The R&S CMX500 OBT setup provides full network simulation capabilities including the support of multiple 4G or 5G cells at a time. In addition, it provides LBS assistance data to the DUT while the R&S SMBV100B simulates the GNSS satellites.

    The R&S TS-LBS test system can be used for pre-conformance tests and to obtain GCF and PTCRB certification as well as network-operator-specific certification acceptance and validated tests.

    “Adding network-based positioning features such as DL-TDOA based on NR-PRS to the existing satellite based location signals shows the advanced level of our test solution,” said Christoph Pointner, senior vice president, Mobile Radio Testers, Rohde & Schwarz. “We are happy to continue our collaboration with MediaTek to push 5G location-based services further for 3GPP Release 16.”

  • Orolia releases Skydel GNSS simulation software upgrade

    Orolia releases Skydel GNSS simulation software upgrade

    Skydel 22.5 features advanced hardware-in-the-loop testing

    Orolia has released Skydel 22.5, a significant software upgrade to its Skydel simulation product line that features advanced hardware-in-the-loop (HIL) testing solutions providing very low to zero effective latency.

    The enhanced visualization tools can monitor internal latency through real-time curves showing when the data is generated and sent to the RF signal. Users can also review the transmission of HIL packets for optimizing the entire network’s latency, checking its stability (jitter), and that data is available and used at the right time in Skydel.

    HIL testing is an essential step in the verification process of the model-based design (MBD) approach because it involves all the hardware and software that will be used operationally. HIL verification can test a standalone device-under-test (DUT) or, more generally, an entire complex system consisting of multiple DUTs in both open- and closed-loop architectures.

    “The vast majority of problems encountered by engineers on HIL systems are related to poor control of the latency of the entire simulation chain, as they are insufficiently accessible, transparent and controlled on the competing systems,” said Pierre-Marie Le Veel, principal system architect and product manager for GNSS simulation. “Thanks to these tools, our high-end performance and well-known intuitive automation, Skydel dramatically reduces the implementation time of a HIL system (which can be very significant) and, therefore, the project’s overall cost.”

    Photo: Orolia
    Photo: Orolia

    In addition to these tools, Skydel implements modern extrapolation algorithms that achieve zero effective latency. These algorithms make it possible to keep position errors negligible, even for equipment with very high dynamics used in national defense applications such as missiles, rockets and guided shells.

    “These advanced HIL algorithms and tools are available – and with the same performance – on our Wavefront simulation systems to test controlled reception pattern antenna (CRPA) systems,” Le Veel added.

    Additional constellations, signal types and options such as real-time kinematic (RTK) and multi-instance are available along with dedicated bundled simulation starter packages for automotive.

    The upgrade is available at no additional cost for existing users operating Skydel 22.5. Application notes, support documents and tutorials are available online.

  • Reliable navigation with interference-free GNSS signals

    Reliable navigation with interference-free GNSS signals

    By Markus Irsigler and Sebastian Kehl-Waas

    Interference-free GNSS signals are essential for more than just military vehicles and aircraft. Anti-jam systems usually suppress signals from interference sources by means of spatial filtering.

    These solutions can likewise be used to protect satellite navigation signals for autonomous driving and flying against interference signals. To allow GNSS receivers to detect interference sources and suppress transmitted interference signals, they must be designed as multichannel systems.

    This way the direction of the interference signal can be determined using phase-coherent signal processing of signals from multiple antennas, and the interference can be suppressed. Rohde & Schwarz offers a solution for the verification of interference immunity and interference suppression.

    FIGURE 1a. The GNSS antenna in the example on the left has only one element, so its characteristic cannot be modified. A sufficiently strong interference signal can prevent the receiver from processing the GNSS signals, making satellite-based navigation impossible.
    FIGURE 1a. The GNSS antenna in the example on the left has only one element, so its characteristic cannot be modified. A sufficiently strong interference signal can prevent the receiver from processing the GNSS signals, making satellite-based navigation impossible.
    FIGURE 1b. In contrast to the individual antenna, the characteristic of the antenna array can be modified by combining and weighting the received signals. The interference signal is suppressed at its angle of arrival, and the GNSS signals can be received. A disadvantage is that GNSS signals from the same direction as the interference signal are also suppressed.
    FIGURE 1b. In contrast to the individual antenna, the characteristic of the antenna array can be modified by combining and weighting the received signals. The interference signal is suppressed at its angle of arrival, and the GNSS signals can be received. A disadvantage is that GNSS signals from the same direction as the interference signal are also suppressed.

    Multi-channel receivers can simultaneously process signals from multiple distributed antennas or from an antenna array. This is useful for determining the direction of incoming signals by means of signal analysis, and for adjusting the antenna pattern so that undesired signals are suppressed. For GNSS-based position determination, this means that signals from global navigation satellite systems (GNSS) can be strengthened and jamming or spoofing signals originating from the ground or the air can be suppressed. Up to now this technology has primarily been used for military applications, but in the future it can also make an important contribution to robust navigation for autonomous driving or flying. Typical interference sources in this regard are harmonics of transmitters in the vicinity, tactical air navigation (TACAN) signals, DME air navigation signals for civil aviation, and LTE signals. Another factor is the growing popularity of so-called personal privacy devices (PPD), which are GNSS jammers that radiate narrowband or broadband signals to disrupt GNSS localization. A new solution from Rohde & Schwarz enables comprehensive testing of the resistance of GNSS receivers to interference signals, if necessary in a realistic hardware-in-the-loop (HIL) environment.

    Multi-Channel GNSS Receivers for Interference Suppression

    GNSS receivers often use controlled reception pattern antennas (CRPA) to suppress undesired signals. These antennas consist of an antenna array and a signal processing unit. The connected antennas are generally arranged in a strict geometric pattern to achieve full coverage of all possible signal directions. The overall receive characteristic of the antenna array can be altered by suitable weighting of the signals from the individual antennas in the signal processing unit (Fig. 1). This way, interference signals can be specifically blanked out (nulling) or the required GNSS signals can be amplified at their angle of arrival (beamforming). A combination of these two methods is also possible. The antenna arrays typically consist of four to seven elements. The number of interference signals that can be simultaneously suppressed increases with the number of elements.

    FIGURE 2. A four-channel GNSS test system consisting of two R&S SMW200A vector signal generators and an R&S SMA100B analog signal generator for the LO signal (left). The vector network analyzer is used to calibrate the overall system at a user-selectable reference plane in terms of amplitude, phase and propagation time.
    FIGURE 2a. A four-channel GNSS test system consisting of two R&S SMW200A vector signal generators and an R&S SMA100B analog signal generator for the LO signal (left). The vector network analyzer is used to calibrate the overall system at a user-selectable reference plane in terms of amplitude, phase and propagation time.
    FIGURE 2. A FIGURE 2b. A four-channel GNSS test system consisting of two R&S SMW200A vector signal generators and an R&S SMA100B analog signal generator for the LO signal (left). The vector network analyzer is used to calibrate the overall system at a user-selectable reference plane in terms of amplitude, phase and propagation time.four-channel GNSS test system consisting of two R&S SMW200A vector signal generators and an R&S SMA100B analog signal generator for the LO signal (left). The vector network analyzer is used to calibrate the overall system at a user-selectable reference plane in terms of amplitude, phase and propagation time.
    FIGURE 2b. A four-channel GNSS test system consisting of two R&S SMW200A vector signal generators and an R&S SMA100B analog signal generator for the LO signal (left). The vector network analyzer is used to calibrate the overall system at a user-selectable reference plane in terms of amplitude, phase and propagation time.

    Test System Requirements

    Rohde & Schwarz offers a test system for GNSS receivers that use CRPAs. First, it acts as a multichannel GNSS simulator that considers all aspects of a satellite navigation system. It must be able to generate the signals of all standard satellite navigation systems in all GNSS frequency bands, with attention to correct satellite orbits, signal propagation characteristics and realistic modeling of the dynamically changing receive environment. Configuration of the antenna array in terms of geometry and the receive characteristics of the individual antennas also must be included.

    Simulating the Interference Signals

    Second, the system can simultaneously generate jamming or spoofing signals in order to test the interference suppression functions of the device under test (DUT). A second, identical test system is necessary for freely definable configuration of interference sources with very high transmit power. Here the R&S Pulse Sequencer software assists in the definition of complex interference scenarios. The scenarios cover requirements such as long simulation times, moving interference sources and GNSS receivers, user-defined antenna patterns and antenna scans. In addition, the software calculates the correct amplitude, phase angle and propagation time of the signals as a function of signal frequency, antenna arrangement, and the positions of transmitters and receivers in three-dimensional space for each individual antenna element. Signal generation is handled by the R&S SMW200A high-end vector signal generator.

    For the tests, the required GNSS signal as well as the unwanted interference signals must be generated for each antenna input of the GNSS receiver. In order to test a CRPA receiver with four antenna inputs, this means that four signal sources are needed to generate the GNSS signals and an additional four signal sources are needed to generate the interference signals. Fig. 2 shows a pair of test systems that can be used to generate coupled GNSS signals and interference signals for a four-channel CRPA receiver.

    Calibration Against the DUT

    In order to correctly simulate the directions of the satellite signals and the interference signals, the test systems must be calibrated at the RF interface to the DUT with regard to amplitude, phase and propagation time. This means that the amplitude, phase and propagation time differences between the individual RF paths, resulting for example from cables or RF components, must be compensated. The vector signal generators of each system are phase coherently linked using suitable synchronization. A high-end R&S SMA100B analog signal generator in each system provides the shared LO signal.

    Using the R&S RF Ports alignment software, the complete system can be calibrated at any desired reference plane with regard to amplitude, phase and propagation time, so that the properties of the test system do not corrupt the simulated signal differences between the individual antennas. The required measurements are performed with a vector network analyzer.

    It is not necessary to calibrate the two test systems relative to each other. For the simulation of realistic scenarios, it is sufficient to run the GNSS and interference source simulations at the same time, since in the real world there is usually no correlation between GNSS satellites and interference sources.

    FIGURE 3. Aircraft with a multichannel radar warning system consisting of multiple receive channels, a central processing unit and a display.
    FIGURE 3. Aircraft with a multichannel radar warning system consisting of multiple receive channels, a central processing unit and a display.

    Integration in an HIL Environment

    The GNSS test system also can be embedded in a hardware-in-the-loop (HIL) environment. In this case a computer streams the motion profile of the GNSS receiver under test, with position, speed, acceleration and vehicle attitude, to the test system at a high data rate. The test system then generates the corresponding satellite navigation signal in real time. This requires very high update rates and low latencies.

    Summary

    Multichannel GNSS CRPA receivers considerably improve the navigation of ground vehicles and aircraft of all kinds. With the new Rohde & Schwarz test system, realistic multi-channel test signals can be generated for both GNSS simulation and interference simulation. For tests in an HIL environment, motion data also can be streamed to the GNSS test system.

  • Innovation: A terrestrial networked positioning system

    Innovation: A terrestrial networked positioning system

    Better Performance Combining Fiber Optics and Wideband Radio

    Innovation Insights with Richard Langley
    Innovation Insights with Richard Langley

    “OH DEAR! OH DEAR! I SHALL BE LATE!” That’s what the White Rabbit said in the opening chapter of Lewis Carroll’s Alice’s Adventures in Wonderland just before checking the time on its pocket watch. Scientists at the European Organization for Nuclear Research (known by its French acronym CERN) named their project to develop an Ethernet-based network for general purpose data transfer and sub-nanosecond accuracy time transfer after the time-conscious rabbit. CERN’s White Rabbit (WR) can provide sub-nanosecond accuracy to synchronize more than 1,000 nodes via optical fiber or copper connections of up to 100s of kilometers in length. It is a flexible system with a scalable and modular infrastructure with a simple configuration and low maintenance requirements. It is also open source.

    WR uses the IEEE 1588 Precision Time Protocol (PTP) to establish precise phase differences between a master reference clock and a local clock. A two-way exchange of PTP synchronization messages allows precise adjustment of clock phase and offset.

    So, what has this got to do with GPS or more generally GNSS? Well, for one thing, a WR-based system can serve as a back-up for GNSS time transfer or even replace GNSS. For example, a multi-hop WR link has been installed to connect financial trading locations in Chicago and New Jersey over an approximately 1,350-kilometer distance. Stock markets and other financial institutions need to time-tag transactions with traceable synchronization to a high-accuracy time standard to the microsecond level or better and a WR link can easily provide that.

    Another application of WR is in terrestrial positioning. As we know, one of the problems with GNSS positioning is its poorer performance in built-up areas compared to open ones due to blocked signals and multipath. Multipath signals from close-by reflectors can be particularly pernicious as they reduce pseudorange measurement accuracy and thereby increase position error. And another potential weakness of GNSS is its susceptibility to radio-frequency interference, jamming and spoofing. A positioning system using synchronized roadside radio transmitters could be a viable alternative to GNSS in urban areas. A team of researchers based in The Netherlands has developed just such a system. In this month’s column, they describe their system, which uses WR to synchronize the transmissions of wideband radio ranging signals, and how they are able to achieve decimeter-level position accuracy in multipath environments.


    By Cherif Diouf, Han Dun, Gerard Janssen, Erik Dierikx, Jeroen Koelemeij and Christian Tiberius

    GPS is undoubtedly the most popular system providing positioning, navigation and timing (PNT) services to a host of applications, industries and infrastructures. GPS is mass-adopted, has worldwide coverage, has an impressive up-time and can be used with a wide range of receiver devices, featuring low to high cost and low to high precision.

    Despite its strengths, the system also has some weaknesses. For instance, the positioning performance provided by GPS in dense multipath environments, such as in urban canyons, is poor. This is due to the interaction between the desired line-of-sight (LOS) component and close-in multipath components of the GPS signal reflected or scattered by built-up surroundings. Moreover, GPS signals, due to their low received power levels, are fairly vulnerable to unintentional and intentional threats such as radio-frequency interference, jamming and spoofing.

    Alternative solutions that may complement or back up GPS, and more generally any other GNSS, to achieve reliable PNT for critical services and infrastructure, such as first responders, telecommunication and power systems, are urgently sought after. Wide coverage area synchronization using White Rabbit optical fiber networks allows simultaneous Ethernet networking and dissemination of 100 picosecond-level accurate time and frequency signals over distances of hundreds of kilometers. Accurate time synchronization may be provided to large areas such as big cities through this technology.

    Building on such an accurate system, we present a concept and demonstration of an innovative hybrid optical-wireless terrestrial networked positioning system (TNPS). The TNPS demonstrator uses a White Rabbit infrastructure to accurately synchronize the transmissions of wideband radio positioning signals by its ground-based transmitters (pseudolites) and achieves decimeter-level positioning accuracy in an urban road-like configuration.

    SCALABLE FIBER NETWORK DISTRIBUTION

    Initially developed for the Large Hadron Collider at the European Organization for Nuclear Research (CERN), White Rabbit (WR) is an accurate and scalable fiber-optic time and frequency transfer method that allows for dissemination of time references at sub-nanosecond level over distances of hundreds of kilometers. A typical WR network layout is shown in FIGURE 1.

    FIGURE 1. Simplified topology of a White Rabbit (WR) network for optical time and frequency distribution. The yellow lines represent fiber-optic connections and the blue lines are electrical connections.
    FIGURE 1. Simplified topology of a White Rabbit (WR) network for optical time and frequency distribution. The yellow lines represent fiber-optic connections and the blue lines are electrical connections.

    A central atomic clock provides synchronization references to a principal WR master switch dubbed the “grandmaster.” The grandmaster feeds synchronization signals into the network. which is expanded via fiber-connected WR devices: the switches and nodes of the network. These devices are serially linked to each other following a hierarchical master-slave pair configuration.

    Accurate synchronization between a master and a slave WR-pair is performed as follows. The pair, which is connected via a bidirectional 1.25 gigabits per second optical Ethernet data link, quasi-continuously measures the round-trip delay of the data signals exchanged between the two devices. From these round-trip measurements, the one-way propagation delay, assumed symmetrical, is derived and compensated by the WR devices through an electronic control loop. To take into account possible asymmetries within a link, a calibration procedure is needed when initially installing the connection between a master and a slave. In practice, within smaller scale networks, the synchronization offset accuracy between devices is at the 100 picosecond-level. A 400-picosecond offset between WR devices has even been demonstrated over a distance of 169 kilometers, and more recently over a distance of 800 kilometers.

    Besides the fiber-optic connection with other elements of the WR network, each switch or node can share its time-frequency references to an external device or system. These time-frequency references are available either in the form of IEEE 1588 Precision Time Protocol time stamps (via Ethernet connection), or in the form of electrical 1 pulse per second / 10 MHz synchronization signals (via coaxial cables).

    THE CONCEPT

    Centimeter- or even decimeter-level positioning accuracy is challenging to achieve using GNSS. In dense multipath environments, such as in urban canyons or indoor locations, the accuracy provided by GNSS is poor compared to the meter-level accuracy achievable in open terrain with the Standard Positioning Service. Moreover, GNSS services are vulnerable to interference, spoofing and jamming, and may be denied in indoor areas. We propose a TNPS based on a WR synchronization infrastructure as a complement to GNSS, providing higher timing and positioning accuracy, which also works in challenging environments.

    TNPS can achieve decimeter-level accuracy in challenging environments through the use of wideband radio positioning signals. The attainable ranging precision is inversely proportional to the signal bandwidth. Furthermore, in dense multipath environments such as urban canyons, using wider bandwidth signals allows for finer time resolution. As a consequence, close-in received multipath components (MPCs) can be better resolved, and the LOS component can be more easily discriminated from delayed MPCs. This results in more accurate position solutions.

    TNPS DEMONSTRATOR

    We performed a demonstration of the concept in Delft, The Netherlands, at The Green Village (TGV), an experimental facility on the campus of the Delft University of Technology. The facility aims to accelerate development and implementation of innovations for a sustainable future (see FIGURE 2).

    FIGURE 2. Implementation of the TNPS demonstrator. The time-frequency reference is provided by VSL and forwarded to TU Delft via optical fiber (in yellow) and distributed through the optical WR synchronization infrastructure. Wireless radio transmitters (green squares) connected to the WR network deliver wideband ranging signals to perform terrestrial positioning and navigation.
    FIGURE 2. Implementation of the TNPS demonstrator. The time-frequency reference is provided by VSL and forwarded to TU Delft via optical fiber (in yellow) and distributed through the optical WR synchronization infrastructure. Wireless radio transmitters (green squares) connected to the WR network deliver wideband ranging signals to perform terrestrial positioning and navigation.

    The central synchronization reference of the TNPS demonstrator is the Dutch national timescale version of Coordinated Universal Time UTC(VSL), derived from atomic clocks at the Van Swinden Laboratory (VSL), the Dutch metrology institute. The UTC(VSL) 10 MHz frequency reference and 1 pulse per second time reference are fed to the WR grandmaster switch (WR-SW1). The grandmaster switch is subsequently connected to a distant WR switch (WR-SW2) through a 1,470-nanometer downstream and a 1,490-nanometer upstream 1.25 gigabit per second optical link. WR-SW2, located at one of the TU Delft data centers, synchronizes in turn a WR node (WR-N1) installed at TGV.

    The remaining TNPS nodes at TGV are synchronized through a daisy-chain configuration. The first node (WR-N1) is connected to a second one (WR-N2), which is then connected to a third (WR-N3) and so on. In total, five timing nodes, WR-N1 to WR-N5, are connected to one another, using 50-meter optical fibers. These 5 timing nodes are used for synchronization (see FIGURE 3), and provide 1 pulse per second and 10 MHz electrical signals to five wideband radio transmitting units, uTX-1 to uTX-5, installed along a 50-meter stretch of road at TGV.

    FIGURE 3. WR timing node (top) fed by a 1.25 gigabit per second bitstream through an optical fiber (yellow cable to the right) and providing electrical 1 pulse per second and 10 MHz synchronization signals at the outputs (two cables to the left). The bottom image shows an SDR system. The two channels of this device, capable of wideband operation, act here as a wireless transmitter or as a receiver. The transmitters are synchronized to the WR network through the 1 pulse per second and the 10 MHz electrical signals (blue-yellow cables at bottom) provided by the WR timing node.
    FIGURE 3. WR timing node (top) fed by a 1.25 gigabit per second bitstream through an optical fiber (yellow cable to the right) and providing electrical 1 pulse per second and 10 MHz synchronization signals at the outputs (two cables to the left). The bottom image shows an SDR system. The two channels of this device, capable of wideband operation, act here as a wireless transmitter or as a receiver. The transmitters are synchronized to the WR network through the 1 pulse per second and the 10 MHz electrical signals (blue-yellow cables at bottom) provided by the WR timing node.

    A transmitting unit is based on a wideband transceiver: a software-defined radio (SDR) system linked to a wideband antenna that can operate from 700 MHz to 6 GHz. The antennas are connected to the SDRs using coaxial cables with a length of 5 meters and mounted on lampposts along the road at a height of about 4 meters. The transmitting units, uTX-1 to uTX-5, are respectively associated with antennas TX-1 to TX-5.

    Each of these SDRs is capable of transmitting a wireless signal of up to 160 MHz bandwidth, on one or two of the device transmitter channels. The central frequency of each channel is tunable from 10 MHz to 6 GHz. In the demonstrator, we used a 3.96 GHz carrier frequency. The transmitting units periodically stream 160 MHz wideband quadrature phase-shift keying (QPSK) modulated pseudorandom noise (PRN) ranging signals sampled at 200 MHz. The five transmitters operate according to a time-division-multiplexing (TDM) scheme; uTX-1 to uTX-5 successively transmit the QPSK-modulated sequences as a 27.5-microsecond “burst” before turning idle. Between two successive transmissions, a guard interval of 3 microseconds is inserted during which all transmitting units are in idle state. It takes in total 150 microseconds for the five units to complete a transmission round, after which the units remain idle. The transmission round is then retriggered each millisecond.

    At the receiver side (RX), another SDR platform is configured to acquire the QPSK modulated bursts transmitted by the five units uTX-1 to uTX-5. This SDR is actually playing the role of a data acquisition platform, which records and forwards the incoming sampled ranging sequences to the host PC via an Ethernet link. All processing and analysis in the demonstrator is performed offline, rather than in real time, using the collected ranging signals. The sampling rate of the acquisition platform is 200 MHz. A sample consists of a 16-bit in-phase value and a 16-bit quadrature-phase value (4 bytes in memory). In continuous operation, the SDR acquisition throughput would amount to 800 megabytes per second.

    A throughput of 800 megabytes per second is difficult to handle for most of the host PCs. The SDR is therefore configured to only forward the relevant part of the data collected. Only the received samples time-aligned with the 150-microsecond transmitting window are periodically transferred to the host PC at a rate of 1 kHz. In practice, the acquisition window is slightly extended to 160 microseconds. Overall, the data throughput between the SDR and the host PC is now reduced to 128 megabytes per second; that is, 10 seconds of acquisition will generate a data file of 1.28 gigabytes.

    A Schmidl & Cox synchronization sequence is embedded in the signal transmitted by uTX-1. The SDR field-programmable gate array continuously performs autocorrelation on the incoming samples and uses this sequence to detect the arrival time of the ranging bursts for operation in asynchronous mode. The receiver also can be operated in synchronous mode, that is, synchronized to a timing node.

    TEST SETUP

    We carried out experiments on a 50-meter-long and 6-meter-wide local road at The Green Village (see FIGURE 4).

    FIGURE 4. Test road at The Green Village, with three of the five roadside transmitting antennas (TX-3 to TX-5) as indicated. In the foreground, the receiver antenna is mounted on a trolley.
    FIGURE 4. Test road at The Green Village, with three of the five roadside transmitting antennas (TX-3 to TX-5) as indicated. In the foreground, the receiver antenna is mounted on a trolley.

    The road is bordered by built-up objects such as brick-wall houses, metal containers and large wooden advertising panels. These generate MPCs, which degrade the radio-positioning performance. The antennas TX-3, TX-4 and TX-5 can be seen mounted on lampposts. In Figure 4, the antennas TX-1 and TX-2 are on the right-hand sidewalk but not visible. The receiving antenna is in front to the left, mounted on a trolley. The RX antenna is identical to the ones used by the transmitters.

    The receiver is used to perform a static survey at 50 locations on the road (staying at each point for around 1 minute). As shown in FIGURE 5, the receiver was also used for a kinematic experiment. The RX antenna is mounted on the roof of a car using a wooden beam. The RX antenna is linked via a 3-meter coaxial cable to the receiving SDR placed inside the car and connected to a host PC.

    FIGURE 5 Receiver antenna mounted on the roof of a car. Two 360° prisms are used to determine the receiver ground-truth positions at the millimeter level, by means of land surveying total stations (placed on the yellow tripods in the distance).
    FIGURE 5. Receiver antenna mounted on the roof of a car. Two 360° prisms are used to determine the receiver ground-truth positions at the millimeter level, by means of land surveying total stations (placed on the yellow tripods in the distance).

    FIGURE 6 presents a map of the road with the static locations (in blue) and the forth-and-back kinematic track (in red). The transmitting antenna positions are indicated at both sides of the road.

    FIGURE 6. Set-up of the experiment on the local road at TGV. The locations of the transmit antennas, TX-1 to TX-5, are shown. Locations of static surveyed points are in blue, and the track of the kinematic experiment in red, with the RX antenna mounted on the roof of a car.
    FIGURE 6. Setup of the experiment on the local road at TGV. The locations of the transmit antennas, TX-1 to TX-5, are shown. Locations of static surveyed points are in blue, and the track of the kinematic experiment in red, with the RX antenna mounted on the roof of a car.

    To establish a local coordinate system, the ground-truth positions of the RX antenna are determined using two land surveying total stations that rely on retro-reflective targets and 360° prisms to measure distances and angles. In Figure 4, a retro-reflective target, placed directly under the RX antenna, is visible, while the two total stations can be seen halfway down the road on the righthand side. In Figure 5, 360° prisms can be seen on both ends of the wooden beam on the roof of the car. The received signals are used to compute position solutions in post-processing, which are compared to the ground-truth values to assess the positioning accuracy. The accuracy of the ground-truth measurements is at the millimeter-level.

    EXPERIMENTAL RESULTS

    Achieving high positioning accuracy in a built-up area is difficult due to the presence of close-in MPCs, which arrive with very short time delays following the LOS component. FIGURE 7 shows the observed channel impulse responses (CIRs) between TX-1, TX-3, TX-5 and the receiver antenna RX placed at location 7 (see Figure 6). The LOS components can be easily detected as they correspond to the first and highest peak of each curve. However, we can also observe substantial close-in multipath components, which trail the main peaks. CIRs are obtained by division, in the frequency domain of the fast Fourier transform (FFT) of the received ranging sequences using the FFT of the known transmitted sequence. Oversampling by a factor of 100 is applied, as well as removing time delays of the TDM-scheme, such that the observed time delay difference directly represents the differences in ranges.

    FIGURE 7. Normalized magnitude of the CIRs observed between the transmit antennas TX-1, TX-3 and TX-5 and the receiver antenna RX, positioned at reference point 7. 
    FIGURE 7. Normalized magnitude of the CIRs observed between the transmit antennas TX-1, TX-3 and TX-5 and the receiver antenna RX, positioned at reference point 7.
    FIGURE 8. Time series of the positioning error in the east and north directions during the kinematic experiment.
    FIGURE 8. Time series of the positioning error in the east and north directions during the kinematic experiment.

    Since the TNPS signal bandwidth is 160 MHz, the time resolution is about 6.25 nanoseconds, which corresponds to about 1.9 meters of propagation distance. A multipath component, which arrives at the RX antenna with a lag larger than 6.25 nanoseconds with respect to the LOS component, is likely to be resolved and will not affect (bias) the ranging result. In this case, using time-of-flight techniques, ranges between TX and RX antennas can be determined, often at decimeter level, by extracting the time-of-arrival of the LOS components. Comparatively, if a 20 megasamples per second rate is used (corresponding to a 20 MHz bandwidth, commonly used in GNSS), the time resolution is 50 nanoseconds. An LOS component and a multipath component arriving at the RX antenna can likely be discriminated if the receiver and the reflector are separated by at least 15 meters. If the arrival time between the two components is less than 50 nanoseconds, then the MPC cannot be resolved and will cause a bias when determining the propagation distance between the TX and RX antenna.

    The first and largest peak of each CIR seen in FIGURE 7 represents the LOS component. MPCs can be seen trailing the LOS, typically within the next 50 nanoseconds. The MPCs cause a bias in the estimated range when they cannot be resolved. Using wideband ranging signals allows for better time resolution, and better discrimination between the LOS component and the MPCs.

    In the following, we assess the 2D positioning accuracy obtained using the demonstrator. 3D positioning is also possible with the demonstrator; however, since the TX antennas all are installed at similar heights and at a fairly low elevation compared to the RX antenna, we restrict our analysis to 2D positioning for the reason of having a poor geometry for determining the vertical position component. The 2D positioning model uses time difference of arrival (TDOA) pseudoranges allowing the cancellation of the asynchronous receiver clock offset. The frequency offset between the transmitters and the receiver has been estimated to be about 1 kHz, in asynchronous mode. After the TDOA ranges are computed from the experimental data, the 2D positioning problem is solved through Gauss-Newton iteration. Statistics of the static and kinematic 2D experiments are presented in TABLE 1.

    TABLE 1. Static and kinematic positioning performance in terms of mean, standard deviation (std) and RMSE of position error, in east and north directions.
    TABLE 1. Static and kinematic positioning performance in terms of mean, standard deviation (std) and RMSE of position error, in east and north directions.

    In the table, we present the mean position errors, standard deviations and root-mean-square errors (RMSEs) over the 50 surveyed points for the east and north directions. Mean errors of 6.4 and 4.3 centimeters are obtained for east and north directions, respectively. There is no significant bias in the system. In terms of RMSE, we can see that the positioning accuracy is just above 10 centimeters (11.6 and 15 centimeters respectively for the east and north directions). Overall, even with the presence of MPCs, and thanks to the synchronization accuracy and the wideband radio signals, a decimeter-level accuracy is achieved in static positioning.

    The duration of the kinematic experiment was 84 seconds. Looking at the statistics of the kinematic experiment, the results for the east and north directions show a small bias and RMSE values of 9.2 and 16.4 centimeters respectively. The positioning performance in static and kinematic mode is close, both for the east and north components. In both cases, positioning performance is better in the east direction than in the north direction. This may be explained by better spatial diversity of the antennas towards the east direction. The time series of the position errors for the kinematic experiment is presented in FIGURE 8. Overall, the track error in the eastern direction is within ±2 decimeters (at a 95% confidence level). For the northern direction, a larger deviation is observed in the observation time span from 40 to 50 seconds (forward track), where the error in the north direction is close to 4 decimeters. Such a deviation is likely due to close-in MPCs resulting in a degradation of the accuracy for that part of the track. As a consequence, 82% of the position error in this track lies within ±2 decimeters. Outside this time span, the performance in east and north directions is similar.

    CONCLUSIONS

    This article presents the concept and results of a demonstration of a TNPS that uses WR to synchronize the transmissions of wideband radio ranging signals to achieve decimeter-level position accuracy in multipath environments, such as in built-up areas. A proof of concept of the TNPS was implemented at TU Delft. The developed prototype system demonstrates a decimeter-level 2D positioning accuracy in an urban road-like configuration bordered by built-up surroundings that cause substantial multipath.

    ACKNOWLEDGMENTS

    The research described in this article is supported by the Dutch Research Council, Nederlandse Organisatie voor Wetenschappelijk Onderzoek. We thank Lolke Boonstra and Terence Theijn from TU-Delft ICT-FM, as well as Rob Smets of SURF, the collaborative organization for ICT for Dutch education and research for their support and expertise on the optical infrastructure, and Loek Colussi and Frank van Osselen of Agentschap Telecom and René Tamboer and Tim Jonathan of The Green Village for their support in realizing the SuperGPS demonstrator. We also thank project partners Koninklijke PTT Nederland (KPN), Optical Positioning Navigation and Timing (OPNT) and Fugro.

    MANUFACTURERS

    The WR timing nodes V1.15 are by OPNT. The SDR systems for the transmitters and receiver are National Instruments (Ettus) X310 Universal Software Radio Peripherals. The 3-dBi wide-band antennas CM.02.03 are from Taoglas.


    CHERIF DIOUF was a postdoctoral researcher in the Department of Geoscience and Remote Sensing at Delft University of Technology (TU Delft).

    HAN DUN was a Ph.D. student in the Department of Geoscience and Remote Sensing at TU Delft.

    GERARD JANSSEN is an associate professor in the Circuits and Systems Group of the Microelectronics Department at TU Delft.

    ERIK DIERIKX is the principal scientist at Electricity & Time at the national metrology institute VSL in Delft.

    JEROEN KOELEMEIJ is an assistant professor in the Department of Physics and Astronomy at the Vrije Universiteit Amsterdam.

    CHRISTIAN TIBERIUS is an associate professor in the Department of Geoscience and Remote Sensing at TU Delft.