Category: Research & Development

  • Faux signals for real results: Spirent Communications / Spirent Federal Systems

    Faux signals for real results: Spirent Communications / Spirent Federal Systems

    An exclusive interview with Mark Holbrow, VP of Product Development, Spirent Communications and Roger Hart, Sr. Director of Engineering, Spirent Federal Systems. For more exclusive interviews from this cover story, click here.


    What are your roles?

    MH: Our business is based in the UK. I am responsible for the vision and direction of the Technology portfolio required by Spirent’s Positioning Technology business unit.

    RH: I am responsible for the U.S. add-on components to the simulator, the restricted signals, and support for the U.S. government labs and contractors.

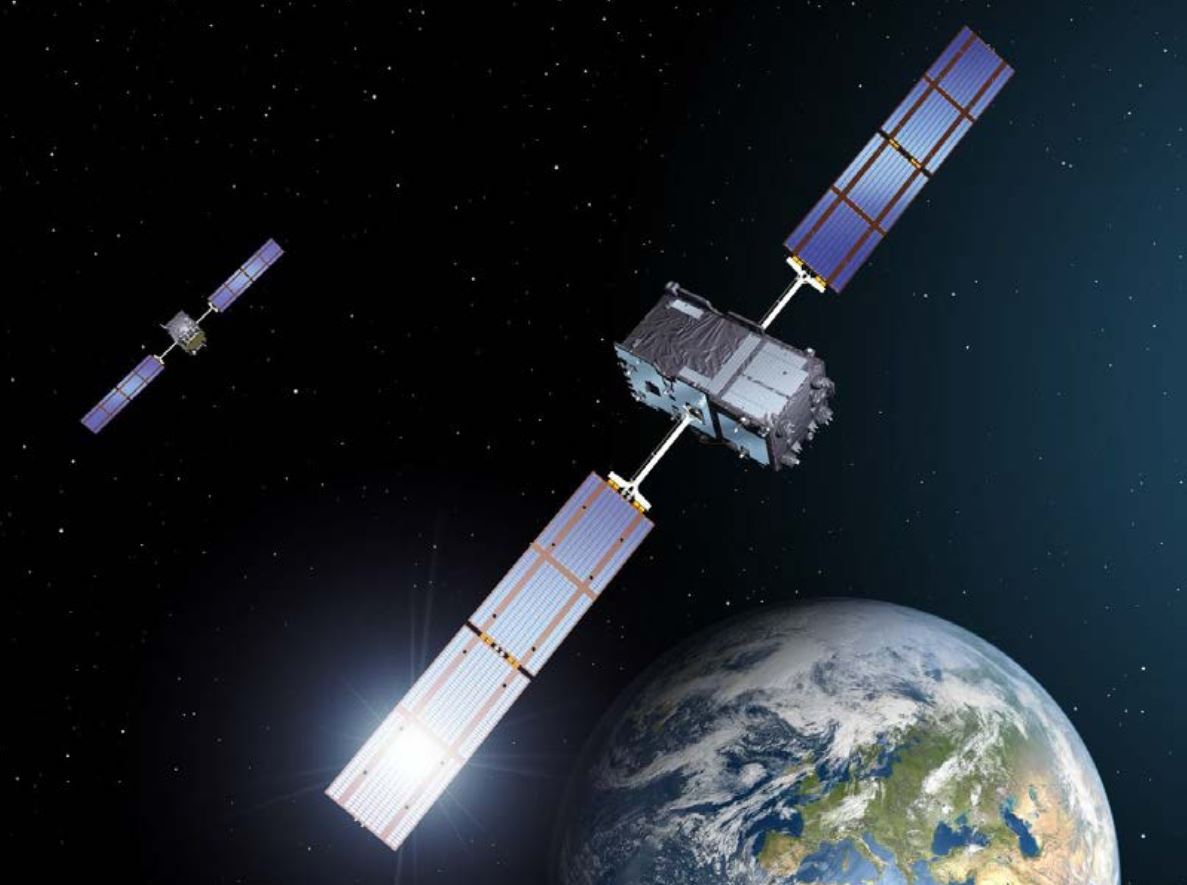
    How have the need for simulation or the requirements for it changed in the past five years, with the completion of the BeiDou and Galileo GNSS constellations, the rise in jamming and spoofing threats, the sharp increase in corrections services, and the advent of new LEO-based PNT services?

    MH: I would say that the need for thorough and comprehensive testing has never been greater. That need is being driven on multiple fronts due to the understandable pressure on PNT systems needing to deliver enhanced accuracy, reliability and resilience, in the presence of emerging threat vectors and an expanding application space that’s utilizing ever more complex combinations of new and enhanced signals and sensors of opportunity. Underpinning Spirent’s leadership in ensuring the test needs for this evolving, challenging and increasingly diverse market are its team, its technology and its partners. That team is well-established, dedicated and highly experienced — their sole focus is designing, manufacturing and supporting PNT test solutions. The technology focuses around our pioneering dedicated SDR hardware platform and software simulation engine, which allied provide performance, scalability and flexibility, within an open accessible architecture. In addition, close collaboration with our selected partners ensures the opportunity to support and integrate new and emerging PNT technologies through their tools, applications and hardware.

    You mention the advent of LEO. A key reason why Spirent was first to market and successfully supported an early LEO + GNSS receiver test-bed (through close and collaboration with Xona and NovAtel) was driven by team, technology and partners.

    Two other important areas that have definitely continued to grow and evolve in importance and priority have to be increased realism and test automation. Both are areas in which Spirent continues to prioritize and invest R&D dollars.

    Spirent’s integrated, software-defined wavefront simulation system for a 5-element controlled reception pattern antenna (CRPA). Spirent solutions support 16+ antenna elements. (Image: Spirent)
    Spirent’s integrated, software-defined wavefront simulation system for a 5-element controlled reception pattern antenna (CRPA). Spirent solutions support 16+ antenna elements. (Image: Spirent)

    With all these additional signals, is it still a single simulator or do you have to somehow split it up into different modules?

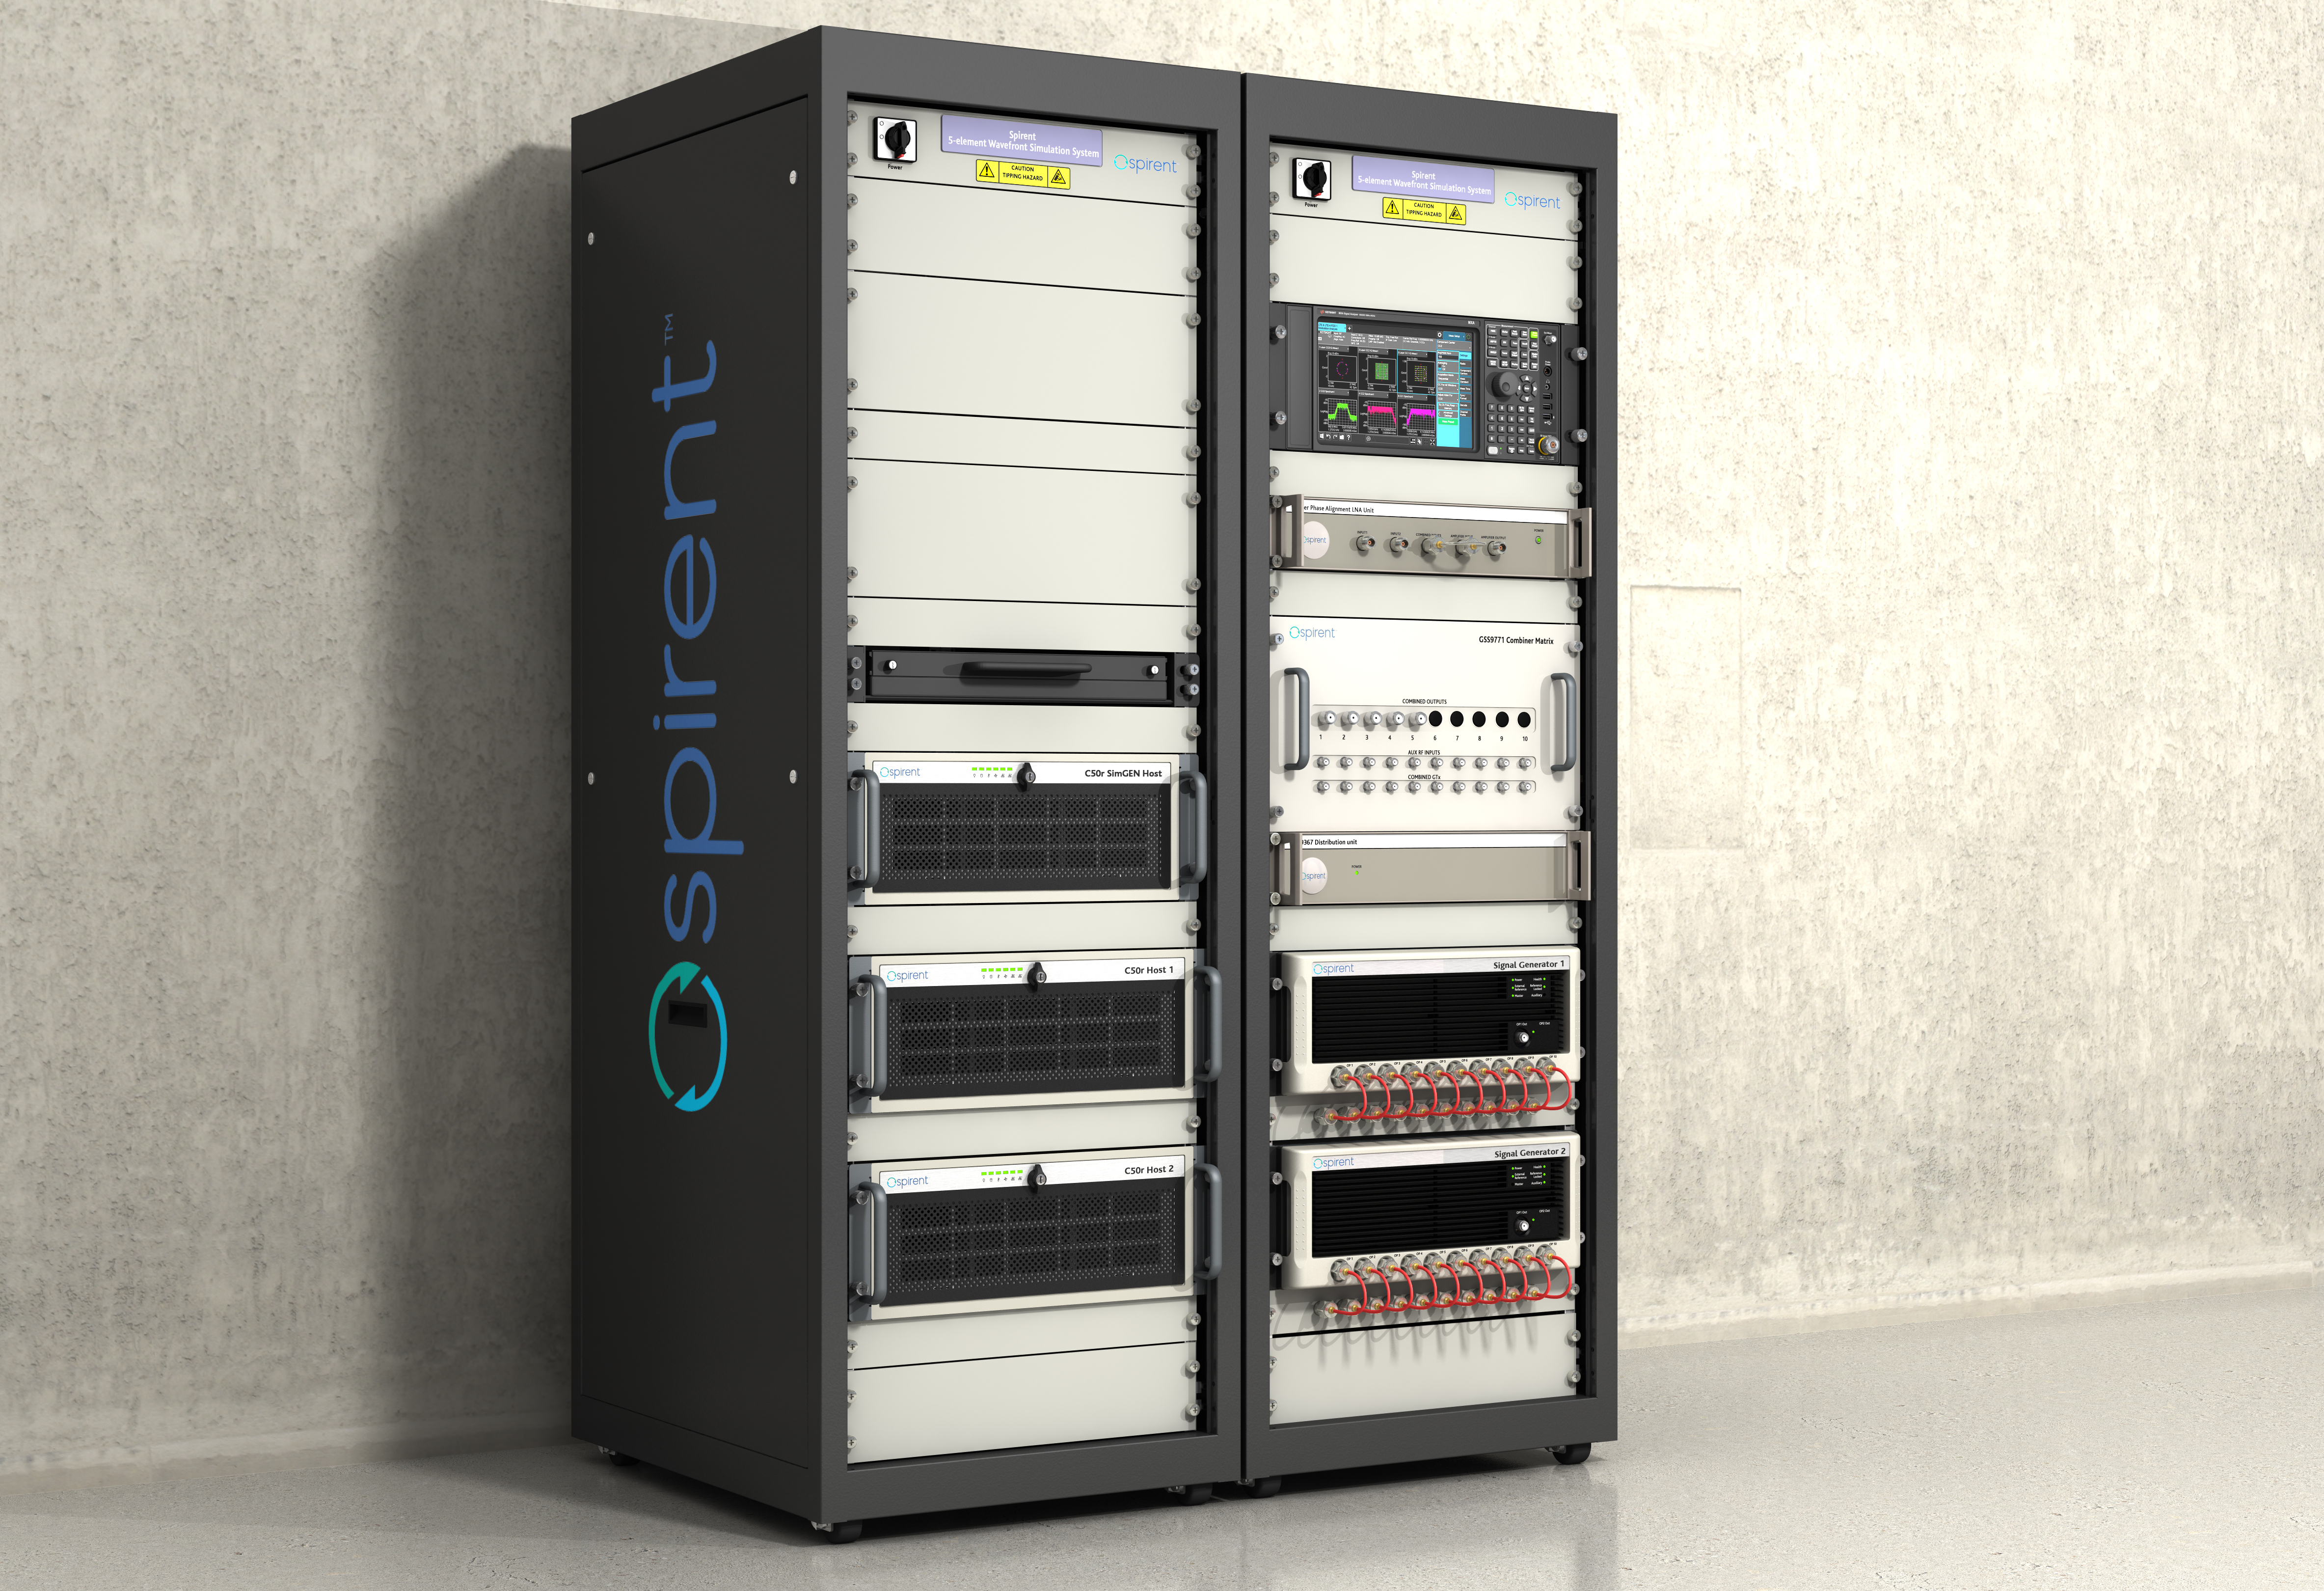
    MH: Good point. Again, a key element with the Spirent solution is that it is very scaleabale and flexible. Spirent has a generic SDR that can be re-purposed to simulate whatever signals are required. That way, we can compile different signals from either one radio or multiple radios coming from the same system. Together with being able to bring in multiple chassis to gradually grow the simulation solution, while also maintaining for each of those signals the fidelity, channel count, and accuracy that customers demand.

    Including every signal currently available?

    MH: Absolutely, sir. In fact, signals that are still on the drawing board as well. We can enable the user with effectively an arbitrary waveform simulator or ‘sandbox’ to experiment with different modulation schemes, different chipping rates, codes, bandwidths and navigation data content. So, in addition to using that architecture to generate the signals, we allow customers to experiment with it themselves. That’s certainly accelerated over these last five years, and there’s no sign of it stopping. We’re currently working with customers and partners all over the globe who are developing both brand new and emerging PNT systems, whilst also providing all the vital simulation tools to aid the R&D of existing and planned SIS evolutions.

    RH: The increasing number of signals that we can support multiplies the permutations and combinations of test cases that users can do. There is a lot of emphasis also on the user interface side of things, so that from one interface you can also easily control all these interfaces with third-party tools, because proliferation of signals produces a huge possible test volume.

    What are the specific challenges in realistically simulating new LEO-based signals and any new services being developed for which you don’t have any live sky signals to record yet, only ICDs and other documents?

    MH: Again, great question. The key reason Spirent excels in this arena is that the core simulation engine and SDR are agnostic of the constellation and signal type that’s being generated. So, the underlying principles of accuracy, range rate, pseudo-range control, and delay, together with the RF fidelity from Spirent’s SDR+ Sim engine, can be readily manipulated to simulate the wealth of emerging signals, including LEO.

    The other area that becomes very important is that if we do not have sight of the ICD, we can enable customers to use our tools to readily populate elements of that ICD themselves. That way, the best of both worlds is achieved, i.e. a turnkey SIS solution, or we can just enable the customer to do it themselves.

    Are accuracy requirements or any other requirements for simulation increasing to enable emerging applications?

    MH: They are. Both current and emerging test needs are continuing to drive the need for enhanced simulation realism. Always a tough nut to crack, but our hard-won experience and expertise, allied with continuing adoption of latest-generation technology, is allowing us to take some significant strides forward. Real-world testing has an incredibly important role to play and that’s why at Spirent we continue to invest in and develop the GSS6450 Record & Playback System (RPS). However, we are also on that quest for the ‘Holy Grail’ that has all the well understood and necessary advantages of lab-based testing but with the simulation environment being as true to the real world as possible.

    A German Armed Forces test center, WTD-61, recently used Spirent's new Field Simulator to conclusively demonstrate the susceptibility of some UAS to spoofing. (Image: Spirent)
    A German Armed Forces test center, WTD-61, recently used Spirent’s new Field Simulator to conclusively demonstrate the susceptibility of some UAS to spoofing. (Image: Spirent)

    A further area where both current and emerging test needs are demanding more and more from the test environment is resilience testing. Spirent now supports a multitude of vulnerability and corresponding mitigation/prevention test cases. Those test cases become increasingly complex as multiple combinations of the threat/mitigation surface evolve — including jamming, spoofing, cyber-attack and CRPA.

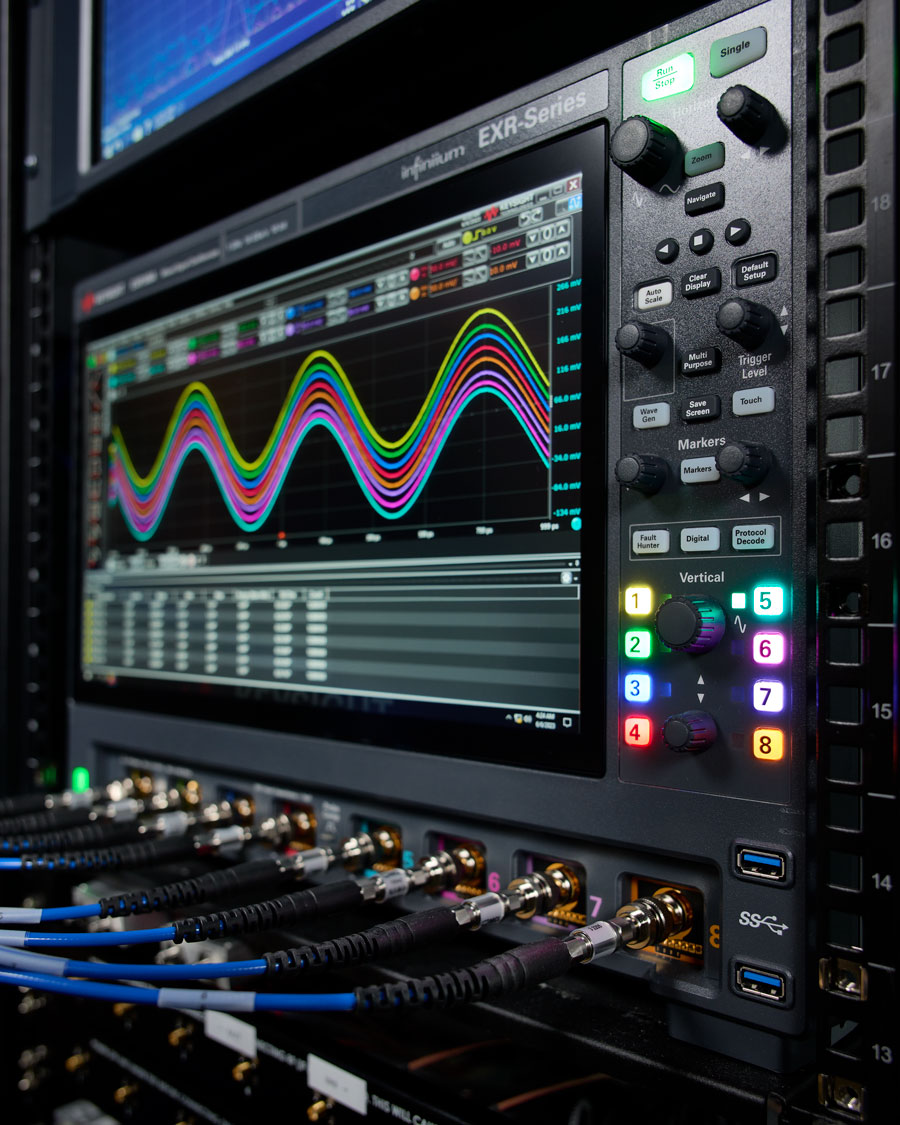
    Many of these test cases are driving the state of the art and, especially in the case of CRPA testing, Spirent’s purpose-designed SDR comes into its own. Technology bakeoffs and corresponding customer adoption have shown that only through the use of that dedicated purpose-built technology, the simulator test bed can deliver the necessary carrier and code phase stability, very low levels of uncorrelated noise across antenna elements and high J/S that is demanded.

    Again, with respect to flexibility, we also support ways to let customers generate their own IQ data. That data can be streamed into the Spirent simulator and combined sympathetically and coherently with the signals generated inside the platform. So, you can layer new signals on existing ones, or introduce a completely new dedicated IQ stream.Finally, hardware-in-the -loop (HIL) testing requirements continue to be a crucial aspect in test coverage. Whether that application is automotive, projectiles or autonomous vehicles, the need for lower latency and higher 6DOF sampling to capture as many trajectory nuances as possible continues to grow. Spirent’s 2KHz system achieves very high iteration rates (SIR) and <2msec latency.

    What are the key differences between your simulators for use in the lab and those for use in the field? I assume that the latter are lighter, smaller, and less power hungry. Do they use modules so that users can pick the ones they need for a particular test?

    MH: We do support in-the-field test use cases. Spirent has record-and-replay (RPS) systems to take soundings in a wide-band RF environment, record them, then bring them back into the lab for replay. They are sized to fit into a backpack, battery-powered, accessible, and easy to use.

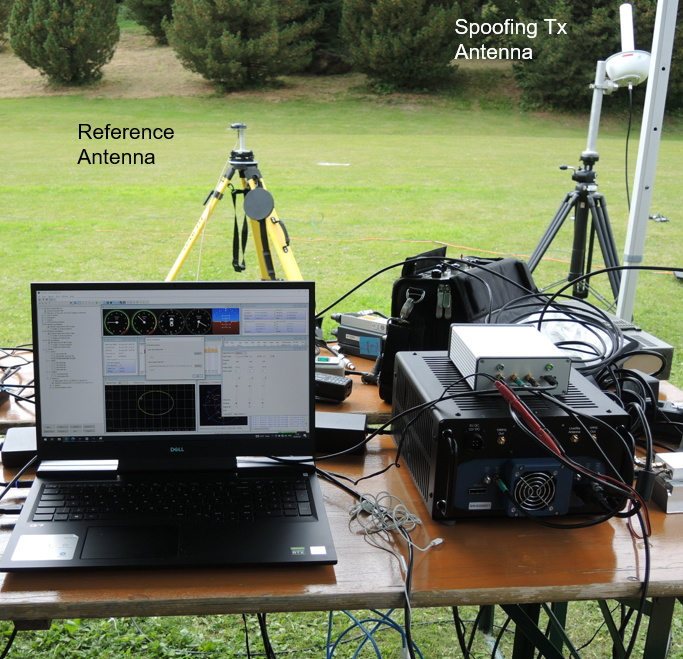
    Recently, we have also taken some of our signal generator IP and been able to create a smaller form factor portable simulator for outside use. Its footprint is considerably smaller than that of one of our lab-based simulators. It’s primarily a mechanism for testing the resilience in the field of devices under test. Armed with a Spirent simulator and the appropriate transmit licenses, a customer can put their DUT through an array of vulnerability test cases in a live real-world environment.

    You mentioned licenses. As far as jamming, specifically, and maybe spoofing, I presume that you’ll need a license for a specific time and place and that you will have to be far away from, say, an airport.

    Absolutely. Right. The details will vary depending on the jurisdiction, but you will need a license to transmit. And, as you rightly say, often those places will be very remote so as not to interfere with the public. We’ve had instances where we’ll work with a customer who has those appropriate licenses and then we can provide this equipment for them to be able to put it through a battery of tests.

    You generate the spoofing in your simulator, of course. Do you also generate the jamming inside the same box or from a separate jammer nearby?

    It could be either. We can use our simulators to generate internally wide range of interference signals supporting a wide bandwidth, high max o/p power and large dynamic range. This is especially important in instances of CRPA testing, in which it is vital to accurately reproducing a jamming wavefront commensurate with the arrival angle and delay incident at each antenna element. Correspondingly, we support turn-key solutions to connect, control and integrate 3rd party external signal generators into the test scenario.

    Are you at liberty to describe any recent success stories?

    We have a Xona simulator. So, this is back on the topic of LEO. We’ve recently released that in partnership with Xona. We are also working closely with Hexagon. All those things I mentioned earlier about enabling the customer to use the flexible features that we have, that is where it came into its own. That’s certainly a significant recent success.

    We’re continuing to add many realism-related capabilities, including simulating the vibration and temperature effects of inertial systems. Working with a Swiss partner called Space PNT, we’ve recently introduced another LEO-based product, called SimORBIT. That tool enables us to generate incredibly representative and accurate LEO orbits that also include gravitational effects based upon the SV size. We recently introduced a new software tool to support “GNSS Assurance” requirements.

    We have a newly patented cloud-based software application called GNSS Foresight that enables users to understand the GNSS coverage they would expect during a particular time, date location and trajectory inclusive of the 3D environment they would be experiencing. We continue to evolve the tool to support real-time operation to enable it to deliver aiding content to appropriately equipped systems.

    We continue to be able to support more and more automation. Automation has always been important, but with ever increasing demands of test asset utilization and in a post-pandemic world of remote working, it’s more important than ever right now. The number of test cases and corner cases required and the amount of equipment, coverage, and efficiency required, which was being demanded by using our kit means that automation is vital. So, we’ve introduced several new automation tools to build up on top of our current SimREMOTE interface.

    Spirent has also developed a simulation test solution for the Galileo Open Service Navigation Message Authentication (OSNMA) mechanism. SimOSNMA is designed to work with Spirent’s GNSS simulation platforms to test OSNMA signal conformance, which will bring new levels of robustness for both civilian and commercial GNSS uses. SimOSNMA provides developers with vital new simulation tools to test for OSNMA, the security protocol that enables GNSS receivers to verify the authenticity of signals distributed from the Galileo satellite constellation. Designed to combat spoofing, OSNMA ensures that the data received is authentic and has not been modified in any way. It is currently completing the test phase before its formal launch, and SimOSNMA enables developers to simulate and test OSNMA signals and features, allowing GNSS receiver manufacturers and application developers to accelerate and assure development programs.

  • Faux signals for real results: IFEN

    Faux signals for real results: IFEN

    An exclusive interview with Jürgen Pielmeier, managing director, IFEN. For more exclusive interviews from this cover story, click here.


    In which markets and/or applications do you specialize?

    IFEN is offering RF simulation solutions for all GNSS markets, except the defense market with encrypted signals. The major market in recent years was the ‘New Space’ market, mainly focused to design and test PNT navigation solutions as part of (primarily) LEO satellite constellations using existing GNSS systems. With the many new players around the world, there are many market opportunities. To be successful in this ‘New Space’ market requires simulation support of all GNSS systems and signals, modelling LEO dynamics and environment and providing multiple RF-outputs (enabling systems with several GNSS antennas located on the satellite). With our latest ‘NCS NOVA+’ RF simulator, support of up to 4 RF-antenna simulations is possible. From basic RF system up to integrated SIL and HIL systems, the level of required solutions is very diverse by the different applications. The IFEN RF simulator is also offering a full ‘radio occultation’ simulation capability specifically for this market.

    The second important market is the automotive/maritime PNT market requiring fully integrated HIL simulation solutions. Excellent integration capability into external environment simulation systems with a rich set of interfaces and short latencies are keys for this market. To further penetrate this market, IFEN will implement some major enhancements during this and next year within its RF simulator products.

    How has the need for simulation changed in the past five years, with the completion of the BeiDou and Galileo GNSS constellations, the rise in jamming and spoofing threats, the sharp increase in corrections services, and the advent of new LEO-based PNT services?

    Today, supporting all existing GNSS systems with all related signal components on all frequencies is a must have for all high-end RF simulators. Keeping the RF simulators up-to-date with the new and continuously evolving GNSS signals is required to be sustainably competitive. Specifically, beyond the L-band signals, we are also fully supporting the S-band signals of the NavIC constellation. The continuously increasing number of available GNSS satellites and signals requires that the RF simulator capabilities are fully scalable to provide sufficient resources to simulate all signal channels. Our new NCS NOVA+ simulator is our first RF simulator with strong scalability capabilities, to be further extended in the coming years.

    In recent years, adding support for the simulation of jamming and spoofing threats was a major driver for the market. Our latest RF simulator generation ‘NCS NOVA+’ is fully supporting all types of jamming and spoofing, fully integrated into our RF simulators to enable coherent signal generation. With the coming ‘DFMC’ (SBAS/GBAS dual-frequency multi-constellation) based safety-of-life and automated driving applications, the need to support advanced jamming and spoofing simulation solutions will be a continuous driver also for the future.

    Adding the ‘High Accuracy Service’ (HAS) PPP-correction capability on Galileo E6-B signal in our coming V2.9 release is driven by the increased request for PPP corrections services. We expect further improvements here in the coming years, especially to cover the emerging PPP-RTK market needs.

    With the coming age of LEO-PNT services, this is the most important driver for the next five years, extending the signal frequencies beyond the current L- and S-band signals, seeing new modulations, two-way transfer and many more topics. This will require strong development efforts on the RF simulator side, to provide suited RF test tools in time to LEO-PNT system designers and developers, but also the related user terminal developers. IFEN is currently preparing to take this next major step in its RF simulator capability portfolio.

    In particular, regarding some of the new PNT services being developed, how do you simulate them realistically without the benefit of recordings of live sky signals?

    Facing the lack of live sky signals when developing RF simulator capabilities is a continuous challenge. It requires to a certain signal simulation flexibility designed into the receiver, good and theoretical understanding of specific implications of new designed signals. As soon as real signals are then available, simulation and real signals will be compared and if required the simulation fidelity will be adjusted to meet the real signals.

    Are accuracy requirements for simulation increasing, to enable emerging applications?
    Concerning the core accuracy parameters requested in recent years, we saw no increase in required accuracy, as the typical requested accuracy are anyway far beyond the real signals accuracy.

    Are all your simulators for use in the lab or are some for use in the field? If the latter, for what applications and how do they differ from the ones in the lab? (For starters, I assume that they are smaller, lighter, and less power-hungry…)

    Currently all our simulators are designed for usage within the laboratory. However, we recognize an increased request for in-field capable RF simulators, specifically to perform spoofing of real SIS to test deployed GNSS receivers in the field. Offering a portable in-field solution is in the mid-term planning, but not a current driver for our developments.

    What are some of your recent successes?

    The most important recent success is the Galileo 2nd generation Test User Receiver contract from the European Space Agency. Within this contract, the ‘NCS NOVA+’ simulator as RF test tool will be upgraded to full G2G signal generation capability. The new already implemented G2G signals enabling shorter TTFF, improved acquisition performance but also higher updates rates (e.g. for PPP-RTK). Up to end of the year the G2G signal will be fully implemented in our RF simulator, including the next generation of advanced authentication solutions.

  • Faux signals for real results: Racelogic

    Faux signals for real results: Racelogic

    An exclusive interview with Julian Thomas, managing director, Racelogic. For more exclusive interviews from this cover story, click here.


    In which markets and/or applications do you specialize?

    We originally designed our LabSat simulator for ourselves, because we supply GPS equipment to the automotive market. Then, we decided to sell it into that market, which is our primary market, for other people to use. That’s where we started, but it has moved on since then. We supply many of the automotive companies who use it for testing their in-car GPS-based navigation systems.

    However, we’ve moved on to our second biggest market, which is the companies that make deployment systems for internet satellites, which use it for end-of-life testing. Several of our customers use it. That’s because we do space simulations, so we can simulate the orbits of satellites. That’s very useful when they’re developing their satellites.

    We supply many of the major GPS board manufacturers — such as NovAtel, Garmin, and Trimble — when they’re developing their boards and testing their devices. We supply many of the phone companies — such as Apple and Samsung — and many of the GPS chip manufacturers — such as Qualcomm, Broadcom, and Unicom. More or less any company that’s into GNSS.

    How has the need for simulation changed in the past five years, with the completion of the BeiDou and Galileo GNSS constellations, the rise in jamming and spoofing threats, the sharp increase in corrections services, and the advent of new LEO-based PNT services?

    It all started off very simple, with just GPS, which was one signal and one frequency. We got that up and working very well and it helped us a lot. Then we got into this market. In the last few years, we’ve had to suddenly invent 15 new signals. We do two systems, really: one is a record-and-replay system. You put a box in a car, on a bike, in a backpack, or on a rocket, and you record the raw GPS signals; then you can replay those on the bench. That requires greater bandwidth, greater bit depth, smaller size, battery power, all of that.

    The other is pure signal simulation. We simulate the signals coming from the satellites from pure principles. So, we’ve had to dive into how those signals are structured, reproduce them mathematically, and then incorporate that in into our software. That’s been 15 times the original work we thought it would be, but as we add each signal it tends to get a bit simpler until they add new ways to encode signals, and then it gets complex again. We’ve had to increase our bandwidth, increase our bit depth for the recording to cover all of these new signals.
    Because our systems record and replay, they’re used a lot to record real-world jamming. In many scenarios, our customers will take one of our boxes into the field and record either deliberate jamming or jamming that’s been carried out by a third party. Then they can replay that in the comfort of their lab.

    With regards to spoofing, we’ve just improved our signal simulation. So, we can completely synchronize it with real time. We can do seamless takeover of a GNSS signal in real time. We can reproduce the current ephemeris and almanac. If we transmit a sufficiently powerful signal, we can completely take over that device. Then we can insert a new trajectory into it. That’s a very recent update we’ve done.

    If the complexity and amount of your work has gone up so much in the last few years but you cannot increase your prices at the same rate, what does that do to your business model?

    It’s the same people that produce the signals in the first place, so they still have a job. However, as we add more signals and capabilities, we tend to get more customers as well.

    Oh, so, you’re expanding your market!

    Right, right.

    Regarding some of the new PNT services being developed, how do you simulate them realistically without the benefit of recordings of live sky signals?

    It is all pure signals simulation. You go through the ICD line-by-line and work out the new schemes. Here’s an interesting anecdote. Our developer who does a lot of the signal development is Polish and is also fluent in Russian. When we were developing the GLONASS signals, he was working from the English version of the GLONASS ICD. He said that it didn’t make any sense. So, he looked at the Russian version and discovered that the English one had a typo. When he used the Russian version, everything worked perfectly. He told this to his contacts at GLONASS and they thanked him and updated the English translation of their document. So, you are very, very much reliant on every single word in that ICD.

    Are there typically differences between the published ICD and the actual signal?

    No, no. Apart from the Russian one, which had a typo, they’re very good. For example, we’ve recently implemented the latest GPS L1C signal. My developer spent six months recreating it and getting all the maths right and the only way you could test it was to connect it to a receiver and hit “go.” It just worked the first time. He almost fell off his chair. The ICD in that case was very, very accurate.

    Hope that Xona’s ICD is just as good.

    Yeah.

    Are accuracy requirements for simulation increasing, to enable emerging applications?

    Yes, absolutely. No one can have too much accuracy. Everyone’s chasing the goal of getting smaller, faster, and more accurate systems. They want greater precision and better accuracy from their simulators, as well as a faster response. We do real-time simulators and they want a smaller and smaller delay from when you input the trajectory to when you get the output. Luckily for us, Moore’s law is still in effect, so, as the complexity of the signals and the accuracy requirements increase, computers can churn through more data. Luckily, we’re able to keep up on the hardware side as well, because much of our processing is done using software. Some companies do it in hardware and some companies do it in software. We concentrate on the software side of things.

    Here’s another interesting anecdote from my Polish guy. He noticed that the latest Intel chips contain an instruction that multiplies and divides at the same time but that it wasn’t available in Windows. So, he put in a request with Microsoft for that operational code and they incorporated it into the very latest version of dotnet, which has improved our simulation time by 7%. I see little improvements like that all the time.

    Are all your simulators for use in the lab or are some for use in the field? If the latter, for what applications and how do they differ from the ones in the lab? (Well, for starters, I assume that they are smaller, lighter, and less power-hungry…)

    All our systems are designed to be used inside and outside the lab. They can all be carried in a backpack, on a push bike, in a car. We do that deliberately, because we come from the automotive side of things, so we have to keep everything very small and compact.

    Besides automotive, what are some field uses?

    Some of our customers have put them in rockets, recording the signal as it goes up, or in boats. We have people walking around with an antenna on their wrist connected to one of our systems, so that they can simulate smartwatches. There are many portable applications. We have a very small battery-powered version, which makes it very independent.

    Are there any recent success stories that you are at liberty to discuss?

    Our most exciting one is a seamless transition for simulation that we developed to replace or augment GPS in tunnels. We’ve been talking to many cities around the world that are building new tunnels. Because modern cars automatically call emergency services when they crash or deploy their airbags, they need to know where they are, of course. Cities need to take this into account when they are building new tunnels, which can pass over each other or match the routes of surface streets. Therefore, accurate 3D positioning in the tunnels has become essential. It requires installing repeaters every 30 meters along each tunnel and software that runs on a server and seamlessly updates your position every 30 meters. As you enter a tunnel, your phone or car navigation system instantly switches to this system. It’s been received very well because it’s mainly software and the hardware is pretty simple. We’ve brought the cost down to a fifth of the cost of standard GPS simulators for tunnels. So, we’re talking to several cities about some very long tunnels, which is very exciting.

  • Faux signals for real results: Safran Federal Systems

    Faux signals for real results: Safran Federal Systems

    An exclusive interview with Tim Erbes, Technical Director, Safran Federal Systems (formerly Orolia Defense & Security). For more exclusive interviews from this cover story, click here.


    What are currently the key challenges for simulation?

    One of our big challenges is determining what performance requirements are necessary for our users. Often, they can’t determine what the specs need to be. All they know is that they need it to work. “I need this receiver from one company, this IMU from another company, and the simulator I got from you guys to work together and I need the performance to match reality.” It can be very challenging to say, “What are the requirements for the simulator? How accurate does it need to be? What types of things matter in this integration?”

    Often, we’re left trying to figure that out. So, that’s an interesting, maybe unexpected challenge. It’s easy to look at the datasheet and see what some specs are, but it’s a much harder thing to say, “Well, what do you need the specs to be?” So, we’ve been working with our customers to try to nail down some of those specs, particularly with Wavefront. We have some specs on such things as phase alignment and phase stability. But how do you translate that into something like “Well, I just want the CRPA to work the same in the lab as it does in the real world?” There’s not a direct, easy way to do that. We’re in the middle of trying to figure that out. That’s definitely one of our challenges.

    What about the increase in jamming and spoofing threats?

    In the last five years, we’ve seen a lot more open talk about jamming and spoofing in the world. The receiver manufacturers must think about this a lot more. What’s interesting from a simulator point of view is that this is not actually new for us. We have the advantage that we’ve been designing to program requirements for years and they have included jamming and spoofing for years. So, in a way, simulation is ahead of this state of the world. Jamming and spoofing are not new or hard ideas for us. In fact, spoofing is similar to simulation. So, we already know how to do that.

    Image: Safran Federal Systems (formerly Orolia Defense & Security)
    Image: Safran Federal Systems (formerly Orolia Defense & Security)

    However, jamming and spoofing are new to programs and integration labs. So, there might be platforms where they’re now testing against jamming or spoofing requirements where in the past, maybe they didn’t do that. They certainly can use our simulators to help them do that. However, we’re not seeing a lot of new requirements coming to us saying we need new jamming or spoofing capabilities, because we already have them. Luckily, we are future oriented regarding the jamming and spoofing requirements, so those really haven’t been a challenge for us yet.

    That can always change, right? If new requirements come up, such as higher data rates or wider bandwidth waveforms or different types of waveforms, then we would have to adapt and add support for that kind of stuff. As of right now, however, we aren’t really seeing that. So, luckily, we’re prepared for that. As for the industry as a whole, there has definitely been a big movement in the last few years to understand the effects of jamming and spoofing. Simulation is a big part of that.

    What about the completion of the BeiDou and Galileo constellations?

    For a long time, we simulated four constellations. Then that began to get fuzzy. Do you consider SBAS a constellation or is that just an augmentation? Do you count EGNOS and other supplemental constellations for the other constellations? What about NavIC and QZSS? Before you know it, you start to lose track of exactly how many you have. We just released our 8th constellation, Xona.We’re going to be demonstrating it at JNC.

    Tell me more about that.

    We are trying to have all the constellations and that can be a fuzzy definition. Does that mean all that are up there right now or all that will be up there in the future? We’re trying to be forward looking and add everything that is going to be up there or might be up there so that lab users can develop and test. Multi-constellation simulation is a particularly challenging problem for groups that don’t have simulators. If you’re just doing research on, say, GPS, and want a new code, you might be able to do that in a lab on your own. But as soon as you say, “I want to do research on whether this LEO constellation helps navigation on a receiver that also uses Galileo and GPS,” suddenly, your research requires a full multi-constellation simulation.
    There are two choices. One is to have a simulator do the constellations that already exist, and then you have some research to add constellations. That can be very challenging, especially with time alignment and things like that. The other is to have a simulator that can do all the constellations. That would be the easy choice, right? That presents a problem with such things as LEO navigation being on the rise and these constellations that are just emerging, that are still not even fully defined.

    So, we’re trying to build those into our simulation products, to help researchers and decision makers determine whether these will be useful features to add to their receivers or their systems. We have the advantage of having a software-defined architecture. We designed the software so that it is easy to add new constellations to it. Basically, once we’re given a proper ICD, we’re only a couple of months away from a first draft implementation of that new signal. Then we iterate. There used to always be a government-driven, multi-year program to develop an ICD. Now, we have this new concept of the signal manufacturers. We’re seeing private companies release signal specs. That’s a very different way of creating a signal in a constellation. So, sometimes you don’t get much time between when the ICD is available and when simulator users want to use that constellation. Having a software-defined architecture really helps us move quickly. We can add such things as Xona very fast.

    Xona told me a couple of days ago that they will soon put out an ICD. What’s the difference between actual signals that you can record and play versus something that’s only on paper?

    That’s a great point. Probably many people don’t realize, when they first look at this, that what’s in the ICD and what’s on live sky are sometimes very different. Is the simulator supposed to match live sky? Or is it supposed to match the intended final state of the constellation, according to the ICD? This is a huge topic for M-Code, which is ever changing, and has a very large ICD that’s been released. Space Systems Command/Military Communications & Position, Navigation, & Timing (MCPNT) controls the features and releases them incrementally. We’re constantly having to make changes to the simulator to match those releases. The same is true for the other ICDs. At the Institute of Navigation Joint Navigation Conference (JNC), we will demonstrate an expanded PRN. I think this showed up in the ICD a couple of years ago, but it’s not used by any users yet. Some of the receiver manufacturers are starting to look at using PRNs beyond 32. So, we’re adding that to the simulator. This has already happened for BeiDou as well. I think their ICD goes up to more than 60 satellites. It’s an ever-changing race. The ICDs are constantly being updated and we’re trying to update the simulator.

    Image: Safran Federal Systems (formerly Orolia Defense & Security)
    Image: Safran Federal Systems (formerly Orolia Defense & Security)

    Meanwhile, live sky is many years behind the paper, right? This creates an interesting challenge: when you design a system, are you designing it for today or for the future? We have users in both groups. We have users that only care about what is happening today, because they need a model. Maybe you want to model a specific mission and you want to make sure that everything’s going to go properly. Or maybe you’re designing a system that you want to release in three or four years, and you want to make sure that it’s going to work with the state of the system then.

    A big challenge is to make sure that we’re keeping pace with all these ICDs. There are more constellations than ever and the technology makes it easier to change signal architectures. We’re seeing signals change faster than we’ve ever seen them change before. We go to conferences and hear about such things as on-orbit reprogramming and signals that might even change specs while they’re being transmitted. Maybe they don’t even have to have a fixed bandwidth or fixed bit rate. We’re going to start talking about signals that can reprogram on the fly. That’s going to make simulation more and more challenging. The technology exists to do this.

    Software-defined waveforms is a very logical step. In the software world, we have this concept of version nightmare. When you have 20 different pieces of software that are interdependent, it can get very challenging. We’re going to start to see that in simulators. We’re going to see, “Hey, what version of navigation authentication are you using? We updated it six months ago. Are you using the new one or the old one? Which one should we use?” Well, it depends on what your receiver is using. It’s going to be interesting and challenging to keep all this straight in the next few years as things evolve. Certainly, however, our goal is to be there for all of it and to be as fast and as forward thinking as we can for our customers. That means that we also need to know what our customers need. So, we’re always looking for feedback and requests, what challenges our customers face and we’re responding to those requests.

    Tell me more about the difference between simulators used by receiver manufacturers in their labs as they’re tweaking receivers or developing new ones vs. simulators used for mission planning.

    The simulators are the same, but they’re used in very different ways. In most lab simulation, what the constellation looks like that day doesn’t matter very much. They can just run with a default constellation for a given day. They’ll run that scenario hundreds or thousands of times and never need to change it because they’re testing parts of the receiver that don’t care a whole lot about the specifics of what’s happening.

    Whereas missions are time- and location-specific.

    Yeah, exactly. They want to know which satellites will be overhead at an exact time and place. It’s not so much a problem anymore, but there used to be certain days and times when you would not get enough satellites in view, or you might have very bad dilution of precision, and your mission might actually fail. We’re past those days. There are now enough satellites up there. Most receivers will navigate within their specs most of the time in most places. However, for critical missions, such as military operations or rocket launches, you might not want to just assume that any day is a good day. So, if you’re about to launch a rocket, you might want to check. “What does the constellation look like right now?” The challenges that brings is that simulators have a default constellation, but the constellations are constantly changing.

    When you’re doing real day mission planning, the big problem isn’t so much how to generate a signal, it’s how to find out what’s happening today. That’s really the nature of the problem because what’s out there today is different from what was happening yesterday or what will happen tomorrow. You might have unhealthy satellites. You need to know that if you want to model them. It becomes a big challenge to get all the right data into the simulator. Once all that data is in there, then it’s the same as any other simulation.

    Are there good sources for current data on GLONASS, BeiDou and Galileo?

    Image: Safran Federal Systems (formerly Orolia Defense & Security)
    Image: Safran Federal Systems (formerly Orolia Defense & Security)

    There are a couple of websites that provide information about where the satellites currently are. However, we’ve found that each one of those sites has its own challenges. Some are maybe 30 minutes out of date, which is pretty good, but puts the satellites in slightly different spots. Some of those sites only support some of the constellations. We’re talking about multiple countries and they don’t all agree on how this should be done. So, there’s not a single point that you can visit to get all the satellite data. There are a couple of companies that try to fix this. U-blox has AssistNow; Qualcomm has an assist for its cellular receivers; Trimble, NovAtel, and a couple of other companies have their error correction services to which you can subscribe to get some of that data.

    If you want real-time up-to-date ephemeris for all the constellations, that is challenging. There are one or two options we have found that seem to work, but they each have their disadvantages. Maybe they don’t have all the satellites. Again, we’re talking about versioning issues. So, if you’ve designed your system with a certain version of an ICD and they’ve added more satellites since, those new SVs maybe aren’t so important for your users, so you don’t publish them. Other users want those satellites. So, we see versioning issues in these data streams. For example, we use the CORS network to get a lot of GPS data but that whole network, as far as I know, is only running the legacy data. As far as I know, no network is distributing the L1C modernized data that we will need at some point. So, as we launch new signals and constellations, we need the networks to provide this new data.

    What are some other challenges?

    For us, being a software-defined simulator on a platform dependent on software-defined radio (SDR), we’re constantly looking at what’s changing in the SDR technology community. There’s always some interesting stuff happening there that we try to incorporate. We don’t have any big announcements this year, as far as new architectures or anything like that. However, the SDR community is evolving. It’s still a rather new industry. A few years ago, we were an early adopter of SDR technology for mass deployment. Now, we’re seeing some more mature SDRs starting to push such things as channel count and coherency. We will probably take advantage of that in the future.

    The other interesting thing technology-wise is that we’re also a GPU-dependent technology. So, as the GPU industry continues to evolve and makes bigger and faster GPUs, we get a relatively low-cost way to upgrade. We don’t have to do a lot of R&D to upgrade to a new GPU. For our users that means that the number of signals they can generate on their simulators is always increasing even using the same hardware from one generation to the next. Our first simulator did 75 signals; the next version did 150. We could build a system that did more than 1,000 signals, but our users don’t need it.

    I assume that the growth curve for GPUs is steeper than that for signals.

    I think that you’re right about that. I’m sure glad they do, because then something like Xona shows up and we don’t have to rearchitect our system to generate 300 signals, right? At JNC we will show expanded PRN, 300 Xona satellites in the constellation, and a 10 fold improvement on Wavefront performance specs.. We will continue to build simulators that meet our customers’ requirements. Besides GPUs, a lot of the technology involves software R&D and signals. The stuff that we do digitally inside of our system that allows us to do things like extremely precise phase alignment on Wavefront, for example. We spent a lot of time developing that stuff.

  • Online Exclusive: Faux Signals for Real Results

    Online Exclusive: Faux Signals for Real Results

    Image: Safran Federal Systems (formerly Orolia Defense & Security)
    Image: Safran Federal Systems (formerly Orolia Defense & Security)

    As the number of constellations, satellites, and signals has grown in recent years — especially in the past few years, with the completion of the BeiDou and Galileo constellations — simulator manufacturers have been challenged to keep up. Threats of jamming and spoofing also increased. Then, a few companies began to develop new positioning, navigation and timing (PNT) constellations in low-Earth orbit (LEO).

    For the August 2023 cover story, I discussed these challenges and the prospect for the simulation industry with representatives of six companies: Safran Federal Systems (formerly Orolia Defense & Security), Racelogic, CAST Navigation, IFEN, Spirent Communications and Spirent Federal Systems.

    Due to the limited space available in print, I was able to use only used a small portion of the interviews I conducted for our August cover story. For full transcripts of them see below:

    • Full interview with Tim Erbes, Technical Director, Safran Federal Systems (formerly Orolia Defense & Security).
    • Full interview with Julian Thomas, Managing Director, Racelogic.
    • Full interview with Jürgen Pielmeier, Managing Director, IFEN.
    • Full interview with Mark Holbrow, VP of Product Development, Spirent Communications and Roger Hart, Sr. Director of Engineering, Spirent Federal Systems.
  • Faux signals for real results: GNSS simulators keep up with a panoply of new signals

    Faux signals for real results: GNSS simulators keep up with a panoply of new signals

    Spirent’s GSS6450 record and playback system (RPS) used to record live-sky signals in an urban environment for testing in the lab.(Image: Spirent Federal Systems)
    Spirent’s GSS6450 record and playback system (RPS) used to record live-sky signals in an urban environment for testing in the lab.(Image: Spirent Federal Systems)

    These are interesting and challenging times for the makers of GNSS signal simulators.

    For decades, developers and manufacturers of GNSS receivers have needed to simulate the satellites’ signals to test receivers in their labs and in the field. Meanwhile, users of GNSS receivers for critical missions — such as military operations and rocket launches — have needed to simulate the exact conditions (the number of satellites in line of sight, the positional dilution of precision, etc.) at specific points in time and space.

    As the number of constellations, satellites and signals grew — especially in the past few years, with the completion of the BeiDou and Galileo constellations — simulator manufacturers were challenged to keep up. Threats of jamming and spoofing also increased. Then, a few companies began to develop new positioning, navigation and timing (PNT) constellations in low-Earth orbit (LEO). Now, it is common for simulators to require several hundred channels.

    I discussed these challenges and the prospect for the simulation industry with representatives of five companies:

    For the full transcripts of my interviews, click here. If you like this article, you will love the interview transcripts, which cover much more than I had room for here.

    Legacy Constellations and New Ones

    Simulator manufacturers cite a variety of challenges. According to Erbes, a big one is determining users’ requirements. “Often,” he said, “they can’t determine what the specs need to be. All they know is that they need it to work.” This is particularly true when mixing and matching receivers, IMUs, and components from different manufacturers, he pointed out.

    For decades, there were only two GNSS constellations (GPS and GLONASS). A couple of years ago, two more came online (BeiDou and Galileo). Meanwhile, several regional augmentation systems were developed (SBAS, EGNOS, NavIC, QZSS and KASS), some of which may later grow into global systems. Now, new LEO-based systems are being developed. For simulator manufacturers, what was once clear “began to get fuzzy,” Erbes said. “If you ask members of our team right now how many constellations we support, you will not get a quick answer. We’re trying to be forward-looking and add everything that might be up there so lab users can develop and test.”

    Multi-constellation simulation is a particularly challenging problem for groups that don’t have simulators, Erbes pointed out. “We have the advantage of having a software-defined architecture. We designed the software so that it is easy to add new constellations to it. Basically, once we’re given a proper interface control document (ICD), we’re only a couple of months away from a first draft implementation of that new signal. Then we iterate.”

     LabSat 3 Wideband compact GNSS simulator. (Image: Racelogic)
    LabSat 3 Wideband compact GNSS simulator. (Image: Racelogic)

    In the past few years, said Thomas, Racelogic “had to suddenly invent 15 new signals.” It makes a record-and-replay system — “You put a box in a car, on a bike, in a backpack, or on a rocket, and you record the raw GPS signals,” Thomas said — and another system in which it simulates the satellites’ signals “from pure principles.” The latter, he noted, has been “15 times the original work we thought it would be. However, as we add each signal it tends to get a bit simpler until they add new ways to encode signals, and then it gets complex again.”

    Spirent Communications’ technology, Holbrow said, focuses around “its dedicated SDR hardware platform and software simulation engine, which provide performance, scalability and flexibility, within an open accessible architecture. Close collaboration with our selected partners ensures the opportunity to support and integrate new and emerging PNT technologies through their tools, applications and hardware.” Two other aspects that have continued to grow in importance have been “increased realism and test automation,” Holbrow said. “Both are areas in which Spirent continues to prioritize and invest R&D dollars.”

    Spirent “can enable the user with effectively an arbitrary waveform simulator or ‘sandbox’ to experiment with different modulation schemes, different chipping rates, codes, bandwidths and navigation data content,” Holbrow said. “The increasing number of signals that we can support multiplies the permutations and combinations of test cases that users can do,” Hart added.

    Not every simulator user is equally interested in simulating all the existing and emerging constellations. Those in the U.S. military market do not use foreign signals, pointed out Clark. However, they may want to understand how those signals could impact their vehicle, platform, or individual receiver.

    LEO-based constellations “have become a buzzword in the last year or so,” Clark said. Because CAST Navigation’s simulators are modular and use an FPGA-based design, “we can add different satellite constellations or satellite protocols to our system,” he said. “However, we don’t offer anything commercially yet due to a lack of an official ICD, or any kind of documentation that defines any of these new LEO-based signals.”

    Today, said Pielmeier, all high-end RF simulators must support “all existing GNSS systems with all related signal components on all frequencies.” Additionally, to remain competitive, they must be kept “up-to-date with the new and continuously evolving GNSS signals.” He added: “Beyond the L-band signals, we are also fully supporting the S-band signals of the NavIC constellation.”

    The increased request for precise point positioning (PPP) corrections service, Pielmeier pointed out, was the driver for IFEN to add the High Accuracy Service (HAS) PPP-correction capability on Galileo’s E6-B signal to its next release. “We expect further improvements here during the next few years, especially to cover the emerging needs of the PPP-RTK market.” The advent of LEO-based PNT services, he said, makes this “the most important driver for the next five years, extending the signal frequencies beyond the current L- and S-band signals, seeing new modulations, two-way transfer and many more topics.”

    Jamming and Spoofing

    Concern about jamming and spoofing has increased significantly over the past several years. These, however, are not new concepts for simulator manufacturers. “In a way, simulation is ahead of this state of the world,” said Erbes. “Spoofing is similar to simulation. So, we already know how to do that.” That could change, however. “If new requirements come up, such as higher data rates or wider bandwidth waveforms or different types of waveforms, then we would have to adapt and add support for that kind of stuff.”

    “Because our systems record and replay, they’re used a lot to record real-world jamming,” said Thomas. Regarding spoofing, Racelogic has just improved its signal simulation. “We can do seamless takeover of a GNSS signal in real time. We can reproduce the current ephemeris and almanac. If we transmit a sufficiently powerful signal, we can completely take over that device.”

    Over the past five years, most of CAST Navigation’s customers have become much more interested in being able to simulate jamming and spoofing, Clark said. “If you’re doing anything of any importance in a contested environment, you’re going to come up against some type of spoofing and/or jamming interference.”

    Pielmeier agreed that simulation of jamming and spoofing threats has been a major market driver in recent years. “Our latest RF simulator generation, NCS NOVA+,” he said, “fully supports all types of jamming and spoofing and is fully integrated into our RF simulators to enable coherent signal generation. With the coming safety-of-life and automated driving applications based on DFMC (SBAS/GBAS dual-frequency multi-constellation), the need to support advanced jamming and spoofing simulation solutions will remain a continuous driver.”

    IFEN’s rf signal generator technology, based on a modular and highly flexible Software Defined Radio (SDR) platform. (Image: IFEN)
    IFEN’s rf signal generator technology, based on a modular and highly flexible Software Defined Radio (SDR) platform. (Image: IFEN)

    Simulating What Does Not Yet Exist

    The current GNSS constellations broadcast signals that can be recorded, played back, and used to generate accurate simulations. For systems still being developed, however, simulator manufacturers must rely on each system’s ICD, if and when it is available. Even for established systems, the live sky signals may diverge from the ICD. “Is the simulator supposed to match live sky,” Erbes wondered, “or is it supposed to match the intended final state of the constellation, according to the ICD? This is a huge topic for M-code, which is ever changing, and has a very large ICD that is released incrementally. We’re constantly having to make changes to the simulator to match those releases.”

    A big challenge for simulator manufacturers is to keep pace with new and evolving ICDs. “There are more constellations than ever, and the technology makes it easier to change signal architectures,” said Erbes. “We’re going to start talking about signals that can be reprogrammed on the fly. That’s going to make simulation more and more challenging.”

    Simulating signals for new systems that are not yet deployed is a matter of “pure signals simulation,” said Thomas. “You go through the ICD line-by-line and work out the new schemes. You are very much reliant on every single word in that ICD.”

    New LEO-based systems are not the only ones to present this challenge to simulator manufacturers. “L1C is another one of those problem child signals that we have developed,” said Clark. “All we can do is buy all the makes and models of L1C receivers available for sale and utilize our simulator, along with those receivers, to see whether things are good. We’ve asked the government for an L1C code sample, but it will not be available until the satellite manufacturers launch the satellites in their final configuration. Until then, we’ll develop to the ICD that’s been released and defined, then cross our fingers.”

    Spirent’s core simulation engine and SDR “are agnostic of the constellation and signal type that’s being generated,” Holbrow said. “So, the underlying principles of accuracy, range rate, pseudo-range control, and delay, together with the RF fidelity from Spirent’s SDR+ Sim engine, can be readily manipulated to simulate the wealth of emerging signals, including LEO.” Additionally, when an ICD is not available, the company can enable its customers to use its tools “to readily populate elements of that ICD themselves.”

    In the Lab vs. In the Field

    “All our systems can be carried in a backpack, on a push bike, in a car,” said Thomas. “We do that deliberately, because we come from the automotive side of things, so we have to keep everything very small and compact. Some of our customers have put them in rockets, recording the signal as it goes up, or in boats. We have people walking around with an antenna on their wrist connected to one of our systems, so that they can simulate smartwatches.”

    CAST Navigation has simulator packages that range “anywhere from shoebox size to nine-foot-tall racks,” said Clark. “They are all modular, so you can add options and capabilities over time. We have simulators that are used in the field. Some of the testing groups with the U.S. armed forces have used our simulators in the back of a Humvee along with other proprietary equipment to conduct their own field experiments.”

    Spirent supports in-the-field use cases: its portable simulator can test PNT resilience while the DUT is receiving live-sky signals, and their record-and-playback system takes real-world soundings in a wideband RF environment for playback in the lab.

    Currently, Pielmeier said, all IFEN simulators are designed for lab use. However, “we recognize an increased request for field-capable RF simulators, specifically to perform spoofing of real SIS to test deployed GNSS receivers in the field. Offering a portable in-field solution is in our mid-term planning, but not a current driver for our developments.”

    Testing vs. Mission Planning

    How do simulators used by receiver manufacturers in their labs and in the field to tweak existing receivers or develop new ones differ from those used for mission planning? “In most lab simulations, they can just run with a default constellation for a given day,” Erbes explained. “They’ll run that scenario hundreds or thousands of times and never need to change it because they’re testing parts of the receiver that don’t care a whole lot about the specifics of what’s happening.”

    Missions, by contrast, are time- and location-specific. Planners need to know which satellites will be overhead at an exact time and place. “When you’re doing real day mission planning, the big problem isn’t so much how to generate a signal, it’s how to find out what’s happening today.”

    Increasing Accuracy Requirements

    Like those for receivers, accuracy requirements for simulators are increasing to match those of emerging applications. “Everyone’s chasing the goal of getting smaller, faster, and more accurate systems,” said Thomas. “We do real-time simulators, and they want a smaller and smaller delay from when you input the trajectory to when you get the output. Luckily, we’re able to keep up on the hardware side as well, because much of our processing is done using software.”

    As accuracy requirements rise, “Real-world testing has an incredibly important role to play,” said Holbrow. Additionally, as resilience testing places increasing demands on test equipment, Spirent Communications now supports “a multitude of vulnerability and corresponding mitigation/prevention test cases” to deal with jamming, spoofing, cyber-attack and CRPA

    CAST Navigation’s simulators meet or exceed accuracy requirements, Clark said. “We have pseudo-range accuracy down to a millimeter, our phase coherence doesn’t wander, and we’re able to achieve 2.5 ps to 3 ps synchronization coherence during multi-element, phased-array antenna simulations. We see our customers interested in a higher performing simulator, and that is our commitment.”

    Pielmeier had a different perspective on this: “We saw no increase in the required accuracy, as the typical requested accuracies are far beyond the real accuracy of the signals anyway.”

    Recent Success Stories

    Racelogic has developed a system to replace or augment GPS in tunnels, which often pass over each other or match the routes of surface streets. “We’ve been talking to many cities around the world that are building new tunnels,” said Thomas. “It requires installing repeaters every 30 meters along each tunnel and software that runs on a server and seamlessly updates your position every 30 meters.”

    Clark pointed out that CAST Navigation’s “bread-and-butter” for the past few years has been “larger systems that can drive phased array antennas, along with inertial units, and full high-dynamic aircraft, in real-time environments.” He added that “the smaller systems, which used to be popular, have mostly gone by the wayside.”

    As a recent success, Holbrow cited Spirent Communications’ release of a Xona simulator, in partnership with Xona Space Systems, as well as the addition of “many realism-related capabilities, including simulating the vibration and temperature effects of inertial systems;” a cloud-based software application called Foresight that enables users to understand the GNSS coverage they would expect at a particular time, location and trajectory based upon accurate 3D scenes; and a simulation test solution for the Galileo Open Service Navigation Message Authentication (OSNMA) mechanism. Finally, he stressed Spirent’s increasing support for automation.

    Pielmeier cited the Galileo second generation Test User Receiver contract that IFEN received from the European Space Agency as its most important recent success. “Within this contract, the NCS NOVA+ simulator as RF test tool will be upgraded to full G2G signal generation capability. The new already implemented G2G signals enable shorter time to first fix (TTFF) and improved acquisition performance but also higher updates rates (e.g., for PPP-RTK). Through the end of the year, the G2G signal will be fully implemented in our RF simulator, including the next generation of advanced authentication solutions.”

  • Far Out: Positioning above the GPS constellation

    Far Out: Positioning above the GPS constellation

    Read Richard Langley’s introduction to this article:Innovation Insights: Falcon Gold analysis redux


    Photo:
    Figure 1: Diagram of cis-lunar space, which includes the real GPS sidelobe data collected on an HEO space vehicle. (All figures provided by the authors)

    As part of NASA’s increased interest in returning to the moon, the ability to acquire accurate, onboard navigation solutions will be indispensable for autonomous operations in cis-lunar space (see Figure 1). Artemis I recently made its weeks-long journey to the Moon, and spacecraft carrying components of the Lunar Gateway and Human Landing System are planned to follow suit. During launch and within the GNSS space service volume, space vehicles can depend on the robust navigation signals transmitted by GNSS constellations (GPS, GLONASS, BeiDou, and Galileo). However, beyond this region, NASA’s Deep Space Network (DSN) serves as the system to track and guide lunar spacecraft through the dark regions of cis-lunar space. Increasingly, development of a lunar navigation satellite system (LNSS) that relies on a low size, weight and power (SWaP) “smallSat” constellation is being discussed for various possible orbits such as low lunar orbit (LLO), near rectilinear halo orbit (NRHO) and elliptical frozen orbit (ELFO).

    Figure 2 : DPE 3D (left) and 2D (right) spatial correlogram shown on a 3D north-east grid.
    Figure 2: DPE 3D (left) and 2D (right) spatial correlogram shown on a 3D north-east grid.

    We have implemented direct positioning estimation (or collective detection) techniques to make the most of the limited and weak GPS signals (see Figure 2) that have been employed in other GNSS-degraded environments such as urban canyons. The algorithm used in conventional GNSS positioning employs a two-step method. In the first step, the receiver acquires signals to get a coarse estimate of the received signal’s phase offset. In the second step, the receiver tracks the signals using a delay lock loop coupled with a phase or frequency lock loop. The second step enables the receiver to get fine measurements, ultimately used to obtain a navigation solution. In the scenario addressed in our work, where a vehicle is navigating beyond the GPS satellite constellation, the signals are weak and sparse, and a conventional GPS receiver may not be able to acquire or maintain a lock on a satellite’s sidelobe signals to form a position solution. For a well-parameterized region of interest (that is, having a priori knowledge of the vehicle orbital state through dynamic filtering), and if the user’s clock error is known within a microsecond, a direct positioning estimator (DPE) can be used to improve acquisition sensitivity and obtain better position solutions. DPE works by incorporating code/carrier tracking loops and navigation solutions into a single step. It uses a priori information about the GPS satellites, user location, and clocks to directly estimate a position solution from the received signal. The delay-Doppler correlograms are first computed individually for the satellites and are then mapped onto a grid of possible candidate locations to produce a multi-dimensional spatial correlogram. By combining all signals using a cost function to determine the spatial location with the most correlation between satellites, the user position can be determined. As mentioned, signals received beyond the constellation will be sparse and weak, which makes DPE a desirable positioning method.

    BACKGROUND

    The proposed techniques draw from several studies exploring the use of weak signals and provide a groundwork for developing robust direct positioning methods for navigating beyond the constellation. NASA has supported and conducted several of the studies in developing further research into the use of signals in this space.

    A study done by Kar-Ming Cheung and his colleagues at the Jet Propulsion Laboratory propagates the orbits of satellites in GPS, Galileo, and GLONASS constellations, and simulates the “weak GPS” real-time positioning and timing performances at lunar distance. The authors simulated an NRHO lunar vehicle based on the assumption that the lunar vehicle is in view of a GNSS satellite as long as it falls within the 40-degree beamwidth of the satellite’s antenna. The authors also simulate the 3D positioning performance as a function of the satellites’ ephemeris and pseudorange errors. Preliminary results showed that the lunar vehicle can see five to 13 satellites and achieve a 3D positioning error (one-sigma) of 200 to 300 meters based on reasonable ephemeris and pseudorange error assumptions. The authors also considered using relative positioning to mitigate the GNSS satellites’ ephemeris biases. Our work differs from this study in several key ways, including using real data collected beyond the GNSS constellations and investigating the method of direct positioning estimation for sparse signals.

    Luke Winternitz and colleagues at the Goddard Space Flight Center described and predicted the performance of a conceptual autonomous GPS-based navigation system for NASA’s planned Lunar Gateway. The system was based on the flight-proven Magnetospheric Multiscale (MMS) GPS navigation system augmented with an Earth-pointed high-gain antenna, and optionally, an atomic clock. The authors used high-fidelity simulations calibrated against MMS flight data, making use of GPS transmitter patterns from the GPS Antenna Characterization Experiment project to predict the system’s performance in the Gateway NRHO. The results indicated that GPS can provide an autonomous, real-time navigation capability with comparable, or superior, performance to a ground-based DSN approach using eight hours of tracking data per day.

    In direct positioning or collective detection research, Penina Axelrad and her colleagues at the University of Colorado at Boulder and the Charles Stark Draper Laboratory explored the use of GPS for autonomous orbit determination in geostationary orbit (GEO). They developed a novel approach for directly detecting and estimating the position of a GEO satellite using a very short duration GPS observation period that had been presented and demonstrated using a hardware simulator, radio-frequency sampling receiver, and MATLAB processing.

    Ultimately, these studies and more have directed our research in exploring novel methods for navigating beyond the constellation space.

    DATA COLLECTION

    The data we used was collected as part of the U.S. Air Force Academy-sponsored Falcon Gold experiment and the data was also post-processed by analysts from the Aerospace Corporation. A few of the key notions behind the design of the experiment was to place an emphasis on off-the-shelf hardware components. The antenna used on board the spacecraft was a 2-inch patch antenna and the power source was a group of 30 NiMH batteries. To save power, the spacecraft collected 40-millisecond snapshots of data and only took data every five minutes. The GPS L1 frequency was down-converted to a 308.88 kHz intermediate frequency and was sampled at a low rate of 2 MHz (below the Nyquist rate) and the samples were only 1- bit wide. Again, the processing was designed to minimize power requirements.

    METHODS AND SIMULATIONS

    To test our techniques, we used real data collected from the Falcon Gold experiment on a launch vehicle upper stage (we’ll call it the Falcon Gold satellite) which collected data above the constellation on a HEO orbit. The data collected was sparse, and the signals were weak. However, the correlation process has shown that the collected data contained satellite pseudorandom noise codes (PRNs). Through preliminary investigation, we find that the acquired Doppler frequency offset matches the predicted orbit of the satellite when propagated forward from an initial state. The predicted orbit of the satellite was derived from the orbital parameters estimated using a batch least-squares fit of range-rate measurements using Aerospace Corporation’s TRACE orbit-determination software. The propagation method uses a Dormand-Prince eighth-order integration method with a 70-degree, first-order spherical harmonic gravity model and accounting for the gravitation of the Moon and Sun. The specifics of this investigation are detailed below.

    Figure 3: GPS constellation “birdcage” (grey tracks), with regions of visibility near the GPS antenna boresight in blue and green for the given line-of-sight from the Falcon Gold satellite along its orbit (orange).
    Figure 3: GPS constellation “birdcage” (grey tracks), with regions of visibility near the GPS antenna boresight in blue and green for the given line-of-sight from the Falcon Gold satellite along its orbit (orange).

    The positions of the GPS satellites are calculated using broadcast messages (combined into so-called BRDC files) and International GNSS Service (IGS) precise orbit data products (SP3 files). GPS satellites broadcast signals containing their orbit details and timing information with respect to an atomic clock. Legacy GPS signals broadcast messages contain 15 ephemeris parameters, with new parameters provided every two hours. The IGS supports a global network of more than 500 ground stations, whose data is used to precisely determine the orbit (position and velocity in an Earth-based coordinate system) and clock corrections for each GNSS satellite. These satellite positions, along with the one calculated for the Falcon Gold satellite, allowed for the simulation of visibility conditions. In other words, by determining points along the Falcon Gold satellite trajectory, we determine whether the vehicle will be within the 50° beamwidth of a GPS satellite that is not blocked by Earth.

    Figure 3 shows a plot rendering of the visibility conditions of the Falcon Gold satellite at a location along its orbit to the GPS satellite tracks. Figure 4 depicts three of the 12 segments where signals were detected and compares the predicted visibility to the satellites that were actually detected. A GPS satellite is predicted to be visible to the Falcon Gold satellite if the direct line-of-sight (DLOS) is not occluded by Earth and if the DLOS is within 25° of the GPS antenna boresight (see Figure 5).

    Figure 4: Predicted visibility of direct line-of-sight to each GPS satellite where a blue line indicates the PRN is predicted to be visible but undetected. A green line is predicted to be visible and was detected, and a red line indicates that the satellite is predicted to not be visible, but was still detected.
    Figure 4: Predicted visibility of direct line-of-sight to each GPS satellite where a blue line indicates the PRN is predicted to be visible but undetected. A green line is predicted to be visible and was detected, and a red line indicates that the satellite is predicted to not be visible, but was still detected.
    Figure 5: Depiction of the regions of a GPS orbit where the Falcon Gold satellite could potentially detect GPS signals based on visibility.
    Figure 5: Depiction of the regions of a GPS orbit where the Falcon Gold satellite could potentially detect GPS signals based on visibility.

    As a preliminary step to evaluate the Falcon Gold data, we analyzed the Doppler shifts that were detected at 12 locations along the Falcon Gold trajectory above the constellation. By comparing the Doppler frequency shifts detected to the ones predicted by calculating the rate of change of the range between the GPS satellites and modeled Falcon Gold satellite, we calculated the range rate root-mean-square error (RMSE). Through this analysis, we were able to verify the locations on the predicted trajectory that closely matched the detected Doppler shifts.

    These results are used to direct our investigations to regions of the dataset to parameterize our orbit track in a way to effectively search our delay and Doppler correlograms to populate our spatial correlograms within the DPE. Figure 6 shows the time history of the difference of predicted range rates on the trajectory and the detected range rates on the trajectory. That is, a constant detected range rate value is subtracted from a changing range rate for the duration of the trajectory and not just at the location on the trajectory at the detect time (dashed vertical line). From this we can see that the TRACE method gives range rates near the detected ranges at the approximate detection time for the 12 different segments.

    Figure 6: Plots depicting the 12 segments of detection and the corresponding time history of differences of range-rate values for each GPS PRN detected. The time history is of the range-rate difference between the predicted range rate from the TRACE-estimated trajectory and the constant detected range rate at the detection time (vertical line).
    Figure 6: Plots depicting the 12 segments of detection and the corresponding time history of differences of range-rate values for each GPS PRN detected. The time history is of the range-rate difference between the predicted range rate from the TRACE-estimated trajectory and the constant detected range rate at the detection time (vertical line).

    Excluding Segment 12, which was below the MEO constellation altitude, Segment 6 has more detected range rates than that of the other segments. On closer inspection of this segment, and using IGS precise orbit data products, it appears that the minimum RMSE of the range rates from the detected PRNs is off from the reported detection time by several seconds (see Figure 7). Investigating regions along the Falcon Gold TRACE-estimated trajectory and assuming a mismatch in time tagging results in a location (in Earth-centered Earth-fixed coordinates) with a lower RMSE for the predicted range rates compared to detected range rates.

    Figure 7: Range-rate difference between the predicted range rate from the TRACE-estimated trajectory and the constant detected range rate at the detection time (left). A portion of the trajectory around Segment 6 with the TRACE-estimated location at the time of detection (red) and the location with the minimum RMSE of range rate (black).
    Figure 7: Range-rate difference between the predicted range rate from the TRACE-estimated trajectory and the constant detected range rate at the detection time (left). A portion of the trajectory around Segment 6 with the TRACE-estimated location at the time of detection (red) and the location with the minimum RMSE of range rate (black).

    To determine the search space for the DPE, we first determine the location along the original TRACE-estimated trajectory with the minimum RMSE of range rates for each segment. Then we propagate the state (position and velocity) at the minimum location to the Segment 6 time stamp. If the time segment has more than three observed range rates (Segment 6 and Segment 12), we perform a least squares velocity estimate using the range-rate measurements, using the locations along the trajectory and selecting the location with the smallest RMSE. Then, for Segment 12, the position and velocity obtained from least squares is propagated backwards in time to the Segment 6 timestamp. All of these points along the trajectory as well as the original point from the TRACE estimated trajectory are used in a way similar to the method of using a sigma point filter. Specifically, the mean and covariance of the position and velocity values are used to sample a Gaussian distribution. This distribution will serve as the first iteration of the candidate locations for DPE. There were a total of three iteration steps and at each iteration the range of clock bias values over which to search was refined from a spacing of 1,000 meters, 100 meters, and 10 meters. Also on the third iteration, the sampled Gaussian distribution was resampled with 1,000 times the covariance matrix values in the directions perpendicular to the direction to Earth. This was done to gain better insight into the GPS satellites that were contributing to the DPE solution.

    RESULTS

    Figure 8 shows the correlation peaks for each of the signals reported to be detected using a 15-millisecond non-coherent integration time within the DPE acquisition. Satellite PRNs 4, 16 and 19 are clearly detected. Satellite PRN 29 is less obviously detected, but the maximum correlation value is associated with the reported detected frequency. However, this is the peak detected frequency only if the Doppler search band is narrowly selected around the reported detected frequency. Similarly, while the peak code delay shows a clear acquisition peak for PRNs 4, 16 and 19, for PRN 29 the peak value for code delay is more ambiguous with many peaks of similar magnitude of correlation power. Figure 8 depicts the regions around the max peak correlation chip delay.

    Figure 8: Acquisition peak in frequency (left) and time (right) for PRN 4, 16, 19 and 29. The correlograms are centered on the frequency predicted from the range rate calculated along the trajectory.
    Figure 8: Acquisition peak in frequency (left) and time (right) for PRN 4, 16, 19 and 29. The correlograms are centered on the frequency predicted from the range rate calculated along the trajectory.

    For the first iteration of DPE, the peak coordinated acquisition values for PRN 16 and PRN 4 are chosen for the solution space. From the corresponding spatial correlogram, the chosen candidate solution is roughly 44 kilometers away from the original position estimated using TRACE.
    For the second iteration of DPE, the clock bias is refined to search over a 100-meter spacing. The peak values for PRN 16 and PRN 19 are chosen for the solution space and the chosen candidate solution is roughly 38 kilometers away from the original position estimated using TRACE.
    For the final iteration, Figures 9 and 10 depict the solutions with the 10-meter clock bias spacing and the approach of spreading the search space over the dimension perpendicular to the direction of Earth. Again, this was done to illustrate how the peak correlations appear to be drawing close to a single intersection location. However, the results fall short of the type of results shown in the spatial correlogram previously depicted in Figure 2 when many satellite signals were detected.

    Figure 9: Acquisition peaks plotted in the time domain with the candidate location chosen at the location of the vertical black line for the detected PRNs for the third iteration of the DPE method.
    Figure 9: Acquisition peaks plotted in the time domain with the candidate location chosen at the location of the vertical black line for the detected PRNs for the third iteration of the DPE method.
    Figure 10: Spatial correlogram with the candidate location chosen at the location of the black circle for the detected PRNs for the third iteration of DPE method. The original TRACE-estimated position is indicated by a red circle. The two positions are approximately 28 kilometers apart.
    Figure 10: Spatial correlogram with the candidate location chosen at the location of the black circle for the detected PRNs for the third iteration of DPE method. The original TRACE-estimated position is indicated by a red circle. The two positions are approximately 28 kilometers apart.

    A similar iterative method was followed using not just the four detected PRNs, but any satellite that was predicted to be visible with the relaxed criteria allowing for visibility based on receiving signals from the first and second sidelobes of the antenna. This is predicted using a larger 40° away from the GPS antenna boresight criterion. The final spatial correlogram (Figure 11) shows similar results to the intersections shown in Figure 10. However, there is potentially another PRN shown with a peak contribution near the original intersection point. These results are somewhat inconclusive and will need to be investigated further.

    Figure 11: Spatial correlogram with the candidate location chosen at the location of the black circle for the detected PRNs for the third iteration of DPE method using additional satellites. The original TRACE-estimated position is indicated by a red circle. The two positions are approximately 24 kilometers apart.
    Figure 11: Spatial correlogram with the candidate location chosen at the location of the black circle for the detected PRNs for the third iteration of DPE method using additional satellites. The original TRACE-estimated position is indicated by a red circle. The two positions are approximately 24 kilometers apart.

    CONCLUSIONS AND FUTURE WORK

    Our research investigated the DPE approach of positioning beyond the GNSS constellations using real data. We will further investigate ways to parameterize our estimated orbit for use within a DPE algorithm in conjunction with other orbit determination techniques (such as filtering) as our results were promising but inconclusive. Some additional methods that may aid in this research include investigating the use of precise SP3 orbit files over the navigation message currently used (BRDC) within our DPE approach. Also, some additional work will need to be completed in determining the possibility of time tagging issues that could result in discrepancies and formulating additional methods related to visibility prediction that could aid in partitioning the search space. Additionally, we plan to investigate other segments where few signals were detected, but where more satellites are predicted to be visible (a better test of DPE). Finally, using full 40-millisecond data segments rather than the 15 milliseconds used to date may provide the additional signal strength needed to give more conclusive results.

    ACKNOWLEDGMENTS

    This article is based on the paper “Direct Positioning Estimation Beyond the Constellation Using Falcon Gold Data Collected on Highly Elliptical Orbit” presented at ION ITM 2023, the 2023 International Technical Meeting of the Institute of Navigation, Long Beach, California, January 23–26, 2023.


    KIRSTEN STRANDJORD is an assistant professor in the Aerospace Engineering Department at the University of Minnesota. She received her Ph.D. in aerospace engineering sciences from the University of Colorado Boulder.

    FAITH CORNISH is a graduate student in the Aerospace Engineering Department at the University of Minnesota.

  • Innovation Insights: Falcon Gold analysis redux

    Innovation Insights: Falcon Gold analysis redux

    This is an introduction to the August 2023 Innovation article,Far Out: Positioning above the GPS constellation


    Innovation Insights with Richard Langley
    Innovation Insights with Richard Langley

    On October 25, 1997, a defense satellite was launched from Cape Canaveral on an Atlas rocket with a Centaur upper stage. The Centaur went into an elliptical geosynchronous transfer orbit with an apogee close to geostationary orbit radius before releasing the satellite. Bolted to the side of the Centaur was an instrument package containing a GPS digital sensor. This piggyback device was part of an experiment by students at the U.S. Air Force Academy to test some of the concepts of GPS navigation for high-altitude spacecraft.

    The sensor captured 40-millisecond samples of GPS L1 signals collected by a patch antenna. The digital samples were downlinked to a ground station in Colorado Springs where they were subsequently processed. The equipment successfully operated from November 3 until at least November 9. During that time, GPS signals were detected across a wide range of altitudes above the GPS constellation including at times when the Falcon Gold antenna was only in view of a GPS satellite’s transmitting antenna sidelobes. The downlinked data was carefully archived. The Falcon Gold experiment was discussed by Thomas Powell of the Aerospace Corporation in an article he wrote for this column in October 1999 entitled “The View from Above: GPS on High-Altitude Spacecraft.”

    Fast forward a couple of decades. Researchers at the University of Minnesota are taking a fresh look at the Falcon Gold data using some innovative analysis tools, which may prove beneficial for processing GNSS data from receivers on other satellites flying above the GNSS constellations even all the way to the Moon. In this quarter’s Innovation column, they tell us about their work and its potential benefit.

    This Falcon Gold data study is a great example of how archived GNSS data can be reanalyzed with fresh insight and new techniques to milk even more and better results from the data. Another important example is the wealth of data that has been acquired by the International GNSS Service since beginning operations in 1994. The data in the archive is reprocessed from time to time to produce a more consistent long product set for analysis of sources of systematic error and to improve its ultimate accuracy. This results in a better understanding of Earth system dynamics, for example, including plate tectonics. The data from many other GNSS instruments flown in space is also archived allowing look backs for further and more detailed analyses. This includes my GPS Attitude, Positioning, and Profiling (GAP) instrument on the CASSIOPE scientific satellite, now part of ESA’s Swarm constellation. Researchers continue to produce interesting scientific results from the GAP data. So, it’s not always necessary to generate fresh data for a study – useful data may already exist. What’s old can indeed be new again!

  • Innovation Insights: Antennas and photons and orbits, oh my!

    Innovation Insights: Antennas and photons and orbits, oh my!

    This is an introduction to the May 2023 Innovation article, “New type on the block: Generating high-precision orbits for GPS III satellites.”


    Innovation Insights with Richard Langley
    Innovation Insights with Richard Langley

    While I’m likely preaching to the choir here, GNSS cannot work unless we have an accurate description of the orbits of the satellites and the behavior of their atomic clocks. The accuracy with which this information is provided to a receiver or data processing software is the most important component of the error budget of GNSS positioning, navigation and timing and constitutes most of what is known as the signal-in-space (SIS) range error.

    Each GNSS satellite broadcasts a description of its orbit or ephemeris along with the offset of its active clock from the system’s time standard in a navigation message decoded and used by the receiver. These data are predictions of the orbit and clock offset as computed by the system’s ground control segment and uploaded to each satellite. A recent assessment by U.S. Space Systems Command of the GPS SIS error averaged across all active satellites for a one-week period was about 50 centimeters, root-mean-square. While this is entirely adequate for many GNSS uses, it falls short of the required accuracy for high-demanding applications such as surveying, geodesy, atmospheric sensing, reference frame studies and tectonic monitoring. Which is why various organizations both private and public compute very accurate orbits and clocks and provide these to users. These computations, using data from global receiver networks, are very exacting and model the tiniest effects on the (primarily) carrier-phase measurements these receivers provide.

    These effects include the offset in the electrical phase centers of a GNSS satellite’s transmitting antenna from the satellite’s center of mass and how that varies with the direction of the signal from the satellite to a receiver on Earth. Furthermore, this behavior must be calibrated and modeled for each radio frequency that the satellite transmits. Another effect that must be accounted for are the perturbations caused by non-perfect yaw-steering of a satellite’s solar panels. These panels continuously track the Sun but they have difficulty keeping up at orbit noon and midnight. Accurate models of the actual yaw angle are very important for high-precision GNSS orbits. As if these model requirements were not enough, the effect of solar radiation pressure on satellite orbits must also be modeled. While they don’t have (rest) mass, photons have energy and this can be imparted to satellites when they impinge on them. While a single photon has a negligible effect, the billions upon billions of photons making up sunlight do have a noticeable effect on a GNSS satellite’s motion and must be accounted for by orbit models.

    One organization producing precise orbits for GNSS satellites – arguably the most precise in the world – is the International GNSS Service (IGS), a voluntary federation of more than 200 agencies, universities and research institutions across the globe. Several of these organizations each produce precise orbits, which they submit to the IGS to establish orbit products. One of these organizations is the Navigation Support Office (NSO) at the European Space Agency’s European Space Operations Centre. In this quarter’s Innovation column, a team of NSO engineers discusses how they have improved the orbit modeling of the GPS III satellites by around a factor of two with estimated orbit errors of about 2 centimeters or less. Wizardry? Not really – just rocket science.

  • New type on the block: Generating high-precision orbits for GPS III satellites

    New type on the block: Generating high-precision orbits for GPS III satellites

    Read Richard Langley’s introduction to this article: Innovation Insights: Antennas and photons and orbits, oh my!


    To produce GNSS satellite orbit ephemerides and clock data with high precision and for all constellations, the Navigation Support Office of the European Space Agency’s European Space Operations Centre (ESA/ESOC) continually strives to keep up and improve its precise orbit determination (POD) strategies. As a result of these longstanding efforts, satellite dynamics modeling and GNSS measurement procedures have progressed significantly over the last few years, especially those developed for the European Galileo satellites. Because the accuracy of ESA/ESOC’s GNSS orbits has reached such a high level (about 1 to 3 centimeters), introducing a completely new type of GNSS satellite into the processing is not as easy as it used to be. New spacecraft models – the first and foremost being a model for a satellite’s response to solar radiation pressure (SRP) – are needed for the “newcomer” so that the quality of the overall multi-GNSS solution does not suffer. Just as important are spacecraft system parameters, or metadata, such as the location of the satellite antenna’s electrical phase center and the satellite attitude law.

    In this article, we show the efforts we have made at ESA to bring the quality of our orbit estimates for the GPS Block III satellites up to par with those for Galileo and the earlier GPS satellite blocks. We report on the results from on-ground and in-flight determinations of the Block III transmit antenna phase center characteristics up to 17 degrees from the antenna boresight direction. Moreover, we take advantage of the non-zero horizontal offsets of the transmit antenna from the spacecraft’s yaw axis to estimate the satellite yaw angle during Earth eclipse season and present a simple analytical formula for its calculation. Finally, we describe the development and validation of improved radiation force models for the Block III satellites.

    We start, however, by giving a brief overview of the GPS Block III program.

    GPS BLOCK III

    The U.S. Space Force GPS Block III (previously referred to as Block IIIA) is a series of 10 satellites being procured by the United States to bring new future capabilities to both military and civil positioning, navigation, and timing (PNT) users across the globe. Designed and manufactured by defense contractor Lockheed Martin (LM), the satellites are reported to deliver three times better accuracy, 500 times greater transmission power, and an eightfold enhancement in anti-jamming functionality over previous GPS satellite blocks. At ESA/ESOC, we are paying particular attention to this new tranche of satellites as they are the first to broadcast L1C, a new common signal interoperable with other GNSS, including Galileo.

    At the time of this writing, there are six GPS III space vehicles (SVs) in orbit. The first one – nicknamed “Vespucci,” in honor of Italian explorer Amerigo Vespucci – lifted off atop a SpaceX Falcon 9 rocket from Cape Canaveral Air Force Station, Florida, in December 2018, and entered service on January 13, 2020. An additional four SVs are expected to be launched soon, before moving on to an updated version called GPS IIIF (“F” for Follow On). The first Block IIIF satellite is projected to be available for launch in 2026.

    In view of the growing number of GPS III SVs in orbit, and soon to be joined by IIIFs, accurate spacecraft models and metadata information are becoming more and more important in order to maximize PNT accuracy.

    SATELLITE ANTENNA PHASE CENTER PARAMETERS

    GNSS signal measurements refer to the electrical phase center of the satellite transmitting antenna, which is neither a physical nor a stable point in space. The variation of the phase center location as a function of the direction of the emitted signal on a specific frequency is what we call the phase center variation (PCV). The mean phase center is usually defined as the point for which the phase of the signal shows the smallest (in a “least-squares” sense) PCV.

    Figure 1: Ground-calibrated GPS Block III transmit antenna phase center variations (PCVs). (All figures provided by the authors).
    Figure 1: Ground-calibrated GPS Block III transmit antenna phase center variations (PCVs). (All figures provided by the authors).

    The point of reference for describing the motion of a satellite, however, is typically the spacecraft center of mass (CoM). The difference between the position of the mean phase center and the CoM is what we typically refer to as the satellite’s antenna phase center offset (PCO). Both PCO and PCV parameters must be precisely known — from either a dedicated on-ground calibration or one performed in flight — so that we can tie our GNSS carrier-phase measurements consistently to the satellites’ CoM.

    On-Ground Calibrations. Like for previous GPS vehicles, the Block IIR and Block IIR-M satellites, LM has fully calibrated the GPS III transmit antennas prior to launch at their ground test facilities. Antenna offset parameters for all three carrier signals (L1, L2 and L5) were posted on the U.S. Coast Guard Navigation Center (NAVCEN) website (www.navcen.uscg.gov) shortly after each satellite launch. In December 2021, NAVCEN released the PCOs for SV number (SVN) 78, along with updates to the first four satellites (see Table 1). About ten months later, in October 2022, the antenna pattern for each satellite and signal frequency were published (see Figure 1).

    Table 1: Ground-calibrated GPS Block III transmit antenna PCOs in millimeters. (Image: GPS World staff)
    Table 1: Ground-calibrated GPS Block III transmit antenna PCOs in millimeters. (Image: GPS World staff)

    The December 2021 offsets are referred to as predicted values at the end of year one on orbit. They differ from the previous ones by several centimeters in both vertical (Z) and horizontal (X and Y) directions. Particularly surprising are the X- and Y-PCOs, which were initially reported to be close to zero. The differences in the horizontal PCOs have generated uncertainty and debate, especially within the International GNSS Service (IGS) about which values to adopt for the new antenna model release (igs20.atx). Testing of the two different PCO datasets in our software demonstrated that the non-zero values as given in Table 1 are the significantly more accurate ones. We will return to this later in this article.

    Combined Ground- and Space-Based Tracking. In this part of this article, we discuss the combination of dual-frequency tracking data from geodetic-quality GPS receivers in low Earth orbit (LEO) with those from a global receiver network on the ground to determine the phase center parameters of the GPS Block III transmit antennas. The LEO-based measurements were taken by the GNSS receivers on board the ocean altimetry satellites Sentinel-6 Michael Freilich and Jason-3. The 1,336-km altitude of both of these missions enables the estimation of the GPS satellite antenna PCVs from 0 up to 17 degrees from boresight while GPS receivers on Earth can only see the satellites up to a maximum angle of 14 degrees. The 14-degree limit is also referred to as the GPS satellites’ edge of Earth (EoE) angle.

    For the modeling of the PCVs we follow the approach of the IGS using piece-wise linear functions of the boresight angle and constraining the PCV values to between 0 and 14 degrees to have zero mean. Furthermore, we employ fully normalized spherical harmonic expansions of degree 8 and order 5 to solve for the azimuth- and elevation-angle-dependent PCVs of the orbiting receiver antennas. The IGS standard antenna phase center corrections from igs20.atx are applied to all terrestrial receiver and GPS Block II transmit antennas.

    Figure 2: GPS Block III transmit antenna PCVs as a function of boresight angle. The gray shaded area indicates the angular range that is inaccessible from the ground but relevant to high altitude LEO missions such as Sentinel-6 Michael Freilich or Jason-3.
    Figure 2: GPS Block III transmit antenna PCVs as a function of boresight angle. The gray shaded area indicates the angular range that is inaccessible from the ground but relevant to high altitude LEO missions such as Sentinel-6 Michael Freilich or Jason-3.

    The estimated Block III antenna PCVs are depicted in Figure 2. The estimates for the five individual antennas match each other to within 0.4 millimeters root-mean-square (RMS) (see Figure 2, top). The agreement among the PCVs that we get when processing the tracking data from each LEO receiver’s antenna separately is at the sub-millimeter level, too (see Figure 2, middle). Overall, the level of consistency suggests that the PCVs are of very good quality and that a block-specific representation is sufficient for precise applications. Comparison of the final block-specific PCV estimates against the values from the current IGS antenna model and from the ground calibrations shows strong agreement (RMS = 0.7 millimeters) between 0 and 14 degrees from boresight (see Figure 2, bottom). Beyond the 14-degree limit, the differences compared to the IGS standard are up to three centimeters, underlying the urgent need for an update of the igs20.atx file.

    Applying the extended PCV corrections as part of the POD process to the GPS LEO receiver data shows significant improvement in the post-fit carrier-phase residuals when compared to the PCV corrections from the IGS legacy model. It removes a previously existing boresight angle-dependent trend and leads to a more than 20% reduction in the computed residual RMS (see Figure 3).

    Figure 3: Post-fit residuals of GPS III carrier-phase data from Sentinel-6 Michael Rreilich when using igs20.atx (top) and esa22.atx (bottom), respectively.
    Figure 3: Post-fit residuals of GPS III carrier-phase data from Sentinel-6 Michael Freilich when using igs20.atx (top) and esa22.atx (bottom), respectively.

    YAW MODELING

    Figure 4: Yaw turn maneuver of GPS Block III satellite SVN 78 near orbit now (top) and orbit midnight (bottom), respectively.
    Figure 4: Yaw turn maneuver of GPS Block III satellite SVN 78 near orbit noon (top) and orbit midnight (bottom), respectively.

    GNSS satellites cannot follow an ideal yaw-steering whenever the Sun elevation angle relative to the orbital plane (the so-called beta angle) gets too low and the yaw rate required to keep the satellite solar panels pointing towards the Sun exceeds the maximum satellite yaw rate. The strategies on how GNSS satellites perform rate-limited yaw-steering are different for each type of spacecraft and only partly documented for public users. Continuous knowledge of GNSS spacecraft yaw attitude, however, is important for kinematic and dynamic reasons. Errors in yaw are known to affect the modeling of transmit antenna phase center’s position, carrier-phase wind-up, and radiation pressure forces. On the other hand, when the mean antenna phase center location is offset from the spacecraft’s Z-axis, the satellite yaw state can be estimated instantaneously from the tracking data of a global receiver network. The approach behind this is commonly referred to as “upside down” or “reverse kinematic precise point positioning” (RPP). The horizontal antenna offset vector can be viewed here as a kind of rotating lever arm whose length determines the accuracy of the yaw angle estimates. Since the Block III X-offset is just 7 centimeters, one should not expect the same RPP accuracy as for other GNSS satellites like those of the GPS IIF or GLONASS-M series, which have an X-offset that is six (GPS IIF) or even eight (GLONASS-M) times larger.

    Nonetheless, with more than three hundred ground stations, kinematic RPP works reasonably well even for GPS III as we can see from Figure 4, which shows the estimated yaw angle of SVN 78 while passing orbit noon and orbit midnight with a Sun elevation angle of almost zero degrees. The plots suggests that Block III satellites — unlike previous Block IIA and IIF SVs — perform their yaw slews near noon and near midnight in the same way and at the same yaw rate. In this respect, the yaw turn behavior is similar to that of the IIR/IIR-M satellites. However, with a maximum yaw rate of 0.10 degrees per second, the Block III satellites rotate only half as fast as those of the IIR/IIR-M family. What is also different is the start time of the yaw maneuver. As can be seen from Figure 4, the maneuver does not start when the required yaw rate exceeds the physical limit but already a couple of minutes before.

    The RPP analysis has led to the development of a simple yaw model for the Block III satellites. For a Sun elevation angle β below β0 = 4.780 degrees, the yaw angle can be approximated with an RMS accuracy of about 8 degrees by the following formula:Photo:
    whereasPhoto:

    is a modified Sun elevation angle, SIGN(β0, β) a FORTRAN function returning the value of β0 with the sign of β, and η is the satellite’s argument of latitude with respect to orbit midnight. The agreement between estimated and modelled yaw angles is illustrated in Figure 5.

    Figure 5: Differences between yaw angle estimates and yaw angle models.
    Figure 5: Differences between yaw angle estimates and yaw angle models.

    Fourier Series for Radiation Force Modeling. The most critical component determining the shape of a GNSS satellite’s trajectory is SRP – the force caused by the impact of solar photons hitting the satellite’s surfaces. A satellite’s sensitivity to SRP can be characterized by the variation of the cross-sectional area to mass ratio (A/M) of the satellite body as it orbits Earth and the Sun. The greater the change in A/M, the higher the sensitivity. From this perspective, the Block III spacecraft can be considered the most sensitive in GPS history.

    Based upon LM’s tried-and-true A2100 bus, the satellite is much more elongated than previous generations. With an estimated size of 7.5 meters squared, the X-side is almost twice as large as the Z-side. Depending on the elevation angle of the Sun relative to the orbital plane, the body’s cross-sectional area exposed to sunlight varies between 4.0 and 8.5 meters squared (See Figure 6). With a nominal on-orbit weight of approximately 2,160 kilograms, this results in a change of A/M of 0.0021 meters squared per kilogram. For comparison, the corresponding values for the previous GPS SVs are 0.0015 (IIF), 0.0017 (IIR), and 0.0013 (IIA) meters squared per kilogram.

    Figure 6: Size of GPS satellite body’s cross-sectional area exposed to sunlight.
    Figure 6: Size of GPS satellite body’s cross-sectional area exposed to sunlight.

    Given the size and shape of Block III spacecraft, an appropriate radiation force model is considered mandatory to achieve the highest orbit accuracy possible. With that said, we empirically derived a set of background force models for the first five GPS III satellites. Our approach rests on dynamical long-arc (9-day) fitting to precise orbit data spanning up to three years and the following low-order Fourier functions of the Earth-spacecraft-Sun angle ε to represent the radiation force in the satellite body-fixed system:

    Photo:

    The Fourier coefficients (XS1, XS2, XS3, YC2, ZC1, ZS2 and ZS4) are iteratively adjusted together with initial epoch state, a constant Y-axis bias, and 1‐cycle per revolution along‐track parameters to best fit the orbit data in a least-squares sense. All individual 9-day arc solutions are rigorously combined on a normal equations level to form a robust set of Fourier model coefficients for each satellite or group of satellites.

    ORBIT OVERLAP TESTS

    Figure 7: Impact of horizontal antenna PCOs and Fourier force model on day-boundary orbit overlap errors.
    Figure 7: Impact of horizontal antenna PCOs and Fourier force model on day-boundary orbit overlap errors.

    To investigate the effect of the transmit antenna PCOs and the Fourier force models on the satellite orbits, we use our ESA/IGS processing strategy to generate dynamic 24-hour-arc solutions spanning January 2020 to December 2022, first with zero PCO and the non-zero horizontal offsets from Table 1 and no a-priori radiation force model, then with the non-zero offsets and the additional Fourier model in the background. The direct comparison of the generated orbits reveals significant differences for the Block III satellites of about 0.1 meters (3D).

    To demonstrate the improved performance of the non-zero offsets and the Fourier model, we take the orbits for successive days and look at the midnight epoch where they overlap. The difference in the orbit position, subsequently referred to as “overlap error,” gives us a worst case estimate of the satellite orbit accuracy. Comparison of the overlap errors provides evidence that the Block III orbits are much more accurate when using the non-zero rather than the zero X and Y PCOs. The overall 3D overlap RMS reduces from 49.5 millimeters (with zero PCOs) down to 32.3 millimeters (with non-zero PCOs). Results for the Sun elevation regions below 45 degrees, in particular, show significant improvement (see Figure 7).

    Use of the Fourier model has additional positive impact on the overlaps. Comparing the orbits produced with and without the a-priori radiation force model, we see a decrease in the 3D overlap error RMS from 32.3 to 29.7 millimeters averaged over all satellites. The orbit component that benefits most from both the improved antenna phase and the advanced force modeling is the one normal to the satellite orbital plane (across track). The SVs improving the most are SVN 75 and SVN 78, though significant improvements can be seen for all other satellites too (see Table 2).

    Table 2: Day-boundary overlap RMS errors of GPS III spacecraft orbits in millimeters.
    Table 2: Day-boundary overlap RMS errors of GPS III spacecraft orbits in millimeters.

    EMPIRICAL PARAMETER ESTIMATES

    Another means of assessing the quality of spacecraft models is the size and variability of the five-plus-three empirical dynamic radiation pressure parameters that we still estimate on a daily basis for each GNSS satellite in addition to its a-priori force model. Introducing the non-zero PCO and Fourier models into the POD turned out to reduce the size of the empirical parameters and their dependency on the satellite-Sun geometry to a great extent as the example in Figure 8 demonstrates.

    Figure 8: Impact of horizontal antenna PCOs and Fourier force model on empirical once-per-revolution acceleration term BC.
    Figure 8: Impact of horizontal antenna PCOs and Fourier force model on empirical once-per-revolution acceleration term BC.

    NARROW-LANE AMBIGUITY FRACTIONALS

    Integer ambiguity resolution — that is, resolving the unknown cycle ambiguities of double-differenced carrier-phase data to integer values — is considered indispensable to GNSS satellite POD and commonly results in a factor of two improvement in orbit precision. Of particular importance is the narrow-lane ambiguity that results from combining the carrier-phase measurements from a pair of GNSS frequencies. One of the intermediate steps in the ambiguity resolution algorithm is the fixing of the double-differenced narrow-lane ambiguities to integer values. For reliable fixing, the fractional part of the difference between the integer and decimal (float) values should be as close as possible to zero and follow a symmetrical distribution. The “tailedness” of the distribution curve may be characterized by its kurtosis — the larger the kurtosis, the fewer values are in the tails of the distribution and the more peaked is the distribution. In other words, the larger the kurtosis, the closer the “fractionals” cluster around zero, the more ambiguities can be resolved with higher confidence, and the more accurate the resolved solution. Moreover, as satellite orbit and antenna phase center errors do not cancel out completely through double-differencing, the narrow-lane kurtosis may also be considered as an indicator for the accuracy of the satellite force and phase center models that were used. The results in Figure 9 show that the non-zero horizontal PCOs bring a major improvement and that the Fourier force model does give some additional benefit.

    Figure 9: Impact of horizontal antenna PCOs and Fourier force model on fractional part of double-differenced narrow-lane ambiguities.
    Figure 9: Impact of horizontal antenna PCOs and Fourier force model on fractional part of double-differenced narrow-lane ambiguities.

    CONCLUSIONS

    Adding a new GNSS satellite type to high-precision multi-GNSS solutions requires detailed knowledge and understanding of the satellite type. Key issues are the transmit antenna phase center parameters, the satellite’s attitude, and the radiation pressure forces acting on its surfaces.

    In this article, improved antenna phase center, attitude, and radiation pressure models for the current series of GPS Block III spacecraft have been developed using multiple years of in-flight orbit and tracking data. A number of internal metrics such as post-fit carrier-phase residuals, day-boundary orbit differences (overlaps), empirical acceleration parameters, and carrier phase ambiguity statistics have been used to gauge the models’ performances. Overall, the results underscore the importance of the models for GPS III orbit determination. This applies primarily to the radiation force and the antenna phase center model, or more precisely, the horizontal (X and Y) offsets of the phase center model whose existence has been neglected for years in the analysis of GPS III data.

    Comparison of the overlap statistics suggest that orbits generated based upon updated (non-zero) phase center corrections and ESA/ESOC’s new (Fourier-based) radiation pressure model in the background are better by almost a factor of two. The average overlap RMS errors calculated across all current Block III SVs and for each orbital component (radial, along track and across track) dropped from 21 , 28 and 35 millimeters down to 14, 21 and 16 millimeters, respectively.

    More relevant when it comes to processing GPS data recorded on board low-flying satellites such as Sentinel-6 Michael Freilich or Jason-3, is the extension of the current IGS Block III antenna PCV model beyond a 14-degree boresight angle. After applying the extended PCV corrections, we reduced Block III carrier-phase residuals by 20% with no or few systematic signatures remaining, unlike the residuals produced with the current IGS antenna model. The IGS is strongly encouraged to adopt the Block III PCV extension into their antenna model to continue to support GPS-based POD of low-Earth-orbiting satellites.

    For further details on ESA/ESOC’s solar radiation pressure modeling approach, see our paper “GPS III Radiation Force Modeling” presented at the IGS 2022 Virtual Workshop: click here.


    FLORIAN DILSSNER is a satellite navigation engineer in the Navigation Support Office at the European Space Operations Centre (ESOC) of the European Space Agency (ESA), Darmstadt, Germany. He earned his Dipl.-Ing. and Dr.- Ing. degrees in geodesy from the University of Hannover, Germany.

    TIM SPRINGER has been working for the Navigation Support Office at ESA/ESOC since 2004. He received his Ph.D. in physics from the Astronomical Institute of the University of Bern in 1999.

    FRANCESCO GINI is a satellite navigation engineer in the Navigation Support Office at ESA/ESOC. He received his Ph.D. in astronautics and space sciences from the Centro di Ateneo di Studi e Attività Spaziali at the University of Padova in 2014.

    ERIK SCHÖNEMANN is a satellite navigation engineer in the Navigation Support Office at ESA/ESOC. He earned his Dipl.-Ing. and Dr.- Ing. degrees in geodesy from the University of Darmstadt, Germany.

    WERNER ENDERLE is head of the Navigation Support Office at ESA/ESOC. He holds a doctoral degree in aerospace engineering from the Technical University of Berlin, Germany.

  • Orolia’s GNSS simulator to break high-capacity barrier

    Orolia’s GNSS simulator to break high-capacity barrier


    Image: Orolia
    Image: Orolia

    Orolia’s Skydel, its GNSS simulation software, can now generate more than 500 simulated satellite signals. This platform is suitable for GNSS users, experts and manufacturers, as well as users needing a low-Earth-orbit-capable simulation system.

    Skydel contains a feature that includes multi-constellation and multi-frequency signal generation, remote control from user-defined scripts, and integrated interference generation.

    “With more and more customers simulating multipath and jamming scenarios, and the need for more signals in more applications — even beyond traditional simulators — the need for high capacity has never been greater,” said Pierre-Marie Le Veel, Orolia’s simulation product director. “The Skydel engine opens the possibility for users to escalate to more than 1,000 signals and not be limited by hardware design.”

    In addition to generating a high channel and satellite count, Skydel can also produce navigation warfare signals without any additional hardware.

  • Rohde & Schwarz launched drone-based analyzer

    Rohde & Schwarz launched drone-based analyzer


    R&S EVSD1000 has been designed to provide a mounting adaptor for installation onto medium-size drone types. (Image: Rohde & Schwarz)
    R&S EVSD1000 has been designed to provide a mounting adaptor for installation onto medium-size drone types. (Image: Rohde & Schwarz)

    Rohde & Schwarz has launched its EVSD1000 VHF/UHF nav/drone analyzer at Airspace World 2023 in Geneva March 8-10. The analyzer provides highly accurate drone inspection of terrestrial navigation and communications systems.

    The EVSD1000 VHF/UHF nav/drone analyzer is a signal-level and modulation analyzer for medium-sized drones. It features measurements of instrument landing systems, ground-based augmentation systems and VHF omnirange ground stations. The mechanical and electrical design is optimized for drone-based, real-time measurements of terrestrial navigation systems with up to 100 measurement data sets per second.

    The analyzer provides high-precision signal analysis in the frequency range from 70 MHz to 410 MHz. This also includes the needed measurement repeatability to ensure results from drone measurements can be compared to flight and to ground inspections in line with ICAO standards.

    The EVSD1000 VHF/UHF nav/drone analyzer reduces runway blocking times, provides necessary measurement repeatability and offers measurement precision and GNSS time and location stamps. While streaming measurement data during a drone flight via the data link to a PC on the ground, the analyzer can also buffer data internally to ensure no results are lost if the data link is lost.