Category: Survey

  • GPS key to monitoring Kilauea eruption, lava lake

    GPS key to monitoring Kilauea eruption, lava lake

    2020 Ends with a Bang as Kilauea Volcano Erupts

    Beginning in September, GPS stations in Kilauea’s upper East Rift Zone observed increased rates of uplift, higher than they have been since the end of the eruption in 2018. According to the U.S. Geological Survey’s Hawaiian Volcano Observatory, earthquake rates increased in late November.

    On Dec. 2, GPS stations and tiltmeters recorded a ground deformation quake at Kilauea’s summit accompanied by earthquake swarms.

    Then on Sunday, Dec. 20, a magnitude 4.4 earthquake struck on Kilauea’s south flank and three fissure vents broke open inside the caldera. Fountaining lava at these vents is estimated to be up to 82 feet high. The vents are feeding lava flows into the base of Halema‘uma‘u crater, which is being filled with lava. The lava lake has been rising several yards an hour since the eruption began at 9:36 p.m. Sunday. The eruption is currently confined to the crater.

    According to the observatory, “The water lake at the summit of KIlauea has boiled away and an effusive eruption has commenced, with three vents in the wall of Halema‘uma‘u crater generating lava flows that are contributing to a growing lava lake at the base of the crater.”

    As of Dec. 29, the summit eruption continued with the western vent active (the other vents have been covered by the lava lake). At 3:45 a.m. HST, field crews measured the lava lake as 179 meters (587 feet) deep, about 650 feet below the rim.

    Shortly after 9:30 p.m. HST Dec. 20, an eruption began at the summit of Kīlauea Volcano in Hawaii. Red spots indicate fissure vents feeding lava into the bottom of Halema‘uma‘u crater. Lava coverage is 32 feet higher than the water in this photo (base map is from imagery collected on Sept. 23, 2020).
    Shortly after 9:30 p.m. HST Dec. 20, an eruption began at the summit of Kīlauea Volcano in Hawaii. Red spots indicate fissure vents feeding lava into the bottom of Halema‘uma‘u crater. Lava coverage is 32 feet higher than the water in this photo (base map is from imagery collected on Sept. 23, 2020).
    The water lake at the base of Halema‘uma‘u crater has been replaced with a growing lava lake. View from the west rim of Kīlauea Caldera just before 5 a.m. HST on Dec. 21, 2020. A 59-foot fountain joins two other fissures to feed a growing lava lake at the base of Halema‘uma‘u crater. (Photo: USGS)
    The water lake at the base of Halema‘uma‘u crater has been replaced with a growing lava lake. View from the west rim of Kīlauea Caldera just before 5 a.m. HST on Dec. 21, 2020. A 59-foot fountain joins two other fissures to feed a growing lava lake at the base of Halema‘uma‘u crater. (Photo: USGS)
    The interactive USGS monitoring map shows GPS stations situated on and around Kilauea as well as volcano activity. (screenshot taken at 12 p.m. HST on Dec. 21).
    The interactive USGS monitoring map shows GPS stations situated on and around Kilauea as well as volcano activity. (screenshot taken at 12 p.m. HST on Dec. 21).
    An HVO geophysicist deploys a GPS receiver on the Kilauea caldera floor to measure changes in ground motion. A volcanic gas plume rises in the background. (Photo: USGS)
    An HVO geophysicist deploys a GPS receiver on the Kilauea caldera floor to measure changes in ground motion. A volcanic gas plume rises in the background. GPS and tiltmeter data show contraction in the upper portion of the East Rift Zone (an area between Kīlauea’s summit and Pu‘u ‘Ō‘ō). (Photo: USGS)
  • Eos Positioning enables using Esri Collector for ArcGIS and Survey123 concurrently

    Eos Positioning enables using Esri Collector for ArcGIS and Survey123 concurrently

    Photo: Eos Positioning
    Photo: Eos Positioning

    Eos Positioning Systems Inc. (Eos) has released capability in its Eos Tools Pro apps (iOS, Android, Windows) that allows Esri Collector for ArcGIS and Survey123 to run concurrently, allowing the user to dynamically switch between the two apps in the field.

    “Without this capability, users could not run two data-collection apps, such as Collector and Survey123, or ArcGIS Field Maps and ArcGIS QuickCapture, at the same time,” Eos Chief Technology Officer Jean-Yves Lauture said. “With this release, parties can run multiple apps on a single device that simultaneously consume high-accuracy positioning data from the Arrow GNSS receiver.”

    This new capability allows fieldworkers to run two apps at the same time while accessing the same ArcGIS Online database. Specifically, a user can now record a high-accuracy GNSS location in Collector and then immediately switch to an open Survey 123 form to complete their workflow. The data, including precise positioning will be populated to the same ArcGIS Online database.

    “Eos is excited to enable its users with this unique capability to extend Esri mobile apps,” Lauture said. “Esri users have been asking us about combining Collector and Survey123 data collection for quite some time, and we are happy to further increase their high-accuracy data collection efficiency.”

  • ArcGIS web app incorporates datasets, NGS data layers for surveyors

    ArcGIS web app incorporates datasets, NGS data layers for surveyors

    My last column described a new National Geodetic Survey (NGS) webtool for obtaining geodetic information about a passive mark in their database. The column highlighted some features that may be of interest to GNSS users. It provides all of the information about a station in a more user-friendly format. This column highlights an ArcGIS web application that incorporates various California specific datasets and NGS data layers to assist surveyors planning vertical control surveys. The GNSS Leveling Web Application was provided to me by Jay Satalich, chief, Office of Surveys, Caltrans (see box titled “Linkedin Notification from Jay Satalich).

    Linkedin Notification from Jay Satalich

    Supervising Transportation Survey (Chief, Office of Surveys) at State of California, Department of Transportation:

    “GNSS Leveling Web Application” [is] an Esri ArcGIS online web app created for my “GNSS Leveling” students at College of the Canyons. Designed as a practical tool when planning vertical control surveys using GNSS. National datasets include: National Spatial Reference System (layers: satellite visibility, stability, and vertical control source), geology, and GEOID18 (layers: GEOID18 height, difference between GEOID18 and GEOID12B, and GEOID18 uncertainty). California-specific datasets include: oil/gas/fracking/injection wells, fault lines, oil fields, groundwater basins, and landslide areas. The NOAA National Geodetic Survey data layers were created and published by Brian Shaw. People who influenced development of this app include Dave Zilkoski, Kevin M Kelly, Ken Hudnut, David D Jackson, Ross S. Stein, and Arthur Sylvester.

    Go to the app here.

    The box titled “GNSS Leveling Web Application” depicts a map of the Los Angeles area that provides the list of published marks in NGS’ database with an overlay of the uncertainty of NGS’ hybrid geoid model GEOID18. Plotting the published marks from NGS’ database is very useful for surveyors reconning marks for a GNSS survey project. The attributes allow users to quickly identify stations that have published heights from leveling adjustments projects (labeled as ADJUSTED) and those that have heights published from GNSS adjustments projects (labeled as GPS OBS). (See here for definition of attributes.)

    GNSS Leveling Web Application

    (https://www.arcgis.com/apps)

    Source: Esri ArcGIS GNSS Leveling Web Application
    Source: Esri ArcGIS GNSS Leveling Web Application
    Source: Esri ArcGIS GNSS Leveling Web Application
    Source: Esri ArcGIS GNSS Leveling Web Application

    Source: Esri ArcGIS GNSS Leveling Web Application
    Source: Esri ArcGIS GNSS Leveling Web Application

    The list all of the layers of the web application are provided in the box titled “GNSS Leveling Web Application Layers.” (Note: After you open up the web application, click on the Layers icon to obtain the list of available layers.)

    GNSS Leveling Web Application Layers

    Source: Esri ArcGIS GNSS Leveling Web Application
    Source: Esri ArcGIS GNSS Leveling Web Application
    Source: Esri ArcGIS GNSS Leveling Web Application
    Source: Esri ArcGIS GNSS Leveling Web Application
    Source: Esri ArcGIS GNSS Leveling Web Application
    Source: Esri ArcGIS GNSS Leveling Web Application

    Source: Esri ArcGIS GNSS Leveling Web Application
    Source: Esri ArcGIS GNSS Leveling Web Application

    As you can see from the list of layers, the web application enables users to select the layers that are pertinent to their survey project requirements. The application is designed for California surveyors but the concept is transferable to other States. For example, the following layers are not just for California surveyors: Arizona water wells, Louisiana oil and gas well, U.S. oil and natural gas wells, Principal Aquifers of the United States, and, of course, all of the NOAA NGS data layers.

    One layer that is very important to California users is the layer that provides the fault activity in their region. The box titled “Fault Activity Map of California: Pre-Quaternary and Quaternary Faults – Quaternary Faults” depicts the list of published marks in NGS’ database with an overlay of the fault activity map.

    Fault Activity Map of California: Pre-Quaternary and Quaternary Faults — Quaternary Faults

    Source: Esri ArcGIS GNSS Leveling Web Application
    Source: Esri ArcGIS GNSS Leveling Web Application

    Another great feature of the application is that it has a layer providing the satellite visibility code for published NSRS marks (see the box titled “Published NSRS Stations (by satellite visibility”). Once again, a great feature for field personnel performing reconnaissance.

    Published NSRS Stations (by satellite visibility)

    Source: Esri ArcGIS GNSS Leveling Web Application
    Source: Esri ArcGIS GNSS Leveling Web Application

    The application also has a feature that lists the marks that were involved in the development of NGS’ hybrid geoid model GEOID18. (see the box titled “GNSS Leveling Web Application GEOID18 GPS on Bench Mark Layer”). Clicking on a mark’s icon provides information and statistics about the mark (see boxes titled “GEOID18 GPS on Bench Mark Layer — PID EW6989” and “Information for GPS on Bench Mark for PID EW6989”). This is one of the layers that provides information for the entire CONUS region. All this information is available from NGS’ website but this application incorporates all of NGS’s data as well as the local information in one application. This web application is very useful to a surveyor planning a survey project and/or providing information to a field reconnaissance team.

    GNSS Leveling Web Application GEOID18 GPS on Bench Mark Layer

    Source: Esri ArcGIS GNSS Leveling Web Application
    Source: Esri ArcGIS GNSS Leveling Web Application

    GEOID18 GPS on Bench Mark Layer — PID EW6989

    Source: Esri ArcGIS GNSS Leveling Web Application
    Source: Esri ArcGIS GNSS Leveling Web Application

    Information for GPS on Bench Mark for PID EW6989

    Source: Esri ArcGIS GNSS Leveling Web Application
    Source: Esri ArcGIS GNSS Leveling Web Application

    Source: Esri ArcGIS GNSS Leveling Web Application
    Source: Esri ArcGIS GNSS Leveling Web Application

    Users that are participating in NGS’ GPS on Bench Mark program can click on the layer for “NGS GPS on Bench Marks Transformation Service Tool, priority 10 km hex” to determine marks that need to be occupied by GNSS to improve a transformation tool being developed by NGS. See boxes titled “NGS GPS on Bench Marks Transformation Service Tool, priority 10 km hex” and “Information for GPS on Bench Mark Priority List for PID EW6989.” There’s also layers that depict the priority mark list for the GPS on Bench Marks program (“NGS GPS on Bench Marks Transformation Tool Service — priority mark list”) and the 2 km hexagon priority grid (“NGS GPS on Bench Marks Transformation Tool Service — priority 2km hex”).

    NGS GPS on Bench Marks Transformation Service Tool, priority 10 km hex

    Source: Esri ArcGIS GNSS Leveling Web Application
    Source: Esri ArcGIS GNSS Leveling Web Application

    Information for GPS on Bench Mark Priority List for PID EW6989

    Source: Esri ArcGIS GNSS Leveling Web Application
    Source: Esri ArcGIS GNSS Leveling Web Application
    Source: Esri ArcGIS GNSS Leveling Web Application
    Source: Esri ArcGIS GNSS Leveling Web Application
    Source: Esri ArcGIS GNSS Leveling Web Application
    Source: Esri ArcGIS GNSS Leveling Web Application

    Source: Esri ArcGIS GNSS Leveling Web Application
    Source: Esri ArcGIS GNSS Leveling Web Application

    Individuals interested in participating in NGS’ GPS on Bench Mark program should register for NGS’ Dec. 10 webinar, which will discuss the status of the program. See the box titled “GPSonBM Transformation Tool Campaign Update — 12 months remaining” for the information on the webinar. Users can register for the webinar here. I would encourage all users to access the web application tool developed by Jay and/or NGS’ website before participating in the next NGS GPS on Bench Mark webinar.

    GPSonBM Transformation Tool Campaign Update — 12 months remaining

    (NGS webinar series)

    Screenshot: National Geodetic Survey
    Screenshot: National Geodetic Survey

    Almost all of my columns have focused on establishing accurate GNSS heights. Most of my 45 years of working in the field of geodesy has been focused on heights; that is, leveling-derived orthometric heights, GNSS-derived orthometric heights, and geoid heights. Gravity is very important to estimating all of these types of heights. Recently, a colleague sent me a video proving Galileo’s famous gravity experiment. It’s an older video (November 2014), but it’s really fascinating. You can see the entire video here. Another individual pointed me toward the same experiment performed on the Moon during the Apollo 15 mission. What’s amazing to me is that over 400 years ago an individual spent time studying the effects of gravity and developing the concept of acceleration due to gravity. I wonder what the world would look like today if Galileo would have just accepted Aristotle’s theory of gravity (which states that objects fall at speed proportional to their mass) and decided to focus on other tasks. Saying that, I am amazed that most geospatial users do not realize the importance of gravity (and physical geodesy) in the development of the geospatial products and services that they use daily; and, how critical it is that more research is required to meet future geospatial needs. The advancements in satellites and computers have enabled geodesy to expand into many different disciplines. Geodetic science and technology now underpin many sciences, large areas of engineering (such as driverless vehicles and drones), navigation, precision agriculture, smart cities, cellular telephones, and location-based services. (See the GPS World First Fix column about the shortage of American geodesists).

    When I end one of my presentations, I always emphasize that Geodesy Provides the Foundation for all Geospatial Products and Services, and Integrated and Collaborative Organizations Create Geospatial Solutions. Geodesy is just as important today as it was 400 years ago.

    I hope everyone stays safe during this COVID-19 pandemic and enjoys the holidays.

  • Latest OxTS tool combines inertial and lidar point-cloud data

    Latest OxTS tool combines inertial and lidar point-cloud data

    The OxTS Georeferencer combines INS and point-cloud data from third-party lidar sensors. (Image: OxTS)
    The OxTS Georeferencer combines INS and point-cloud data from third-party lidar sensors. (Image: OxTS)

    OxTS  is offering its new OxTS Georeferencer, a powerful lidar georeferencing software tool. OxTS Georeferencer combines OxTS inertial navigation data with raw lidar data to give surveyors the ability to create georeferenced point clouds along with tools to calibrate their setup and analyze the accuracy of their surveys.

    Users can now combine data from their OxTS inertial navigation system (INS) with a much broader range of lidar sensors. The OxTS Georeferencer works with pointclouds from Hesai, Ouster and Velodyne lidar sensors. New sensors brought to market can be quickly and easily added to OxTS Georeferencer.

    This release ensures that surveyors can easily and confidently use OxTS Inertial Navigation Systems and OxTS Georeferencer, to produce georeferenced point clouds irrespective of the LiDAR scanner they prefer to use.

    The OxTS Georeferencer gives surveyors flexibility in terms of the hardware they may use to survey their environment.

    Users can combine OxTS INS data with data from the following models:

    • Velodyne. VLP-16 Puck, Puck LITE (beta), VLP-32C (beta) and Alpha Prime VLS128 (beta). The Velodyne VLP-32C sensor is single-return mode only.
    • Hesai. Pandar40P
    • Ouster. All Ouster Gen2 lidar, The OS1 and OS2 lidar with 32, 64 and 128 lasers (all Ouster integrations, other than the OS1-64 in uniform laser distribution, are in beta.)

    Features of this release include:

    • Improved calibration. Take advantage of a broader range of set-ups without extensive planning and set-up costs. A data-driven calibration technique helps to get the best results from your set-up. It eliminates blurring and double-vision, especially at longer distances. The new version now can calibrate angles AND linear displacements. Please note that LIP calibration is in beta.
    • Error estimation. Gain more control over your point-cloud. The new pointcloud error estimation uses a sophisticated formula together with OxTS navigation data diagnostics. These are then used to estimate the centimetre uncertainty in point positions. Users can then choose a maximum uncertainty to be included or remove inaccurate points.
    • Dual return. Provide customers with enhanced point-cloud images. The new version of OxTS Georeferencer includes dual return capability for nearly all supported models. Where available, this will give point clouds much higher definition. Users can then present enhanced point-cloud images to customers and internal stakeholders as well as service specific applications.
    • Easily integration of new lidar families. This latest version of OxTS Georeferencer supports the future proofing of other new LiDAR sensors. It allows users to quickly and simply add new LiDAR families to the framework. If there are any LiDAR sensors NOT currently integrated that you want to see, contact OxTS and they will consider them.

    For more information on OxTS Georeferencer or to arrange a demonstration, contact OxTS – OxTS Georeferencer.

    Also, OxTS is hosting a webinar at 15:00 hrs (GMT) on Wednesday, Dec. 9, on “What’s New in OxTS Georeferencer.”

  • UC Denver to establish Trimble lab for College of Engineering, Design and Computing

    UC Denver to establish Trimble lab for College of Engineering, Design and Computing

    Photo: Trimble
    Photo: Trimble

    The University of Colorado – Denver has received a significant gift from Trimble to establish a state-of-the-art technology lab for the College of Engineering, Design and Computing.

    The gift will also support the departments or programs in construction engineering and construction management, geography and environmental sciences, physics, and urban and regional planning. The lab will expand the university’s access and expertise in a customized suite of construction hardware and software products.

    Trimble’s broad Connected Construction portfolio enables professionals along the project lifecycle to accelerate project processes — improving productivity, quality, transparency, safety and sustainability, while reducing waste.

    The Trimble Technology Lab will provide students enrolled across relevant programs hands-on experience with a wide breadth of Trimble solutions. The lab will expand the university’s access and expertise in project management, architectural and structural analysis, design and engineering, mixed reality, 3D scanning, office-to-field solutions, and GIS data collection and GNSS positioning.

    Partnering with Trimble allows the University of Colorado – Denver to integrate the latest technology into its curricula, empowering graduates to rapidly transform how buildings and living environments are designed and constructed.

    The lab will include a broad range of Trimble’s technologies.

    • Hardware includes the Trimble XR10 HoloLens with hardhat, TX8 3D laser scanner, Trimble SiteVision AR system, R12 GNSS systems, Juno 5D handheld scanner, Geo 7x mobile GNSS data collectors, robotic total stations and field tablets.
    • Software solutions include RealWorks scanning software, Trimble Business Center, Tekla Structures, Tekla Structural Designer, Tekla Tedds, Trimble Connect, ProjectSight, Viewpoint, TILOS, Trimble Positions Desktop, TerraSync and TerraFlex, eCognition, and the company’s 3D modeling software, SketchUp Pro.

    “CU Denver is right in our backyard, providing an exciting opportunity to integrate our industry-leading technologies into a wide range of educational programs. Their proximity enables us to work closely while ensuring easy access, training and support, and success in all aspects of implementation,” said Allyson McDuffie, director of Education & Outreach at Trimble. “Trimble’s education and outreach programs aim to support the next generation of influencers by actively working with key education institutions to ensure Trimble’s portfolio of solutions are accessible and implemented in higher education curricula and research programs, creating a new workforce equipped and empowered to ‘Transform the Way the World Works.’”

    Martin Dunn, dean of the College of Engineering, Design and Computing, said, “I am thrilled with and grateful for this exciting relationship with Trimble. It will accelerate our strategic vision to educate diverse graduates who will not only make an immediate impact in the AEC industry, but will emerge as its future leaders. The generous gift will have broad impact across our campus, nucleating the kind of interdisciplinary collaboration among engineers, architects, construction managers, and scientists that is needed to create and exploit technological innovation to address grand challenges facing the built environment including digital transformation, sustainability, and the future of work and the workforce.”

    “Our students and faculty could not be more excited to have access to Trimble technologies. Trimble is a company of international importance, which is also right down the road from our campus. In establishing this new lab, our students will be exposed, either virtually or on-site, to cutting edge products and innovation as well as benefit from direct access to the many professionals in Trimble’s worldwide network. Trimble is exactly the type of company that gets our students excited about pursuing careers in construction and engineering,” said Caroline Clevenger, associate professor and director of Construction Engineering and Management.

  • Topcon GNSS to assist Bridges to Prosperity efforts in Africa

    Topcon GNSS to assist Bridges to Prosperity efforts in Africa

    A shipping container with several pieces of key GNSS and survey instrumentation is bound for the East African country of Rwanda. The equipment, an in-kind donation from Topcon Positioning Group, will be used in support of Bridges to Prosperity (B2P), an organization committed to building trail bridges to improve the lives of people in rural areas worldwide.

    Photo: Bridges to Prosperity
    Photo: Bridges to Prosperity

    According to B2P, almost a billion people around the world lack safe access to critical resources like healthcare, education, or employment due to an impassable river. Building safe, structurally sound trail bridges for people to travel by foot, bicycle, or motorcycle has an immediate, impactful effect on the lives of those in the area.

    “We are fortunate that, even with challenges presented by the COVID-19 pandemic, we have been able to implement new safety measures with limited disruption to our building schedule,” said Devin Connell, B2P’s corporate program director. “Right now, our surveying efforts predominantly involve simple equipment such as auto levels and range finders, which can be time consuming when complex survey information is needed. The equipment from Topcon will increase our surveying capabilities, streamline the design process, and support us in building more trail bridges for isolated communities.”

    Photo: Bridges to Prosperity
    Photo: Bridges to Prosperity

    In addition to the instruments — a pair of GNSS receivers, two total stations and data collectors — B2P will have access to the Topcon suite of software products, which will assist both the design process and the transfer of files from the field to their remote office or the engineering team working with them. According to Ron Oberlander, vice president of Topcon Global Professional Services group, however, the company’s role extends well past the equipment itself.

    “We are excited to be a contributing part of this program,” he said. “But, in order for B2P to use these solutions to their fullest and increase their overall productivity, a training effort will be needed and we’re already setting plans in place for that to happen.

    “In addition to conducting online virtual training sessions with B2P staff, we are making eLearning possible by allowing access to MyTopcon, our company knowledge portal. With these tools, they can gain familiarity with their receiver or total station or use the Topcon software to learn how to collect points — all without having us there. They want to be able to hit the ground running once the equipment arrives and this will help make that happen.”

    Connell said that their improved survey capability will help accelerate the company’s bridge building. “We go out and survey a year in advance, looking at as many as 100 different remote sites and, tough as it might be, establish priorities with the local governments. We are looking forward to our continued growth in 2021 and, thanks to the generosity of companies like Topcon, that process will be a much better one.”

  • Editorial Advisory Board PNT Q&A: Advancing bathymetry

    Editorial Advisory Board PNT Q&A: Advancing bathymetry

    Which recent GNSS/INS innovations have been most helpful in advancing bathymetry? Which upcoming ones will be?

    Headshot: Miguel Amor
    Miguel Amor

    “Development of PPP removed reliance on shore-based RTK base stations, allowing operation almost anywhere on the oceans. Continued performance improvement in FOG and MEMS INS, along with bathymetric sensors, provide cost-effective solutions while also providing more accurate seabed maps. The future will see increased PPP accuracy with faster convergence and continued improvement in INS, coupled with increased resolution of bathymetric sensors, leading to more of the oceans mapped using autonomous platforms.”
    Miguel Amor, 
    Hexagon Positioning


    Bernard Gruber
    Bernard Gruber

    “While GNSS has been a clear contributor to Earth mapping, it is an altogether different dilemma to solve ‘submarine topography’ mapping. Given recent developments in the IMU and lidar markets, one can readily utilize these sensors to correct for roll, pitch, and yaw, and produce digital maps, respectively. Combining these sensors with GNSS receivers, mounted on a drone for example, can allow for precise measurements in areas of tidal shifts or dynamic variations of water depth.”
    Bernard Gruber,
    Northrop Grumman

  • Hexagon’s ‘RTK from the Sky’ brings instant GNSS accuracy worldwide

    Hexagon’s ‘RTK from the Sky’ brings instant GNSS accuracy worldwide

    New service provides PPP convergence for centimeter-level accuracy on land, air and marine applications around the world

    Research from Hexagon’s Autonomy & Positioning division has resulted in breakthrough innovations in precise point positioning (PPP) that enable nearly instant global centimeter-level accuracy. These developments pave the way to bring “RTK from the Sky” performance to worldwide users through correction service products and GNSS receivers from Hexagon.

    RTK from the Sky technology provides the quick accuracy of an RTK solution with the high accessibility and availability of PPP. Users will no longer have geographic or regional infrastructure restrictions — they will be free to operate anywhere around the world with the same premium level of positioning performance.

    RTK from the Sky technology removes the traditional PPP barrier of long convergence times as well as internet and radio communication limitations, delivering instantaneous convergence anywhere in the world. This breakthrough establishes the foundation for assured positioning with no downtime in marine, agriculture, and autonomous applications.

    To achieve these results, there must be masterful attention to detail throughout the entire positioning ecosystem: no errors conveniently cancelled and no errors ignored. All errors are carefully estimated and removed from the final GNSS position faster and more reliably than ever before.

    This end-to-end fine-tuning of measurement quality and error mitigation establishes the foundation for RTK from the Sky performance. No matter the location or application, users will be able to rely upon the highest availability and accuracy of corrections anywhere in the world, without the convergence time, Hexagon said.

    “In 2020, PPP has become RTK — without the mobility limitations,” said Sandy Kennedy, VP of Innovation at Hexagon’s Autonomy & Positioning division. “RTK from the Sky has been a very satisfying development. To see this kind of positioning performance available anywhere in the world is the realization of the next step of innovation for GNSS.”

    RTK from the Sky technology will be the foundation for future correction service products and applications from Hexagon built for diverse applications.

    See a white paper on RTK from the Sky.


    Feature photo: Nikada/E+/Getty Images

  • Unmanned survey vessel efficiently maps seabeds

    Unmanned survey vessel efficiently maps seabeds

    Sometimes hands-on data collection just isn’t good enough. In the busy Shizuoka harbor, Weichao Liu of CHC Navigation used the company’s Apache6 marine drone to take a bathymetric survey of a channel in preparation for dredging at a Shizuoka seaport. The Apache6 also collected 3D lidar data above the water’s surface.

    In May, CHC Navigation launched the 2020 Edition of the Apache6 USV (unmanned surface vessel), which combines a dual GNSS positioning and heading receiver, stable and reliable hull attitude sensors, and an inertial measurement unit (IMU). The CHCNAV GNSS/INS control box maintains high accuracy during transient GNSS outage, according to CHC Navigation, such as providing uninterrupted surveying while passing under bridges.

    Just like an aerial drone, the Apache6 has an auto return feature, and like it’s much larger manned brothers, it uses sonic radar (sonar) to avoid obstacles. Its fully autonomous survey mode is powered by CHCNAV absolute straight line technology so that the craft follows a predetermined path even in adverse current conditions.

    Besides 3D bathymetric surveys, the USV has been used for positioning of underwater objects, offshore construction, underwater archaeology and wreck salvage. It is equipped with a high-performance single-beam echosounder, and can be installed with lidar to create a combined marine and terrestrial 3D high-accuracy survey in a single pass, such as for harbor and river surveys with height clearance evaluation.

    Check out more water applications below.

    Guiding an unmanned vessel
    GNSS receivers track port movements with CORS corrections
    Amphibious excavators guided by GNSS in bay cleanup
    Construction company adopts positioning tech for marine projects
    Plug-and-play compass selected for survey package
    Resilient PNT critical to maritime advancement
    Manufacturer equips submarines with rugged tablets
    eCognition goes underwater to help conserve coral reefs
    Water utilities reduce expenses with mobile GIS
    Belgian company Seafar pioneers barge automation technology
    The shape of water: bathymetry in action


    Feature image: Weichao Liu, a member of CHC Navigation’s technical support staff, prepares to launch an Apache6 unmanned surface vessel, also known as a marine drone. (Photo: CHC Navigation)

  • The shape of water: bathymetry in action

    The shape of water: bathymetry in action

    As the skipper of Galileo 4, a 50-foot sailboat on the Columbia River, I instruct my crew to alert me if the water under the keel drops below 10 feet and take immediate action if it drops below 5 feet, because I cannot constantly monitor my chart to avoid running aground. Yet, the huge cargo ships that navigate the river for 100 miles from its mouth at Astoria to the Port of Portland sometimes have as little as two feet of vertical clearance.

    This feat of navigation is made possible by the knowledge, experience and electronic equipment used by the river pilots who steer the ships, the hydrographers who survey the river, and the dredge operators who perform the Sisyphean task of maintaining the required depth of the navigation channel. Each additional inch of draft they enable allows a ship to carry additional cargo worth up to several million dollars.

    In similar ways, marine professionals around the world cooperate to chart ocean bottoms and to keep ports, harbors and navigable waterways safe for the more than 90% of trade that is carried by ships. Additionally, off-shore installations—such as fiber optic cables, pipelines, drilling platforms and wind turbines—all require accurate surveys of the ocean floor. Finally, population growth in coastal areas and sea level rise due to climate change are driving the need for bathymetric data for planning and emergency management.

    Bathymetry

    For centuries, mariners recorded water depth using nothing more than a lead line, a compass, a sextant and a rudimentary nautical chart. This was such a time-consuming process, however, that they could only perform it for a tiny percentage of the world’s oceans and coastlines. Today’s technology makes the process not only more accurate, but also vastly more efficient.

    In deep waters, depth data is collected using huge multi-beam echo sounders (MBES) that operate at very low frequencies. As the depth decreases, smaller devices are used that operate at higher frequencies and, therefore, have higher resolution. However, close to shore, the efficiency of these devices drops dramatically, as the cone of their sound signal is cut off by the slope of the shelf. This is where airborne lidar sensors become a much more efficient means of collecting depth data.

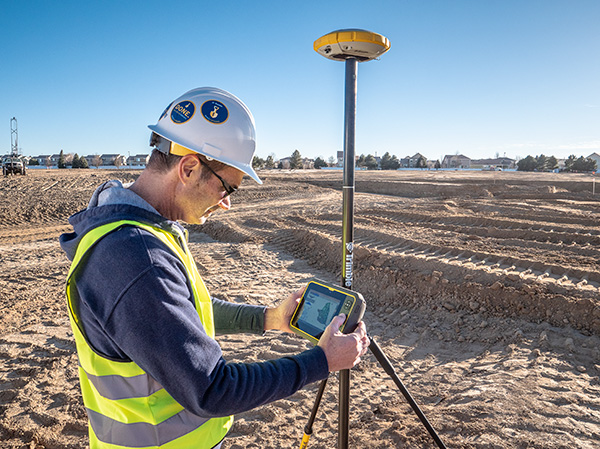
    In addition to data from the sounders, bathymetry requires data about the vessel’s location and attitude. The former, an obvious requirement for any kind of mapping, are collected by differential GNSS receivers. The latter, collected by an inertial measurement unit (IMU), are used to compensate for variations in the depth measurement depending on the vessel’s rotational movements (roll, pitch and yaw) and translational movements (heave, surge and sway). This is the same reason that aerial photogrammetrists use IMUs on aircraft.

    Challenges

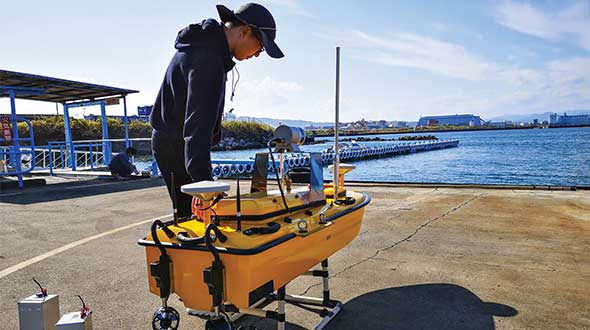
    Traditionally, MBES systems have been large, complex and expensive. However, they are rapidly becoming smaller, cheaper, quicker to deploy, and easier to use thanks in part to the introduction of inertial systems that use microelectromechanical systems (MEMS), said Ludovic Bazin, technical support manager for SBG Systems, which specializes in MEMS technology. “You can see that the new systems are being increasingly deployed in smaller autonomous vehicles, on smaller autonomous surface vessels (ASV), and even smaller vessels. So, people can go quickly in operation,” he said. An additional advantage, he pointed out, is that they do not require an export license.

    A key to accurate bathymetric surveys is reducing the error budget aboard the vessel, where the survey positions are tied back to a GNSS antenna. “You have errors all the way through the system,” said Richard Turner, vice president of global marine sales for Hexagon’s Autonomy & Positioning division, which caters mostly to the market for survey related to oil and gas. He attributes the largest improvements in recent years to the increase in accuracy using precise point positioning (PPP). “If you are out of range of real-time kinematic (RTK) and any other near-shore positioning, the accuracy of PPP is constantly improving,” he said. “It is getting down into the five-centimeter range horizontal or better than that.”

    Turner also pointed to the tight integration of inertial navigation system (INS) technology with other systems. “Every time you improve the accuracy of your system the specs go up,” he said. Therefore, the challenge is to ensure that the equipment is installed properly, which requires very accurate offset measurements. “It is no good having two centimeters position accuracy if your heading or your offsets are wrong.” Generally, he points out, boats are not designed for this type of installation, due to such things as long cable runs.

    Hexagon will send surveyors out with equipment from Leica, one of its divisions, to do the dimensional control and to calibrate the gyroscopes, which are another source of error. In 2014, Hexagon acquired Veripos. “Many of the people in the Veripos organization come from the offshore survey world or the dredging world, so it is very marine focused,” said Turner. “No other providers have the marine experience that we do.”

    For bathymetric software companies, the main current challenge is “keeping up with all the modern and cheaper hardware,” including RTK receivers, echo sounders, and side scan sonars, said Leon Steijger, owner and programmer at Eye4Software B.V., which makes the Hydromagic software.

    Requirements and capabilities

    To get accurate data, all position and depth records must be timestamped with high precision so that the location of the echo sounder pings can be calculated during post-processing, Steijger noted. “The software needs to be able to generate elevation maps, depth contours, and 3D terrain views and must support volume calculations to calculate how much water there is in a basin, or to determine how much material has been removed during dredging operations.”

    Hydromagic uses “plugins,” which are pieces of software that are loaded optionally to interface sensors with the software. “For some hardware we also offer a plugin containing a user interface that can be used to, for instance, upload a planned route to an automatic pilot or to control the signal processing parameters of an echo sounder.” Operators only need to specify the dimensions of their vessel and correct for the sound velocity and the static draft (the distance between the water surface and transducer). They see the vessel’s track in real time, but the rest of the data are post-processed.

    Hexagon controls its own correction services and the network that delivers them. “We obviously build our own GPS receivers, so we can tightly integrate inertial systems,” said Turner. “We use third-party inertial systems. However, because we have access to the tracking loops on the GNSS boards, we can tightly integrate that inertial system so it gives a level of coupling that’s difficult unless you are actually building those boards yourself.” While near-shore operations can use RTK or post-processing, he pointed out, “the offshore guys often use real-time positioning to collect data for oil and gas. And that is really where we come to the party, because we have all those services too.”

    SBG Systems designs, manufactures, and calibrates its own IMUs, then integrates them with GNSS boards, creating OEM products. “We also design and produce our own firmware algorithms to merge all those datasets,” said Bazin. “From the selection of the MEMS sensor to the final product, SBG will design, manufacture, develop, and produce the entire systems. We also provide tools for people to integrate our systems to develop their own libraries or to integrate our libraries into their systems and work with some integrators for APIs so they can control our systems from their own application.” The company’s post-processing system, Qinertia, integrates GNSS corrections with raw IMU data. “So, when we do post-processing, we reprocess an entire solution at the end for position, but also for stabilization for pitch, roll and heading,” Bazin explained. One of the benefits is the ability to remove many multipath effects.

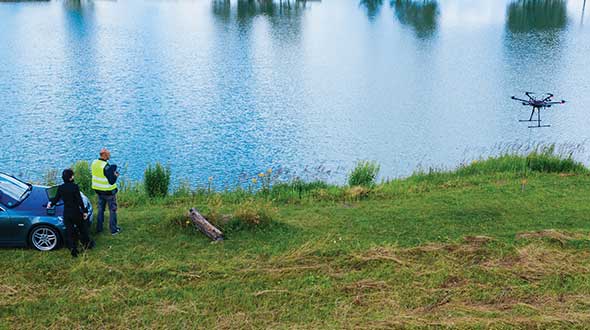
    For bathymetric surveys using an unmanned aerial vehicle (UAV), the control software must keep the platform at a constant altitude and speed over the surface of the water, because the echo sounder is dragged through the water at the end of a cable, explained Alexey Dobrovolsky, CTO of SPH Engineering, based in Riga, Latvia, which delivers UAV-related software. Therefore, he said, “missions should be executed in a fully automated mode.” His company’s software only requires the UAV’s operator to define the survey area, set the direction of the survey lines, and specify the distance between them. The software will handle everything else. “We automatically recalculate the depth measured from the echo sounder to the real depth in our data files using data from a radar altimeter,” he said. “Our software contains a high-end model of the echo sounder, which has a tilt sensor and a pitch sensor.”

    Of course, dragging an echo sounder from a UAV only works for small areas, such as in open pit mines where the liquid can be very contaminated. “The flight time with an echo sounder of the most popular UAV will be around 20 minutes,” said Dobrovolsky. “That determines the maximum length of the survey lines that can be covered by a single flight.”

    A couple of years ago, SPH began to provide some UAV-based bathymetry solutions that use low frequency ground-penetrating radar (GPR). There are two scenarios when GPR can be useful for bathymetry, Dobrovolsky explained. The first one is to do bathymetry through ice on the surface of lakes or rivers, which would require drilling holes to use an echo sounder. “With GPR, you can do bathymetry through the ice layer,” he said. The second scenario is mountain rivers with extremely strong currents, when it is not possible to use a standard manned or unmanned boat, because GPR works without contact with the water.

    Bathymetric systems are now also deployed on autonomous underwater vehicles (AUVs) that are only one to three feet long. “MEMS INS are compact and can be integrated directly with MBES systems, which provide an all-in-one compact system that can be easily deployed and operated because they are lightweight and their mechanical alignments are known and fixed,” said Bazin. “Some of these systems can go 2,000 meters below the surface of the water.” In post-processing, he pointed out, some MEMS INS can have an angular accuracy as low as 0.07 degrees for the vessel’s pitch and roll and a heading accuracy of as little as 0.01 degrees.

    Outputs

    To integrate diverse sensors with a UAV, SPH developed an onboard computer, called UgCS SkyHub, that logs data from the sensors. In the case of the echo sounder, it can be an NMEA stream or just a stream of current depth measurements, said Dobrovolsky. The device is also connected to the UAV’s autopilot, so it logs the platform’s position and speed, and with the altimeter. UgCS SkyHub can record three types of data files: a CSV file containing the coordinates, depths, and a few additional parameters; a file in NMEA 0183 format, which is also standard for bathymetry; and a SEG-Y file containing the full echo sounder data, including, for example, sediments and objects in the water.

    SBG Systems’ software has two kinds of outputs, Bazin explained. First, a proprietary binary format, as well as NMEA and ASCII formats, that are used to provide stabilization and navigation for the platform in real-time. Second, a standard as-built survey format for post-processing. “Then, we have very powerful tools to output ASCII files that are completely configurable from header to footer,” he added.

    Eye4Software’s main outputs are volume reports or plot sheets for end customers containing a map with depth colors and depth contours, as well as cross section views or XYZ export files for further processing in, for instance, AutoDesk Civil 3D and AutoCAD.


    Feature image: A UAV from SPH Engineering tows a bathymetric sonar just under the surface of a river. (Photo: SPH Engineering)

  • The surveyor and the mapper — sharing the same stage

    The surveyor and the mapper — sharing the same stage

    The world of mathematics has always been a mysterious one. It is universally loved by those who enjoy STEM-related fields and occupations, while being generally loathed by those who prefer the arts and humanities (similar to the argument with cats versus dogs, but let us not go down that rabbit hole). It would be easy to believe that if each side sticks to their side of the road, there would be peace and harmony in the world.

    While I cannot speak for the art and humanities group, I can say with certainty that the STEM-related mathematics professions have been known to disagree with each other on various roles within the surveying and mapping world. While surveying has been around since the beginning of time, various forms of organized mapping systems began in earnest in the 1960s.

    When attempts were made to bring the two professions together, each side bristled at being mentioned in the same breath as the other one. The surveyors were the outdoor cowboys with theodolites and tapes, measuring properties and improvements with low precision and accuracy. The mappers, now beginning to be known by the acronym GIS (geographical information system) technicians, were the office computer nerds with punch cards and slide rules.

    Each side did not care much for the other — mostly because they did not understand each other’s role in creating the modern infrastructure database. This relationship would last for decades with no relief in sight.

    Early (and unresolvable) differences

    Each side brought a good argument to the table regarding why the other side was not as important to the authoritative role of map/plat making. For instance, here are the typical stances of each side in the 1970s, before the introduction of personal computers and electronic data collectors.

    • Surveyors worked on the ground and with actual monuments and improvements. They measured angles and distances to collect the pertinent data and drew by hand said information graphically on paper. Because of the accuracy and precision of the field measurements, adjustments were made to the calculations to resolve the unknown errors within the data collection.
    • GIS technicians used a combination of hand calculations, drafting and primitive computers to depict information obtained by existing maps and plats. Because the information being reviewed was not obtained through field methods, parcel lines were forced to fit, improvements to be shown with 90-degree corners, and ambiguities with most data issues to be dismissed.

    Each side stood their ground (in the field or the office) and maintained the distance and differences until more technological revolutions began to infiltrate their vision. At first blush, one could assume these advancements would bring the two factions together; one would be wrong.

    Would you like to play a game?

    Photo: RyanJLane/E+/Getty Images
    Photo: RyanJLane/E+/Getty Images

    The 1980s are known for many things, but for the surveying and mapping communities, it brought a new way of reviewing and storing spatial data. The introduction of the personal computer and vector-based software in the early part of the decade set the pace for rapid and revolutionary upgrades to each profession.

    It was now possible to see on a computer screen what had only been previously possible through manual computation and drafting. As the decade went on, computing speed and storage continued to increase along with the features of software packages.

    However, these advancements did little to bring the surveying and mapping professions together; in fact, the technology has been blamed for causing even more of a divide between the two.

    Again, each side has their reasons for maintaining their hold on being recognized as the authority on the creation of the cadaster layer.

    • Surveyors continued to insist because they worked on the ground and with actual monuments and improvements, the process of putting the data into a computerized format only solidified their position.
    • GIS technicians continued to insist that the refinement of their previous calculations of drafting and mapping into a computerized version further extended their expertise in the mapping world. Also, because many in GIS were specifically trained on computers in college, the work being produced by these members was superior to surveyors.

    Even with the improvements in technology from computers, the divide between the two grew. The relationship between surveying and mapping was at an all-time low, so there must be nowhere to go but up, right? Not so fast.

    GPS + spatial = data custody battle?

    Photo: Magellan
    Photo: Magellan

    Through the 1990s and beyond, the introduction and subsequent rapid implementation of GPS/GNSS gave new meaning to a previous but rarely used term: geospatial data. Only geodesists and higher-end scientists truly worked with geospatial data because of their professional environment and expertise, but now anyone with a GPS receiver became a geospatial data collector.

    Previously, surveyors would measure on a global scale (latitude/longitude and/or state plane coordinates), but this would typically consist of solar and lunar observations under ideal conditions. GIS technicians could only rely on data provided to fit within the location parameters of their projects, which has usually scaled from quadrangle maps.

    However, this new technology was being used with data collectors programmed for almost anyone to use with little to no geodesy experience. Turn it on, press a button and voila — a geospatial location in a variety of coordinate systems. No more sun shots, lengthy traverses from obscure NGS monuments, or scaling from the quad sheets.

    Finally, the surveying and mapping communities have common ground to work on! It would be easy to assume that walls came down and the two professions mended their fences. The short answer is no; they once again did not. Here is each side’s general take on geospatial abilities:

    • Surveyors (once again!) continued to insist that because they worked on the ground and with actual monuments and improvements (though now with improved positioning), the process of putting the data into a georeferenced format only solidified their position.
    • GIS technicians now contended that they, too, could collect the necessary field data using GPS and bypass the need for surveyors. Also, because many in the GIS field were specifically educated to work with spatial data, the information being produced by these members was superior to surveyors’ data.

    We now find ourselves flipping the calendar pages well into the 2020s, with little movement on resolving this relationship. But we can change that if we introduce a little friendlier dialogue.

    In this corner, the surveyor. In the opposite corner, the GIS technician

    When it comes to high accuracy/high-precision data collection for locating existing properties and improvements, there will be little argument that this role is strictly designated to the surveying profession. Technological improvements have made our work more precise and accurate; all while being collected in a georeferenced system. The relationship between the surveyor and geospatial data was previously discussed to demonstrate the importance of our work and determining existing conditions, (see GPS World July 2020 column). The surveyor’s ability to be able to collect an enormous amount of geospatial data for surveying purposes is not being questioned, but the line to where the work encroaches into GIS territory. Spoiler alert: Practically everything the surveyor collects can be considered GIS information as well.

    Let us look at the relationship from the GIS perspective. The input and oversight of the parcel layer must rely on the licensed land surveyor to provide, while the GIS community is charged to collect necessary information to include into their database. It would make sense to update existing infrastructure information using current technology or historical archives in which the position of the data can be verified. Either way, it is now going to be referenced by its geospatial position rather than a relationship to a parcel line.

    Also, the GIS technicians have the same or better capability to utilize data collectors with GNSS receivers for locating existing improvements for inclusion into their system. Most of these technicians have access to the same sources providing the GNSS equipment and coupled with their education and skills, they can collect the data as well as any survey crew. B

    ut does this data collection by a GIS technician fall under most state statutes for surveying without a license? Spoiler alert: The short answer is yes, it does if any data collection includes parcel monumentation and could depict a relationship to a parcel line.

    The whole is greater than the sum of its parts

    Before both parties of this discussion get their pitchforks and torches to have a “talk” with this author, let us take a step back and reassess where we are today with technology and looking toward a future together. The common element here is the data, but how each party uses the data does vary.

    The surveyor typically uses geospatial data for several applications; boundary determination, existing planimetric and topographical conditions, and physical depiction of proposed improvements. The surveyor’s data should be considered as a snapshot in time of the conditions of a particular site or project area.

    Because of emerging technology, it is not just manually collected survey points using conventional equipment; it can be point clouds and 3D photographs not possible 20 years ago. The surveyor can be considered a high-tech record keeper and can update information as sites change. All because the collected geospatial data is timestamped and memorialized in a digital database.

    GIS professionals, on the other hand, require similar information but for many different purposes. Attributes play a much bigger role in the geospatial data requirements than surveyors because the information found within tells them an important story.

    Photo: aydinmutlu/E+/Getty Images
    Photo: aydinmutlu/E+/Getty Images

    The biggest improvement because of the increasing accuracy of the data is infrastructure. As aging utilities require replacement, locating old facilities can be difficult based upon old mapping. Geospatial data collection provides more reliable locations once old facilities are found, existing conditions are reported, and crucial information about its lifespan is collected for future consideration.

    Newly installed utilities will have the luxury of significant attribute data applied to each structure to help with future monitoring and maintenance. These are some of the factor that apply to effective asset management and can be applicable to both public and private clients.

    While the surveyor and the mapper use geospatial data for similar yet different uses, the product is generally the same. But this discussion is not just about merging data into one big global database; we need to dig a little deeper on how to grow each side of our professions together.

    Growth is never by mere chance; it is the result of forces working together

    The surveying and mapping professions have been at a crossroad for some time and both sides continue to ignore each other. Both believe that geospatial data is theirs to control, and they both are right. However, each have a different stake in this geospatial data discussion and need to learn to respect each other’s role. Each side brings a different perspective how to grow and advance our world through effective and efficient surveying and mapping, but they must start talking to realize how much they can grow together.

    With a little more focus and education of each other’s roles on both sides, an overlap of responsibilities could mean faster approach to modernizing many aspects of our respective professions. For instance:

    • Cross training of surveyors in GIS software, data collection requirements, parcel modules, and layer nomenclature
      • Encourage surveyors to apply for GISCI Certified GIS Professional (GISP) testing
    • Cross training of GIS professionals and technicians with survey technician programs
      • Encourage GIS personnel to apply for NSPS Certified Survey Technician (CST) testing
    • Both surveyors and mappers cross training with data collection systems capable of collecting geospatial data containing specific positional information and attributes
      • Identifying limitations of various equipment and techniques (i.e. using the right “tool” for the job)
      • Understanding of positional tolerance (precision versus accuracy) and metadata
      • Comprehension of coordinate systems and zones, including low distortion projections (LDP)
      • Distinguishing between surveying and mapping data collection (i.e. boundary/right-of-way determination versus infrastructure collection for inventory)

    Light at the end of the tunnel

    Technology has introduced our world to many advances not thought possible for our entire existence. The Fourth Industrial Revolution (see GPS World July 2019 column) is now taking aim at industries like surveying and mapping through automation and artificial intelligence capability.

    Data is crucial to everything and our respective professions are in the center of the revolution. 2020 and our worldwide pandemic of COVID-19 has been (unfortunately) perfect example of how data affects our world in real time. The more critical and accurate data that is collected, the better we can make assessments of situations.

    Surveyors and mappers are doing the same thing with data; survey data helps design our world through establishing accurate conditions, while GIS data helps to evaluate our current conditions and plan for future situations. Both professions rely heavily on data, collected in similar methods, but for separate but similar uses. Each has their strengths to bring to the collective table and can increase the effectiveness of digital modeling going forward.

    Photo: PeopleImages/E+/Getty Images
    Photo: PeopleImages/E+/Getty Images

    Let’s make a plan

    The world is moving toward digital twins, augmented and virtual reality along with autonomous travel; it would be in our best interest that the data used to identify the surroundings for those advancements be correct and seamless from all sources. Let us begin by dropping all the delusions of grandeur for our respective professions and formulate a plan to move forward together. The clock is ticking, and time continues to march on.

    Technology continues, and soon Generation Z will be trying to do our work with their laptops and smartphones from the coffee shops without our help. Because they can. See, it is important, isn’t it?

  • Plug-and-play compass selected for survey package

    Plug-and-play compass selected for survey package

    Photo: Advanced Navigation
    Photo: Advanced Navigation

    Advanced Navigation’s plug-and-play GNSS Compass was selected by Nortek for its new survey package. Nortek’s scientific instruments apply the Doppler principle to underwater acoustics to measure water in motion, such as currents and waves. The instruments are used by scientists, researchers and engineers worldwide, employed in demanding environments that require state-of-the-art instrumentation that is reliable and easy to use.

    A vessel-mounted acoustic Doppler current profiler (ADCP) measures the velocity of currents beneath a moving vessel. To correct the measured values for vessel speed and direction, ADCP measurements require accurate velocity and heading information. Besides the use of bottom track within the ADCP itself, such information can be provided externally using a GNSS receiver and a non-magnetic heading source such as a gyro compass.

    Nortek’s ADCP package — Signature VM — offers operational convenience and reduced complexity. As part of the package, Advanced Navigation’s GNSS Compass provides accurate dual-antenna GNSS-based heading that is not subject to magnetic interference. Its inertial navigation system (INS) can maintain accurate heading during GNSS outages of up to 20 minutes. “By making use of today’s modern Ethernet instruments, such as the Signature ADCP and the GNSS Compass, we can guarantee nanosecond time synchronization with Ethernet PTP protocol,” said Herman Huitema, VM product manager at Nortek. “Data from the ADCP can be exactly aligned with the GNSS Compass information.”