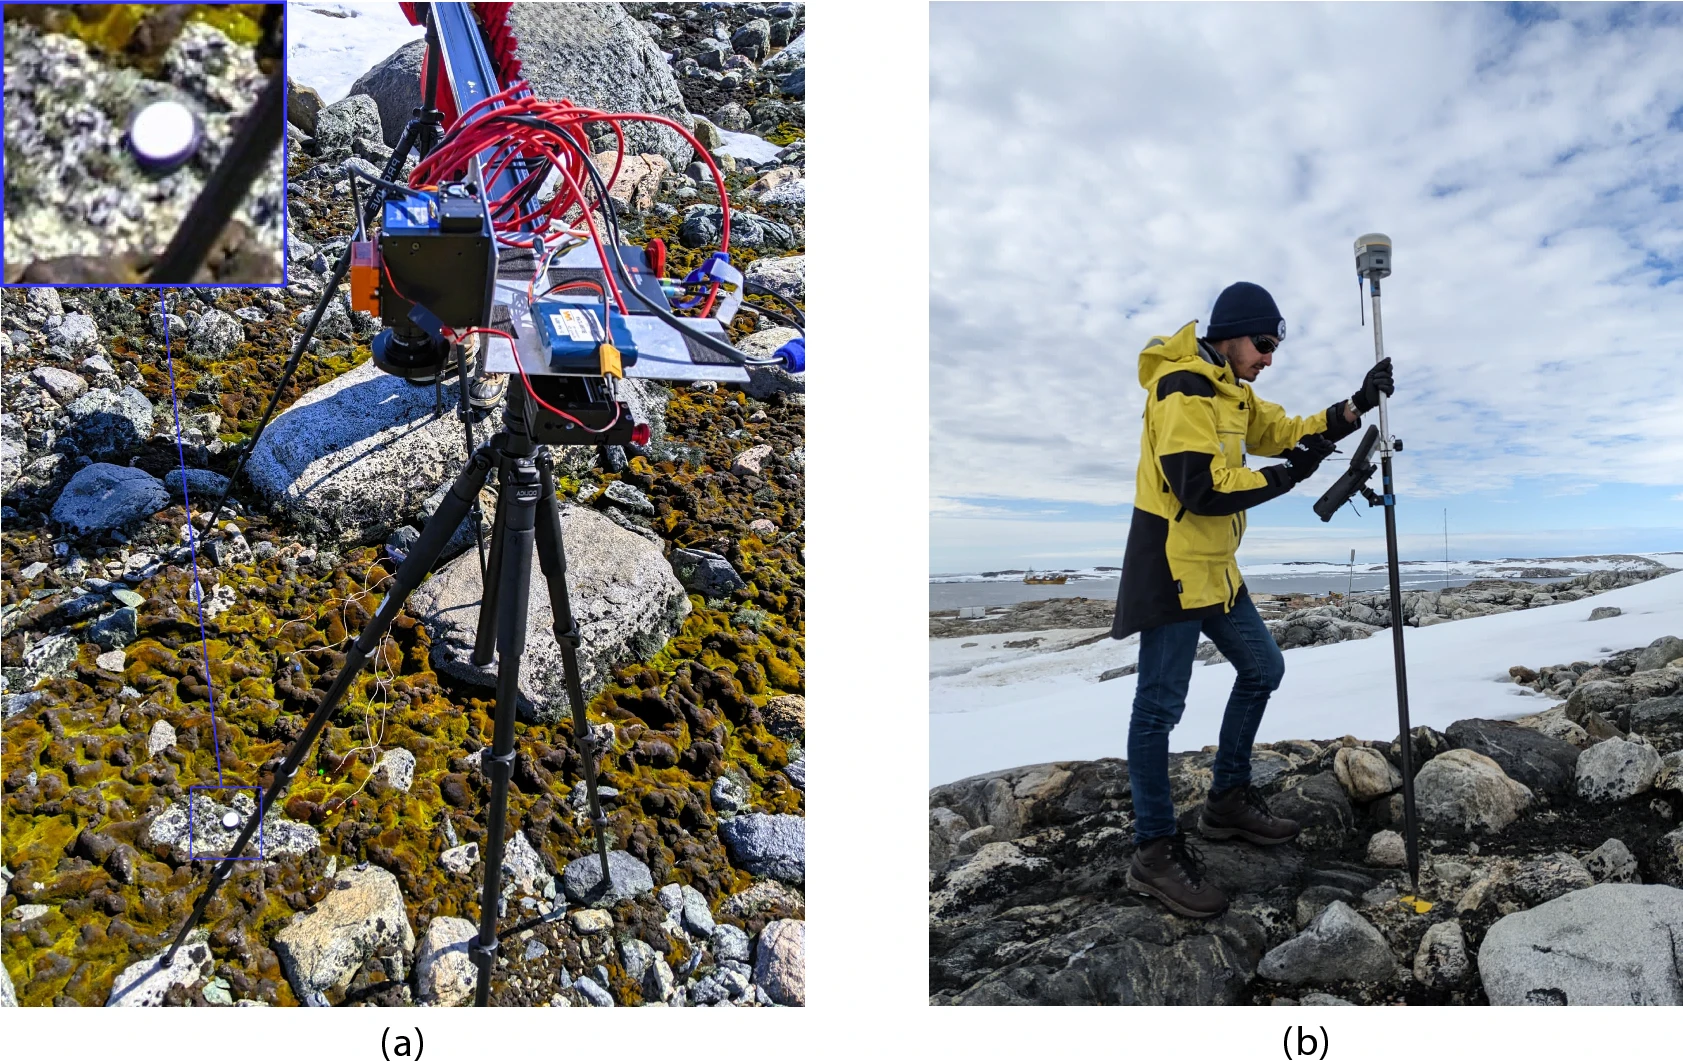
GNSS and unmanned aerial vehicles (UAVs) have revolutionized precise mapping in polar regions. For a team from Queensland University of Technology (QUT), UAVs enabled a flexible platform for deploying hyperspectral imaging (HSI) sensors and collecting high-resolution data, enhanced by GNSS with real-time kinematic (RTK) to ensure accurate geolocation for reliable vegetation analysis.
The team turned to UAVs to meet the unique challenges of monitoring Antarctic vegetation. Harsh conditions, remoteness, limited access and climate variability make traditional field surveys time-consuming and costly. Worse, they risk disturbing sensitive vegetation, explain the researchers.
What Grows There. Antarctica’s terrestrial ecosystems are home to freeze-tolerant vegetation like mosses and lichens, which play a crucial role in biogeochemical cycles, soil insulation and supporting biodiversity. These organisms underpin the continent’s fragile ecosystems, increasingly threatened by climate change, extreme events, and human activitiees.
While satellite imagery enables large-scale observations, its limited spectral and spatial resolution, alongside cloud interference, constrains fine-scale vegetation analysis. HSI captures a broad wavelength range, enabling discrimination of vegetation by their spectral signatures. Multispectral imaging (MSI) data, such as that from Sentinel-2, is also being explored.
UAVs offer flexible spatial coverage and high-resolution datasets.
However, unless these elements are integrated, mapping accuracy diminishes. Moreover, limited validation of spectral libraries and simulated imagery against field data restricts the reliability of remote sensing outcomes.
The team’s study addresses current gaps by building on the UAV-based HSI workflow that incorporates ground-based HSI data and MSI. “We expand this approach by integrating UAV-captured HSI data to enhance remote sensing capabilities in polar environments,” researchers explain. The updated methodology combines UAVs, high-resolution red, green, blue (RGB) imagery, and ground and aerial HSI data with machine-learning-based semantic segmentation.
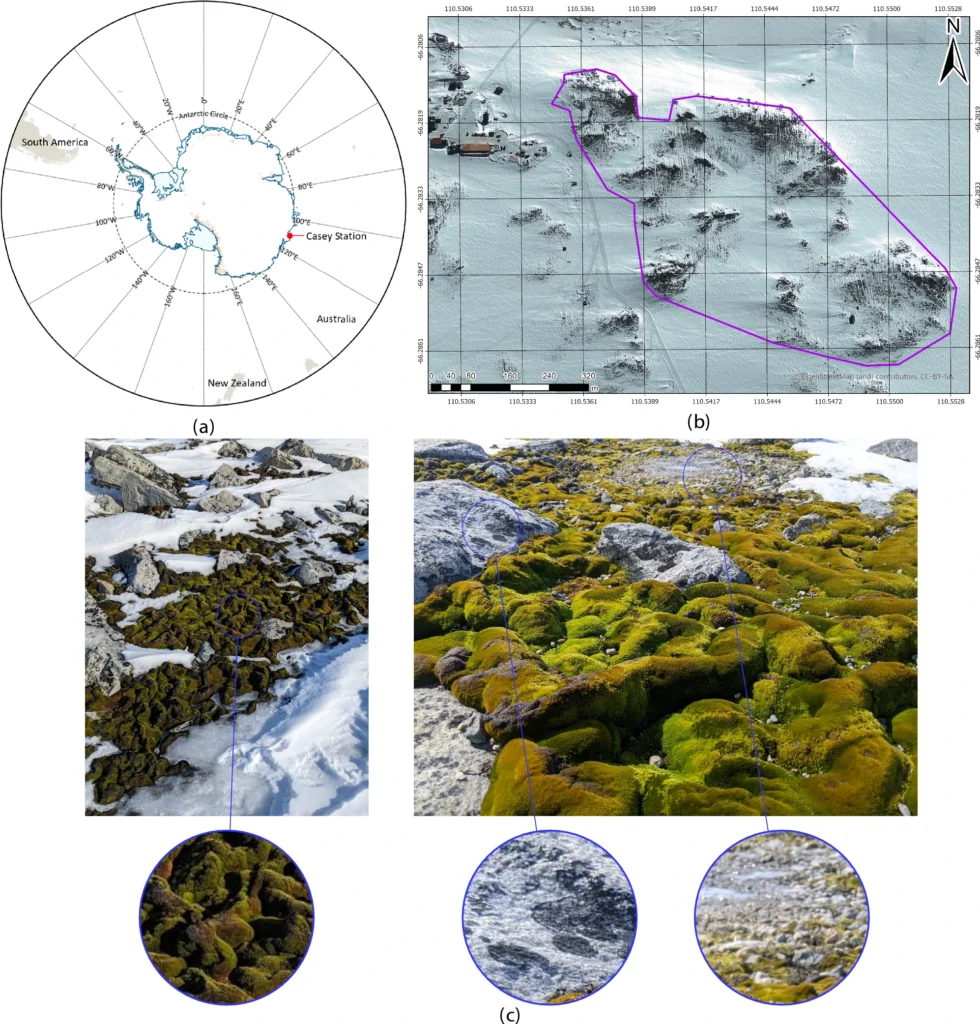
The new workflow was evaluated in Antarctic specially protected area (ASPA) 135, Windmill Islands, East Antarctica, focusing on lichen detection and moss health mapping (Fig. 1).
Location of ASPA 135 (6616’60” S, 11032’60” E) and studied vegetation. (a) Map of Antarctica showing Casey Station’s location using the Polar Stereographic Projection. (b) Map delineating ASPA 135 (purple) near Casey Station (top left). (c) Ground-level imagery of moss and lichen at ASPA 135, along with surrounding rock and ice formations. (Credit: QUT)
Read the full study, “Drone hyperspectral imaging and artificial intelligence for monitoring moss and lichen in Antarctica,” on the Scientific Reports website.
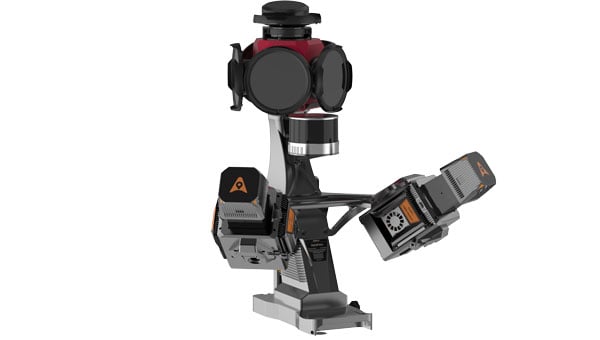
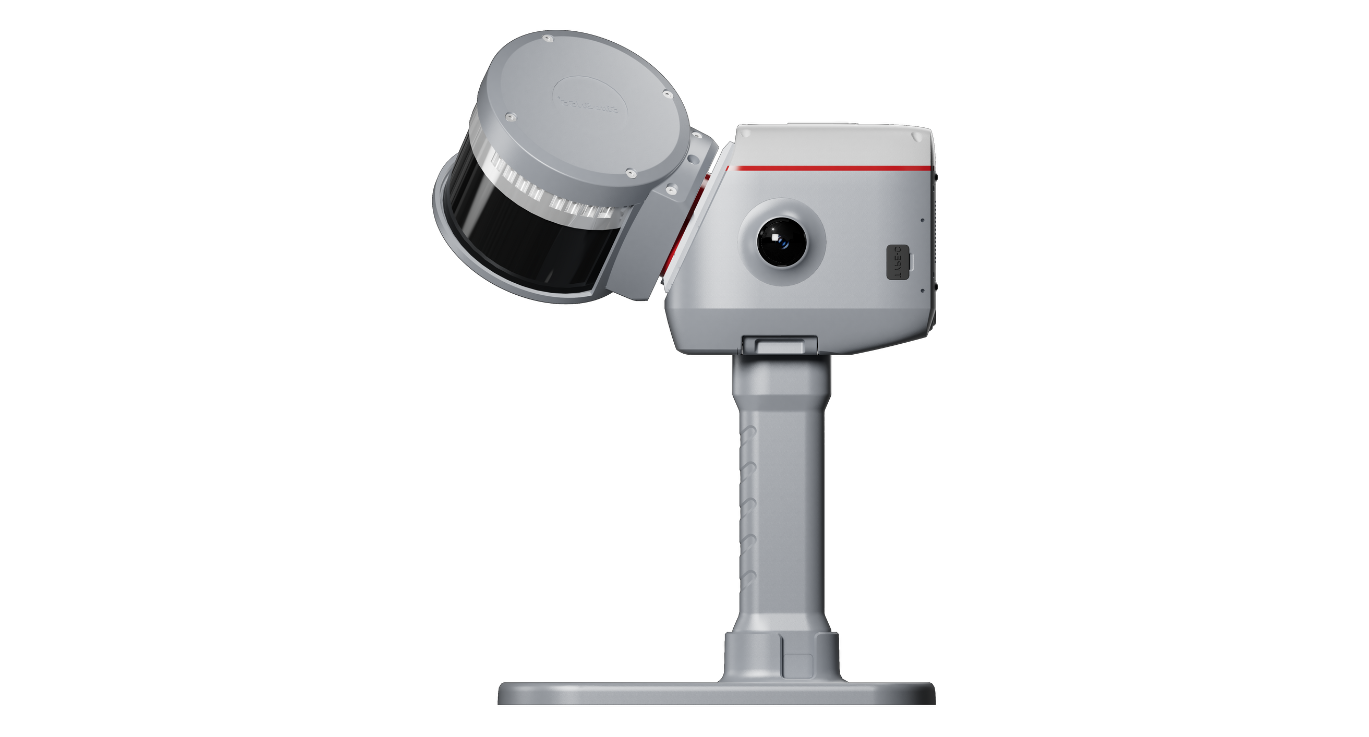
CHC Navigation (CHCNAV) has released the AU20 MMS, a vehicle-mounted mobile mapping system designed for accurate and efficient collection of 3D spatial data. The system combines high-performance lidar technology, versatile sensor support and intelligent data processing to provide a practical and flexible solution for professionals in road surveying, asset management and infrastructure documentation.
The AU20 MMS features a sophisticated lidar system that uses fourth-generation real-time waveform processing technology. It achieves a scan rate of 2 million points per second and 200 revolutions per second, producing point cloud data with 5 mm accuracy and 3 mm precision. This level of detail allows for the identification of fine surface characteristics and features, supporting comprehensive asset inventories and condition assessments. The system’s long-range, multi-cycle laser technology enables high-density data capture up to 250 m in vehicle-mounted applications.
Built on the adaptable AP7 vehicle platform, the AU20 MMS supports a dual laser scanner setup to increase data density. The platform includes a 45° scanning angle to reduce data shadows and improve detection of vertical structures and road signage. The AP7’s built-in processor allows integration of up to eight external sensors, including specialized pavement detection cameras and panoramic cameras such as the Ladybug5+ and Ladybug6, giving users flexibility in data acquisition strategies.
The AU20 MMS uses artificial intelligence-based algorithms to refine data quality and streamline processing. AI-driven vehicle motion trajectory adjustment automatically identifies control points, correcting point cloud inaccuracies to within two centimeters to meet highway-grade survey requirements. AI-powered panoramic coloring achieves more than 95 percent accuracy in recognizing and handling vehicles and pedestrians, resulting in clean, interference-minimized colorized point clouds with efficient one-click optimization.
CHCNAV’s software suite, CoPre and CoProcess, streamlines workflows through intelligent automation. CoPre optimizes data preprocessing, allowing real-time adjustments to point clouds and imagery while minimizing manual intervention. CoProcess uses AI algorithms for feature extraction, including road assets, terrain models and building structures, to accelerate project delivery.
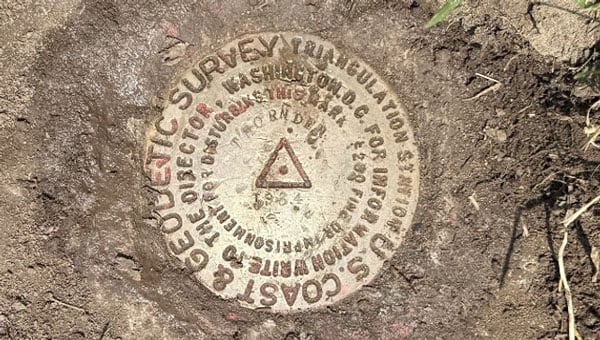
This newsletter is going to highlight some history of the Coast and Geodetic Survey and provide the latest information on the National Geodetic Survey (NGS) new National Spatial Reference System (NSRS). First, every year my brother and I get together and travel to visit friends and relatives. He lives in Montana, and I live in North Carolina, so our yearly trips are typically 10 to 14 days long. As in all trips, I look for geodetic marks along the way. This year we traveled to coastal Maine to visit lighthouses and of course eat lobster rolls. We visited 12 Lighthouses along the Maine Coast. Lighthouses have both historical and navigational importance. The lighthouses were essential in guiding sailors through rocky shores. Portland Head Light commissioned by George Washington in 1791 is Maine’s oldest lighthouse and still guides vessels into Portland Harbor. We found NOS benchmark 841 8031 B 1979 on the grounds of this lighthouse. Pemaquid Point Lighthouse is managed by the Friends of Pemaquid Point Lighthouse, a chapter of the American Lighthouse Foundation, and remains an active aid to navigation under the ownership of the U.S. Coast Guard. We could climb up the Pemaquid Point Lighthouse, so I took a photo of the view from the top.
One of my brother’s requests was to visit the first place in the continental United States to see the sunrise. However, the location of the first place in the continental United States to witness the sunrise depends on the time of year. As indicated in the box titled “First Places to See the Sunrise in the Continental U.S.” Mars Hill is the first place to witness the sunrise in June.
841 8031 B 1979 — Mark located on grounds of Portland Head Light. (Credit: Dave Zilkoski)Pemaquid Point Lighthouse (Credit: Dave Zilkoski) View from Pemaquid Point Lighthouse (Credit: Dave Zilkoski)
First Places to See the Sunrise in the Continental U.S.
October 7 to March 6: During these months, Cadillac Mountain in Acadia National Park, Maine, holds the distinction of being the first place in the continental U.S. to see the sunrise. Its elevation of 1,530 feet and eastern location make it ideal for early morning views. reddit.com+10nps.gov+10acadiamagic.com+10
March 25 to September 18: In the spring and summer, Mars Hill in Aroostook County, Maine, takes the title. Its northeastern position allows it to catch the first rays of sunlight during this period. newengland.com+2en.wikipedia.org+2aa.usno.navy.mil+2
Around the Equinoxes: Approximately during the weeks surrounding the spring and fall equinoxes, West Quoddy Head in Lubec, Maine—the easternmost point of the contiguous U.S.—experiences the nation’s first sunrise. reddit.com+2en.wikipedia.org+2en.wikipedia.org+2
That said, when we travel together, we always recover geodetic marks, so we chose to visit Cadillac Mountain even though in June the first place is located on Mars Hill in Aroostook County.
As many of you know, I worked for NGS for 35 years so reconning monuments is exciting to me. We found six marks in a radius of about two hundred meters on Cadillac Mountain. We will talk about them in a minute.
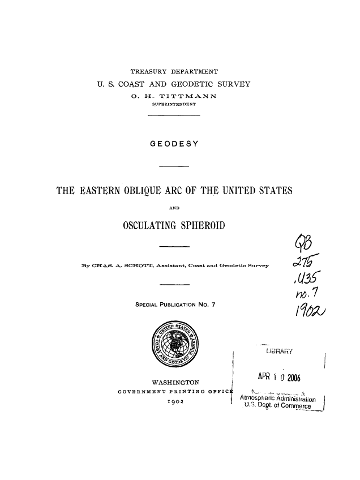
Cadillac Mountain was important to me because from 1833 to 1898, the Coast and Geodetic Survey performed a triangulation project that extended from Calias, Maine, to New Orleans, Louisiana. The project was published as the Eastern Oblique Arc of the United States. The station Mount Desert 1856 that was located on Cadillac Mountain was part of this project. A report published in 1902 describes the Eastern Oblique Arc project and can be downloaded here.
USCGS Special Publication Number 7. (Credit: USGS)
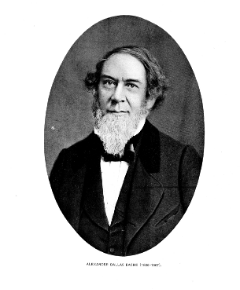
According to the 1902 report, horizontal observations at station Mount Desert 1856 were acquired by Alexander Dallas Bache. That may not mean much to most people, but Mr. Bache was the second superintendent of the Coast Survey and was particularly important to the advancement of geodesy in the United States. As a side note, the Coast Survey was renamed the Coast and Geodetic Survey in 1878. The change reflected the agency’s expanded mission beyond coastal charting to include geodetic surveys of the nation’s interior, prompted by the growing importance of geodesy in its work.
Bache’s leadership of the U.S. Coast Survey
In 1843, Bache was appointed superintendent of the United States Coast Survey, succeeding Ferdinand Rudolph Hassler. Under his leadership, the Coast Survey expanded its missions to include hydrography, geodesy, topography, and the printing arts. He initiated geomagnetic studies, directed tide observers to make meteorological observations, and developed mathematical techniques for tide predictions and adjusting triangulation networks. Bache’s administrative skills transformed the Coast Survey into one of the foremost scientific organizations globally, providing critical data for navigation and commerce.
Alexander Dallas Bache
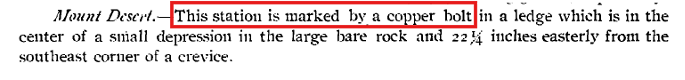
According to the description of Mount Desert in the 1902 USCGS report, the station was marked by a copper bolt in a ledge (see the box titled “1856 Description of Mount Desert”). The 1902 description of the station on the NGS Datasheet stated that it was a hole drilled in a rock (see the box titled “1902 Description of Mount Desert”). I’m not sure why there is a discrepancy between the two descriptions but in 1931 the Maine Geodetic Survey found the drill hole, and based on measured references to other drill holes in the area that were documented in the original description decided that it was the location of the original station (see the box titled “1931 Description of Mount Desert”). At that time, a Coast and Geodetic Survey Disk with Reference Marks were installed by the Maine Geodetic Survey.
A description of Mount Desert from 1856. (Photo: NGS) A description of Mount Desert from 1902.A description of Mount Desert from 1931.A description of Mount Desert from 1931.
As I previously stated, we found six marks in the area. The boxes titled “Photos of Mount Desert 1856 and Reference Marks” and “Photos of Other Marks on Cadillac Mountain” provide photos of the monuments we found on Cadillac Mountain. One may note that the reference mark 2 monument is in worse shape than the reference mark 1 and the Mount Desert monument. The 1944 recovery note stated that reference mark 2 was covered with roadway stone. There was not any stone covering reference mark 2 when I found it. Reference mark 1 is located behind some trees and out of sight of the path.
When I arrived at the site, there were a group of people looking at reference mark 2. I held a little lecture on the importance of geodetic monuments and how this site was first occupied in 1856; and, of course, I highlighted the importance of geodesy.
Photos of Mount Desert 1856 and reference marks. (Credit: Dave Zilkoski)
I was thrilled to stand in the very spot where Alexander Dallas Bache took geodetic measurements in 1856. [I know—people joke that I need to get a life, all because I get so fired up over geodetic monuments.]
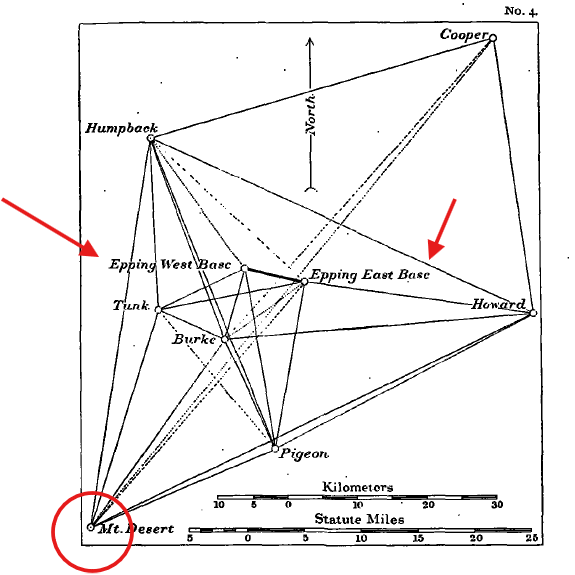
The box titled “Abstract of Observations at Mount Desert” provides a summary of the directions from Mount Desert to the stations involved in this phase of the project. The box also includes a photo of an instrument, a 75 cm theodolite, which was used to perform the observations. The box titled “Diagram of Network Depicting Epping Base Line” provides a diagram that was included in the 1902 USCGS report.
As a side note: during the 1970s as a NGS employee, I personally coded abstracts similar to this one to convert archival data into computer-readable form in support of the North American Datum of 1983 (NAD83) project. Once all data were in computer-readable form, they were reviewed for correctness and combined in an adjustment resulting in what is known as NAD 83 (1986). See the NGS report for some details of the NAD 83 (1986)here.
The other marks we found on Cadillac Mountain included a US Geological Survey Benchmark – K 24 1934, a bent pipe denoted as Cadillac Ground, and a Department of Interior Geological Mark – Cadillac 1975. All these marks are within a 200-meter radius of each other. My understanding is that Cadillac Ground was established because Mount Desert was obstructed by trees. I have provided weblinks for those that would like more information on these marks.
After visiting more lighthouses along the Maine Coast, we traveled back to Boston and visited Waldon Pond and Thoreau’s family home. Why Thoreau you ask? In 2018, the Surveyors Historical Society and NSPS Foundation recognized Thoreau for his work as a surveyor by establishing a commemorative monument at Thoreau’s family farm.
Thoreau described surveying as a “noble employment” that kept him close to nature: “Surveying … brings you within hearing of [the birds]” – https://www.heritagesurveys.com/famous-surveyors. Surveying and geodesy are indeed noble professions; they provide the foundation for all geospatial products and services.
Photo of Commemorative Mark at Thoreau’s House. From left to right, Thoreau – A Surveyor, Thoreau Monument and drawing lines. (Credit: Dave Zilkoski)
Finally, we left Boston for Syracuse to visit my younger brother and sister. I attended the SUNY College of Environmental Science and Forestry (SUNY ESF) which is immediately adjacent to Syracuse University campus. Both of my brothers attended Syracuse University, so we like to walk around campus whenever we visit Syracuse. During our trip to the University, we recovered the monument Thornden 1934. Thornden 1934 was significant to me because I recovered this monument over 50 years ago, as part of a special project that I performed for my geodesy class.
Thornden 1934 (Credit: Dave Zilkoski)
I hope this was not too boring for you, but I real enjoy history and especially the history of the geodetic network of the United States. Today, you can use modern surveying technology to obtain a more accurate coordinate in seconds where it took days to months in the past. That is amazing!
Now, what is the latest with the modernization of the National Spatial Reference System? On June 17, NGS announced that they incorporated four groups of NSRS modernization products to the NGS beta website.
Multiple NSRS Modernization Products Published to Beta
NGS has released the following four groups of products to the NGS beta website to solicit review and feedback from stakeholders as part of the modernization of the National Spatial Reference System (NSRS): (Note: These products are not final and should not be used for anything other than review and testing.)
North American-Pacific Geopotential Datum of 2022 (NAPGD2022). This datum will replace the North American Vertical Datum of 1988 (NAVD 88) and all other vertical datums for islands in the United States. It will serve as a foundational component of the modernized National Spatial Reference System (NSRS), providing precise definitions for orthometric height (elevation). The release includes the defining grids that collectively make up the datum along with a number of supporting products to visualize the datum.
Products. All NAPGD2022 products are provided as grids for the following: GEOID2022, DEFLEC2022, GRAV2022.
Example coordinates. Coordinates and product values are computed for numerous example points throughout NAPGD2022 and provided in a table. NAPGD2022 Experience. Interactive online maps showing NAPGD2022 products for all regions that can be used on a computer or mobile device to query any location.
Maps of NAPGD2022 products. Static map images of NAPGD2022 products for all regions.New Terrestrial Reference Frames of 2022 for North America (NATRF2022), Pacific (PATRF2022), Caribbean (CATRF2022), and Mariana (MATRF2022) plates. These four geodetic reference frames will replace the North American Datum of 1983 (NAD 83). They will serve as a foundational component of the modernized NSRS, providing precise definitions for geodetic latitude, longitude, and ellipsoidal height.
Euler Pole Parameters of 2022. All of the new terrestrial reference frames are defined by transformation from the International Terrestrial Reference Frame of 2020 (ITRF2020) using Euler Pole Parameters (EPPs) that model tectonic plate rotation.
State Plane Coordinate System of 2022 (SPCS2022). A system of map projections for accessing the modernized NSRS. Zone designs have been incorporated into the following beta products and services:
Zone information tables. SPCS2022 zone definitions, example coordinate computation results, minimum and maximum coordinate values, and minimum coordinate differences with overlapping SPCS2022 zones and with other coordinate systems, provided as interactive tables that can be sorted and filtered.
SPCS2022 Experience. Interactive online maps showing distortion for all SPCS2022 zones that can be used on a computer or mobile device to get distortion at any location or to view zone definitions.
Maps of SPCS2022 zones and distortion. Static map images of SPCS2022 zone layers, number of zones, and distortion with performance statistics.
NGS Coordinate Conversion and Transformation Tool (NCAT). This version can be used to perform SPCS2022 coordinate conversions at any location for all SPCS2022 zones. Later beta versions will include the ability to transform between reference frames and vertical datums.
Products found on the NGS beta website are preliminary releases that are for testing and evaluation only; they are not final products nor do they contain any authoritative NGS data or tools. To provide feedback on any of the content on this site, please email [email protected].
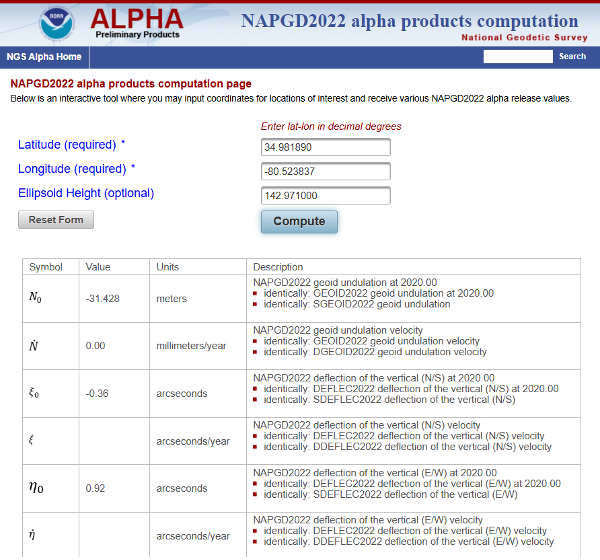
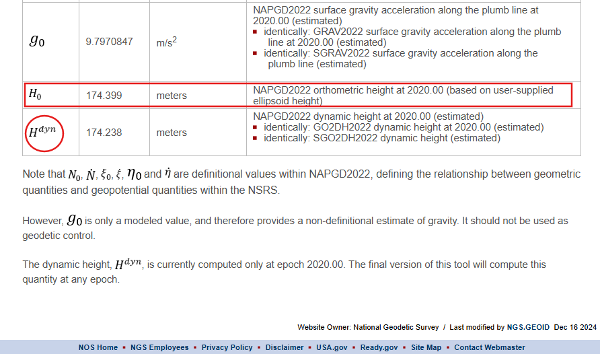
Everyone should review these products and provide their feedback to NGS. That said, my April 2025 newsletter highlighted the NAPGD2022 Alpha product that was moved to the Beta site. The Beta product is like the Alpha product, but it does not have an option for an interactive computation. The Interactive Computation Option provided essential information about NAPGD2022 and would be helpful to geospatial users for obtaining a better understanding of the differences between NADGP2022 orthometric heights and NAVD 88, and GEOID2022 geoid heights and hybrid GEOID18 geoid heights. My April 2025 newsletter highlighted the interactive computation option.
Alpha interactive computation page (Credit: NGS)
As noted in my April 2025 newsletter, I downloaded the data and created my own maps to better highlight local variations. Although users can still view the original via the interactive online map, this personalized version offers clearer insights.
Here are several of my comments on the Beta products based on my preliminary review:
The NAPGD2022 difference map (NAPGD2022 minus Historical in meters) uses 25 cm intervals, which are too coarse to reveal the finer local variations between published benchmarks accurately.
The NAPGD2022 Difference map should have an overlay of the marks used in the creation of the difference map. This would allow users to identify marks in their region of interest. Clicking on a mark should link to the NGS datasheet and Passive Mark Page.
The beta page for NATRF2022, PATRF2022, CATRF2022, and MATRF2022 is not particularly helpful for everyday geospatial users. There should be an Interactive Computation Option to enter NAD83 (2011), epoch 2010 coordinates where the routine transforms the coordinates into ITRF 2020, epoch 2020, as well as estimates in the new terrestrial reference frames – NATRF2022, CATRF2022, PATRF2022, and MATR2022.
Both the State Plane Coordinate System of 2022 (SPCS2022) and The NGS Coordinate Conversion and Transformation Tool (NCAT) are good tools for users to obtain an understanding of the differences and changes in the SPCS especially for their State. That said, like above, there should be an option to enter NAD83 (2011), epoch 2010 coordinates where the routine will transform the coordinates into ITRF 2020, epoch 2020, as well as estimates in the new terrestrial reference frames – NATRF2022, CATRF2022, PATRF2022, and MATR2022. The routine does have a note that states users can transform their coordinates using HTDP, but NGS should incorporate this process in the NCAT beta product.
Note from Beta NCAT product: This beta version of NCAT supports beta State Plane Coordinate System of 2022 (SPCS2022) but not transformations between reference frames or geopotential datums. NAD 83 latitude and longitude can be used as input, but the output coordinates will differ horizontally from actual SPCS2022 by up to a few meters, depending on location (likewise for UTM and USNG). If NAD 83 ellipsoid heights are used, the linear distortion and combined factor will differ from SPCS2022 values by a small amount, within ±0.3 parts per million (ppm). To reduce these differences, NAD83 epoch 2010.0 coordinates can first be transformed to ITRF2020 epoch 2020.0 using the Horizontal Time-Dependent Positioning (HTDP) tool.
I plan to provide these comments to NGS through their feedback email process. Everyone should take time to review these products and provide your feedback to NGS. Remember, NGS placed these four groups of products on the NGS beta website to solicit review and feedback from stakeholders as part of the modernization of the National Spatial Reference System (NSRS) process. Users should review these Beta products and consider two questions:
1. Do these products provide sufficient information and detail for documenting how I will deliver my products and services under the new NSRS?
2. Do I need additional information or tools from the NGS to better understand the changes and impacts of the new NSRS?
Your feedback will help NGS improve the Beta products.
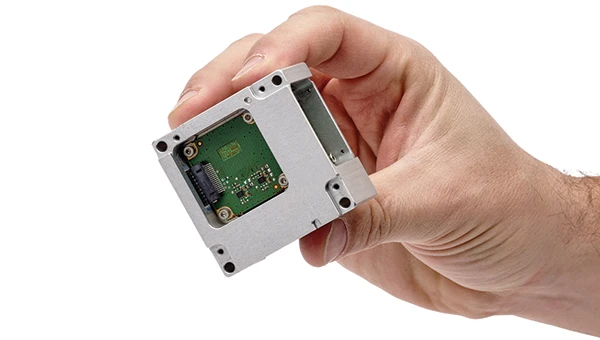
Exyn has integrated the Trimble DA2 GNSS System, an RTK-capable GNSS receiver, with the Exyn Nexys autonomous mapping platform, bringing centimeter-level geospatial accuracy to SLAM-based mobile 3D mapping.
The new capability enables users to pair Exyn Nexys’ lidar-based SLAM mapping with high-precision RTK corrections, allowing teams to georeference and anchor point clouds directly in the field without relying on ground control points or post-processing workflows. The result is faster, safer, and more accurate decision-making for industries including mining, construction and critical infrastructure inspection. Intelligently combining RTK and SLAM delivers highly accurate and robust point clouds — even in challenging environments.
When paired with the real-time colorization, users gain an added layer of visual context, enabling photorealistic mapping and the extraction of immersive georeferenced 360° imagery for enhanced situational awareness and analysis.
deliver real-time, centimeter-accurate global positioning
seamlessly integrate underground and surface-level scans into unified, georeferenced datasets
accelerate project timelines by reducing dependency on traditional ground control setups
improve accuracy and alignment for as-builting, volumetric measurements, construction progress tracking / QA, and mine planning.
This enhancement is particularly useful for hybrid environments where teams operate in both GPS-available and GPS-denied zones. The Nexys with DA-2 enabled RTK allows for seamless transitions between these areas while maintaining global coordinate consistency, so Exyn Nexys can serve as a true end-to-end solution for autonomous 3D data capture.
The Trimble DA2 GNSS and Exyn Nexys integration kit is available immediately for plug-and-play compatibility.
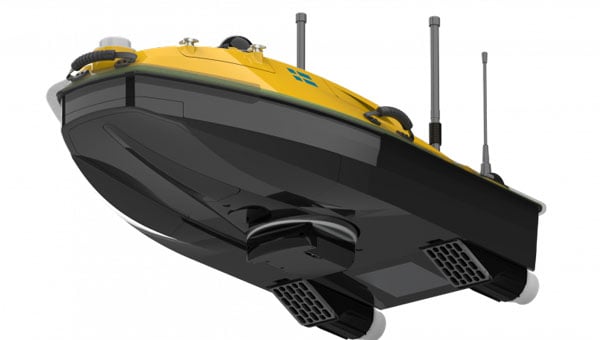
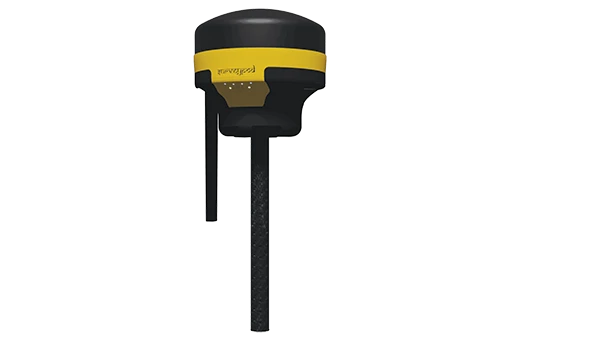
SatLab has introduced the HydroBoat 1200MB, a compact uncrewed surface vehicle (USV) system engineered for 3D hydrographic surveying in inland and nearshore waters. The system integrates SatLab’s autonomous vessel platform with the HydroBeam M2 multibeam echosounder, providing a portable solution intended to streamline data collection in shallow or confined environments.
The HydroBoat 1200MB is developed as a fully integrated unit, combining navigation, sonar data acquisition, real-time visualization and data management. According to the company, it is designed to assist small teams in conducting geospatial reconnaissance and hydrographic assessments with minimal setup and reduced operational complexity.
SatLab reports that the system supports a seamless workflow, from survey planning through to the delivery of final results. The vessel features an integrated inertial navigation system that delivers roll, pitch and yaw measurements without requiring field calibration. Its real-time data visualization capabilities allow users to view high-resolution 3D point clouds, bathymetric profiles and sidescan imagery across multiple devices, which allows for immediate quality control and decision-making in the field.
The HydroBoat 1200MB incorporates SatLab’s proprietary sound speed profile inversion technology, which enables real-time sound velocity correction without the need for separate sound velocity profilers. The system is designed for operational efficiency, with deployment possible in under five minutes and control managed through an Android-based interface.
Equipped with a multibeam configuration offering 512 beams and a swath coverage of 30 to 150 degrees, the HydroBoat 1200MB is intended to allow users to survey larger areas compared to singlebeam alternatives. According to SatLab, this configuration can result in up to a 7.5-fold increase in survey efficiency and potential cost reductions of up to 50%, due to the elimination of auxiliary equipment and simplified field operations.
The HydroBoat 1200MB can be used in a variety of applications, including river and reservoir surveys, bank mapping, structural inspections, sediment transport monitoring and infrastructure assessment. It is designed to meet data quality standards set by the International Hydrographic Organization, the Canadian Hydrographic Service and the U.S. Army Corps of Engineers.
ComNav Technology has released the SinoGNSS LS600 laser scanner, a handheld 3D scanning device designed for professional use in both indoor and outdoor environments.
It integrates lidar, GNSS, an inertial measurement unit (IMU) and dual-camera systems for detailed, colorized point clouds and precise positioning data production. The LS600’s also includes advanced SLAM algorithms, which work in tandem with a built-in real-time kinematic (RTK) GNSS module. This combination allows the scanner to achieve centimeter-level accuracy, even in challenging enviornments. The device’s high-speed lidar system supports 16-line and 32-line configurations, scanning up to 640,000 points per second with a 360° by 270° field of view. Detection ranges are available in both 120 m and 300 m options, accommodating a wide range of surveying applications.
The LS600 features dual 16 MP wide-angle cameras that capture vivid, multi-angle color data. This visual information is merged with lidar data through visual-aided SLAM, enhancing the color fidelity and detail of the resulting point clouds. One of the scanner’s notable features is its Flash Point Cloud Technology, which enables real-time visualization of point cloud data immediately after scanning. This allows users to validate data in the field and make necessary adjustments on site, reducing the need for post-processing and minimizing project delays.
In terms of workflow, the LS600 supports continuous, real-time positioning and data capture without the need for traditional loop closures, a step often required in standard SLAM processes. This advancement can decrease field time and improve overall efficiency. When operating in areas where GNSS signals are unavailable, such as basements or tunnels, users can establish ground control points for post-processing, maintaining high positional accuracy despite challenging conditions.
The scanner is equipped with removable, rechargeable lithium-ion batteries, each providing up to 1.5 hours of continuous operation. Fast charging capabilities and an LED power indicator support efficient field use. Data transfer is facilitated through a USB-C 3.2 Gen 2 interface, and the device includes a 512GB solid-state drive for onboard storage. Designed for handheld operation, the LS600 can also be mounted on a mobile vest or pole, offering flexibility and ease of use in various field situations. Its lightweight, all-in-one construction supports rapid deployment and straightforward operation.
The LS600 is suitable for a range of applications, including construction monitoring, as-built surveying, vegetation assessment, utility planning, urban renewal, mining and emergency response. Its combination of high accuracy, real-time visualization, and flexible deployment options is intended to improve data quality and operational efficiency for professionals across multiple industries.
The Spatial Sciences Institute (SSI), part of the Dornsife College of Letters, Arts and Sciences at the University of Southern California (USC), is a national leader in geospatial research and education. Founded on July 1, 2010, SSI has been educating students and professionals with both the theoretical foundation and hands-on technical training to advance spatial thinking and geospatial technologies.
Graduates solve complex problems across diverse industries and domains such as environmental sustainability, geodesign, public health, human security and geospatial intelligence. Education and training with GNSS are integral to SSI’s mission.
Addressing the Generation Gap
Despite its fundamental importance, the GNSS workforce is facing a growing generational gap as many experienced professionals near retirement, and fewer young individuals enter the field. This decline in incoming talent poses a critical challenge for industries that rely on high-precision positioning, from infrastructure development and environmental monitoring to national security and disaster response.
Part of the challenge stems from a lack of early exposure and awareness among younger generations about the relevance and applications of GNSS technology. Many students encounter the topic only indirectly, if at all, in traditional STEM or Geography curricula.
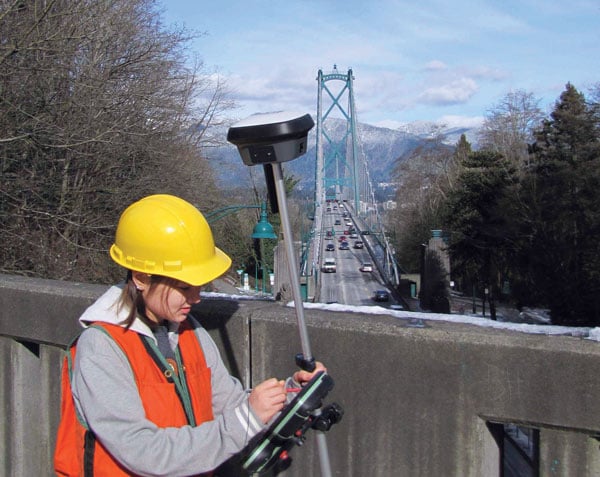
To preempt this generic approach, SSI has invested in high-accuracy GNSS receivers, RTK-enabled UAVs and immersive virtual/augmented reality visualization equipment to provide students the capability to translate the theoretical lessons in geodesy, spatial data acquisition, data analysis and integration into technical skills that result in actionable information.
Additionally, SSI has developed a range of experiential learning opportunities in GNSS to bridge the gap between classroom instruction and real-world GIS applications. While completing their coursework, students often solve the same real-world challenges as many industry professionals.
Engagement Through Experimental Learning
One such example is the undergraduate course SSCI 220L: Spatial Data Collection Using Drones, taught by Yi Qi, Ph.D., an associate professor with expertise in remote sensing and geospatial artificial intelligence. “When young students are introduced to imagery and geospatial technologies, one of the first questions they often ask is how the positions of real-world features are measured — and how accurate those measurements need to be for applications like building construction or urban tree mapping,” Qi explained. “This presents a great opportunity to introduce students to more advanced industry practices such as real-time kinematic (RTK) correction.”
Qi added, “We use the RTK-enabled DJI Mavic 3M drone for field data collections, which is often a highlight of the class.” One memorable field activity took place at the historic Los Angeles Memorial Coliseum, where students participated in drone flights alongside faculty. Before takeoff, they helped establish communication between the drone’s RTK system and the California Real-Time Network (CRTN), learning how to configure the system for centimeter-level accuracy. Later, they processed the imagery into high-resolution 2D orthophotos and 3D models. “This class benefits undergraduates by providing early exposure to GNSS,” Qi said. “This foundation is important for students to imagine their pathways in the geospatial industry and choose other advanced courses.”
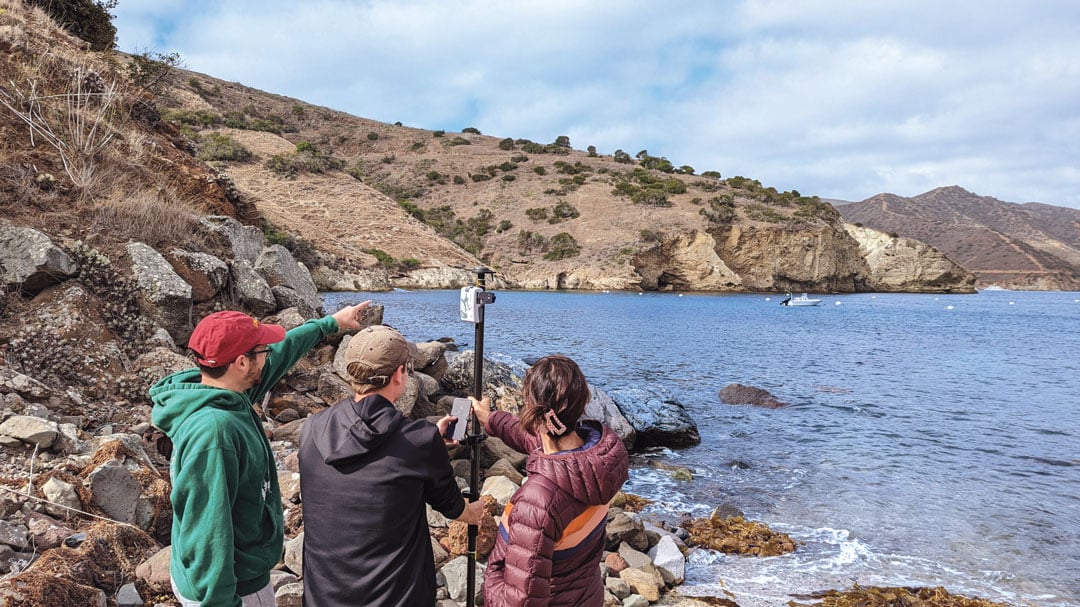
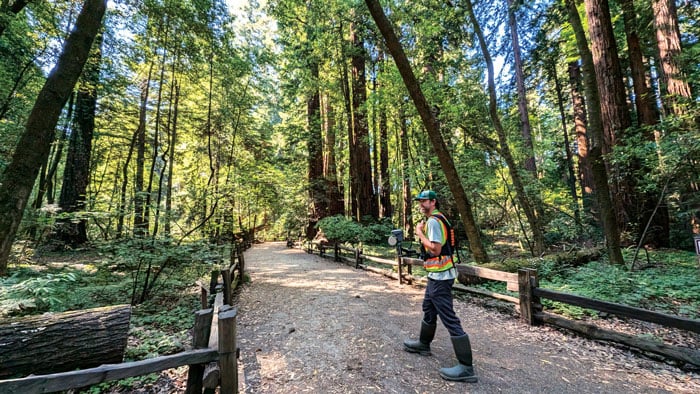
At the graduate level, as part of the SSCI 587: Spatial Data Acquisition course, students are required to participate in a week-long intensive-learning field experience at the USC Wrigley Institute for the Environment and Sustainability campus on Catalina Island. Laura Loyola, Ph.D., assistant professor in SSI with specialties in ecological physiology and field data collection, has led this course for many years and acknowledges that, “Catalina offers the ideal location for rugged terrain data collection, practice with online or offline mapping, and incorporates spatial data collection utilizing the RTK-enable UAV and high-accuracy GNSS receivers, with spatial analysis and visualization methods.”
While on Catalina Island, students meet with industry partners, such as Isaiah Mack, the owner of Eclipse Mapping and GIS, and an alumnus of USC, who bring professional experiences and the latest technology from industry. “The question now facing industry is whether the added investment in both hardware and training of personnel on high-accuracy GNSS receivers for spatial data collection is viable and needed for everyday uses, especially with RTK and satellite-based augmentation systems (SBAS) available,” Mack said. “The answer is overwhelmingly yes, with many mapping and GIS professionals utilizing centimeter-level RTK accuracy, so I feel it is important to share with students the growing market for these careers.”
Students quickly learn that without a viable connection, such as Wi-Fi or Starlink in remote areas, RTK capabilities in the UAV are limited. This requires the ability to incorporate high-accuracy ground control points into their collection workflows for georeferencing the drone imagery. As students work through the image processing and integration workflow, they gain firsthand experience in how GPS accuracy influences final image quality. Loyola noted, “In remote environments where WiFi connectivity is limited or non-existent, smartphone positional accuracy is decreased even more from the standard 30 cm to 50 cm, forcing students to work offline and with external GNSS receivers.”
Lastly, in certain field scenarios where students are unable to physically reach the survey target, they have learned to apply alternative methods to ensure accurate data collection. One effective technique involves using a laser rangefinder to measure the distance to the remote object. By combining this distance measurement with GNSS-derived position and bearing data, students can use in-app tools to calculate the location of otherwise inaccessible features. These experiences not only demonstrate their problem-solving abilities in challenging environments but also reflect a practical understanding of integrating complementary technologies to achieve high-precision geospatial results.
GNSS also has been integrated into the geodesign programs at SSI. Guoping Huang, Ph.D., is an associate professor with specialties in landscape planning and geodesign. “High-accuracy GNSS has become increasingly important in the architecture, engineering and construction sector due to the growing adoption of geospatial workflows,” he said. “These workflows span the entire project lifecycle — from spatially-enabled design tools that help create context-aware and environmentally responsive plans, to precision construction, where GNSS-integrated technologies such as sensor networks are used to monitor construction activities in real time.”
This integration ensures that construction adheres closely to the original design intent, minimizes costly deviations, and helps avoid damage to critical infrastructure. As a result, high-accuracy GNSS supports not only greater efficiency and accuracy but also enhances safety and sustainability in complex construction environments.
Empowering the Next Generation
By integrating GNSS into education programs and engaging students through practical fieldwork, faculty in the spatial sciences spark interest and develop the next generation of geospatial professionals. These efforts are essential to sustain the workforce and fuel innovation in a field increasingly critical to smart cities, climate science, autonomous systems and beyond. The experiential learning has inspired young generations to enter the geospatial workforce and make immediate, transformative impacts on existing practices.
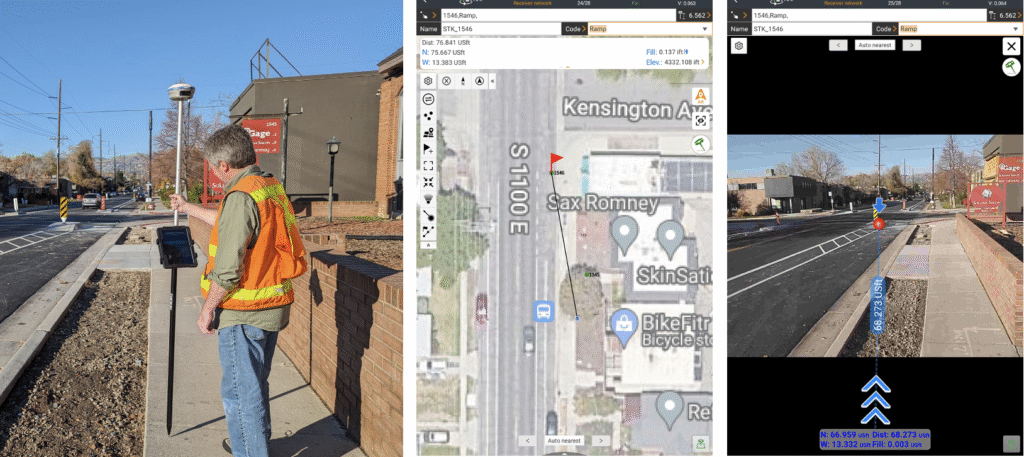
Student Evelyn Vega commented, “The concepts and hands-on experience from course SSCI 220L helped me understand and appreciate GPS technology.” Recent graduate Yimiao Wang, who now works with the County of Riverside, California, has directly applied the GNSS data collection and processing techniques learned in course SSCI 587 to her work in roadway deterioration detection with RTK-enabled drone imagery. Her ability to leverage high-accuracy GNSS not only enhanced the quality and efficiency of her team’s outputs but also led to her career development success. These examples illustrate how GNSS education can empower students to drive innovation and advancement in the public sector and beyond.
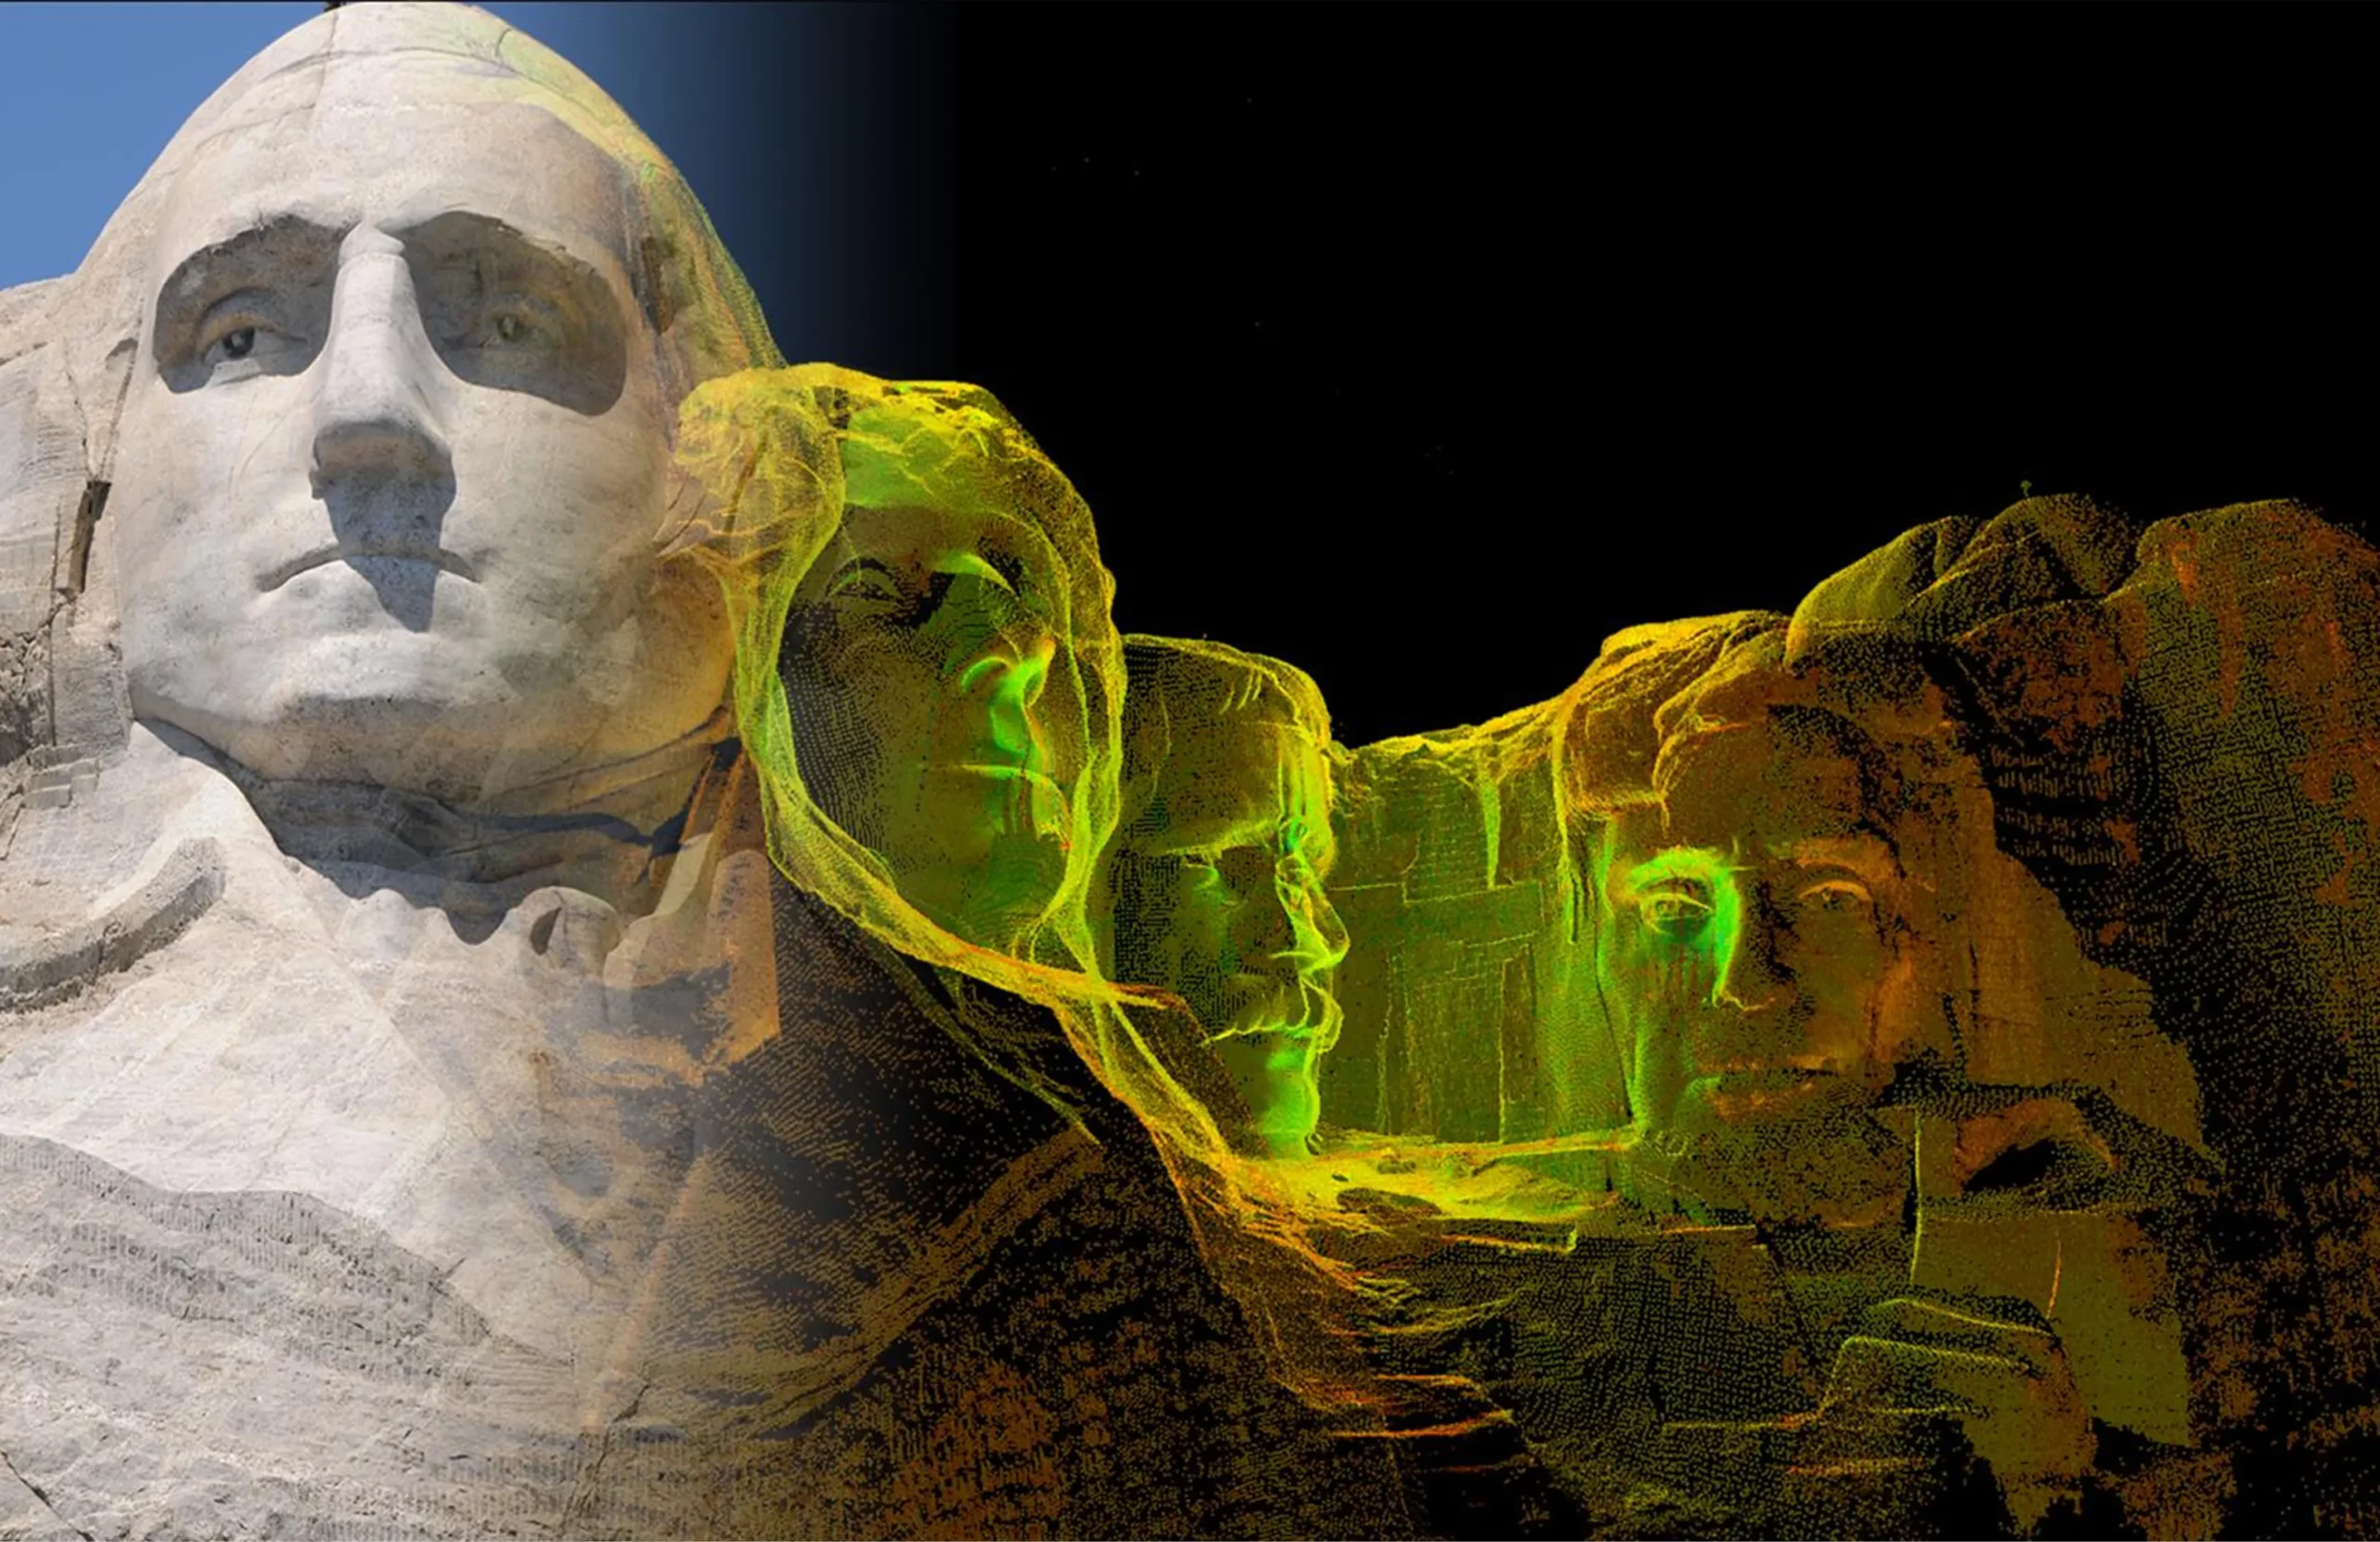
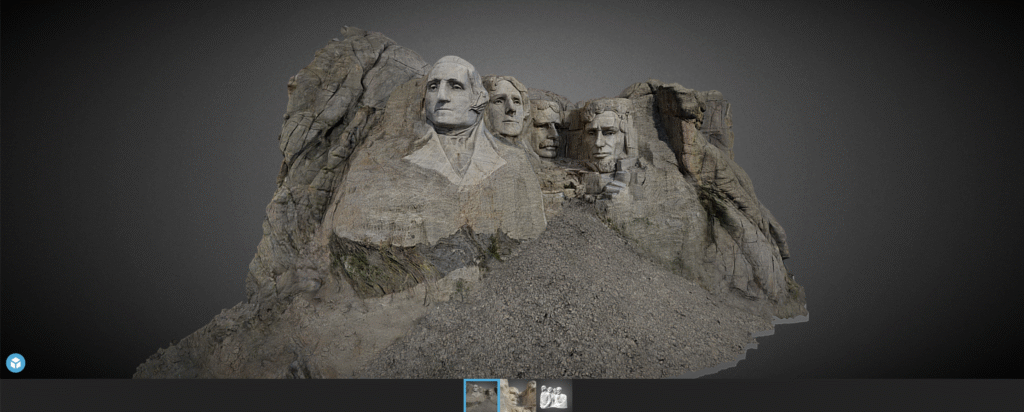
CyArk, a nonprofit organization focused on digital documentation of cultural heritage, has introduced a new virtual experience of the Mount Rushmore National Memorial in the United States. The 15-minute 3D tour — accessible via web, mobile or tablet — offers users an immersive perspective of the monument, highlighting its engineering achievements, artistic significance and the complex cultural narratives associated with the Black Hills region.
The virtual experience allows visitors to virtually ascend to the summit of Mount Rushmore, offering a close-up view of the faces of former presidents George Washington, Thomas Jefferson, Theodore Roosevelt and Abraham Lincoln. From this vantage point, visitors can better understand the intricsye artistry and scale of the carvings, aspects that are not easily observed during an in-person visit. The tour also includes access to the Hall of Records, a chamber situated behind the memorial, and the Sculptor’s Studio, where a 1/12 scale model of the original design — featuring full busts of the presidents — reveals sculptor Gutzon Borglum’s initial vision for the site.
“Mount Rushmore is one of the most recognized memorials in the world, but its story is far more layered than many people realize,” John Ristevski, CEO of CyArk, said in a news release. “We are proud to share this experience in a way that both highlights the engineering and artistry of the site, and acknowledges the deeper histories of the land on which it stands. Our goal is to bring the complexity of this place to light and make it accessible to new audiences.”
Laser scan of Mount Rushmore (Credit: CyArk)
Culture and Collaboration
A key element of the project is the inclusion of multiple voices that offer diverse perspectives on the memorial. Along with the historical context provided by museum professionals, the experience features commentary, music, and dance from Indigenous cultural interpreters who share their personal reflections on the significance of the land commonly known as the Black Hills.
The virtual tour is based on a highly detailed 3D digital twin of Mount Rushmore, created using advanced documentation methods such as terrestrial lidar scanning and high-resolution photogrammetry. The model incorporates data from the 2010 Scottish Ten project — a collaboration between the Scottish Government, the Glasgow School of Art and CyArk — as well as imagery from a 2016 CyArk expedition. These datasets were combined to reconstruct the memorial with millimeter-level precision, capturing both the prominent sculptures and lesser-known features like the Hall of Records and the Sculptor’s Studio. CyArk collaborated with local partners, historians and Indigenous cultural interpreters to shape the narrative and included archival photos from the memorial’s construction.
My previous newsletter highlighted a National Geodetic Survey (NGS) webinar held on April 25, 2025, titled “Design of Networks Using NOS NGS 92,” given by Dave Zenk, NGS northern plains regional advisory.
[Authors note: Dave Zenk told me that he is retiring from the National Geodetic Survey on May 31, 2025. Dave’s presence will be deeply missed. His dedication and spirit have left a lasting impact on NGS’s products and services. I hope his retirement is filled with joy, relaxation, and new adventures.]
In addition to Dave Zenk’s retirement, several other NGS Regional Geodetic Advisers have retired or left NGS employment over the past several months. Click here for a list of the current advisors, along with the names of interim contacts handling inquiries for those advisors who have retired or departed from government service.
As previously mentioned, Dave showed a well-presented outline of the tables that users need to be familiar with when using OPUS Projects to process and submit GNSS projects to NGS for publication. It should be noted that users submitting data to NGS must follow the guidelines outlined in NOS NGS 92.
I found the webinar to be very informative, and I would encourage all users of OPUS Projects to download the presentation. During the webinar, Zenk briefly mentioned three items that I believe deserve more explanation for anyone using OPUS Project. This newsletter will address the following topics in more detail:
The mark’s classification — primary, secondary, and local — will not be included on the NGS datasheet, but the local and network accuracy from the project will be provided on the datasheet. What does this mean to someone who’s using the mark in their project?
OPUS Project uses the F-statistic test to determine if the appropriate constraints were imposed during the horizontally and vertically constrained adjustments. Why does OPUS Project use this statistic?
The Constraint Ratio (CR) test, computed by OPUS Projects, provides a method for identifying which coordinates should be constrained and which should not be considered for constraints in the final horizontally and vertically constrained adjustments. What’s the best way to use this table?
First, the presentation discussed the tables that described the procedures for establishing three different mark classifications — primary, secondary and local. It also mentioned that the classification will not be included on the NGS datasheet but the local and network accuracy from the project will be provided on the datasheet. See the image below.
Photo: NGS website
What does this mean to someone who’s using the mark in their project? Since the NGS data sheet will provide the network and local accuracy from the project, users can determine if the accuracy value of the mark meets the requirements of their project. In my opinion, the network and local accuracy from the project provide a better indication and understanding of the level of trust of the published coordinate.
As previously mentioned, anyone submitting a GNSS project to NGS for publication must adhere to the NOS NGS 92 guidelines. During the presentation, Zenk provided several examples that depicted correct network designs. I would encourage everyone to download the NOS NGS 92 document and Zenk’s presentation to gain an understanding of the classifications and the network design requirements to meet a particular classification.
Adhere to NOS NGS 92 guidelines (Photo: NGS website)
Anyone who submits an OPUS Project to NGS for publication knows that the constrained adjustments must meet the requirements of the F-statistic test. So, what is this test, and why does OPUS Project require this statistic? Essentially, it is a method of verifying whether the appropriate constraints were applied during the horizontally and vertically constrained adjustments. The F-test evaluates the ratio of two variances; that is,
The F-test checks whether this ratio is significantly different from 1, which would suggest the models have significantly different fits to the data. The result is compared against the critical value from the F-distribution based on the degrees of freedom from the constrained adjustment and the degrees of freedom from the minimally constrained adjustment, and a chosen significance level alpha (e.g., 0.01). NGS OPUS Project uses an alpha level of 0.01% or 99% confidence level.
Once the adjustment has been deemed acceptable i.e. all shifts and residuals are reasonable, the F-test should pass. The F-test is a statistical test that helps determine if the variance (variance of unit weight) from a fully constrained adjustment is significantly different from the variance (variance of unit weight) of a minimally constrained adjustment. The variance of unit weight is a critical statistic and should be looked at carefully when evaluating adjustment results. If the fully constrained adjustment fits well with all selected control (the constraints), the value of the variance of unit weight should be close to 1.0. The F-test is performed using a 99% confidence level.
So, if the constrained adjustment statistics differ significantly from the minimally constrained adjustment, then there could be an issue with the constraints. Of course, this is assuming that the minimally constrained adjustment variance of unit weight indicates that all data outliers have been eliminated. So, why are constraints important?
OPUS Project first calculates GNSS coordinates in a minimally (free) network adjustment, which defines relative positions but not their absolute placement in space. Without constraints the entire network can float and/or rotate.
Constraints are important in GNSS network adjustments because they:
Anchor the network in a geodetic datum; in this case, NAD 83 (2011), epoch 2010.0.
Ensure a unique and stable solution that reflects the physical world.
Make the network useful for engineering, mapping, and scientific purposes.
Control point coordinates (from previous surveys or known datums) often have inherent errors or uncertainty. Constraining coordinates exactly assumes zero error, which is rarely true. Weighted constraints let you assign a realistic level of trust to known published coordinates by using error estimates. OPUS Project applies weighted constraints based on input error estimates (OPUS Project denotes these as sigmas of the coordinates), which allow for minor deviations in the constrained coordinates. The weighted constraint methodology provides flexibility to network adjustments by recognizing that published coordinates have some uncertainties and allows constraints to take on small corrections leading to more accurate and consistent network solutions. Although, it should be noted that the adjusted coordinates of the constraints from the final horizontally constrained adjustment are not updated in the NGS database even though there are minor deviations to their final adjusted values.
If the F-test fails, it is due either to the errors (sigmas) of the constraints being overly optimistic (too small) or the constrained coordinates not agreeing with the observations (causing excessively large shifts of the constrained coordinates). Failure of the F-test does not automatically mean the constrained adjustment is bad. It is a flag that indicates there may be a problem with the constraints, and that they should be investigated. In addition, the F-test assumes of a normal (“bell-shaped”) probability distribution of the residuals. Networks with a distribution that is significantly non-normal may fail for that reason, even when a constrained adjustment is acceptable.
if your adjustment fails the F-test, what do you do? How do you determine which constraint or constraints should be unconstrained? OPUS Project provides some information about the constraints that can be helpful in determining a bad constraint. The CR test, computed by OPUS Projects, provides a method for identifying which coordinates should be constrained and which should not be considered for constraints in the final horizontally and vertically constrained adjustments. What’s the best way to use this table? The box titled “Constraint Ratio” from NGS’s Online OPUS Project User Guide — (Section 12.7.3.2. Analyzing the Horizontal Constrained Adjustment) provides a good explanation with an example of using the constraint ratio table (12.7.3.2. Analyzing the Horizontal Constrained Adjustment). Basically, this statistic highlights coordinate shifts that are significantly larger than expected based on the sigma provided by the user. That is, coordinates that have a very small sigma should not be expected to change as much as coordinates with a very large sigma. The CR value is compared to a critical value of 3.0, which corresponds to a t-statistic at the 99% confidence level. Therefore, any constraint ratios greater than three should be investigated and are candidates to be unconstrained (see the box titled “Constraint Ratio”).
Constraint Ratio
If the F-test fails, it is possible that some constraints need to be freed up. It might be the case where some of the shifts are too large. The CR test provides a way of identifying where the bad shift might be. The CR is essentially a Students T Test, with the absolute value of the shift between the adjusted, constrained coordinates and the published coordinates, divided by the sigma (σ, or standard deviation) used to constrain the station. It is computed for each component (north, east, and height):
OP provides the CR for all marks in the final table in the output summary given in the body of the email or in the Processing Report (.txt), as shown below in Fig. 12.21.
Fig. 12.21 Constraint Ratio Test as seen in the Processing Report of the Horizontal Constrained Adjustment. (Photo: NGS)
Computed CRs are compared to the critical value or 3.0, corresponding to a T-statistic at a 99% confidence level. If the value of CR is greater than 3.0 for any of the three components, that indicates that there may be a problem with the constrained station.
I find these statistics very helpful when determining which coordinates should be constrained in the final adjustments. I hear that some users select all possible constraints and then start releasing marks based on the CR table. That certainly is one way of doing it but could be time-consuming and confusing. That said, the first thing I do is compare the minimally constrained adjusted coordinates to the published coordinates to determine if there are any obvious outliers. This has been helpful to me in large GNSS projects located in subsidence regions such as the Harris-Galveston, Texas, region of the United States.
One final note on OPUS Project
On May 22, 2025, NGS issued a notice to users, announcing the implementation of the International Terrestrial Reference Frame 2020 (ITRF2020). The announcement provided the following information addressed to all Active OPUS Project Users.
Active OPUS-Projects Users,
In early June, NGS will implement the new International Terrestrial Reference Frame 2020 (ITRF2020) and IGS20 realizations in the U.S. National Spatial Reference System (NSRS) in order to maintain consistency with the International Earth Rotation and Reference System Service (IERS) and the International GNSS Service (IGS) reference frames. This results in updated North American Datum 1983 (NAD 83) coordinates for stations in the NOAA CORS Network (NCN), kept at epoch 2010.0. This update is called the Multi-Year CORS Solution 3 (MYCS3), and it follows NGS’s MYCS2 effort from 2018.
OPUS-Projects users with active projects are advised that open projects will need to be reprocessed from the beginning in ITRF2020.
If projects are close to completion, users have the option of submitting them to NGS before the transition using the currently published NAD83(2011/MA11/PA11) coordinates transformed from ITRF2014. The deadline for submissions is June 6, 2025 for those wishing to take this route.
Above, I bolded several sentences that will be important to users currently performing projects using OPUS Projects. That is, all projects not submitted by June 6, 2025, will need to be reprocessed from the beginning in ITRF2020.
Users should continue to check NGS’s website for announcements regarding the transition from the alpha site to the beta site. Future newsletters will address the Multi-Year CORS Solution 3 (MYCS3) and will highlight the beta products as they are released.
Anyone who has had to carry cumbersome legacy surveying instruments over rough terrain can probably confess to daydreaming about having something like Mr. Spock’s “Tricorder,” a small device that captures everything about your surroundings. Such sci-fi devices anticipated the “reality capture” wave of the present day.
Multi-sensor stacks have become the norm and are essential for many geospatial applications. Consider vehicular autonomy. For safety-of-life considerations, no single positioning technique could suffice. Each sensor type has strengths and weaknesses. Lidar has good behaviors under certain conditions: radar, GNSS and inertial measurement unit. That is why a typical autonomy stack will include one or more sensor types. More data of different types is better, especially if it can share a common, highly precise spatial reference. Surveying and mapping are benefiting laterally from the research and development for autonomous solutions. In some ways, autonomy solutions have benefited from the long-standing legacy of research and development in geomatics applications.
Platforms, Positioning and Progress
As surveying and mapping practitioners, we are bombarded with news and ads for a seemingly endless parade of the latest reality capture devices: handheld SLAM scanners, drone payloads, mobile mapping systems, backpacks and more. Many are using OEM sensors from a relatively small subset of manufacturers; this trend is similar to the wave of third-party GNSS rovers a decade ago.
While the individual sensors deliver astounding data, integration into field capture devices often shortchanges one crucial element: positioning. There is a tendency to keep cost, size, and power consumption low by including positioning components (e.g., GNSS and IMU) originally developed for mass-market applications like vehicle autonomy. Not every handheld SLAM system can afford to add survey-grade capabilities, like that delivered by dedicated surveying rovers costing tens of thousands of dollars, so users need to have realistic expectations.
A surveyor might wince when they hear a marketing claim from yet another SLAM device manufacturer claiming, “centimeter precision, anywhere!” Even with top-tier survey rovers, skill and experience temper such expectations. But what if the platform of a highly capable, survey-grade rover, packed multiple data capture sensors? This idea is not new, and the evolution of rover-based solutions in many ways, enabled the development of the current wave of reality capture systems.
Positional Integrity Through Motion
It is a prospect that might seem counter-intuitive: deriving a precise position while moving the instrument. Providing tilt compensation for a GNSS survey rover (on a pole/rod) had long been desired. The impetus was to improve efficiency, namely by removing the time spent leveling the rod for each observation. Freeing the user from the tyranny of the bubble was one goal, but it was also the first crucial step in being able to enable further sensor integrations.
Integrity through motion is one of the foundational elements of GPS/GNSS: the trajectories of the navigation satellites can be predicted with high confidence. For example, frequently updated ultra-rapid orbit products utilized in many GNSS solutions rival the “precise” orbit products we used to wait days for. Similar principles apply to modern tilt compensation solutions. The movement of a rover head provides a highly predictable reference trajectory for the orientation of the tilt sensors.
Electronic bubbles and tilt compensation have been around for many years. For example, compensators are standard in many instruments, such as total stations, and tightly coupled GNSS+IMUs in mobile systems for road, sea, and airborne mapping. Consider the SPAN system from Hexagon | NovAtel. Such systems compute centimeter-grade positions for moving cameras, lidar units, and other sensors, while taking into account heading, speed, pitch, yaw, roll, and in the case of marine systems, heave — at highway speeds, plowing through rough seas, or zipping across the sky. The challenge, though, was miniaturization. Could such capabilities be developed to fit into a standard survey rover?
Tilt compensation in rovers began to appear over a decade ago. For example, in some JAVAD rovers of the day; other manufacturers were soon to follow. These were at the time, unfortunately, magnetic-oriented systems. While a noteworthy achievement, the inconsistencies inherent to magnetic reference and cumbersome calibration routines soured a lot of users to the idea of tilt compensation.
The Leica GS18T marked the beginning of the multi-sensor stack trend for GNSS rovers, introducing no-calibration tilt compensation in 2017. This was soon followed by the GS18I, adding a camera for offset points, stakeout, and point cloud creation. Since then, such features are common across the industry. (Photo: Gavin Schrock)
This changed with the announcement by Leica Geosystems at the October 2017 INTERGEO international exhibition and conference in Berlin of the no-calibration tilt-compensated Leica GS18 T GNSS rover. This was one of the first “stacked rovers,” spawning a chain reaction of similar feature integration across the industry.
“The main thing we wanted to do was to make measurements faster for the user,” said Bernhard Richter, vice president of product management geomatics at Leica Geosystems, when I interviewed him at the time of the GS18 T launch. The process was part of a 10-year initiative to improve field efficiency, but it was not the sole goal. Dynamic precise positioning was the first step to enabling the integration of additional features.
After a year or so of end users getting over the skepticism of tilt compensation, you will now find it as a standard feature on nearly all new GNSS rovers. Of course, users need to verify and build confidence in new solutions. Surveyors of a certain age might remember when nervous party chiefs would require taping/chaining of distances to verify if those “new lasers” were working right.
Adding Sensors
GNSS in sky-view-challenged environments was the impetus for the first multi-sensor integrations. Namely, how to get the shot under the adjacent canopy, or roof overhang. While manufacturers and integrators had been offering various ranging lasers as peripherals GNSS rovers since the late 1990s, the Achilles heel was the orientation; limited to magnetic references. Despite this handicap, such offset point solutions were popular for certain applications (e.g., asset inventory, trail mapping).
Once dynamic precise positioning was achievable in a rover head, it could become a platform for additional data capture sensors. Cameras were the logical first step. A camera included on some JAVAD rovers was leveraged by some users for photogrammetric computation of offset points. Leica Geosystems soon followed up its GS18 T, with the GS18 I, which added camera-based offset point capabilities. Rather than some early photogrammetric offset point solutions where you took individual static photos, with the GS18 I, you capture a series of precisely spatially registered images while in motion. In the companion Leica Captivate software, you can quickly identify the offset points. The same images can be processed in the software as a 3D point cloud, which many users do.
Again, we started to see camera-based offset point (and stakeout) solutions in nearly every brand of GNSS rover. What’s next? We’re starting to see lidar added to some rovers. But at what point should a field user reach for a dedicated reality capture device, rather than trying to do everything with an enhanced GNSS rover? There’s a lot to consider, so we asked some integrators for insights.
Eric Gakstatter, principal and owner of Discovery Management Group, has been promoting multi-sensor at conferences for decades. His firm also has developed and consulted on such sensors in conjunction with various manufacturers. Gakstatter highlighted some successful sensor integrations.
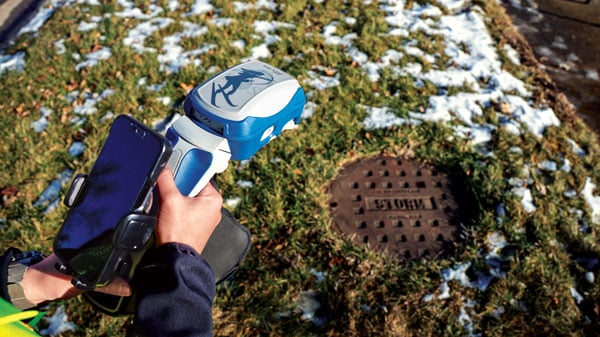
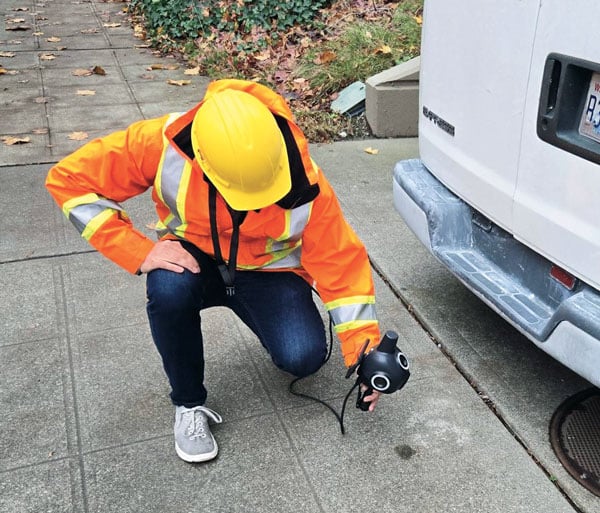
“There’s a difference between, say, those lidar SLAM devices and rovers,” he said. “With one, you are looking for a point cloud, but with the other, you are more interested in discrete points of interest; you’re very deliberate in measuring specific features.” Gakstatter had recently given me an overview of the Eos Positioning Systems Skadi GNSS rover, a next-generation receiver from the makers of the Arrow GNSS receiver systems. The Skadi features a built-in antenna and full tilt compensation, but also can be paired with a companion smart handle that offers some interesting multi-sensor capabilities. First, there is a “virtual pole” feature that wirelessly measures the distance straight down to the ground, eliminating the pole for certain applications. Another feature is a ranging sensor with a visible laser pointer for offset points and stakeout. “You can pull the trigger and trace along a curb line, collecting points in a continuous mode,” said Gakstatter. “It’s literally point and shoot simplicity.”
The Eos Positioning Systems Skadi rover fits on a pole, or this handle with automated height-above-ground and offset features measurement sensors. (Photo: Eric Gakstatter)
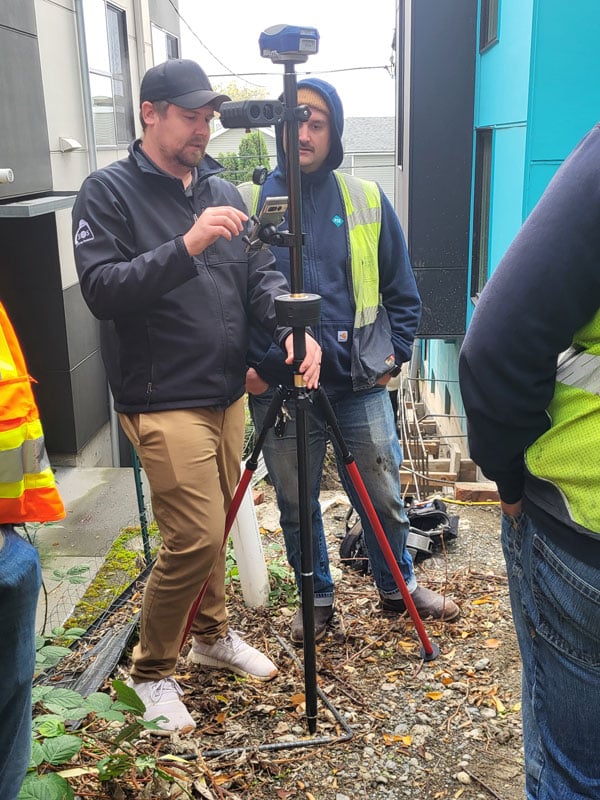
His firm has also developed, in partnership with another manufacturer, an angle encoding peripheral that mounts on the pole. When used in conjunction with a rangefinder-style laser, the GNSS rover can perform traverses in much the same manner as a surveyor’s total station. In a field demonstration for a utility services company, the crew did such a traverse along a roadway, then under canopy, in the shadow of tall buildings, inside a covered parking garage, and then closing back on the beginning outdoor points. This process would have taken much longer with conventional instruments.
While a strong advocate for multi-sensor integration, Gakstatter points out some of the challenges. “It just takes so long to get the right technology, the right packaging, the right power consumption, and then the manufacturers might need years to incorporate it,” said Gakstatter. “You can talk about these future technologies, but it just takes so long. Think about it, why haven’t the iPhone or the iPads become more rugged? Why can’t they make a replaceable battery? You know, all kinds of technology could be done in consumer devices, even multi-frequency GNSS, but they don’t do it. It’s driven by power consumption, real estate inside, size and cost.”
Adding peripherals is another approach for multi-sensor rovers. This system enables sky-view challenge data collection, as in this location between two buildings, with an angle encoder (middle of the pole) and offset rangefinder (under the Eos Skadi rover). With this combination, users can perform the equivalent of closed traverse loops. (Photo: Eric Gakstatter)
“I think you’ll find that some folks who just are going to go after the low-end sort of basic RTK receiver and some simple integration,” said Gakstatter. “But, you’ll always have the manufacturers that are sinking a lot of time and money into research and development, the pioneering stuff. But it is very expensive and for a relatively small market.” When new solutions are developed and integrated by those willing to invest in research and development, users gripe about high prices for the gear, but the payoff is a major increase in productivity and safety. Sure, such features might show up in lower-price-range rovers, but with varying degrees of performance.
Rover Lidar
Lidar can be quite powerful for creating 3D point clouds and models. However, doing a formal scanning campaign with a large-format laser scanner is not always justified. Even if a site is scanned, surveyors might still need to shoot key features with a total station and/or GNSS rover. This practical reality is why limited scanning capabilities (and imaging) were integrated into some total stations. For example, Trimble SX12 total station and the Leica Nova MS60 Multistations. As such instruments provide, by default, highly precise spatial references, any of the selective scans are automatically registered. Users find this aspect highly attractive, capturing rich 3D point cloud data, and images, without the need for extra registration steps.
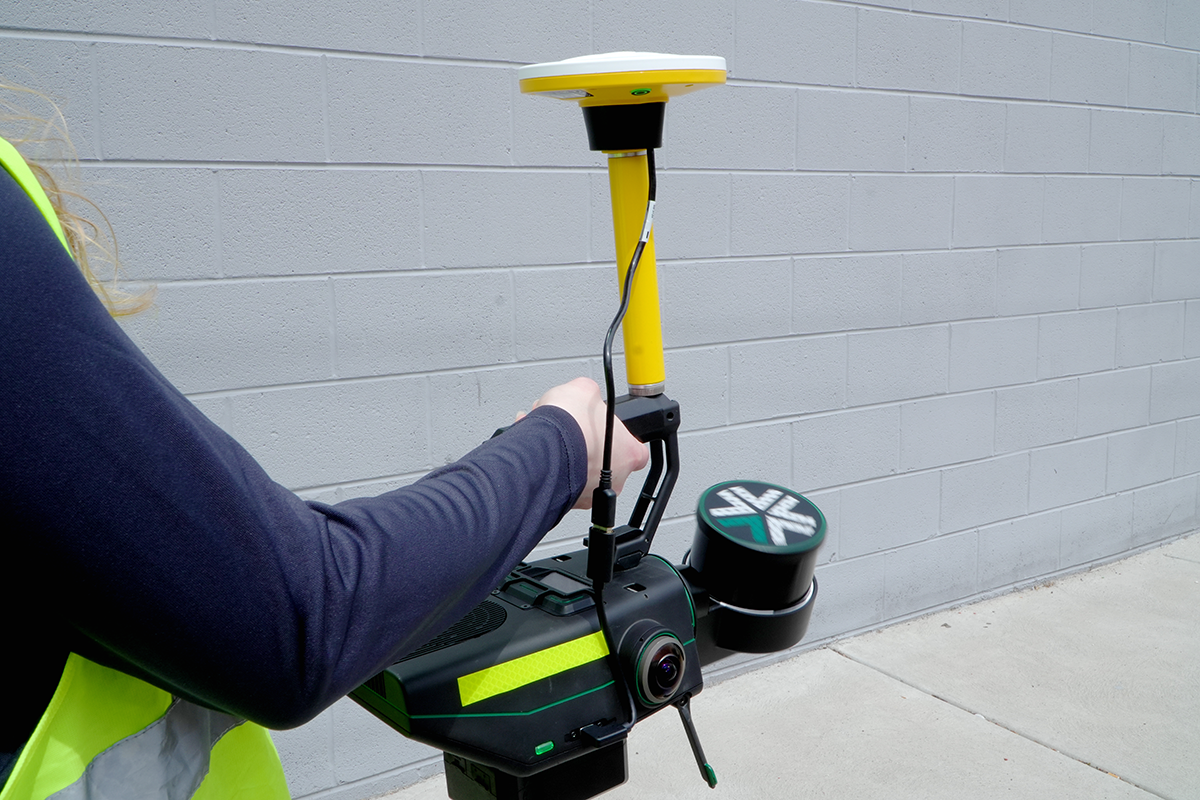
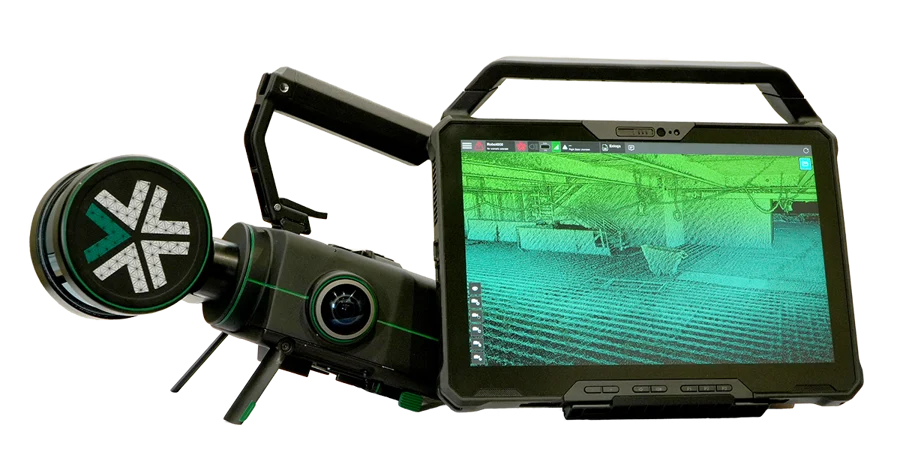
It was inevitable that GNSS rover manufacturers eventually would seek to add lidar scanners. In what might be one of the first, if not the first such integration (in broadly distributed commercial rover), CHC Navigation (CHCNAV) has its RS10 rover. It is a fully functioning high-performance GNSS rover but with a puck-style scanning head (16 channels or 32 channels for 320K or 640K pulses per second) mounted vertically, offset under the antenna. RTK and PPK workflows are supported.
It can operate as a rover or as a SLAM scanner. It should be noted that the scanner head is of the same quality as similar OEM heads on many SLAM handhelds, small mobile mapping systems, and even drone payloads.
According to Logan Zhou, mobile mapping business director at CHCNAV, when the RS10 was released in 2024, it brought a substantial boost to its mobile 3D sales. I asked what the fundamental differences were between this enhanced rover and a conventional SLAM mapping instrument.
“Compared to a traditional SLAM solution, we have integrated a high-performance receiver and antenna,” said Zhou. “So, the users can acquire the results with geographic coordinates directly.” He added that there are three cameras integrated into the RS10, for image capture and point cloud colorization. There are elements of visual and lidar position stabilization, that are also leveraged in what they call SFIX, to extend positioning capabilities into GNSS challenged areas.
Matt Sibole, PLS, owner of iGage Mid-Atlantic, part of the popular iGage surveying equipment sales and support network, has several RS10s in his rental inventory. He finds the unit very capable as a reality capture system. Sibole also related that his customers are also very pleased with the CHC units that have camera-based offset and stakeout capabilities, like the i89 and i93 (that have forward and downward tilted cameras for stakeout). The i89 and i93 point cloud capabilities utilizing photogrammetry are also quite intriguing to many of his customers.
One consideration of adding a high-precision SLAM scanner to a rover is weight. When using one for standard rover point capture for extended periods, the added weight can become a burden. Sibole prefers a different topography survey workflow. “I’ll go through with my CHC i89 rover, and pick specific points I need, as a check,” said Sibole. “I’ll shoot center and rims of manholes, shoot some property corners, etc. Then, I put that away and grab the RS10. With a connection source from my base, and I set it up for NTRIP, I can just walk around the site and collect the lidar.”
We discussed the growing trend for reality capture systems to have multiple deployment configuration options. You will see some compact systems that can be handheld, mounted on chest or backpack harnesses, attached to vehicles, and even carried as drone payloads. The one element that does, unfortunately, sometimes gets shortchanged is the GNSS component. As I alluded to earlier, there are low-cost GNSS boards that might be suitable for coarse mapping applications, but if you are looking for engineering design or construction quality models, quality makes a big difference.
Cameras Abound
Cameras are relatively small, light and low-cost. They have been a logical integration for at least some models of nearly all GNSS rover brands. Nearly a decade ago at an INTERGEO exhibition, I spoke with Winston Wen, CEO of the then relatively new brand of Tersus GNSS. Wen predicted a great future for multi-sensor GNSS rovers, noting that no-calibration tilt would be the crucial first step, which Tersus would integrate into their line of rovers.
A GNSS+IMU+Camera integration: the Tersus Trek, here shown being used on a survey for a school expansion project. (Photo: Dustin Harr, Desert Creative group)
Next, he wanted to develop enhanced rovers for users who could benefit from not having to pack a bunch of different instruments into the field, especially in remote areas, like for his customers in the Australian outback. Terus now has Trek, essentially a version of their flagship high-performance Oscar rover, but with an integrated camera.
“I think photogrammetry could overtake lidar, for many applications, as the sensor fusion gets better, the algorithms get better, and the actual physical hardware gets better,” said Jesse Huff, surveyor, geospatial thought leader, and general manager of Tersus in North America. “Even in the literary world, you know, a picture is worth a thousand words. There’s a lot more information to be gleaned from the images and the stuff that we’re doing with point clouds. The feature recognition revolution is just getting started.
“The point cloud that we’re getting out, I won’t say it’s as clean as some lidar data,” said Huff. “There’s a little bit of noise in that, but it rivals lidar data for most of what folks are doing, save for structural mechanical work.” The camera-based offset point and stakeout workflows of different manufacturers vary. Tersus offers the users three approaches. One is to initiate the automated image capture sequence by picking a target object in the controller, then it will proceed to look for the same point in subsequent images, to perform the triangulation.
The Tersus Trek enables two types of camera-based offset point measurement. The images also can be processed into point clouds for feature modeling and measurement, as shown in this example from a survey for a school expansion project. (Photo: Dustin Harr, Desert Creative Group)
Another is to take the image sequence and pick points in two or more images in the controller. Huff joked that the old-school surveyor in him prefers the latter option, but notes that a feature recognition algorithms improve, the process in such systems will become even more automated. One more option is to create a point cloud from the images and then select points from that.
One characteristic of legacy close-range photogrammetry, that is the source of lingering doubts about its utility, is the cumbersome processing workflows (of the past). Huff pointed out that the creation of the point clouds from the Trek is performed on the data controller, like their TC40. The same Tersus field software can run on an Android tablet or phone.
“I’ve done point cloud generation with Tersus Nuwa field software using my phone,” said Huff.” I’ve got a Samsung Z Fold5; it’s got a better processor, a quad-core processor, than the first computer that I was using for point cloud registration and processing.
That brings up a good point, noted Huff: “When you talk about sensor stacks, it’s not just sensors, it’s technology stacks. It’s not just taking advantage of the tech that’s in the receiver, it’s also taking advantage of the tech that has evolved in terms of mobile computing devices, artificial intelligence (AI), the cloud and more.”
GNSS Quality
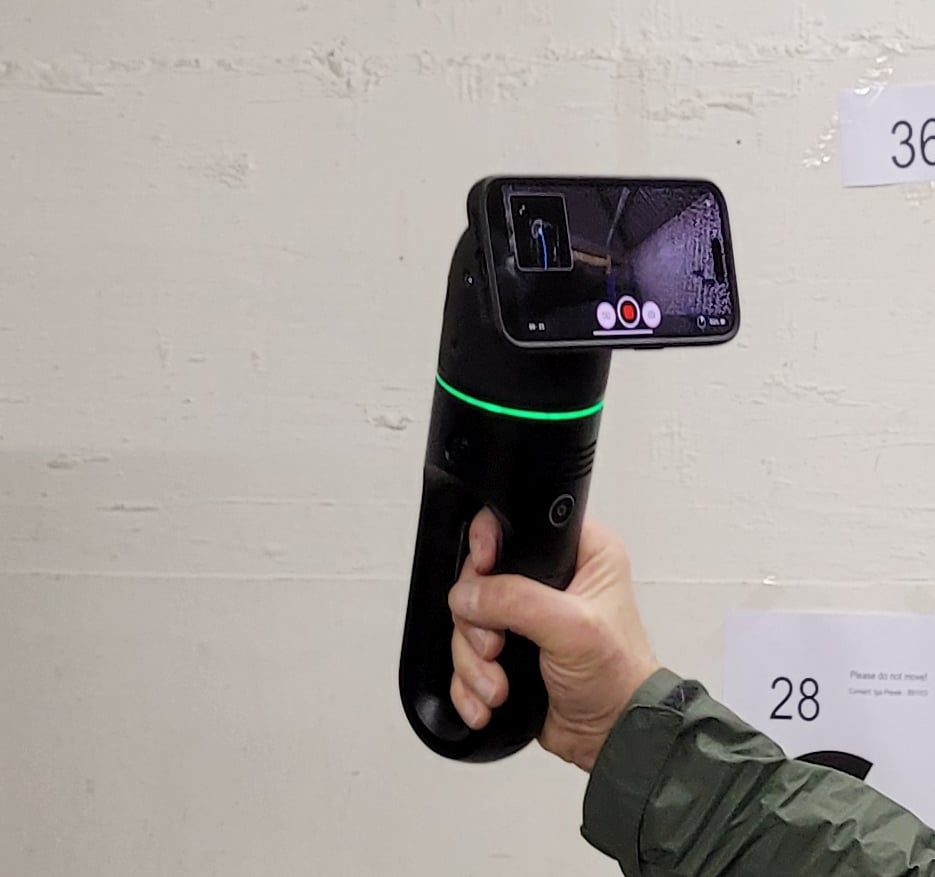
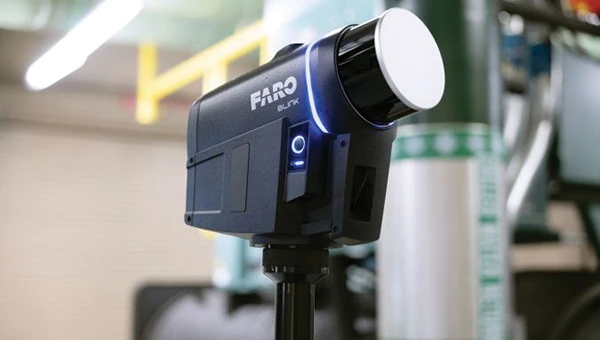
For many indoor, GNSS-denied environments, there are reality capture systems that can produce, through visual and SLAM stabilization, highly precise 3D point clouds and downstream models. A good example is the BLK family of reality capture devices from Leica Geosystems. The Leica BLK2GO is a handheld SLAM device that scans up to 420,000 points per second. It employs a tight integration of an internal IMU, a unique camera-based progressive spatial reference technique, and SLAM stabilization (together dubbed “GrandSLAM”).
For indoor applications, the crucial reference is relative to the structure. Outdoors, a SLAM scanner would typically need terrestrial reference points for absolute spatial registration, and/or leverage GNSS. Here is where the quality of the GNSS could mean the difference between having to set many control points with other instruments (substantially adding to project costs), or an appropriate minimum.
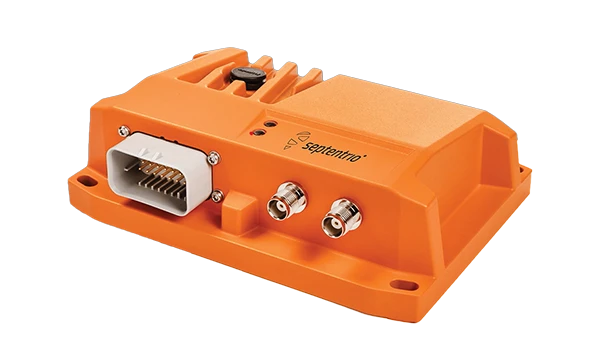
For their handheld, camera-based 3D mapping system, Looq AI opted for a high-precision GNSS board from Septentrio to integrate with an IMU for their automated PPK and AI processed workflow. (Photo: Gavin Schrock)
This paradigm was of prime consideration for Looq AI, when they were developing their flagship handheld, camera-based reality capture system. The system is a harbinger of another trend (that would need a separate article), about how close-range photogrammetry is coming into its own, and with recent advancements and techniques, is becoming a serious challenge to lidar, and especially SLAM lidar. I compared point clouds for a small site, between that of the Looq handheld, and a large format terrestrial laser scanner — and could not see any difference. How does it do this? And what role did precise GNSS play in this?
The script has been somewhat flipped. In the case of one recent development, instead of adding cameras to a rover, high-quality GNSS+IMU was added to high-quality and rigorously calibrated camera-based reality capture handheld.
“From a technological foundation, we knew that for triangulating thousands of image features, which are represented by points in the real world, multiple optics were required,” said Dominique Meyer, co-founder and CEO of Looq AI. “We create a triangulation algorithm for the camera system that would provide robustness that is much greater than many of the photogrammetric single-camera solutions out there, and at the same time, exceed the point cloud density of many lidar point clouds. A precise spatial and temporal component is crucial to apply to the observations.
“If you look at computer vision and GNSS independently as two independent sensor stacks, GNSS is robust in very specific environments,” Meyer added. “You have the number of satellite observations, quality of observations, precise time, and a set of corrections. Only when those are all good do you have great GNSS localization capability. The second you lose any of that, because you’re in a forest or under a roof or a bridge, you don’t necessarily know how robust your GNSS localization is.”
This is why Looq decided to make post-processed kinematic (PPK) an integral part of their workflow; PPK is performed automatically for the user, in the cloud, before point cloud processing. “Fundamentally, we knew that post-processing would apply better corrections, because it enables a backward pass in the corrections, fundamentally always exceeding or equating the quality from an RTK solution,” said Meyer. “Because our computer vision algorithms always run after the capture, we knew we could afford to run a PPK service, which would also allow us after the fact to decide which correction services to use. If you have a local base, you can use that. If you don’t have a local base, you can use a public correction service. And if you don’t have that, you can use a PPP solution.”
Another key component was the choice of the GNSS and IMU components of the Looq handheld. “We considered many hardware options. We had a layout of pretty much every GNSS receiver at the time out there. What we cared about was multiple bands, especially the newer bands like L5,” said Meyer. As noted, there are GNSS boards for many different applications, and while some of the lower-cost solutions are “multi-constellation,” they may only support a limited number of signals per constellation. Being able to work in limited sky and high multipath environments was important; low-cost boards can struggle with this.
Looq chose components from Septentrio. “The other part is spoofing and interference,” said Meyer. “Not that it is super common, Septentrio has put a lot of effort into filtering to make sure that you don’t get third-party interference across the RF spectrum that would affect the quality of the GNSS. Tests we had completed demonstrated that with the multiple bands and with the RF reliability, it was the best, which would allow us to produce the best market product.”
Visual offset point and stakeout with the CHC i89 rover (left), and in the Landstar field software (center and right). (Photo: J. ZoBell, iGage)
Duality
I circled back with Bernhard Richter of Leica Geosystems, who shepherded the development of that pioneering stacked rover, the GS18 T. We discussed the question of GNSS rovers as a multi-sensor platform. Several key themes emerged from the conversation.
Surveying is, in many ways, reality capture, but it is handled in a different, more selective and focused manner. Features observed must often meet very tight precision and integrity expectations: property marks, control for engineering and construction, monitoring, and more. Reality capture is about mass data capture. While there are advantages for certain applications in the proximal richness of mass data capture, there always may be the need for discrete points.
“When we designed the GS18 T, we recognized a challenge in bridging the gap between single-point measurement and reality capture,” said Richter. “Our goal was to improve the efficiency of discrete point collection while maintaining survey level quality.” With tilt achieved, the later addition of camera-based offset point capabilities to the GS18 I, was simply to improve efficiency even further.
“One of the main concepts behind the GS18 I is that everything you capture through photogrammetry is immediately aligned with the same reference frame or coordinate system as your normal GNSS points,” said Richter. “This additional feature does not put any extra burden on your hardware, and if you work in the conventional way, it performs just as well as any other method.” While you can produce point clouds from the images, that was not the primary goal, but a nice feature for certain situations. This raised another consideration: is capturing potential excess data a wise move?
“You can use mobile scanners, or sensors on your rovers, and generate point clouds of everything,” said Richter. “Capturing massive amounts of data is easy from a hardware perspective. But then you have to process and use all of this data. Right now, the software side of the industry is playing catch up. There just isn’t enough automation yet, though AI will certainly help with that moving forward.” It is a common complaint in the geospatial sector that there are substantial backlogs in the office processing of reality capture data.
“Yes, you can scan everything and then have someone extract the needed data from the point cloud,” said Richter. “But depending on the application, your client might be better off with a more conventional survey of discrete points chosen in the field. That said, for capturing large areas or long road corridors, a terrestrial scanner, mobile mapping system, or drone may be the most efficient option.”
Those applications aside, I hear misgivings among surveyors about the “scan everything” approach. They often can meet the needs of clients with conventional topo, mapping right there in the field, and that reduces the office component dramatically compared to a scanning workflow. So, is there a compelling need (for now) to add mass data capture sensors to survey rovers? Perhaps not. As prices for reality capture devices, SLAM scanners, drones, etc., drop over time, they become part of a firm’s standard kit, along with a rover and total station.
“We’ve always been keenly aware of the technology hype cycle,” said Richter. “There’s the initial excitement, then a trough of disillusionment, but if a solution truly improves productivity, adoption comes later. We could have added magnetic oriented tilt compensation long ago, but recognized that we could not rely on the Earth’s inconsistent magnetic field. It could have resulted in a substandard product. It was best to invest our efforts into the type of tilt used in the GS18 T.” While I did not press for any details about what might be next for their research and development, I sensed that the subject of additional sensors for rovers would keep the same principal in mind.
“At the end of the day, you need to solve specific customer problems,” said Richter. “There’s a lot that can be done, but not everything adds efficiency in the way people might expect. Often, the downstream automation isn’t there yet to handle a flood of additional data. Integrating additional sensors can require tradeoffs, and in many cases, there may already be more efficient options available. Not every application benefits from a mass data capture approach.”
What If?
Manufacturers can be averse to revealing what they’re working on next but watching lateral developments in the world of geospatial sensors, certain moves might seem inevitable. We’ve seen how disruptive the addition of various types of Time-of-Flight (ToF) sensors, to consumer tablets and phones, has been. For certain (very short-range) applications, the point cloud quality from some phone sensors rivals, or even bests that of some lidar systems. There are also examples of highly refined ToF sensor implementations in reality capture devices, such as the Leica BLK2GO PULSE.
Approaches to adding multiple sensors, be that to GNSS rovers, or dedicated reality capture devices, may someday merge as newer, smaller, and more capable sensors are added to the former, and improved positioning capabilities are added to the latter. The Leica BLK2GO PULSE is an example of where solid-state time-of-flight sensors can be leveraged, rather than traditional laser scanning profilers (that have moving parts). (Photo: Gavin Schrock)
There has even been a wave of devices that allow you to attach your ToF-enabled phone to the handle, which also features an RTK-capable GNSS antenna and receiver. These have become popular, for instance, capturing utilities in an open trench before they are buried. One concern is that there is a tendency to skimp on the GNSS hardware. You only get to measure those pipes once. Why not get the best-quality data?
So, why not put the ToF sensors on a high-performance rover? Someone is bound to do it; it is just a matter of time. The same applies to other solid-state lidars. There are some types of what folks call solid-state lidar that have moving parts on the MEMS. But now we are seeing true solid-state lidar (no moving parts), for instance, that are integrated into mobile mapping and road inspection systems by XenomatiX. There are still some miniaturization and power budget issues ahead, but we will likely see solid-state lidar on rovers at some point, which would overcome the weight handicap of SLAM lidar heads attached to rovers.
Then we can look ahead to the near-sci-fi realm of quantum sensors. Read more on this subject at: gogeomatics.ca/quantum-surveying. Quantum technologies could someday upend imaging and lidar approaches, and other sensor types. For example, quantum radar could employ more bands on a single, smaller antenna than the large separate antennas required of conventional radars. Radar has particular advantages for foliage penetration. Imagine scanning a roadside with solid-state lidar, and then radar enhances what you can see under and behind the vegetation.
Relatively small quantum antennas have been demonstrated to detect the entire RF spectrum; these could be super-sensitive to specific bands and help mitigate multipath, spoofing and jamming hazards. On the subject of commonly mentioned vulnerabilities to GNSS, quantum magnetometry is showing promise for not only an alternate navigation approach but could act as a “canary in a coal mine” for GNSS applications, detecting offsets that would indicate spoofing.
Within the last month, a functioning and commercially offered quantum navigation device was announced, and it is nearly pocket-sized. Sorry for the geek detour, but there could be fascinating things ahead.
The compact ComNav Technology Venus rover has tilt compensation and a ranging/tracking laser that can be used to do measure-ups when on a pole or offset point/stakeout as shown in this example of measuring a drainage hole invert. (Photo: Gavin Schrock)
Some folks dismiss the prospect of a multi-sensor GNSS rover as being like a multi-tool, like a Leatherman or Swiss-style military knife. Super handy when you need it, but the individual tools might not ever match the utility of a dedicated tool. I’m among those who, to some degree, disagree with that analogy. Unless it is a case of some slapped together systems (with the lowest cost components possible), for many systems, the added-on features can boost productivity and deliver precise data (with careful and appropriate practices).
Sometimes, the zeal to stack rovers is not always successful. There was the case of a manufacturer embarking on an earnest initiative to build a sensor-rich add-on for a GNSS rover, which some envisioned as a way to match the capabilities of a total station. However, it appears that the initiative has been suspended.
There’s a lot for users to consider: do they invest in multiple dedicated instruments, and can they afford the best of each? But on the other hand, is the stacking of multiple sensors on a GNSS rover really warranted or even practical? Can combo systems effectively meet most of your needs? Do you consider fit-for-purpose solutions? The good news is that the progression of innovation in hardware and software is continuous. There are a lot of intriguing options already out there, with more to come.
Read a roundup of recent products in the GNSS and inertial positioning industry from the May 2025 issue of GPS World magazine.
SURVEYING
Integrated Navigation Solution Ideal for inspection and survey applications
Photo: Teledyne
Teledyne Compact Navigator is an ultra-compact autonomous integrated navigation system engineered for subsea and surface vehicles. It is ideal for small vehicles, enabling inspection and survey operations on compact platforms. The system is offered in two depth-rated models, one capable of operating at 4,000 m and another at 300 m. The Compact Navigator consumes less than 7 watts of power, extending mission duration by conserving energy. The system operates fully autonomously, eliminating the need for external aiding or operator intervention. Advanced phased array Doppler Velocity Log technology enhances performance while allowing the device to be mounted on an autonomous underwater vehicle or ship hull.
The Compact Navigator supports a broad range of applications, including autonomus underwater vehicles, shallow water surface navigation, operations in GNSS-denied environments and dynamic positioning for surface vehicles. The system provides true North-seeking gyrocompass-grade performance, and its web-based user interface supports integration, operation and troubleshooting. It is factory-calibrated and offers a battery backup option for reliability in demanding conditions. The system operates independently of satellite signals, making it resistant to jamming or signal loss. This capability is significant for shallow water navigation, where GNSS-based systems may be unreliable.
3D Reality Capture Solution Can be used across various industries
Photo: Faro
FARO Blink, a new 3D reality capture solution, is designed to make collecting and utilizing 3D data more accessible and efficient. It centers on software-driven technology integrating advanced visualization and automated workflows through the FARO Sphere XG Digital Reality Platform. This integration aims to simplify operations and deliver faster, more actionable insights for users across various industries.
FARO Blink is tailored for professionals in fields such as surveying and construction. It offers high-quality visualization and can streamline workflows, allowing teams to efficiently capture, view and share 3D data, thereby enhancing project progress and collaboration.
The MS400C is a fully integrated multibeam echosounder designed for uncrewed surface vessels. The new system combines sonar processing, inertial navigation, GNSS positioning and sound velocity sensing into a single unit.
The MS400C seeks to address deployment challenges faced by USV operators during hydrographic surveying. Its compact, lightweight design allows direct mounting on small platforms. Installation involves connecting a few cables to the IPC and power supply and to the primary and secondary GNSS antennas. With preconfigured spatial relationships, operators can deploy and start surveying quickly, reducing configuration errors and ensuring consistent data quality.
Equipped with Auto Survey functionality, the system calibrates parameters based on water conditions, which streamlines pre-survey procedures. Real-time roll compensation and attitude data from the internal measurement unit, combined with sound velocity profiling, ensure high-fidelity depth measurements, even in dynamic conditions. Designed for autonomous and remotely operated survey platforms, the MS400C supports data collection in confined waterways.
The SurveyPod RTK/PPK GNSS system is built for professionals in surveying, agriculture, mining and construction. The system integrates GPS, GLONASS, Galileo and BeiDou signals for improved satellite visibility and accuracy, even in harsh environments.
Powered by a CORS Network, SurveyPod offers real-time, centimeter-level positioning ideal for high-precision applications. The device supports tilt compensation for reliable data collection at angles and boasts up to 16 hours of battery life, making it ideal for extended field operations. With this launch, Nibrus Technologies is expanding its survey equipment portfolio, offering a Made-in-India GNSS solution to the global market.
This MEMS-based north-seeking inertial measurement unit (IMU) operates independently of GNSS. It can achieve a heading accuracy greater than 1° secant latitude without GNSS assistance. When integrated with GNSS and SBG Systems’ navigation algorithms, it can achieve INS heading accuracy greater than 0.01°.
Measuring 52 x 52 x 36 mm and weighing less than 150 g, it consumes only 2 watts of power. It offers long-term reliability in demanding conditions, and its ITAR-free status allows unrestricted global deployment. SBG Systems also has developed a new pure north-finding algorithm capable of rapid initialization in both static and dynamic conditions within one minute, as well as an advanced GNSS/INS fusion algorithm that delivers exceptional single-antenna heading accuracy even in low-dynamic environments.
The IMU is particularly suited for subsea applications, including remotely operated vehicles and autonomous underwater vehicles, as well as geospatial and marine surveying tasks requiring precise single antenna heading accuracy.
The first off-the-shelf solutions are expected to be available by early 2026. SBG Systems
Post-Processing Software With upgraded features
Photo: SBG Systems
Qinertia 4.2 is an updated version of SBG Systems’ post-processing software for GNSS and INS data. One of the notable additions is the beta version of Precise Point Positioning Fixed Ambiguity, which offers centimeter-level accuracy processing without the need for a base station. The update also includes a new RTS smoothing option, the Trajectory Smoother, which enhances INS processing by removing artifacts while maintaining precision. Another feature is the standalone Lever Arm Estimation Tool, now available as a separate application with a simplified interface. The Advanced Virtual Base Station Network Creation has been enhanced with improved base station quality indicators to increase reliability.
It is compatible with the New Ellipse series and supports Teledyne Intrepid INS. The software now offers faster processing speeds, enhanced geodesy functionalities such as base station velocity analysis, and updated tools for assessing processing quality through new status plots. It also supports the latest firmware versions of Ekinox, Apogee, Navsight and Quanta systems. SBG Systems
MACHINE CONTROL
GNSS Receiver and INS System For machine guidance
Photo: Septentrio
The AsteRx RB3 GNSS receiver and the AsteRx RBi3 GNSS/INS system are designed to operate in extreme environments. They feature IP69K-rated housings and components that have undergone ISO-standard testing.
The technology offers durability under heavy shocks, vibrations and challenging environmental conditions, making it suitable for demanding applications such as construction, mining and port automation.
The AsteRx RB3 and RBi3 utilize multi-frequency GNSS technology to deliver precise, centimeter-level positioning even in environments where GNSS signals are typically difficult to maintain. The receivers can be mounted externally on heavy machinery or integrated into chassis systems, offering flexibility in placement and simplifying installation.
The AsteRx RBi3 incorporates FUSE+ technology, which combines a high-performance GNSS engine with an industrial-grade inertial sensor. This integration provides accurate orientation data, such as heading, pitch and roll, alongside reliable positioning. In dual-antenna configurations, the receivers deliver sub-degree GNSS heading accuracy immediately upon initialization. The AsteRx RB3 and RBi3 are ideal for machine guidance in industries requiring rugged equipment to maintain precision under extreme conditions.
Handheld Reality Capture Solution For maximum mobility
Photo: Topcon Positioning
Designed for mass data solutions, the CR-H1 utilizes PIX4Dcatch, a specialized application with integrated lidar that runs on iPhone devices. It collects images and employs photogrammetry to create detailed, full-color 3D point clouds. The iPhone connects to Topcon’s HiPer CR receiver, enabling the application to collect georeferenced images. The receiver and iPhone are mounted on a specialized handle designed and manufactured by Topcon so that users can capture point clouds without a tripod.
The CR-H1 can be used for utilities and subsurface mapping, construction verification and earthworks, civil engineering and site verification, land surveying and forensics and 3D data capture. Topnet Live subscriptions are available for the CR-H1, providing real-time GNSS corrections that deliver higher-quality point clouds.
Handheld GPS Device Can provide up to 200 hours of GPS navigation on a single charge
Photo: Garmin
The Garmin eTrex Solar is a handheld GPS device with a built-in solar charging feature. This feature allows for potentially unlimited battery life in optimal sunlight conditions. Even without direct solar input, the device can provide up to 200 hours of GPS navigation on a single charge, making it suitable for extended trips with limited access to power.
The device supports GPS, GLONASS, Galileo, QZSS, IRNSS and Beidou. It features a rugged design, an IPX7 water resistance rating, and a compact, lightweight body that can be attached to a backpack or worn around the neck. Users can import GPX files and navigate to waypoints, courses and geocaches. It also includes a three-axis compass and can store up to a thousand waypoints, 50 courses and 200 activities.
Users can connect the eTrex Solar to their smartphones through the Garmin Explore app, which enables additional features such as geocaching details, weather updates, software updates, trip planning, and cloud storage syncing.
New Product Offerings Now featuring marine GNSS antennas
Photo: Geo-matching
Geo-matching has expanded its product database to include GNSS antennas. The initial marine GNSS antennas featured in this new category are the VP6300 from Calian GNSS, formerly Tallysman, and the AV34 from Trimble.
Geo-matching features detailed information on more than 1,300 products across 63 categories for surveying, navigation and machine guidance. The website is designed to guide users through complex product specifications, offering access to brochures, case studies, product videos and professional reviews. Among the many categories available on Geo-matching.com are hydrographic processing software, GNSS receivers, GIS software, inertial navigation systems, total stations, UAVs, sidescan sonars, imaging sonar and more. The platform encourages users to browse its extensive catalog, upload new products, leave reviews and register their companies to add products to the database.
Mapping UAV With a new “Smart Return-to-Home” feature
Photo: Flyability
Flyability has introduced a “Smart Return-to-Home” (RTH) feature for its Elios 3 UAV, designed to enhance its autonomous capabilities. This feature allows the UAV to return to its take-off point using the shortest available path while avoiding obstacles in real time.
During flight, Smart RTH monitors battery levels through a new flight management gauge, notifying the pilot when it is time to return. The feature is activated via Flyability’s Cockpit flight app, and pilots can take manual control at any point. By automating the return process, the system helps pilots focus on inspections without concerns about battery management or navigation in complex environments. Smart RTH uses lidar scans to generate a flight plan that the UAV executes independently.
The AirWarden Remote ID Receiver detects and decodes Remote ID signals broadcast by UAVs. It is designed for organizations and authorities that need to monitor UAV activity for safety, security and compliance with regulations.
It decodes the information transmitted by UAVs in accordance with FAA and other regulatory standards. The data it captures includes the UAV’s identification number, its precise location (latitude, longitude and altitude), the takeoff location, operator location if available, timestamps, and other relevant metadata.
The AirWarden can be deployed as a standalone unit or integrated into larger security and monitoring systems. Users interact with the system through a web-based or software interface that facilitates live monitoring, alert management, and data analysis.
Additionally, the AirWarden can integrate seamlessly with other security infrastructure, such as video surveillance and access control systems. This integration seeks to improve how security teams automate responses and coordinate actions when unauthorized or suspicious drone operations are identified.
The Archer 4 with GNSS Expansion Pod and RTK connection is now an all-in-one centimeter mapping solution.
Juniper Systems Inc. announces that the GNSS Expansion Pod for the Archer 4 Rugged Handheld is now RTK capable. Juniper Systems is also launching a new application for the Archer 4 called Archer Connect. The Archer 4 with GNSS Expansion Pod and RTK connection is now an all-in-one centimeter mapping solution.
“We are very excited to bring this update to the Archer 4,” said John Florio, senior product manager at Juniper Systems. “The Archer 4 with a GNSS Expansion Pod and an RTK correction is the optimal all-in-one high-precision mapping solution.”
Archer Connect is a utility application that allows users to easily manage their GNSS expansion pod that is attached to their Archer 4. In Archer Connect, users can set up and manage their RTK network connection. Archer Connect is available on the Google Play Store.
The GNSS Expansion Pod attaches and interfaces with the Archer 4 through the Archer’s back contact pads. This allows for a compact one-handed device. The Archer 4 is a rugged handheld device designed to work in extreme environments. Featuring Android 14 and expanded battery options for increased runtimes in the field.