1Spatial — a global provider of geospatial software and solutions for improved data governance — has launched the 1Capture, a customizable mobile application for data capture.
1Capture is a mobile GIS editing application that is multi-use and configurable. It provides accurate and reliable GIS data collection and editing in the field for a multitude of asset, job, and survey types.
Customizable rules and actions work to improve data quality at the point of capture. This ensures good quality data is captured at source, minimizing re-surveys. The built-in rules engine automatically validates and corrects the GIS and non-GIS data collected, whether working online or offline.
1Capture connects with a variety of GIS environments including Esri ArcGIS and open-source technologies such as PostGIS and Geoserver.
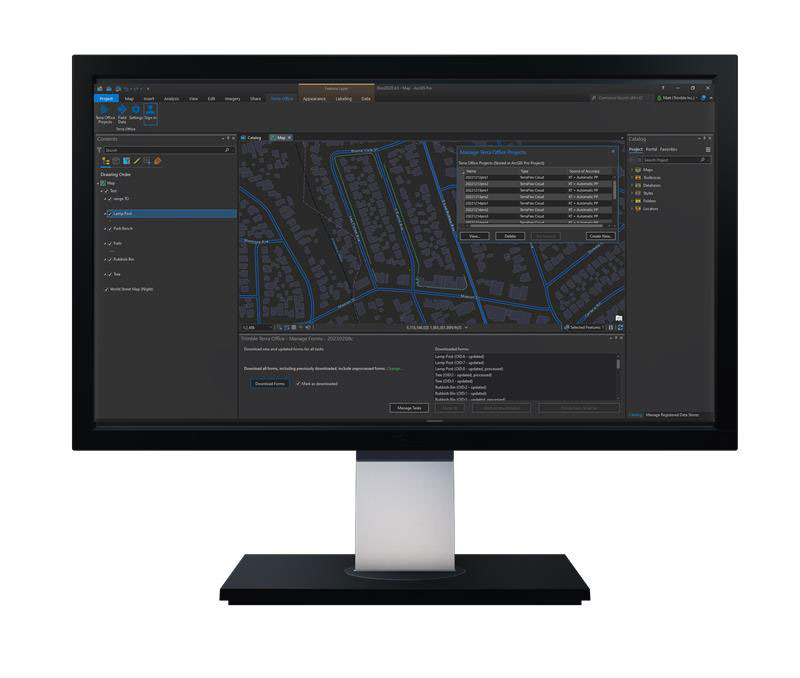
Trimble has released the Trimble Terra Office add-in for Esri ArcGIS Pro. The add-in is a part of Trimble’s Terra Office suite of desktop solutions for integrating Trimble TerraFlex field data collection software with GIS systems of record.
With a streamlined user interface, the new Terra Office add-in for ArcGIS Pro enables users to connect TerraFlex workflows directly to the ArcGIS platform from within ArcGIS Pro — Esri’s desktop GIS application. ArcGIS Pro users can now create and manage TerraFlex geospatial data collection projects without leaving ArcGIS.
Organizations that collect data in TerraFlex and bring it into ArcGIS through the add-in can also use the Trimble Offline GNSS Corrections service, for situations where real-time correction services are intermittent or unavailable. With this service, all data from the field is automatically processed in the cloud without user intervention, and the most accurate real-time or post-processed position is stored for each feature and made available for download through the Terra Office add-in for ArcGIS Pro.
For more information on the Terra Office add-in and its availability, click here.
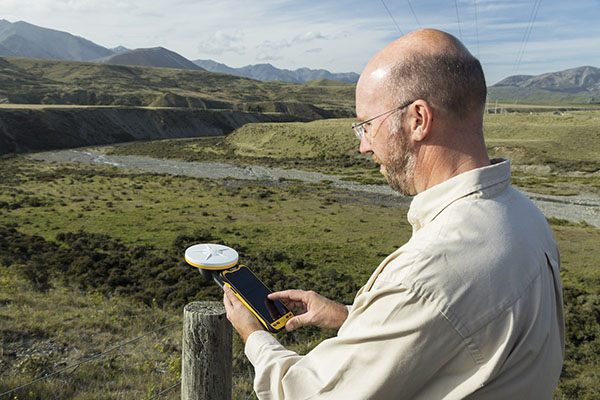
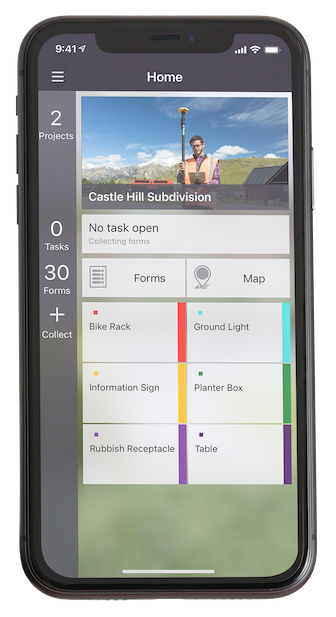
Trimble has released the Trimble TerraFlex Premium edition, a new tier of Trimble’s flagship geographic information system (GIS) data-collection software. The edition provides customers with offline GNSS corrections.
The new automated service works exclusively with Trimble GNSS receivers — including the Trimble DA2 receiver for the Trimble Catalyst positioning service — to provide high-accuracy GIS data capture in a wider range of locations and difficult GNSS environments than was previously possible.
TerraFlex users can increase the quality and speed of their data collection using offline GNSS corrections in situations where real-time services are intermittent or unavailable. Using the new service, all data from the field is automatically processed in the cloud without user intervention.
The most accurate real-time or offline processed position is stored for each feature, unlocking a high-productivity enhancement for all TerraFlex Premium subscribers.
Combining data-collection software and offline GNSS corrections into a single TerraFlex subscription simplifies both the workflow and the purchasing process for GIS organizations, from state and local governments to enterprise customers, including federal governments and utilities companies. This workflow to collect, process and deliver the most accurate and reliable positioning information reduces complicated manual processing steps and helps preserve data integrity.
Photo: Trimble
Streamlined post-processing using TerraFlex offline GNSS corrections is also available to Esri ArcGIS users, with the new Trimble Terra Office add-in for the Esri ArcMap GIS application. The new add-in replaces both the Trimble Positions Desktop and Trimble TerraFlex Desktop add-ins and supports offline GNSS corrections as well as existing desktop post-processing workflows. Terra Office is available as a yearly subscription.
“With Trimble offline GNSS corrections, we’ve taken the manual steps out of post-processing and made it as effortless as possible,” said Gareth Gibson, marketing director, Trimble Mapping and GIS. “This workflow enables TerraFlex customers to expand the locations and environments in which they work while still achieving high-accuracy results, and all without needing to become a GNSS expert.”
The TerraFlex Premium edition subscription is available through Trimble Geospatial Distribution Partners.
The TerraFlex offline GNSS corrections service uses a network of community base stations, and is broadly available in North America, the United Kingdom, Europe, Australia and New Zealand.
The Trimble Terra Office add-in for Esri ArcMap software is available through Trimble Geospatial Distribution Partners.
“Seen & Heard” is a monthly feature of GPS World magazine, traveling the world to capture interesting and unusual news stories involving the GNSS/PNT industry.
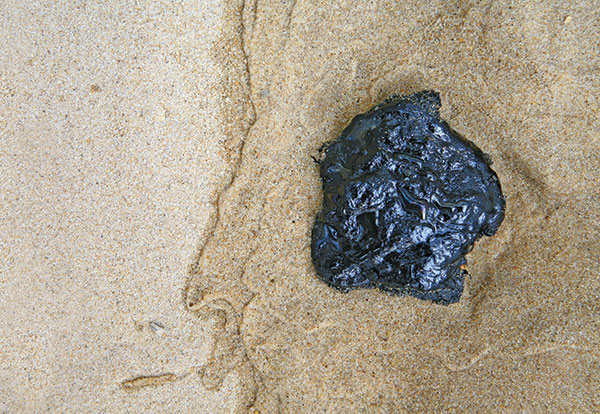
Photo: spxChrome/E+/Getty Images
Citizens Clean Up Coasts
Two citizen groups are taking action with the help of Esri ArcGIS mapping tools. North Coast World Earth uses Esri Ireland’s platform on the Northern Irish coast to record litter hotspots and engage with local communities. The volunteer group has collected nearly 3 tons of litter. In California, the Surfrider Foundation employed ArcGIS Hub to streamline cleanup operations after a major oil spill off Huntington Beach in October 2021. Citizens submitted more than 1,100 reports using the ArcGIS QuickCapture photo app to share the date, time and coordinates of toxic tar balls on beaches from Oxnard to San Diego.
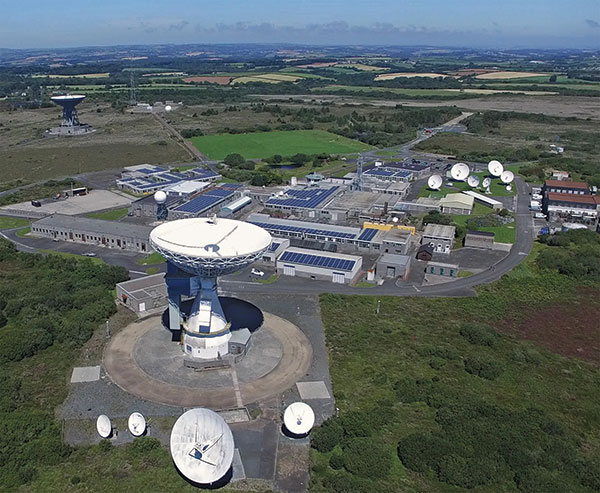
A new series of tests will assess whether the United Kingdom satellite-based augmentation system (UKSBAS) for GNSS can develop into full operational capability to support safety-critical applications post-Brexit. Inmarsat, Goonhilly Earth Station and GMV NSL are conducting the UK Space Agency-funded tests. The signal is now stable and operational, enabling ongoing testing and validation by industry, regulators and users. If successful, UKSBAS will enable assessment of more precise, resilient and high-integrity navigation for maritime and aviation users in UK waters and airspace.
Image: ESA
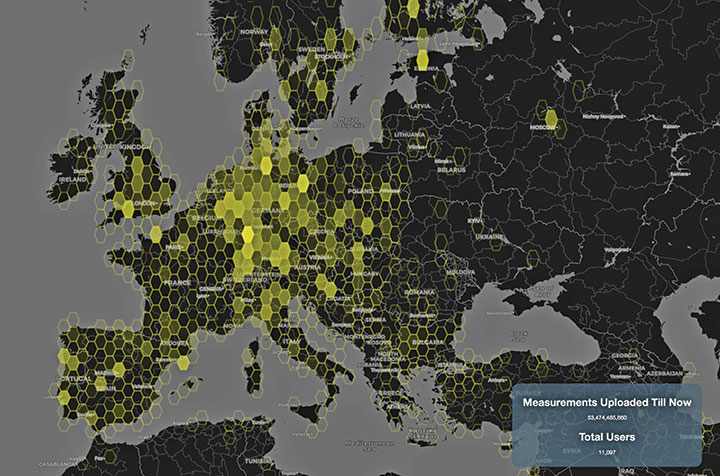
Smart GNSS Monitoring
More than 11,000 people around Europe and the world have turned their smartphones into GNSS monitoring tools by downloading the CAMALIOT app, so far delivering more than 53 billion measurements of meteorology and space weather patterns to researchers, reports the European Space Agency (ESA). ESA asks CAMALIOT volunteers to leave their smartphones by a window each night with GNSS on. The phones record small variations in satellite signals, gathering data for machine-learning analysis. More than 50 smartphone models with dual-frequency receivers can use the app.
Indian Prime Minister Narendra Modi gave his stamp of approval to his country’s indigenous NavIC during a drone festival May 27. Despite that, the Indian Army purchased three GNSS receivers from Baidu, a Chinese company, instead of relying on home-grown companies as the contract required, reports The New Indian Express. The receivers are for survey stations of the College of Military Engineering. A few Indian manufacturers objected to the purchase, the newspaper said, but their concerns were brushed aside by the Department of Military Affairs.
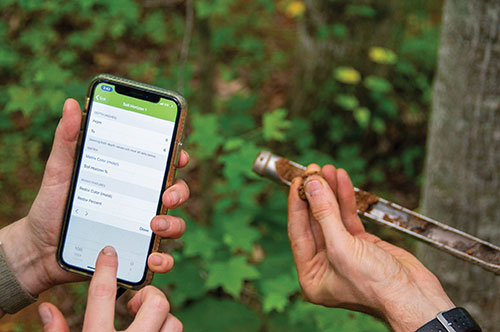
Ecobot, developer of environmental data reporting software, is now integrating enhanced Esri ArcGIS mapping and data capabilities via a partnership begun in 2019 through Esri’s Emerging Partner with the Startup Program.
The partnership enabled the addition of familiar geospatial modeling, mapping, georeferencing and data-collection capabilities within the wetland delineation app.
The new capabilities will further automate and speed the process of wetland delineations, allowing Ecobot customers to support paperless mapping of wetlands — scientists and engineers can walk the perimeter of a wetland, dropping virtual flags with a tap on the screen.
The Ecobot natural resources platform includes comprehensive reference materials, automated calculations, and instant generation of U.S. Army Corps of Engineers (USACE) Wetland Determination forms, along with Esri-ready shapefiles.
The addition of Esri ArcGIS technology is expected to slash project time and costs by an additional 5%-8%.
“Ecobot has been used to prepare more than 6,000 USACE forms for jurisdictional determinations,” said Lee Lance, Ecobot co-founder and CEO.
“Accurate and efficient wetland mapping and data collection by scientists is critical to sound construction practices, especially in an era of climate change, when sea rise and heavy precipitation events are predicted to increase across the country,” said Dawn Wright, chief scientist at Esri.
“We are thrilled to see one of our Emerging Business Partners taking advantage of our larger partner network to deliver Esri technology inside of a critical tool.”
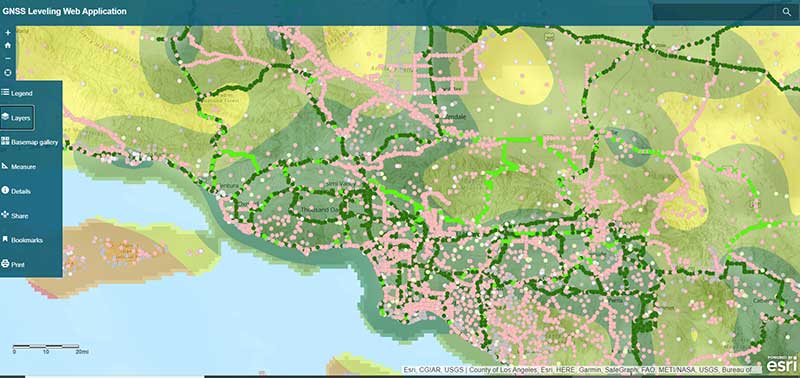
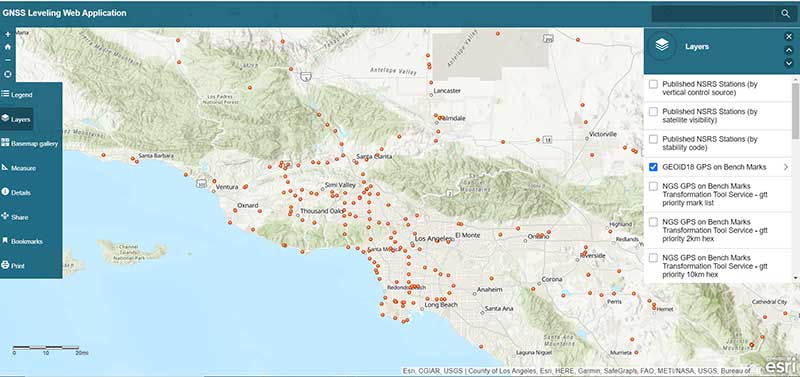
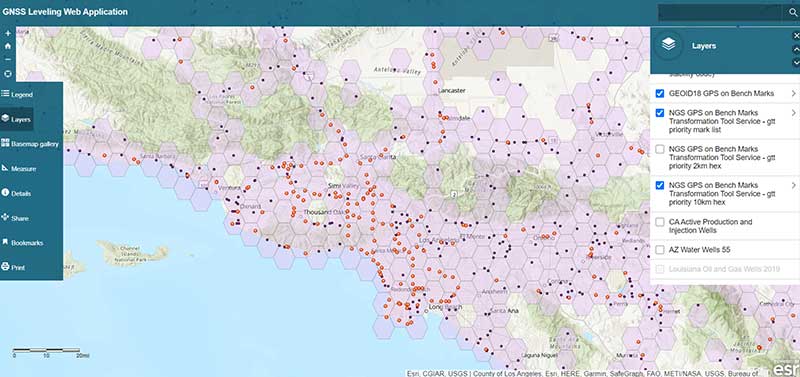
My last column described a new National Geodetic Survey (NGS) webtool for obtaining geodetic information about a passive mark in their database. The column highlighted some features that may be of interest to GNSS users. It provides all of the information about a station in a more user-friendly format. This column highlights an ArcGIS web application that incorporates various California specific datasets and NGS data layers to assist surveyors planning vertical control surveys. The GNSS Leveling Web Application was provided to me by Jay Satalich, chief, Office of Surveys, Caltrans (see box titled “Linkedin Notification from Jay Satalich).
Linkedin Notification from Jay Satalich
Supervising Transportation Survey (Chief, Office of Surveys) at State of California, Department of Transportation:
“GNSS Leveling Web Application” [is] an Esri ArcGIS online web app created for my “GNSS Leveling” students at College of the Canyons. Designed as a practical tool when planning vertical control surveys using GNSS. National datasets include: National Spatial Reference System (layers: satellite visibility, stability, and vertical control source), geology, and GEOID18 (layers: GEOID18 height, difference between GEOID18 and GEOID12B, and GEOID18 uncertainty). California-specific datasets include: oil/gas/fracking/injection wells, fault lines, oil fields, groundwater basins, and landslide areas. The NOAA National Geodetic Survey data layers were created and published by Brian Shaw. People who influenced development of this app include Dave Zilkoski, Kevin M Kelly, Ken Hudnut, David D Jackson, Ross S. Stein, and Arthur Sylvester.
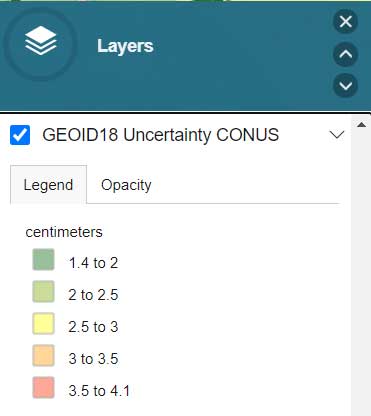
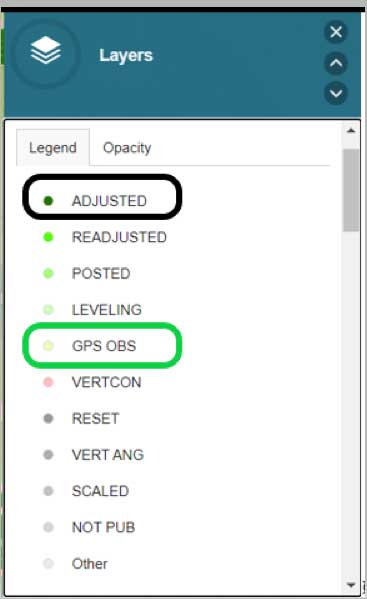
The box titled “GNSS Leveling Web Application” depicts a map of the Los Angeles area that provides the list of published marks in NGS’ database with an overlay of the uncertainty of NGS’ hybrid geoid model GEOID18. Plotting the published marks from NGS’ database is very useful for surveyors reconning marks for a GNSS survey project. The attributes allow users to quickly identify stations that have published heights from leveling adjustments projects (labeled as ADJUSTED) and those that have heights published from GNSS adjustments projects (labeled as GPS OBS). (See here for definition of attributes.)
Source: Esri ArcGIS GNSS Leveling Web ApplicationSource: Esri ArcGIS GNSS Leveling Web Application
Source: Esri ArcGIS GNSS Leveling Web Application
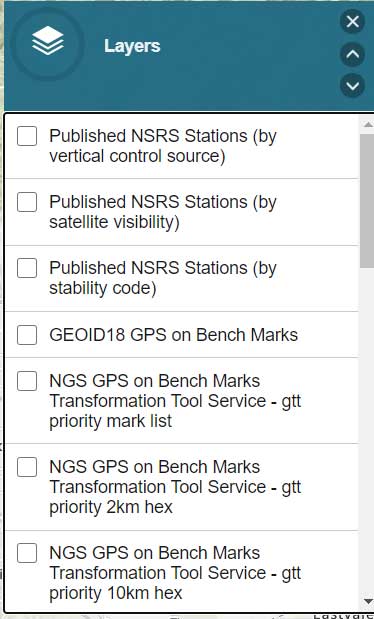
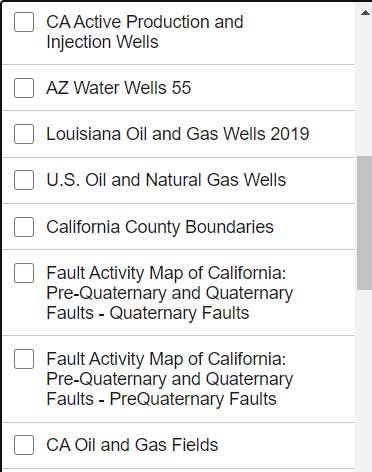
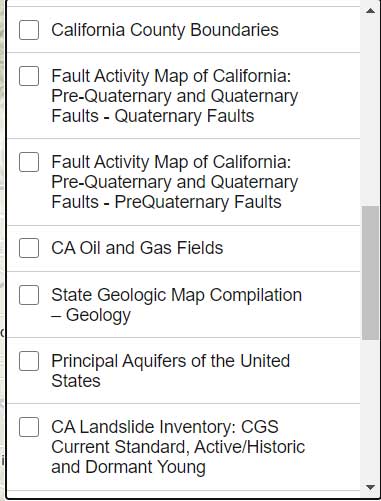
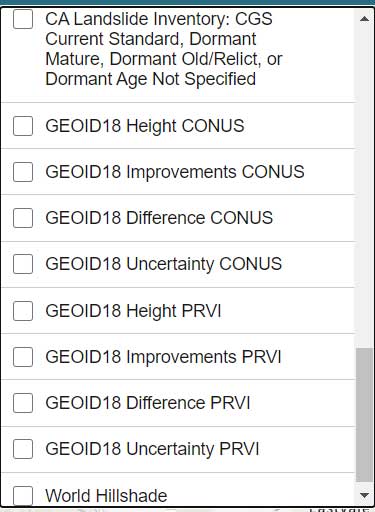
The list all of the layers of the web application are provided in the box titled “GNSS Leveling Web Application Layers.” (Note: After you open up the web application, click on the Layers icon to obtain the list of available layers.)
GNSS Leveling Web Application Layers
Source: Esri ArcGIS GNSS Leveling Web ApplicationSource: Esri ArcGIS GNSS Leveling Web ApplicationSource: Esri ArcGIS GNSS Leveling Web Application
Source: Esri ArcGIS GNSS Leveling Web Application
As you can see from the list of layers, the web application enables users to select the layers that are pertinent to their survey project requirements. The application is designed for California surveyors but the concept is transferable to other States. For example, the following layers are not just for California surveyors: Arizona water wells, Louisiana oil and gas well, U.S. oil and natural gas wells, Principal Aquifers of the United States, and, of course, all of the NOAA NGS data layers.
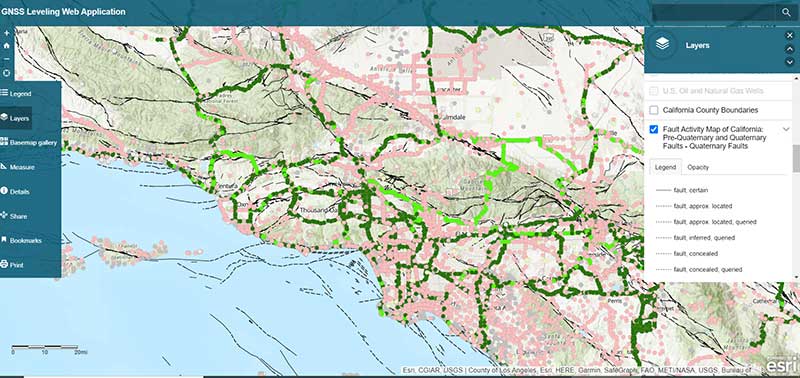
One layer that is very important to California users is the layer that provides the fault activity in their region. The box titled “Fault Activity Map of California: Pre-Quaternary and Quaternary Faults – Quaternary Faults” depicts the list of published marks in NGS’ database with an overlay of the fault activity map.
Fault Activity Map of California: Pre-Quaternary and Quaternary Faults — Quaternary Faults
Source: Esri ArcGIS GNSS Leveling Web Application
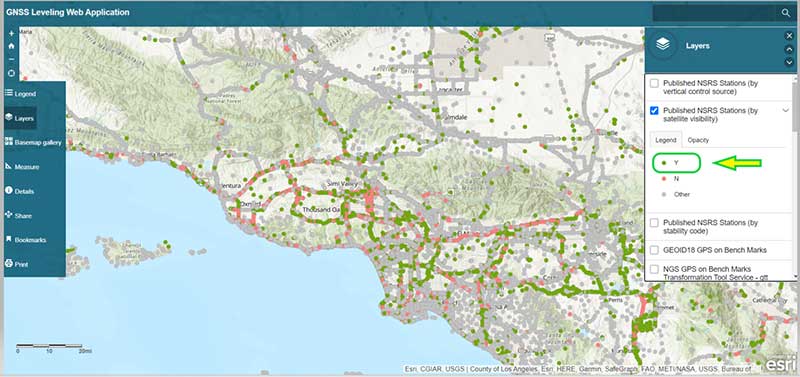
Another great feature of the application is that it has a layer providing the satellite visibility code for published NSRS marks (see the box titled “Published NSRS Stations (by satellite visibility”). Once again, a great feature for field personnel performing reconnaissance.
Published NSRS Stations (by satellite visibility)
Source: Esri ArcGIS GNSS Leveling Web Application
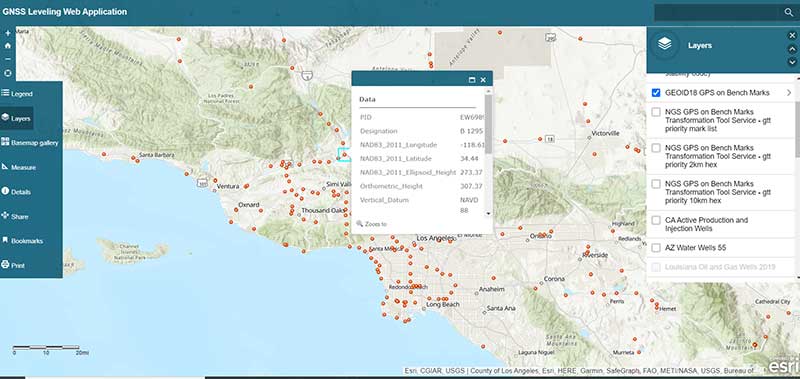
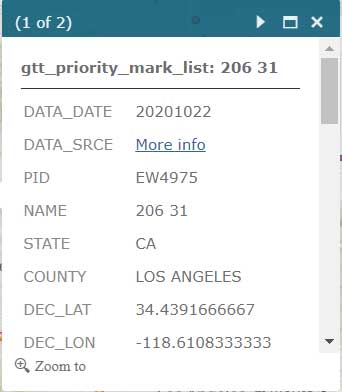
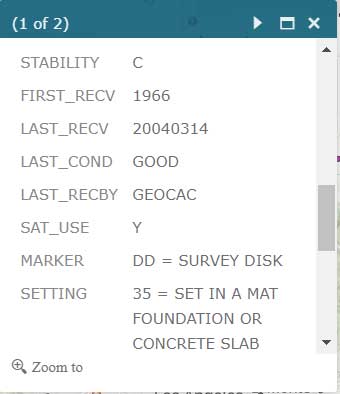
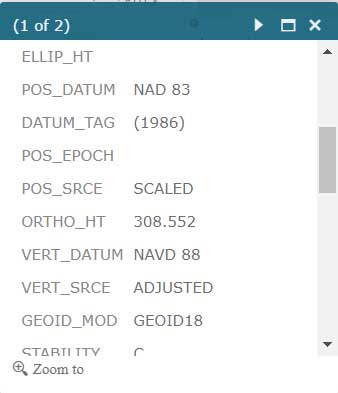
The application also has a feature that lists the marks that were involved in the development of NGS’ hybrid geoid model GEOID18. (see the box titled “GNSS Leveling Web Application GEOID18 GPS on Bench Mark Layer”). Clicking on a mark’s icon provides information and statistics about the mark (see boxes titled “GEOID18 GPS on Bench Mark Layer — PID EW6989” and “Information for GPS on Bench Mark for PID EW6989”). This is one of the layers that provides information for the entire CONUS region. All this information is available from NGS’ website but this application incorporates all of NGS’s data as well as the local information in one application. This web application is very useful to a surveyor planning a survey project and/or providing information to a field reconnaissance team.
GNSS Leveling Web Application GEOID18 GPS on Bench Mark Layer
Source: Esri ArcGIS GNSS Leveling Web Application
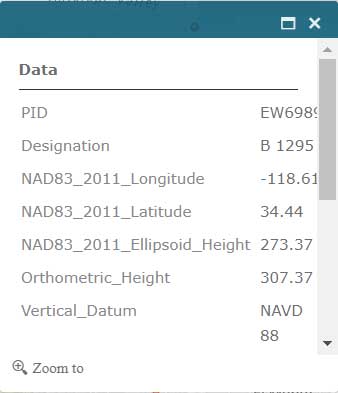
GEOID18 GPS on Bench Mark Layer — PID EW6989
Source: Esri ArcGIS GNSS Leveling Web Application
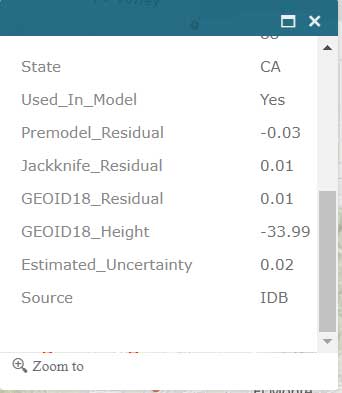
Information for GPS on Bench Mark for PID EW6989
Source: Esri ArcGIS GNSS Leveling Web Application
Source: Esri ArcGIS GNSS Leveling Web Application
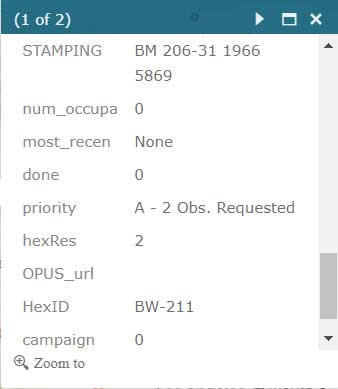
Users that are participating in NGS’ GPS on Bench Mark program can click on the layer for “NGS GPS on Bench Marks Transformation Service Tool, priority 10 km hex” to determine marks that need to be occupied by GNSS to improve a transformation tool being developed by NGS. See boxes titled “NGS GPS on Bench Marks Transformation Service Tool, priority 10 km hex” and “Information for GPS on Bench Mark Priority List for PID EW6989.” There’s also layers that depict the priority mark list for the GPS on Bench Marks program (“NGS GPS on Bench Marks Transformation Tool Service — priority mark list”) and the 2 km hexagon priority grid (“NGS GPS on Bench Marks Transformation Tool Service — priority 2km hex”).
NGS GPS on Bench Marks Transformation Service Tool, priority 10 km hex
Source: Esri ArcGIS GNSS Leveling Web Application
Information for GPS on Bench Mark Priority List for PID EW6989
Source: Esri ArcGIS GNSS Leveling Web ApplicationSource: Esri ArcGIS GNSS Leveling Web ApplicationSource: Esri ArcGIS GNSS Leveling Web Application
Source: Esri ArcGIS GNSS Leveling Web Application
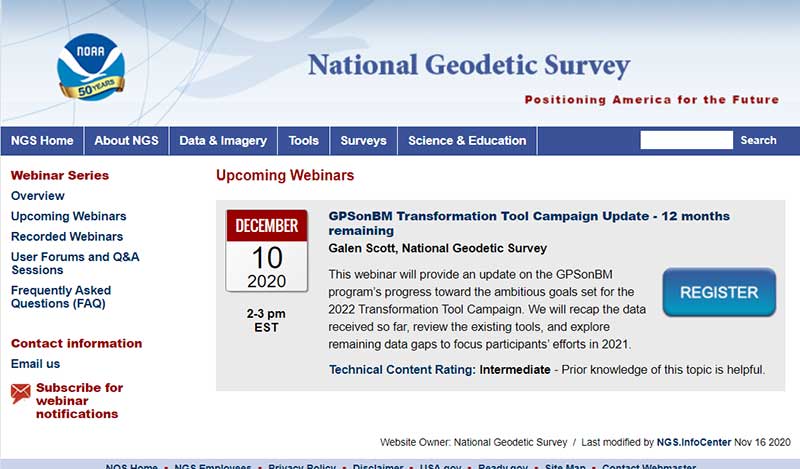
Individuals interested in participating in NGS’ GPS on Bench Mark program should register for NGS’ Dec. 10 webinar, which will discuss the status of the program. See the box titled “GPSonBM Transformation Tool Campaign Update — 12 months remaining” for the information on the webinar. Users can register for the webinar here. I would encourage all users to access the web application tool developed by Jay and/or NGS’ website before participating in the next NGS GPS on Bench Mark webinar.
Almost all of my columns have focused on establishing accurate GNSS heights. Most of my 45 years of working in the field of geodesy has been focused on heights; that is, leveling-derived orthometric heights, GNSS-derived orthometric heights, and geoid heights. Gravity is very important to estimating all of these types of heights. Recently, a colleague sent me a video proving Galileo’s famous gravity experiment. It’s an older video (November 2014), but it’s really fascinating. You can see the entire video here. Another individual pointed me toward the same experiment performed on the Moon during the Apollo 15 mission. What’s amazing to me is that over 400 years ago an individual spent time studying the effects of gravity and developing the concept of acceleration due to gravity. I wonder what the world would look like today if Galileo would have just accepted Aristotle’s theory of gravity (which states that objects fall at speed proportional to their mass) and decided to focus on other tasks. Saying that, I am amazed that most geospatial users do not realize the importance of gravity (and physical geodesy) in the development of the geospatial products and services that they use daily; and, how critical it is that more research is required to meet future geospatial needs. The advancements in satellites and computers have enabled geodesy to expand into many different disciplines. Geodetic science and technology now underpin many sciences, large areas of engineering (such as driverless vehicles and drones), navigation, precision agriculture, smart cities, cellular telephones, and location-based services. (See the GPS World First Fix column about the shortage of American geodesists).
When I end one of my presentations, I always emphasize that Geodesy Provides the Foundation for all Geospatial Products and Services, and Integrated and Collaborative Organizations Create Geospatial Solutions. Geodesy is just as important today as it was 400 years ago.
I hope everyone stays safe during this COVID-19 pandemic and enjoys the holidays.
GPS World is offering the latest news and updates concerning the coronavirus (COVID-19) pandemic as it affects the GNSS/PNT industry. Read a message from GPS World here.
Geospatial Solutions and GPS World are offering the latest news and updates concerning the coronavirus (COVID-19) pandemic as it affects the geospatial, mapping and GNSS/PNT industries. Read a message from GPS World here.
Over the last few weeks, many organizations have transitioned their workforce to remote work environments. At the same time, the demand for geographic information systems (GIS) products and skilled GIS professionals is high.
Esri announces that all of its instructor-led courses are available in its instructor-led online classroom, which is calls “an engaging learning environment that offers convenience and interactivity.”
The company lists these features:
Instructors and course attendees use the phone, chat, and virtual whiteboards to talk and collaborate in real time.
Group breakout sessions and content reviews support peer-to-peer learning and knowledge retention.
Attendees access all Esri software needed to complete course exercises through virtual machines.
“We understand that sustaining business operations and achieving your organization’s mission remains critical,” the Esri Training Team said in an email. “As always, we’re committed to helping you build the skills needed to apply ArcGIS best practices, fuel efficiencies and make the best decisions based on data.”
Esri offers the Esri Training Pass to streamline access to its online instructor-led classes. Users can pre-purchase training days to simplify training registration and approval processes throughout the year.
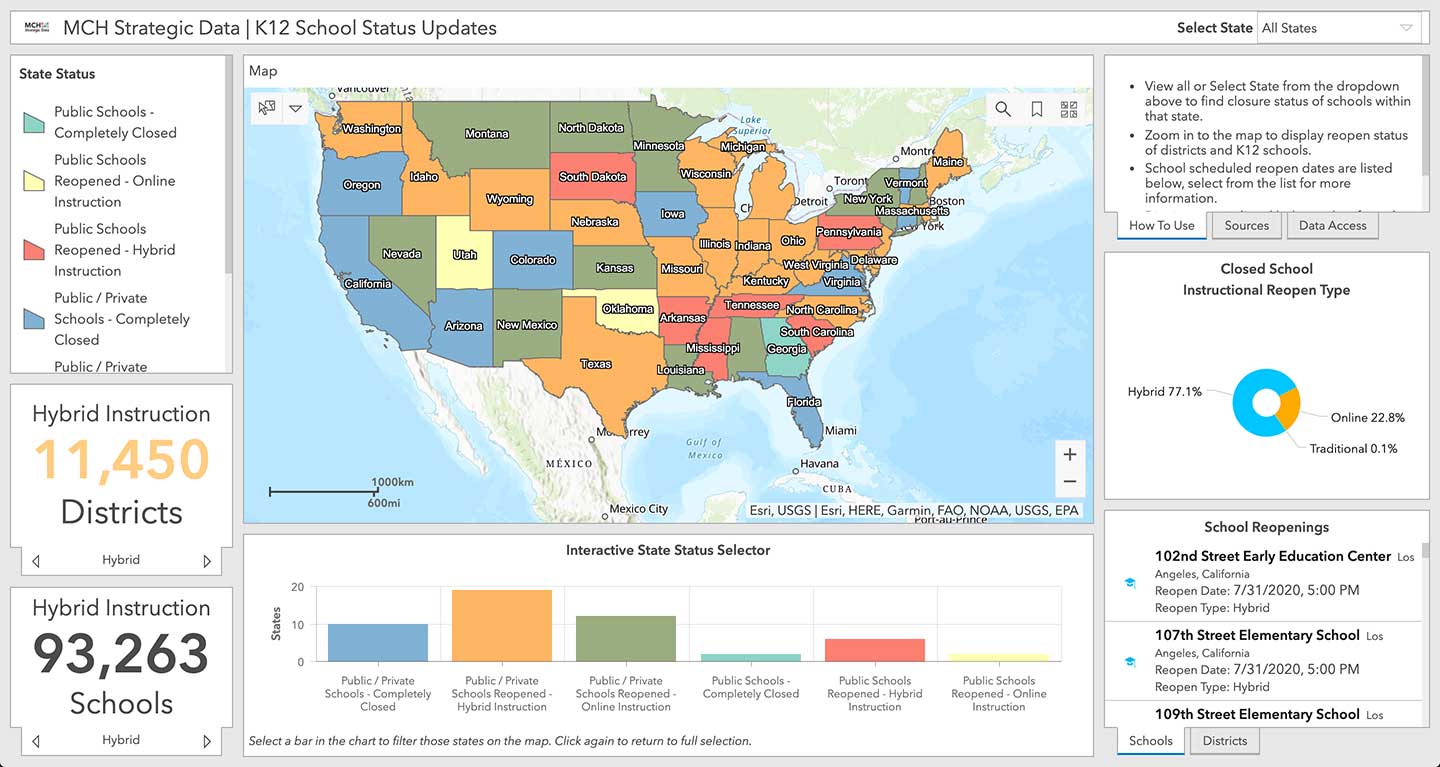
Location intelligence company Esri will be making data layers available on U.S. school closures during the COVID-19 pandemic, through a new partnership with MCH Strategic Data.
To help educational organizations as well as families across the nation better understand the situation in their communities, Esri and MCH have made school closure data accessible from a public dashboard.
Information on K-12 public and private schools include whether they are closed, plans for reopening school buildings, and the type of instruction they are offering during closures due to the epidemic.
MCH Strategic Data compiles and provides institutional information for the education, healthcare, government, and religious sectors.
“These datasets are useful for governments, school officials, and businesses providing leadership, resources, and community programs during the COVID-19 response,” said Ryan Lanclos, Esri director of public safety solutions. “But of utmost importance, this is a source of critical information for the community. It provides transparent and useful information that can help families develop a personal plan when they are feeling their most vulnerable.”
“Our customers depend on us to provide insight to the school market so they can respond effectively and appropriately during this challenging time,” said Kelly Holder, MCH chief information officer. “Our ability to rapidly compile and normalize changing data against our comprehensive U.S. database provides timely insight during an important time in the school planning cycle. This free map and database puts information into the hands of organizations who want to help schools and families now and in the coming months.”
As the COVID-19 outbreak has escalated rapidly across the globe, and with municipalities struggling to respond, MCH and Esri have built out additional resources like the MCH School Status Updates to help organizations quickly visualize and understand the current situation, as well as identify potential community risk areas when schools begin to open back up, and estimate the capacity needed to respond.
The Esri COVID-19 GIS Hub provides much of this essential data, along with case locations and social vulnerability, that communities and health organizations can use to inform their response.
For more information on Esri’s disaster relief support, visit esri.com/disaster.
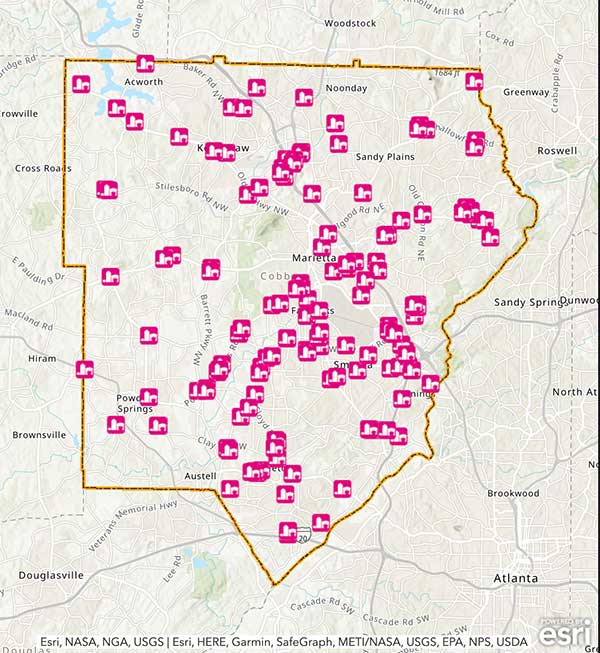
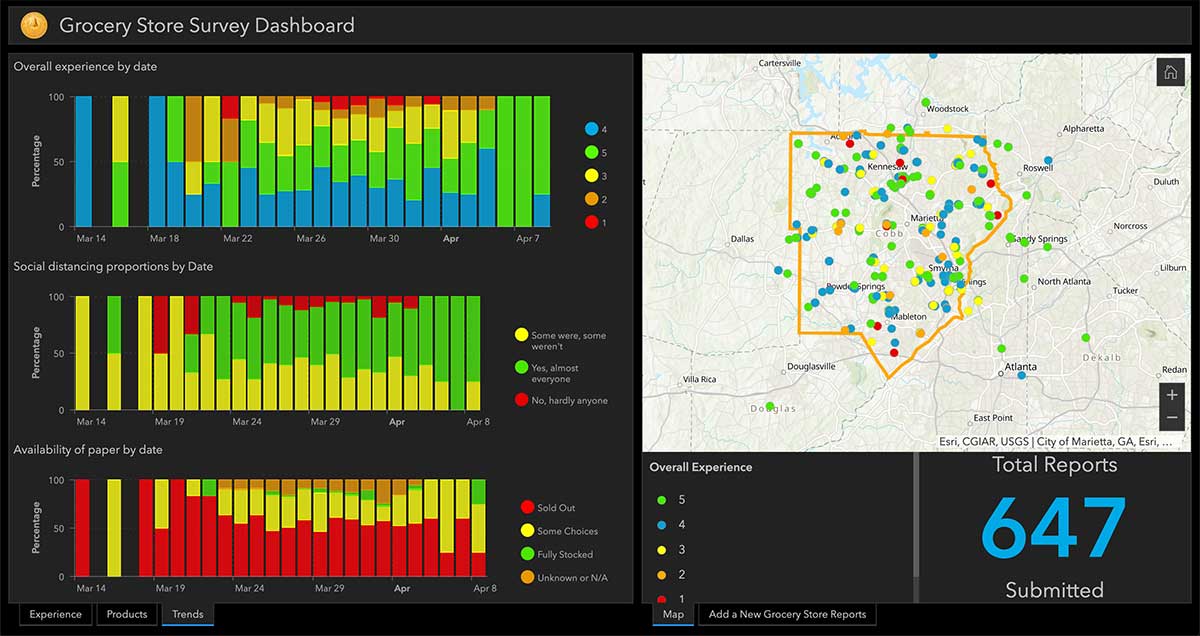
Cobb County, Georgia, is providing its residents with an app that tracks what grocery stores are stocking which essential goods, such as paper products, cleaning items and fresh produce.
The Cobb COVID-19 Grocery Stores and Inventory app gathers input from users, and the data is posted anonymously. Stores can be sorted by distance, senior hours and crowds. Cobb County is a suburb of Atlanta.
The Cobb County Geographic Information System (GIS) department created the app using Esri ArcGIS.
The Center for Systems Science and Engineering at Johns Hopkins University is tracking the coronavirus, COVID-19, via an Esri ArcGIS map.
The map is updated in almost real time, and it includes a zoomable map identifying confirmed cases of the virus throughout the world. It also includes numerical data on how many cases have been confirmed in each country, as well as deaths and recoveries.
“In response to this ongoing public health emergency, we developed an interactive web-based dashboard hosted by the Center for Systems Science and Engineering at Johns Hopkins University, to visualize and track reported cases in real-time,” John Hopkins stated on its website. “The dashboard, first shared publicly on Jan. 22, illustrates the location and number of confirmed COVID-19 cases, deaths and recoveries for all affected countries. It was developed to provide researchers, public health authorities and the general public with a user-friendly tool to track the outbreak as it unfolds.”