Tag: Esri

  • A new generation in real-time situational awareness

    A new generation in real-time situational awareness

    Real-time situational awareness (RSTA) is crucial in numerous fields, particularly in public safety, transportation and emergency management. It enables decision-makers and first responders to quickly assess situations, select appropriate actions and implement plans effectively, ensuring timely assistance and resource allocation.

    RTSA is a process of continuously monitoring and analyzing information to understand what is happening in a given environment. Virtually every owner or operator has a need for this, although the data that may be relevant varies.

    RTSA refers to the ability to understand your environment and act appropriately. This will enable response to events as they unfold, using integrated data from various sources to enhance decision-making and operational efficiency. [1]

    While real-time situational awareness is desired by various entities, it should be noted that it does not come from a single data point, as a single data point is not sufficient. There need to be locational, temporal and informational elements present to draw reasonable conclusions. One promising tool enabling this improved decision-making is the geographic information system.

    Real-Time Geographic Information System

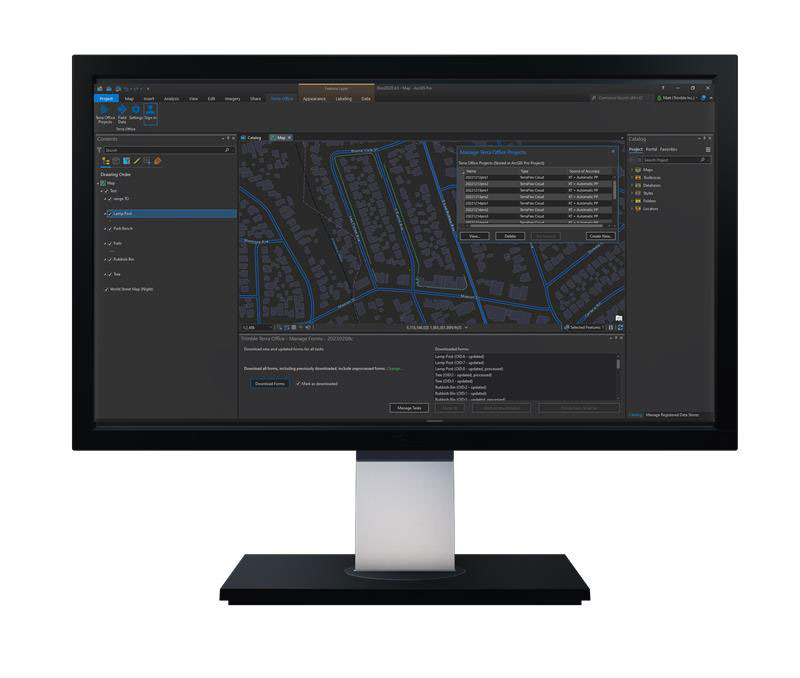
    GIS is a technology that connects data to a map, integrating location and descriptive information. GIS helps users understand patterns, relationships and locational context, and supports decision-making in various industries.

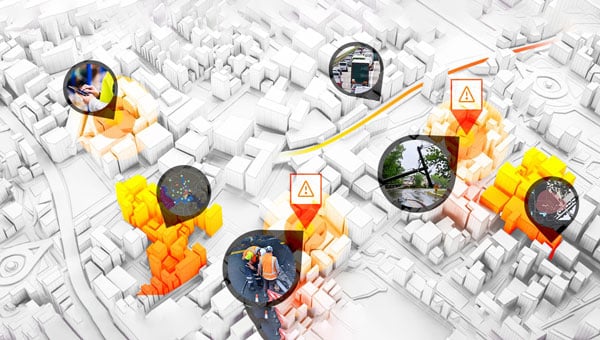
    A real-time GIS can create situational awareness because of its ability to simultaneously ingest, integrate, analyze and display streaming data from most any sensor, device and social media. GIS and location-based analytics can automatically refine and focus real-time data to accomplish the mission with up-to-the-minute intelligence on what’s happening in the field and across agencies and governmental jurisdictions. That’s why police, fire and emergency management organizations at all levels of government use real-time GIS capabilities in their operations and dispatching centers.

    Building Robust New Layers is Key

    As the duration — or reach and impact — of an emergency event increases, so does the number of agencies involved in responding to and mitigating that event. This requires communication systems to scale accordingly, ensuring seamless information exchange and communication among those agencies.

    A significant obstacle to this essential communication is the lack of interoperability, with data interoperability playing a critical role. Data interoperability is the ability of different systems, devices or organizations to share digital information so they can communicate and work together effectively. Without this interoperability, organizations face delays in decision-making, reduced response efficiencies and challenges in coordinating incident management.

    The Cybersecurity and Infrastructure Security Agency published the Information Sharing Framework as an approach to address the data interoperability challenge. It puts forward a three-layer framework that presumes:

    • a data layer, which resides with an individual agency in its nonsharable silo;
    • a presentation layer, which is the end user who needs to see the data in context for real-time situational awareness and decision-making;
    • and sandwiched in between is an integration layer, which does the necessary translation between the data and presentation layers in which the data is discovered, accessed, exchanged, analyzed and transported to the end user. [2]

    For RTSA, the system must be able to access the relevant information in the data layer, to transform and standardize that data such that it can be augmented with other data to create actionable information that can be pushed or pulled into the presentation layer to inform the end user. This information will answer myriad questions about the situation such as when, where, who and what.

    Radio Frequency Real-Time Situational Awareness

    In today’s world of autonomous vehicles and swarms of drones, the electromagnetic spectrum is becoming a critical part of situational awareness. Both in knowing what spectrum is available for use and what spectrum needs to be defended or excluded due to willful interference.

    Even in the context of space, RF spectrum data can help monitor satellite communications and detect anomalies, providing a more comprehensive understanding of the space environment and its potential threats.

    The RF spectrum frequencies range from 3 kilohertz to 3 THz (which spans 3 KHz up to 3 billion KHz). Radio waves, part of the RF spectrum, are regulated by national laws and coordinated by the International Telecommunication Union to prevent interference between different users.

    Radio frequency real-time situational awareness involves the use of radio frequency data and sensors to monitor, analyze and understand this environment. It is crucial for operational planning where the electromagnetic spectrum is a critical domain.

    Its ability to provide real-time awareness of radio frequencies is critical to building an actionable picture of what are very dynamic environments. For example, recognizing the critical nature of an incident as it escalates from a local situation to a regional one.

    Under the Hood

    Effective spectrum monitoring devices rely upon modern developments in software-defined radio (SDR) technology that facilitate rapid reconfiguration and adaptation for various tasks. These include significant enhancements not only to computing capabilities but to the neural processing unit capacity as well. In part, to facilitate RF bandwidth pattern of life technical capability including time frame to gain specific insights.

    Various capabilities are also expected to emerge in the coming years associated with situational awareness that may have a significant impact on the effectiveness, safety and health of especially the first responder community. The internet of things, cameras, data from other applications and networks, and sensors continue to produce increasing amounts of data. Artificial intelligence and data analytics are envisioned to be increasingly important mechanisms to assist in enabling timely and more informed decisions.

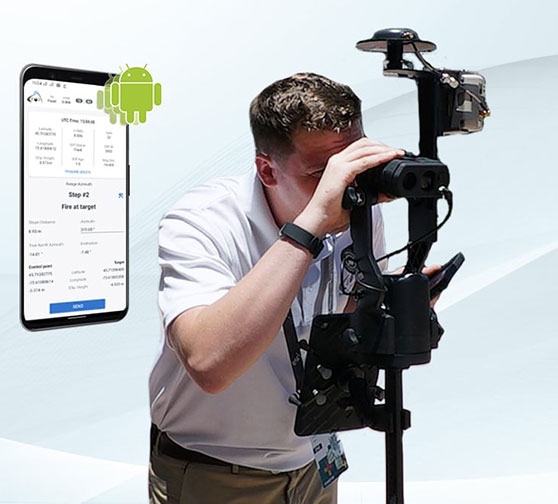
    Multipurpose Remote Sensors

    RF devices used for assured positioning, navigation and timing (A-PNT) most naturally are able to provide RF mapping for situational awareness. The same RF spectrum mapping that gives operators the tools to see real and potential frequency interference and usage. Just as GIS helps provide real-time situational awareness in the physical world, spectrum mapping provides RF real-time situational awareness in the virtual world. Different data, different tools, but the same need and general approach.

    Such multipurpose devices could further contribute to helping build RF situational awareness to include information about emitter identification and locations core to RF mapping. Or RF-based sensors could be able to use signals such as those used by tactical radios, once their location is established.

    This fulfills the vision that these RF devices, for example, could be positioned to support RF multiple aspects of situational awareness when not performing their primary mission.

    This requires RF real-time situational awareness to be integrated into operational frameworks to allow for better decision-making, improved safety and enhanced capabilities in both military and civilian applications. By leveraging RF data in multiple ways, organizations can fill gaps in traditional monitoring techniques, leading to a more robust understanding of the operational landscape. RF real-time situational awareness is a critical capability that enhances operational effectiveness using advanced sensing technologies and data analysis, particularly in complex environments.

    Poised for a New Generation

    A key element for the aforementioned presentation layer is to provide the same data to many, although specific locations, referred to as narrowcasting (think narrow multicasting). A new company, EdgeBeam Wireless, is building a next generation broadcast system to provide these services largely referred to as datacasting. Powered by the broadcast industry’s latest ATSC 3.0 standard, this new service will make its datacasting compatible with standard IP networks, fiber networks and mobile 3GPP networks. It could be used for very efficient geolocation delivery of all real-time situational awareness data to many specific locations. [3]

    A good example of an RF-based terrestrial platform is MerlinTPS. This terrestrial positioning system provides 100% terrestrial, RF-based assured positioning, navigation and timing. As part of its operation, the system naturally makes a spectrum map within the radius of each of its reference units. For example, coverage of the entire U.S. would take about 200 reference units, plus about 100 backup units. This RF spectral map is updated with one-second iterations, keeping the data up to date for any unfolding spectral and terrestrial events.

    The MerlinTPS platform is based on modern-day SDR technology, ideal for flexibility of RF spectrum presence, as well as the growing use of AI. This feature then naturally could be used to create and maintain a total spectrum map and pattern of life.

    The platform supports high-precision time transfer of plus or minus 10 ns, critical to A-PNT today, along with positioning and navigation services. The platform can also provide geolocation data for modern real-time GIS features needed for this new generation of real-time situational awareness.

    The combination of MerlinTPS with use of the ATSC 3.0 pending EdgeBeam Wireless service could provide the highly full-featured capabilities to fuel the newest generation of real-time situational awareness networks.


    References

    1. “The Importance of Real-Time Situational Awareness in Public Safety and Transportation,” John Contestabile, Director, Public Safety Solutions,The Importance of Real-Time Situational Awareness in Public Safety and Transportation | Skyline Technology Solutions
    2. “Approach for Developing an Interoperable Information Sharing Framework,” Version 1.7 Publication: August 2021, Cybersecurity and Infrastructure Security Agency  Approach for Developing an Interoperable Information Sharing Framework, version 1.7, August 20212
    3. EdgeBeam Wireless, ( https://www.linkedin.com/company/edgebeam/about/ )
  • New Esri book explores GIS and AI

    New Esri book explores GIS and AI

    A new Esri book, GeoAI: Artificial Intelligence in GIS, provides real-life stories about public- and private-sector organizations as well as NGOs and nonprofits successfully using GeoAI (artificial intelligence) to manage processes, workflows, policies and communication. The book includes a technology showcase that provides ideas, strategies, tools and actions to help jump-start the use of GeoAI. 

    Organizations around the globe rely on geographic information system (GIS) technology to manage and analyze data through the powerful lens of location to tackle some of the toughest business and societal challenges. The emergence of AI-enhanced GIS has opened new opportunities to automate complex spatial analyses and harness the full power of spatial analysis.

    This democratization of GIS can help everyone make better decisions faster, from city planners and policymakers to businesses, research groups, and constituents. In addition, organizations that already use GIS extensively will benefit from the ability to tackle complex problems by combining human GIS expertise with AI capabilities. 

    GeoAI: Artificial Intelligence in GIS, by Matt Artz, Ismael Chivite and Nicholas Giner, publishes Sept. 2, by Esri Press. While the book officially publishes on Sept. 2, Esri is printing it early so that it will be available at the Esri User Conference in San Diego July 14-18.  

    GeoAI: Artificial Intelligence in GIS
    Authors: Matt Artz, Ismael Chivite, and Nicholas Giner
    Publication Date: September 2, 2025

    $39.00, 120 pages
    5.5 x 8”
    Full-color illustrations, maps and photos throughout
    Print ISBN: 9781589488441
    eISBN: 9781589488458

  • TomTom and Esri deliver advanced location analytics

    TomTom and Esri deliver advanced location analytics

    TomTom and Esri have partnered to integrate TomTom’s global map and traffic data into ArcGIS, Esri’s comprehensive geospatial platform.

    This collaboration aims to provide businesses and governments with location-based insights for various applications, including infrastructure maintenance, traffic flow analysis and retail site optimization. Esri is a prominent provider of geographic information system (GIS) technology, offering mapping and spatial analysis applications that facilitate efficient data collection, management and analysis. Organizations across various sectors — including governments, educational institutions, non-profits and businesses —can utilize the software.

    In February 2023, Esri joined the Overture Maps Foundation, a collaborative effort initiated by Amazon Web Services, Meta, Microsoft and TomTom. This foundation aims to establish a location data standard and promote a data-sharing ecosystem to enhance maps, location technology applications and location-based insights.

  • Coral reefs at a crossroads: “Every coral we see is fighting”

    Coral reefs at a crossroads: “Every coral we see is fighting”

    This is a challenging time for coral reefs. Although they cover less than 0.1% of the ocean floor, coral reefs support 25% of all marine creatures. Collectively, they form one of the planet’s most important ecosystems. Their health is in jeopardy due to increased ocean acidification, rising temperatures, pollution runoff, and overfishing and other destructive fishing practices.

    The news is not uniformly bleak. A global study of coral reefs that seemed wildly ambitious when it launched in 2014 suggests that some coral reefs are showing impressive resilience. Some could even be considered thriving.

    From the beginning, managing the study, dubbed the 100 Island Challenge, has depended on a creative and geographic approach.

    Geographic information system (GIS) technology helped the 100 Island Challenge scientists define the initial scope of the study. Now it is allowing them to visualize and analyze the data they collect. GIS has also enabled the construction of environmental digital twins. In this case, the highly realistic and navigable 3D models depict many of the world’s major coral reefs, capturing flora and fauna in precise detail.

    Reassessing Reefs

    “I’m focused on coral reefs because it’s a great place to watch animals,” said Stuart Sandin, an ecology professor at Scripps Institution of Oceanography at UC San Diego. “Organisms are packed together, interacting with one another.”

    Since the early 2010s, marine ecologists like Sandin have noted how reef health is indicative of a greater overall breakdown in ocean health.

    “The timely issue was that we were seeing a ton of degradation,” he said. “It was no longer just a discussion about these ecological principles.” Coral health became a matter of global urgency that highlighted a possible tipping point, with coral decline contributing to biodiversity loss.

    Sandin was drawn to the question of local and direct human influences, like overfishing and pollution. He realized that this was, at its roots, a spatial question and it was urgent. If humans were causing harm, changes could be made to reduce the impact. Analyzing the connection involved assessing the influence of humans on nearby reefs.

    One of the earliest inquiries Sandin and his Scripps colleagues made involved the Line Islands, 11 atolls in the central Pacific Ocean, a thousand miles south of Hawaii. The mix of inhabited and uninhabited atolls belong to the Republic of Kiribati (pronounced “KIR-ee-bas”) and US territories.

    Studies of the coral reefs near the uninhabited islands yielded positive results.

    “The baseline ecosystems were everything we dreamt of,” Sandin said. “Tons of big sharks, big corals, clean water. We thought it was cool that those conditions still exist.”

    When Sandin’s team turned to some of the Kiribati islands with small but growing human populations, the difference was stark. Human activity—particularly the modest amount of fishing done by residents of this small country—had degraded and even destroyed some of the reefs.

    The results appeared to speak for themselves. Islands with no human presence had healthy reefs—those with people did not.

    As Sandin looked at other islands around the world—including other more distant Kiribati islands—he discovered the strict dichotomy did not hold true. Some inhabited islands that had experienced many generations of fishing still had thriving coral ecosystems. The health of an island’s reef systems was not necessarily determined by human presence.

    “I realized the human dimension was more than just binary,” Sandin said. “It wasn’t just presence versus absence. I knew we should start studying the variation of human use, where it works well and where it doesn’t.”

    The selection of regions and islands within regions is strategic, with an aim to capture the variability of environmental conditions. (Photo: courtesy of the 100 Island Challenge team at Scripps Institution of Oceanography)
    The selection of regions and islands within regions is strategic, with an aim to capture the variability of environmental conditions. (Photo: courtesy of the 100 Island Challenge team at Scripps Institution of Oceanography)

    The Challenge Begins

    A major challenge of studying ecosystems, even those as spatially concentrated as a coral reef, is the dizzying array of factors that affect their function. Sandin’s team defined 18 types of islands, based on such factors as the size of the human presence and the island’s geography.

    The team members decided they should find five island examples of each of the 18 classifications, meaning the project was committed to studying 90 islands. Then they decided that adding 10 islands, bringing the total to 100, would give the study a more impressive pedigree. “We rounded up to make the T-shirts look better,” Sandin joked.

    From the beginning, the 100 Island Challenge presented logistic hurdles. Sandin’s team had to research islands for possible inclusion, classify them, and maintain a globally dispersed atlas of candidates. The islands chosen are mostly concentrated throughout the Pacific, the Indian Ocean, and the Caribbean Sea. The team has attempted, whenever possible, to work with residents on each island to both ensure respect for its culture and maximize local knowledge.

    “Every island has a story,” Sandin said. “And that’s why we had to go bigger.”

    Mapping the Challenge

    GIS maps played a key part of building the massive atlas, giving the team members an ongoing reference as they gathered data. The team aimed to visit each island in the study at least twice to monitor changes over time.

    GIS also provided a way to determine specific observation sites for every island. From each of these vantage points, researchers can visualize key spatial relationships, including the location of reefs and human settlements, the size and extent of fishing industries, and freshwater sources that flow into the ocean.

    The maps promote transparency. Shared with people who live on the inhabited islands, GIS maps help everyone understand the study’s objective of measuring ecological health.

    The maps also support the data-gathering process, which includes both low- and high-tech components. Divers swim the reefs, making observations that fall in various categories, such as coral conditions and the amount of wildlife. These categories become individual data layers on the map.

    Divers carry still cameras that record one geotagged image every second. This amounts to millions of images added to the map, documenting the conditions of reefs for further study.

    A dual-camera rig captures high-resolution images that can be stitched into a 3D composite for ongoing analysis of each reef. (Photo: courtesy of the 100 Island Challenge team at Scripps Institution of Oceanography)
    A dual-camera rig captures high-resolution images that can be stitched into a 3D composite for ongoing analysis of each reef. (Photo: courtesy of the 100 Island Challenge team at Scripps Institution of Oceanography)

    Coral Fights Back

    “One of the first things we observed, with the help of image-based mapping products, is that the idea that every coral on the planet is suffering is a complete fallacy,” Sandin said. “What’s actually happening is that every coral on the planet is growing. But in patches, we’re seeing a lot of them die.”

    The situation may not be universally dire, Sandin added, but it is urgent.

    “Every coral we see is fighting,” he said. “They’re getting hit, site by site, by different stressors, like pollution and overfishing, and some of the hot-water events they can’t recover from. But there is resilience.”

    The data-gathering cameras serve a dual purpose. They document reefs that have not been able to recover from the stressors, particularly those linked to climate change. At the same time, the cameras serve to document the resilience. Both objectives help researchers understand how coral can thrive under modern conditions.

    Underwater Digital Twins

    The amount of data collected by the 100 Island Challenge is staggering. And it’s all feeding into the digital twin.

    “Right now, we’re actively involved in finding a way to deal with this petabyte of data, making it transparent and accessible,” Sandin said. “That’s where a lot of these spatial analytic tools and all the creative approaches to visualize data really come into play.”

    Thanks to advances in data processing and GIS-enabled imaging, millions of images can be processed quickly. Aided by game engines, computers can stitch together realistic 3D digital twins of the reefs.

    Scientists and GIS novices alike can, in effect, explore the reefs in stunning detail. The resolution, which approaches millimeter level, is high enough to see baby coral. The digital twins have also helped scientists understand the dispersal of adolescent and adult coral. GIS tools can even measure the buffering zones around different coral types in various stages of development to see how they interact with each other.

    Granting a Voice

    For those whose lives are deeply entwined with the reefs, the study’s GIS maps show the coral’s struggle to save itself.

    “One of the stories that really struck me was when we were meeting with one of the governors of the southern states in Palau,” Sandin said. “We showed him printed maps and he said, ‘I’m a fisherman, and the fish talk to me. They can tell me what’s wrong. If there are too few fish, I go somewhere else. But the reef has never had a voice.’”

    As Sandin recalled, the governor pointed to the map. “This,” he said, “gives the reef a voice.”

    Learn how GIS technology is being used to explore, map, visualize, analyze and protect the oceans.

    This article originally appeared on Esri Blog.

  • Trimble extends Esri partnership

    Trimble extends Esri partnership

    Photo: Thicha Satapitanon / iStock / Getty Images Plus / Getty Images
    Photo: Thicha Satapitanon / iStock / Getty Images Plus / Getty Images

    Trimble and Esri have extended their partnership to enhance collaboration in geographic information system (GIS) software, location intelligence and mapping. This ongoing effort aims to improve processes, support decision-making, and automate workflows for greener infrastructure planning, construction and operations for users.

    The companies are exploring emerging technologies, particularly in industry data models that support accurate generative AI technologies and workflows. Trimble’s geospatial field systems, which collect location intelligence and 3D datasets, are enhancing workflow support in Esri ArcGIS Indoors and the ArcGIS Utility Network.

    Trimble Unity — a new asset lifecycle management suite — leverages Esri’s GIS into construction project and capital planning, enterprise asset management and permitting solutions to improve how universities, healthcare facility operators, utilities and federal, state and local government jurisdictions track the asset management lifecycle.

    Trimble and Esri also partnered with The HALO Trust, the world’s largest landmine-clearing non-profit organization, which combined Trimble’s high-accuracy mapping technology with Esri’s ArcGIS software to improve the capacity to locate and remove landmines and other explosive hazards, making communities safer.

  • Seeds of change: Ernst Seeds uses data-driven approach to restore habitats

    Seeds of change: Ernst Seeds uses data-driven approach to restore habitats

    Ernst's own seed production relies on pollinators. Beehives are mapped and placed strategically across the fields to provide full coverage of seed crops. (Photo: Courtesy of Ernst Seeds)
    Ernst’s seed production relies on pollinators. Beehives are mapped and placed strategically across the fields to provide full coverage of seed crops. (Image courtesy of Ernst Seeds)

    Every Monday and Wednesday, the team at Ernst Conservation Seeds gathers around maps to discuss which fields to harvest, which fields need treatments, and where to plant new crops.

    On this 10,000-acre farm near the small town of Meadville, Pennsylvania, the company pioneered the propagation of 180 species of native wildflowers, grasses, and wetland plants to revive degraded land and provide wildlife habitat.

    Now, the plants Ernst Seeds propagates are in high demand. Pollinator planting has become a trend worldwide, with the growing realization that flying bugs and birds are key to the survival of three-quarters of the world’s plants, including many we eat. Native plants are also being valued for nature-based solutions to protect soils from erosion and filter pollutants from stormwater.

    Across its operation, Ernst Seeds embraces the science of agronomy and the use of geographic information system (GIS) technology to understand native plant species and grow them better, faster, and less expensively.

    There’s a lot of experimentation that goes into growing native seeds and designing the right mix for each restoration project. “What we’re doing is going out and looking at existing plant communities to see what species grow together and how they’re doing it,” said Andy Ernst, vice president of Ernst Seeds. “Then there are lessons from our farming failures and successes. We make a lot of discoveries in our fields when we map yield data and the treatments we applied.”

    Improving plant propagation

    Typically, large farms focus on commodity crops like corn, soybeans, wheat, or cotton. At Ernst Seeds, the growing cycles of 180 species are tracked across 1,300 fields and 15 square miles.

    “I realized a long time ago that with the complexity of our farm, we needed software to track it,” Ernst said. His early forays into traditional farm management software products were frustrating as most could not support so many crops. The software lacked the data management and analysis capabilities needed to discern best practices for seed crops no one else was growing.

    Then in 2015, Ernst Seeds started using GIS. For operations, the ability to see fertilizer and spray assignments on smart maps helped the company identify places that required more or less treatment.

    “There are a lot of accidental experiments when a row is skipped, there’s overlap, or a different chemistry is used,” Ernst said. “When we go out in the field, we can see areas that thrive and other areas that do poorly. With GIS, we can answer why.”

    Katy Flaherty, an agronomy expert and the GIS manager at Ernst Seeds, developed a GIS-powered work order management system that guides each phase of production, from planting and fertilizing to applying pesticides and harvesting. The system uses a combination of ArcGIS Survey123ArcGIS Field Maps, and ArcGIS Dashboards to record data and visualize trends. Flaherty also uses ArcGIS Pro to analyze data from the field, layering it with historical crop records and real-time soil and weather data to uncover correlations.

    “When we plan our fields across four counties, there are significant differences in what crops do well from north to south,” Flaherty said. “It’s very spatial aware farming, and that knowledge transfers to recommendations for customers.”

    In one instance, this detailed level of monitoring led to a decision to stop using a product that harmed some plants. In another case, improvements in propagation for a species proved so fruitful that smaller plots would meet the demand.

    Smart maps guide the company’s planting locations, irrigation system maintenance, and harvesting schedule. Staff use smart maps to track plant maturity and time seed harvests. Unlike corn and soybeans, which can sit in fields for months, some native seeds have only three days of viable harvest. Knowing when and where to harvest is crucial. Ernst Seeds sells 70% of the seeds it harvests every year, putting the rest in the ground for the next crop cycle.

    In ArcGIS Pro, administrators and agronomists view short term plans and historical information. The map views allows them to analyze passes over fields, coverage of treatments, quantities of materials, water drainage, and other variables to inform treatment decisions. (Photo: Courtesy of Ernst Seeds)
    In ArcGIS Pro, administrators and agronomists view short-term plans and historical information. The map views allows them to analyze passes over fields, coverage of treatments, quantities of materials, water drainage, and other variables to inform treatment decisions. (Image courtesy of Ernst Seeds)

    Filling gaps and expanding geographic reach

    Calvin Ernst, Andy’s father, started the thriving conservation seeds business in 1964 with a Pennsylvania Department of Transportation contract to supply seeds to revegetate highway rights-of-way. Over the next 50 years, the company made wild seed collecting forays across the US to add plants to its offerings. As species count and seed supply grew, so did work with a broader list of customers, including state and federal agencies.

    The company has developed seed mixes tailored to specific regions, such as Maryland, northern Virginia, and coastal North Carolina. These seeds are adapted to thrive in the local weather and soil. By choosing native seeds, restoration project managers ensure plants are well-suited to the ecosystem and more resilient to changing climate conditions.

    “A simple philosophy is to avoid plants in your seed mixes that would be planted at the southern edge of their historical range,” Ernst said, speaking to the growing need for heat-adapted plants.

    This commitment to innovation comes at a cost—it takes time to establish every new species. But insights from GIS can accelerate that timeline.

    “It can take seven to 10 years to figure out how to grow something,” Ernst said. “If our observations cut that time down to five years, that’s a major win for us.”

    Building native seeds capacity

    One of the main challenges with native seed farming, according to Ernst agronomists, is the lack of knowledge of native seed production when compared to conventional row crops.

    While the company has typically filled knowledge gaps itself, there have been times when an academic partnership has proved beneficial. For example, Ernst Seeds collaborated with researchers at the Center for Pollinator Research at Pennsylvania State University to identify the mix of flowering plants that could maximize pollinator food and breeding opportunities. The seed mixes developed through this partnership are now used across solar energy farms for revegetation.

    The work on developing the right seed mix for solar farms made Ernst Seeds an ideal partner for the Virginia Solar Pollinator Program. Originally, Ernst Seeds was employed on the project by the Virginia Department of Conservation and Recreation to guide a mix of native seeds for Virginia, but that work expanded.

    Ernst Seeds experts then worked alongside the Clifton Institute to gather seeds across Virginia, from the Coastal Plain to beyond the Blue Ridge Mountains. They recorded the location and conditions of their findings using a GIS-powered mobile app on their phones. This knowledge will help in planting along corridor projects, such as land beneath the electric transmission lines that will deliver energy from solar farms in rural areas to businesses and households in urban centers.

    From its start with solar projects, the program evolved into the Virginia Native Seed Pilot Project to launch a native seed industry in Virginia. The program identifies local growers who can produce native seeds at a commercial scale and shows them how data from GIS helps guide best practices.

    Tractor operators record their observations and have access to historical data as they work the fields. (Image courtesy of Ernst Seeds)
    Tractor operators record their observations and have access to historical data as they work the fields. (Image courtesy of Ernst Seeds)

    “Creating a GIS-centric culture at Ernst has changed how managers and operators work the fields,” Flaherty said. “We aren’t only looking at maps and numbers, we’re utilizing and making the data work for us every day.”

    A data-driven approach to farming can be tough to instill in farmers working the same fields with the same approach for decades.

    “Early on, we had pushback about the need to collect different information,” Ernst said. “Then in one meeting, we had a big lights-come-on moment when the answers we needed came from the data they’d been collecting. The guys were saying, ‘I know what we did there,’ but when we looked at the records their memory wasn’t as good as they thought it was.”

    Learn more about how GIS is used to intelligently manage agriculture.

    This article originally appeared on Esri Blog.

  • Mapping the future of spatial computing

    Mapping the future of spatial computing

    In February 2024, Vision Pro, Apple’s long-awaited extended reality (XR) headset, hit stores. It is Apple’s stab at the consumer XR market, but XR is not how Apple describes it. Instead, when it was announced last summer, Apple CEO Tim Cook said the headset marks the dawning of the era of spatial computing. “You’ve never seen anything like this before,” he added.

    Greg Milner
    Greg Milner

    That is not quite true.

    The term spatial computing dates to the 1980s. Its modern definition entered the lexicon in 2003. Simon Greenwold, a graduate student in the Program in Media Arts and Sciences at the Massachusetts Institute of Technology (MIT), described spatial computing wherein a human interacts with a machine, and that machine retains and manipulates referents to objects and spaces in the real world.

    But spatial computing extends back even further. It has been the cornerstone of geographic information system (GIS) technology since the software programs debuted in the late 1960s. Indeed, the theoretical foundation of GIS is that it is not only possible but inherently useful to retain and manipulate real objects within some form of virtual space.

    In the first GIS programs, virtual space was synonymous with cartographic space. Spatial computing means using maps to organize large amounts of data in a visually intuitive manner.

    The Roots of Spatial Computing

    Early geospatial technology pioneers applied the concepts of such theorists as Ian McHarg, who described the world as a series of layers of information that exist and interact in the same physical spaces. If we analyze any spot on Earth, we encounter such informational layers as elevation, soil type, hydrology, biology and land use.

    GIS brought this idea to life. The technology allows us to visualize and analyze layers of data on a map. In this way, GIS has become a key integrator of information about our world, from science to engineering to commercial operations.

    Through innovation, GIS has grown beyond the bounds of mere 2D map layers to generate maps that are, in effect, 1:1-scale 3D models we call geospatial digital twins.

    The major benefit of geospatial digital twins is the ability to provide maximum context. This is especially useful for smart planning of our urban environments. For example, architects can use a digital twin to test how their proposals will fare in such situations as flooding and extreme heat brought about by climate change. City planners can understand the effects of large-scale shifts in the urban environment with interventions focused on enhancing livability. The combination of visualization and hard data allows them to predict impacts and modify plans before making expensive changes to the physical world.

    Spatial Computing and Digital Twins

    Each advance in GIS technology has improved our ability to visualize, link and manipulate real objects and spaces in a digital realm.

    GIS has evolved to offer truly immersive experiences. In particular, the combination of GIS and game engines such as Unreal and Unity has transformed the process of large-scale infrastructure projects.

    In Brisbane, Australia, for example, a digital twin of the ongoing subway construction has been used to display progress. People can walk virtually through planned subway tunnels and stations. This contextual experience helps project leads show Brisbanites how the work is shaping up.

    The experience also allows planners, architects, engineers and construction workers to make decisions with more information than could be provided by a paper map or even a traditional digital twin. They can stand on a platform and see how the design elements of a station will look to people moving through it.

    Spatial Computing to Visualize What Could Be

    Digital twins can be crystal balls. The virtual spaces can be reconfigured to model different versions of an environment. In practical terms, digital twins allow various stakeholders to have the same vision. This is especially useful in the age of climate change.

    Planners and architects can test different versions of a project. If they are designing a subdivision in a coastal community, they can calculate the flooding and storm surge that will likely occur from storms of different magnitudes. Just as important, they can visualize this data, inhabit it, and study it with maximum context.

    At root, what they are doing is investigating spatial relations against a realistic backdrop of the world. For the subdivision, these objects include homes, streets, streetlights, and parks, and what matters is their existence in relation to water under multiple scenarios. This is spatial computing: manipulating referents to real objects in a virtual world that, unlike the real one, can be changed at will.

    Spatial Computing to Visualize Hidden Real Spaces

    Immersive environments also offer the promise of displaying a world that is real and already exists yet remains largely invisible.

    Public utilities and other companies involved with underground infrastructure have been some of the most enthusiastic adopters of digital twins because the experience can reveal critical connections buried beneath the earth — made visible without the need to dig.

    In 2017, the Toms River Municipal Utilities Authority (TRMUA) in Toms River, New Jersey, began using mixed reality (MR) headsets to help crews find underground utility assets for electric, gas, water, telecommunications and sewer services.

    GIS stores the location of these assets, and MR displays the underground infrastructure. Traditionally, utilities display this detail on a 2D map. What MR provides is maximum context. Workers in the field can visualize exactly what is under their feet—and see how it’s related spatially to what is all around them.

    TRMUA credits MR with saving time and lowering the chances of breaking connections in the networks residents rely on for modern living — savings in the tens of thousands of dollars every day.

    Many utilities have since followed TRMUA’s lead. MR setups serve multiple purposes, including training new employees and sharing information between teams in the field and staff in the office.

    One utility industry publication recently noted that what these systems ultimately provide is the elimination of guesswork. The ability to know exactly where an asset is located — and to understand how changes will affect the area around it — leads to increased efficiency and customer satisfaction.

    The World in Sharper Focus

    Apple’s Vision Pro headset is not the only recent example of XR rebranded as spatial computing. Meta and Microsoft have also marketed their XR headsets — Quest 3 and Hololens, respectively — as spatial computers.

    Spatial computing will continue its mainstreaming. Eventually, it will likely be the norm. As XR hardware increases in number and power, more organizations will look to unlock the value of all the spatial data recorded in GIS. Being able to experience data will add further value to the systems and workflows that create it.

    GIS pioneers began exploring the outer limits of spatial computing a half-century ago. More recently they have realized its potential for smarter urban planning, climate risk mitigation, management of operations across industries and virtual exploration of real-world systems or scenarios via geospatial digital twins. Someday soon, those limits will be reachable by anyone.

    As GIS users have learned through the decades, when we get a better sense of where we are in relation to things we care about, we can create the world we want to see.

    To explore immersive spatial computing experiences in browser, visit 360 VR Experiences. Read more about Esri XR experiences in ArcGIS.

    This article originally appeared on Esri Blog.

  • INTERGEO 2023: Recap

    INTERGEO 2023: Recap

    On the first day of INTERGEO 2023, attendees flooded the exhibit hall.
    On the first day of INTERGEO 2023, attendees flooded the exhibit hall. (All photos taken by GPS World staff).

    The 29th INTERGEO conference and trade show on geospatial technology and data was held from October 10 to 12 in the German capital Berlin. This year’s event took place under the famous radio tower and in the brand new Hub27 conference center, part of the 42-acre Messe Berlin exhibit and conference center. The annual event takes place each year in a different German city.

    Over the three days, 560 vendors from more than 40 nations exhibited their products, while people from across the globe attended presentations and vendor exhibits on geodesy, geoinformation and land management. Topics covered included Earth observation and environmental monitoring, maritime solutions, unmanned systems, building information modeling (BIM), GIS and artificial intelligence, metaverse and cloud applications, smart cities, digital twins, COPERNICUS and Galileo satellite services, 4D geodata, 3D cadaster, and smart mapping applications. The focus was on how these technologies and data are used to address issues of housing, mobility, sustainability, climate change and internal security, monitoring for disaster prevention and protection, and the creation of more equitable living conditions.

    In conjunction with the conference, the German Cartography Congress 2023 also convened, with lectures on such topics as atlases, map collections, map design, and artificial intelligence. In her keynote address, Professor Monika Sester discussed how machine learning methods help with generalization and Professor Sebastian Meier gave a provocative lecture titled “Critical Cartography in Times of Hallucinating Machines.”

    Attendees at a presentation from the exhibit hall stage.
    Attendees at a presentation from the exhibit hall stage.

    Day 1, Tuesday, October 10

    On the first day of INTERGEO 2023, keynote speakers included Jack Dangermond, founder and CEO of ESRI, professor Paul Becker, president of the Federal Agency for Cartography and Geodesy, Scott Crozier from Trimble and professor Rudolf Staiger, president of the organiser DVW e.V. The main theme was the centrality of geospatial science and technology to sustainability because the basis of socially, ecologically and economically sustainable decisions lies in the understanding of the Earth system. This is increasingly achieve using geoinformation gathered through Earth observation and many other sensors.

    GPS World conducted short interviews with Gustavo Lopez, market access manager at Septentrio and Deyn Deng, overseas sales manager at Unicore.

    Some surveying supplies that have been used for centuries are still in use today.
    Some surveying supplies that have been used for centuries are still in use today.

    Day 2, Wednesday, October 11

    On the second day of INTERGEO 2023, the focus of the keynote presentations, like that of many of the products in the exhibit hall, was “smart cities” and building information modeling (BIM), including a panel discussion on the importance of BIM in Germany. Related themes discussed in the presentations, on the exhibit hall stages, and at vendors’ booths included connected urban twins, sensor data, real-time applications, urban twins as drivers of innovation for local governments, maritime solutions, Earth observation, and unmanned systems.

    An autonomous bathymetric vessel from Teledyne Marine.
    An autonomous bathymetric vessel from Teledyne Marine.

    At a press conference on navigating sustainability through geospatial insights the participants were Rudolf Staiger, president of DVW, Boris Skopljak, Vice President survey & mapping strategy and product marketing at Trimble, Thomas Harring, president Geosystems at HexagonGerd Buziek, Business Relations Executive at Esri Deutschland and Godela Roßner, head of Earth observation at Deutsches Zentrum für Luft- und Raumfahrt (DLR).

    This UAV from CHCNav can take off and land like a helicopter and fly like a plane.
    This UAV from CHCNAV can take off and land like a helicopter and fly like a plane.

    GPS World conducted short interviews with Andrew Scott, Head of Marketing & Sales at JAVAD GNSS; Jamie Birch, product manager at OxTS; Mandy Clayton, Southeast Regional sales mganager at GeoMax (part of Hexagon); Florian Ollier, head of marketing & communications at SBG Systems; Andrei Gorb, division product manager, Mapping Solutions at CHCNAV; Rachel Wong, Survey & Engineering Product Line, product manager at CHCNAV; Marcel Visser, CEO of NavCert; Ken MacLeod, product line manager and Bruce Shields systems group director at Tallysman; and Morgane Selve, head of marketing at Yellowscan.

    CHCNav’s Apache 4 autonomous bathymetric vessel.
    CHCNAV’s Apache 4 autonomous bathymetric vessel.

    Visser told GPS World that his company had obtained from the German federal government sole responsibility to certify UAVs in Germany for commercial operations, including flights beyond visual line of sight (BVLOS).

    Trimble’s GEDO CE 2.0 track measurement trolley.
    Trimble’s GEDO CE 2.0 track measurement trolley.

  • Trimble Terra Office workflow integrates with Esri ArcGIS Pro

    Trimble Terra Office workflow integrates with Esri ArcGIS Pro


    Image: Trimble Geospatial 
    Image: Trimble Geospatial

    Trimble has released the Trimble Terra Office add-in for Esri ArcGIS Pro. The add-in is a part of Trimble’s Terra Office suite of desktop solutions for integrating Trimble TerraFlex field data collection software with GIS systems of record.

    With a streamlined user interface, the new Terra Office add-in for ArcGIS Pro enables users to connect TerraFlex workflows directly to the ArcGIS platform from within ArcGIS Pro — Esri’s desktop GIS application. ArcGIS Pro users can now create and manage TerraFlex geospatial data collection projects without leaving ArcGIS.

    Organizations that collect data in TerraFlex and bring it into ArcGIS through the add-in can also use the Trimble Offline GNSS Corrections service, for situations where real-time correction services are intermittent or unavailable. With this service, all data from the field is automatically processed in the cloud without user intervention, and the most accurate real-time or post-processed position is stored for each feature and made available for download through the Terra Office add-in for ArcGIS Pro.

    For more information on the Terra Office add-in and its availability, click here.

  • Minnesota company develops new system for mapping underground utilities

    Minnesota company develops new system for mapping underground utilities

    800Cover Story Image
    An Ellingson Companies surveyor works on an underground utility line. (Image: Ellingson Companies)

    This is part I of our III part feature story. Read more in part II, Review benefits of GNSS rover accuracy  and part III, Robotic total stations add scanning capabilities.


    The danger of hitting a buried water or gas pipe when digging for a construction project persists despite many efforts to reduce it, such as “call before you dig” phone numbers. For example, in Minnesota there were 4,000 such hits in 2019. That is one reason why it is very important to map “as built” underground utilities accurately. This must be done quickly and efficiently, before trenches are filled and without slowing progress of the project.

    Traditionally, crews have mapped the underground pipes and cables on paper. In turn, when a construction project needs to know the location of underground utilities before digging, it typically relies on someone who consults those paper maps, uses an electromagnetic utility locating tool, and marks the ground with spray paint. The construction crew then must correctly interpret those marks on the ground. In 2019, Minnesota-based utility consultancy Ellingson Companies was asked to develop a new and more efficient process.

    Capturing Data in Real Time

    By leveraging solutions from Esri and from Canadian hardware and software manufacturer Eos Positioning Systems, Ellingson Companies GIS Manager Damon Nelton developed a solution that allows his team to capture new pipe construction in real time. By streamlining documentation workflows, the new process improved field productivity and allowed Ellingson Companies to produce digital as-builts that meet the needs of its gas utility clients and improve the safety of future construction projects.

    While construction crews have been putting pipe in the ground for generations, today they are expected to produce a digital record of their work in real time — for the sake of safety and efficiency.

    Using Esri’s Utility Pipeline Data Model, Nelton created a system that enables crews to map their as-built pipe projects while also tracking components. The system improves data integrity — in other words, reduces human error — by relying on scannable 16-digit alphanumeric bar codes developed by the American Society for Testing and Materials that provide seven attributes for each conduit, including thickness, diameter, lot number and manufacturer date. To collect and store these data, Nelton set up an ArcGIS Enterprise geodatabase.

    Gas meters, which also need to be mapped, are often in locations that are hard to map directly with a GNSS receiver because line-of-sight to the satellites is obstructed by trees, roof eves, or adjacent buildings. Therefore, they must be shot with an offset. For these situations, Nelton used Eos Positioning Systems’ laser mapping solution, which enables surveyors to use lasers attached to their range poles to feed data directly into their GIS.

    No More Battleship

    Using Eos Positioning System’s Arrow Gold receiver and the MNCoors RTK network, Nelton said, his team was able to average an accuracy of 0.25 throughout a project in the city of Owatonna, Minnesota, as confirmed by spot checks with other survey equipment and with the city’s survey team.

    “Not every shot was easy, and some took multiple attempts and tricks of the trade to get them,” Nelton pointed out.

    On projects in the middle of mountains, where real-time kinematic (RTK) networks do not exist, the company has used the Atlas Service, averaging accuracies of 12 in.

    “Given the circumstances of these projects,” Nelton said, “we still consider that to be great.”

    Using the new system, foremen use a survey in ArcGIS Survey123 to input their inspection notes and other information, feeding it all from the field to the office and into layers shared between divisions. This way, the data are available in real time, not at the end of the project.

    For customers who still want a piece of paper to file in a physical folder in a filing cabinet, Nelton creates a Microsoft Word document template in their format, populates it using dynamic text with syntax in ArcGIS Pro, inserts a map, then saves the Word document as a PDF.

    “At the end of the project, we got almost 17,000 digits with no human entry other than pressing the button on the barcode scanner, which means zero data errors,” said Nelton.

    No pieces of paper with critical data on the underground utilities languish in a glove compartment or are eaten by a surveyor’s dog, and all the data is available in real time.

    Additionally, the combination of the barcode scanning workflow and the high accuracy GNSS receiver enables Nelton’s team to locate gas asset pieces that need to be replaced — for example, due to a recall by the manufacturer — “without playing battleship,” he said.

  • Esri, HALO Trust join to map unexploded bombs in Ukraine

    Esri, HALO Trust join to map unexploded bombs in Ukraine

    A Russian short-range ballistic missile, believed to be an unexploded Iskander missile, was found near Kramatorsk, Ukraine, in this photo released March 9 by Ukrainian authorities. (Photo: National Guard of Ukraine handout via Reuters)
    A Russian short-range ballistic missile, believed to be an unexploded Iskander missile, was found near Kramatorsk, Ukraine, in this photo released March 9 by Ukrainian authorities. (Photo: National Guard of Ukraine handout via Reuters)

    As a geopolitical and devastating humanitarian crisis unfolds in Ukraine, the HALO Trust is partnering with Esri to map unexploded ordnance as part of an immediate humanitarian response.

    More than 10 million Ukrainians have been displaced by the war and many are forced to move across a landscape littered with unexploded rockets, bombs and landmines.

    In response, Esri has committed its cutting-edge geographic information system (GIS) software resources, expertise and staffing in support of HALO’s mission in Ukraine.

    The organizations’ collaboration will allow them to map areas contaminated with explosives so HALO can remove the hazards when conditions allow. This will provide safe land to house displaced families and clear routes for humanitarian aid to reach those in desperate need.

    HALO is already using GIS to map the heaviest conflict zones, and the partnership with HALO will support planning for future clearance operations.

    As experts in their field, HALO is the world’s largest humanitarian landmine clearance and weapons disposal organization, clearing more than 13.9 million landmines and unexploded ordinance across 28 countries torn apart by conflict.

    In addition to technical expertise, HALO staff provide safety education for those in contaminated areas to avoid life-changing injuries and death, emergency medical aid, and humanitarian support for displaced persons as they face conflict, and in many cases are forced to flee their homes.

    Esri has collaborated with HALO since 2008 helping to map war-ravaged regions where specific locational awareness of landmines and other hazards is necessary to protect the lives of people in those areas.

  • Eos Positioning Systems announces Eos Laser Mapping for Android

    Eos Positioning Systems announces Eos Laser Mapping for Android

    Professionals can capture high-accuracy laser offsets directly into ArcGIS Field Maps on Android devices with Arrow Series GNSS receivers

    Image: Eos Positioning
    Image: Eos Positioning

    Eos Positioning Systems Inc. announces the release of its Eos Laser Mapping for ArcGIS solution on Android devices. Previously, the free solution was available only on iOS. It allows mobile crews to capture asset locations from a distance with survey-grade accuracy.

    “We are excited to provide this already popular iOS solution also to our customers using Android devices,” Eos Chief Technology Officer Jean-Yves Lauture said.

    The solution combines technology from geographic information system (GIS) provider Esri, laser rangefinders from Laser Tech, and Eos’ own Arrow Series GNSS receivers.

    “The Eos Laser Mapping solution was extremely well-received with its initial release, so we are excited to see the same features now available for ArcGIS Field Maps users on Android devices,” Esri Field Apps Engineering Lead Jeff Shaner said.

    The Eos Laser Mapping release on Android supports three workflows, or mapping methodologies: Standard Laser Offset (sometimes called Range-Azimuth), Range-Range (or Range-Intersect), and Range-Backsight (a total station-like method).

    The original laser offset solution was released in 2018 by Eos in partnership with Esri and Laser Tech.