Leica Geosystems has extended its Leica Cyclone FIELD 360 mobile-device app to all Leica Geosystems 3D terrestrial laser scanners for in-field data acquisition and visualization.
With the push of a button from the mobile-device app, all Leica Geosystems’ laser scanner users can capture high-quality data and verify registration directly in the field, Leica said.
The Leica ScanStation P-Series, Leica’s survey-grade 3D laser scanners, can now benefit from the existing workflow of the Cyclone FIELD 360 mobile-device app. With the integrated Cyclone FIELD 360 mobile-device app, users can capture and document projects quickly and accurately, view all field workflows, quality control and prepare scan data for downstream use, Leica added.
“Integrating the ScanStation P-Series laser scanners into the Cyclone FIELD 360 mobile-device app workflow adds in-field visualisation and dataflow benefits, directly linking in-field projects to the Cyclone ecosystem,” said Gerhard Walter, senior product manager at Leica Geosystems. “Customers who own our entire laser scanning portfolio will find it much easier to combine their scan data and not have to buy more equipment as the app can be used on their chosen mobile device to operate the scanners.”
Leica Geosystems, part of Hexagon, provides scene capture solutions for public safety applications.
RedTail Lidar Systems partnered with an engineering firm to demonstrate the RTL-400 lidar system’s high-resolution, high-accuracy mapping capability.
Cross-section of lidar point cloud (Image: RedTail Lidar Systems)
According to the company, its lidar imagery was used to generate as-built conditions of a steep ravine to aid in long-term monitoring of the slopes under which a natural gas pipeline was buried.
A narrow road traversing the top of the ravine through which the pipeline was installed was of concern since the instability could be dangerous. Loss of vegetation along the buried pipeline’s path also makes the area especially susceptible to slides after heavy rainfall.
Top view of lidar point cloud (Image: RedTail Lidar Systems)
The RTL-400’s high-resolution point cloud data of the 13-acre ravine area was captured in 10 minutes, RedTail Lidar Systems said. The as-built digital elevation model (DEM) created from the lidar point cloud can be compared to future DEMs to determine if any changes have occurred in the slope’s topology, which would serve to identify hazards and provide input for slip mitigation.
RedTail Lidar Systems is a division of 4D Tech Solutions, a company focused on providing innovative technology-based solutions to address government and commercial customer needs.
IQGeo, a developer of geospatial productivity and collaboration software for the telecoms and utility industries, has acquired OSPInsight International Inc., a U.S.-based leader in fiber-optic network management.
Under the terms of the agreement, IQGeo will purchase OSPInsight for $8.75 million, which will be funded through a mix of cash and shares. The completion of the acquisition is subject to shareholder final approval.
The OSPInsight fiber planning and design software for the telecoms market is highly complementary with IQGeo’s geospatial software that also supports telecoms network operations, according to a press release from IQGeo. While the current IQGeo offering targets larger enterprise network deployments (tier 1 and tier 2 operators), the OSPInsight software is ideally suited for the needs of smaller networks (tier 3 and tier 4 operators) with simple, fast deployments.
The combination of the two product lines, as well as the telecoms industry and software technology expertise, will enable IQGeo to service an expanded target market in existing and new geographies.
“The entire IQGeo team is very excited about the business and technology potential that will be created by the acquisition of OSPInsight,” said Richard Petti, CEO at IQGeo. “With more than 25 years of industry experience, they have developed an excellent product line and established an impressive list of customers, while building a very strong reputation in the telecoms industry. We see this as a fantastic opportunity that provides IQGeo with a proven software solution and sales channel for tier 3 and tier 4 network operators and it gives the OSPInsight team the global reach and financial resources needed to take their software to a wider audience.”
“The real winner in this acquisition will be OSPInsight customers,” explained Wade Anderson, CEO at OSPInsight. “Our customers will continue to enjoy the same level of support they’ve always had and have a greatly expanded product line for additional network management solutions. Existing and future OSPInsight customers will quickly have access to IQGeo’s industry-leading mobile software that digitizes field operations to improve network data quality and currency. The two product lines dovetail very nicely. I’m excited for the shared vision of providing world-class software that helps our telecoms customers transform their network operations. We can’t wait to get started.”
You can learn more about the acquisition by visiting the IQGeo Investor page to view a video interview with Richard Petti, IQGeo’s CEO and Haywood Chapman, IQGeo’s CFO.
The Bluesky MetroVista range includes high-resolution imagery combined with high-accuracy, wide-scale 3D models. (Image: Bluesky)
Aerial mapping company Bluesky is releasing its entire catalog of geographically referenced oblique aerial images of cities in the United Kingdom (UK) via a new subscription-based streaming service.
Working with Geoxphere, a specialist in cloud-based GIS, Bluesky will offer MetroVista imagery via an easy-to-use web viewer that also includes measurement tools for detailed analysis of building features, façade details and street furniture locations.
“Oblique imagery offers an unparalleled view of the built environment revealing real world features simply not present in any other type of aerial image or map,” commented Rachel Tidmarsh, managing director of Leicestershire-based Bluesky International. “The MetroVista imagery can be used to inform decision making with time stamped intelligence, and even evidence, as well as improving engagement with colleagues through better communication of ideas. All of this without even leaving your desk!
“However this wealth of information, as you would expect, can present some issues when it comes to storing and consuming data. The MetroVista Oblique Viewer overcomes these issues meaning the value of the data can be realised without the burden of storing, processing or updating.”
With a data-as-a-service (DaaS) solution powered by Geoxphere’s XMAP geospatial cloud technology, the MetroVista Oblique Viewer is a fully managed subscription service meaning there is no need to download or store large volumes of data locally. The MetroVista Oblique Viewer does not require any specialist software, plugins or downloads and, as the data is also managed, newly captured images are automatically added to an account as they become available.
The MetroVista Oblique Viewer has split screen options and rotating views allowing the user to toggle through images to get a 360 degree view of a building. The Bluesky Geoxphere Viewer also includes height and area measurement tools for recording a building height or distance from a feature and its façade area.
Captured using the world’s first large format imagery and lidar hybrid airborne sensor, Bluesky MetroVista imagery collection includes simultaneously captured oblique and vertical aerial photography. The MetroVista datasets also include geographically accurate, photo-textured, mesh models ready for use in 3D GIS, CAD and other modelling software as well as visualisation, gaming and Virtual Reality workflows.
Bluesky has already captured MetroVista data for cities such as London, Birmingham, Manchester, Bristol, Nottingham, Oxford, Cambridge, Brighton, Norwich, Leicester, Derby and Newcastle as well as Bournemouth, Brighton, Cardiff, Doncaster, Eastbourne and Southend.
SPH Engineering has partnered with Daewoo Engineering and Construction (E&C). Through the partnership, SPH will support Daewoo’s data management projects through its Atlas artificial intelligence (AI) platform, which enables aerial imagery storage, map creation, change tracking, object detection and territory segmentation.
Photogrammetry data is expected to become one of the key components for storage and processing, SPH added.
According to the companies, Atlas will enable Daewoo Engineering and Construction to set up an online archive of drone imagery and photogrammetry products, track changes and generate reports, automate object detection and measure the identified objects of interest. The platform also will increase data availability for participants of construction workflow.
“Atlas can be definitely used in various fields, but it will be a groundbreaking platform, especially in the field of construction survey,” said Geunmok Song (Alex), digital construction team manager at Daewoo Engineering and Construction.
“When we introduced Atlas back in spring, first of all we wanted to support our existing UgCS customers with an easy-to-use AI tool to store and process data collected with our software integrated to a UAV,” said Alexei Yankelevich, R&D director at SPH Engineering. “We are proud that Daewoo Engineering and Construction, the representative of Korea, has opted for our solution.”
Tenacity of spirit is one of the great virtues. Supporters of geospatial technology have often had to endure steadfast resolve convincing others of the multi-dimensional value GIS provides. It is a battle best won by seeing and doing rather than by words.
Then, in the early 2000s, due in large part to 9/11, the government’s interest in GIS increased.
It was a necessary evolution. Technologies at the time were rapidly advancing. Computer graphics, computer processing power, the internet, shared databases, GPS, digital imagery, and mobile devices needed to merge. GIS was the only solution to bring them all together.
At the same time, disasters became increasingly destructive. Public safety and emergency management needed solutions, but most of the funding is by the government with tight budgets, so investments into geospatial technologies and specialized staff were limited.
A small group of individuals saw that gap and together they began providing support to the public safety sector. The first organization they were able to work with was the National Association of State Fire Marshalls. Word quickly spread. Soon, other organizations began asking for geospatial services.
Eventually, 11 national organizations came together to provide support, structure and purpose for the fledgling team of GIS volunteers. This group became the founders of the National Alliance for Public Safety GIS (NAPSG) Foundation.
Now, 15 years later, NAPSG has contributed to recovery after every major disaster and many minor ones throughout the United States. Its success extends internationally — NAPSG has helped other countries set up their own public safety GIS support teams.
Image: NAPSG
Membership in NAPSG has grown to more than 65,000. Its members are involved in supporting operations for fires, flooding, search and rescue, earthquakes, storm and tornado damage, health crises, chemical spills, and more. They have become central to emergency management operations, helping coordinate efforts of multiple groups through GIS platforms.
During and after events, NAPSG hosts debriefs to evaluate and improve ongoing and future operations. The result advances the field of public safety. NAPSG also provides education to its constituent communities and makes its training available to the public.
NAPSG and its members are highly valued. Every state GIS council has the group as a point of contact. NAPSG is a trusted entity at the community level up through to the highest levels of the federal government, and they are one of the first calls FEMA makes in a crisis.
Tari Martin
I had the opportunity to interview Tari Martin (GISP), the director of national and federal programs, one of the leaders in NAPSG. Speaking with Tari made me realize that GIS is still early in its adoption phase. Tari is one of the founders of GIS at the state level. Earlier in her career she was the first person in the state of Maryland dedicated to supporting emergency management operations.
She helped build Maryland’s emergency management framework coordinated efforts with the National Incident Management System (NIMS), and she began pulling in federal data such as the Homeland Infrastructure Foundation-Level Dataset (HIFLD) for use in local operations.
Now, Tari serves on the Maryland GIS Council for the Public Safety/Next Generation 911 Subcommittee in addition to her regular duties as a director for NAPSG. Tari also serves as a program manager, working to create a universal symbology for public safety and emergency management.
Maps and map symbology are revered. Map symbology emerged from a long, proud, history of cartography dating back to a time before the Golden Age of Exploration when maps were adorned with beautiful, hand-drawn symbols of wind roses, sea creatures, and exotic plants and animals; including inscriptions, such as that within the cartouche of the Typus Orbis Terrarum (Atlas of the World) by Ortelius in 1573. Therein are inscribed the words from Cicero’s Tusculan Disputations, “Quid ei potest videri magnum in rebus humanis, cui aeternitas omnis, totiusque mundi nota sit magnitudo,” which translated means, “For what human affairs can seem important to a person who keeps all eternity before his eyes and knows the vastness of the universe?”
Map symbology has been more an art than a science driven predominantly to support specific purposes, such as navigation, war, surveying, mining, construction and recreation. Additionally, symbologies may not translate across professions, regions or cultures. Even when the symbols are the same, the colors may be different giving symbols different meanings.
Symbols are a visual language, and as the world becomes increasingly smaller and emergency events more international, the need for the language of maps to become universal is necessary. NAPSG has taken on that challenge, coordinating input from multiple stakeholders.
In essence, NAPSG is working with groups like Urban and Regional Information Systems Association (URISA) to create the Rosetta Stone of map symbology for public safety and emergency management, and Tari Martin is one of the central figures working on that project. The symbol library is free and publicly available on the NAPSG website.
Tari also reminisced about her early days when she first got into GIS just before Hurricane Katrina, and how many of her co-workers in Maryland mobilized to go down and help out with recovery operations. She stated that was one of the moments in her career that cemented her understanding for the value of GIS in post-disaster operations. Tari now teaches a course on GIS in Emergency Management for URISA.
NAPSG is involved in cutting-edge technologies helping to shape and educate the public safety community. Its members are working with autonomous vehicles, indoor mapping technologies, augmented reality and virtual reality, wearables, and other opportunities as they arise.
NAPSG makes its content available online. Explore its best practices, guidance and standards, education and training, events, qualifications and credentialing, toolkits and more. Become a NAPSG member at no cost.
William Tewelow works for the Federal Aviation Administration. He is a graduate of the FAA management fellowship program and while on special assignment to the U.S. Department of Transportation William led a national strategic geospatial project for the White House Open Data Partnership. He is a Geographic Information Systems Professional (GISP) and a Maryland STEMnet Scholar Speaker. He has degrees in Geographic Information Technology and Intelligence Studies, and is currently pursuing a masters degree in Organizational Management. He was among the first in the nation to earn a Geospatial Specialist Certification from the U.S. Department of Labor while working at NASA Stennis Space Center.
William retired from the U.S. Navy after serving 23 years as a Geospatial and Imagery Intelligence Specialist, a Naval Aviator, a Meteorologist, and a Tactical Oceanographer. He is married, enjoys writing, traveling, solving problems, and is fascinated by new technology and historical context. His favorite quote is, “A man’s mind changed by a new idea can never go back to its original dimension.” ~ Oliver Wendell Holmes
The world of mathematics has always been a mysterious one. It is universally loved by those who enjoy STEM-related fields and occupations, while being generally loathed by those who prefer the arts and humanities (similar to the argument with cats versus dogs, but let us not go down that rabbit hole). It would be easy to believe that if each side sticks to their side of the road, there would be peace and harmony in the world.
While I cannot speak for the art and humanities group, I can say with certainty that the STEM-related mathematics professions have been known to disagree with each other on various roles within the surveying and mapping world. While surveying has been around since the beginning of time, various forms of organized mapping systems began in earnest in the 1960s.
When attempts were made to bring the two professions together, each side bristled at being mentioned in the same breath as the other one. The surveyors were the outdoor cowboys with theodolites and tapes, measuring properties and improvements with low precision and accuracy. The mappers, now beginning to be known by the acronym GIS (geographical information system) technicians, were the office computer nerds with punch cards and slide rules.
Each side did not care much for the other — mostly because they did not understand each other’s role in creating the modern infrastructure database. This relationship would last for decades with no relief in sight.
Early (and unresolvable) differences
Each side brought a good argument to the table regarding why the other side was not as important to the authoritative role of map/plat making. For instance, here are the typical stances of each side in the 1970s, before the introduction of personal computers and electronic data collectors.
Surveyors worked on the ground and with actual monuments and improvements. They measured angles and distances to collect the pertinent data and drew by hand said information graphically on paper. Because of the accuracy and precision of the field measurements, adjustments were made to the calculations to resolve the unknown errors within the data collection.
GIS technicians used a combination of hand calculations, drafting and primitive computers to depict information obtained by existing maps and plats. Because the information being reviewed was not obtained through field methods, parcel lines were forced to fit, improvements to be shown with 90-degree corners, and ambiguities with most data issues to be dismissed.
Each side stood their ground (in the field or the office) and maintained the distance and differences until more technological revolutions began to infiltrate their vision. At first blush, one could assume these advancements would bring the two factions together; one would be wrong.
Would you like to play a game?
Photo: RyanJLane/E+/Getty Images
The 1980s are known for many things, but for the surveying and mapping communities, it brought a new way of reviewing and storing spatial data. The introduction of the personal computer and vector-based software in the early part of the decade set the pace for rapid and revolutionary upgrades to each profession.
It was now possible to see on a computer screen what had only been previously possible through manual computation and drafting. As the decade went on, computing speed and storage continued to increase along with the features of software packages.
However, these advancements did little to bring the surveying and mapping professions together; in fact, the technology has been blamed for causing even more of a divide between the two.
Again, each side has their reasons for maintaining their hold on being recognized as the authority on the creation of the cadaster layer.
Surveyors continued to insist because they worked on the ground and with actual monuments and improvements, the process of putting the data into a computerized format only solidified their position.
GIS technicians continued to insist that the refinement of their previous calculations of drafting and mapping into a computerized version further extended their expertise in the mapping world. Also, because many in GIS were specifically trained on computers in college, the work being produced by these members was superior to surveyors.
Even with the improvements in technology from computers, the divide between the two grew. The relationship between surveying and mapping was at an all-time low, so there must be nowhere to go but up, right? Not so fast.
GPS + spatial = data custody battle?
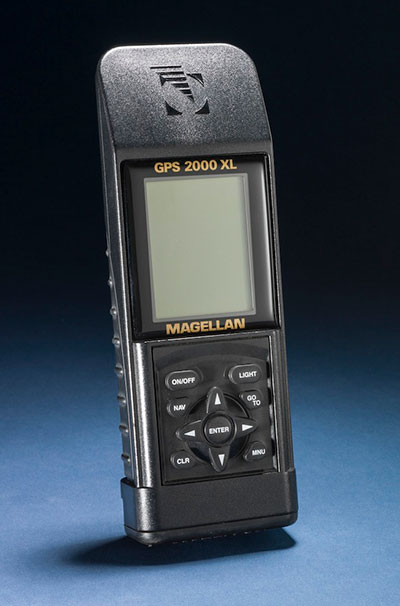
Photo: Magellan
Through the 1990s and beyond, the introduction and subsequent rapid implementation of GPS/GNSS gave new meaning to a previous but rarely used term: geospatial data. Only geodesists and higher-end scientists truly worked with geospatial data because of their professional environment and expertise, but now anyone with a GPS receiver became a geospatial data collector.
Previously, surveyors would measure on a global scale (latitude/longitude and/or state plane coordinates), but this would typically consist of solar and lunar observations under ideal conditions. GIS technicians could only rely on data provided to fit within the location parameters of their projects, which has usually scaled from quadrangle maps.
However, this new technology was being used with data collectors programmed for almost anyone to use with little to no geodesy experience. Turn it on, press a button and voila — a geospatial location in a variety of coordinate systems. No more sun shots, lengthy traverses from obscure NGS monuments, or scaling from the quad sheets.
Finally, the surveying and mapping communities have common ground to work on! It would be easy to assume that walls came down and the two professions mended their fences. The short answer is no; they once again did not. Here is each side’s general take on geospatial abilities:
Surveyors (once again!) continued to insist that because they worked on the ground and with actual monuments and improvements (though now with improved positioning), the process of putting the data into a georeferenced format only solidified their position.
GIS technicians now contended that they, too, could collect the necessary field data using GPS and bypass the need for surveyors. Also, because many in the GIS field were specifically educated to work with spatial data, the information being produced by these members was superior to surveyors’ data.
We now find ourselves flipping the calendar pages well into the 2020s, with little movement on resolving this relationship. But we can change that if we introduce a little friendlier dialogue.
In this corner, the surveyor. In the opposite corner, the GIS technician
When it comes to high accuracy/high-precision data collection for locating existing properties and improvements, there will be little argument that this role is strictly designated to the surveying profession. Technological improvements have made our work more precise and accurate; all while being collected in a georeferenced system. The relationship between the surveyor and geospatial data was previously discussed to demonstrate the importance of our work and determining existing conditions, (see GPS World July 2020 column). The surveyor’s ability to be able to collect an enormous amount of geospatial data for surveying purposes is not being questioned, but the line to where the work encroaches into GIS territory. Spoiler alert: Practically everything the surveyor collects can be considered GIS information as well.
Let us look at the relationship from the GIS perspective. The input and oversight of the parcel layer must rely on the licensed land surveyor to provide, while the GIS community is charged to collect necessary information to include into their database. It would make sense to update existing infrastructure information using current technology or historical archives in which the position of the data can be verified. Either way, it is now going to be referenced by its geospatial position rather than a relationship to a parcel line.
Also, the GIS technicians have the same or better capability to utilize data collectors with GNSS receivers for locating existing improvements for inclusion into their system. Most of these technicians have access to the same sources providing the GNSS equipment and coupled with their education and skills, they can collect the data as well as any survey crew. B
ut does this data collection by a GIS technician fall under most state statutes for surveying without a license? Spoiler alert: The short answer is yes, it does if any data collection includes parcel monumentation and could depict a relationship to a parcel line.
The whole is greater than the sum of its parts
Before both parties of this discussion get their pitchforks and torches to have a “talk” with this author, let us take a step back and reassess where we are today with technology and looking toward a future together. The common element here is the data, but how each party uses the data does vary.
The surveyor typically uses geospatial data for several applications; boundary determination, existing planimetric and topographical conditions, and physical depiction of proposed improvements. The surveyor’s data should be considered as a snapshot in time of the conditions of a particular site or project area.
Because of emerging technology, it is not just manually collected survey points using conventional equipment; it can be point clouds and 3D photographs not possible 20 years ago. The surveyor can be considered a high-tech record keeper and can update information as sites change. All because the collected geospatial data is timestamped and memorialized in a digital database.
GIS professionals, on the other hand, require similar information but for many different purposes. Attributes play a much bigger role in the geospatial data requirements than surveyors because the information found within tells them an important story.
Photo: aydinmutlu/E+/Getty Images
The biggest improvement because of the increasing accuracy of the data is infrastructure. As aging utilities require replacement, locating old facilities can be difficult based upon old mapping. Geospatial data collection provides more reliable locations once old facilities are found, existing conditions are reported, and crucial information about its lifespan is collected for future consideration.
Newly installed utilities will have the luxury of significant attribute data applied to each structure to help with future monitoring and maintenance. These are some of the factor that apply to effective asset management and can be applicable to both public and private clients.
While the surveyor and the mapper use geospatial data for similar yet different uses, the product is generally the same. But this discussion is not just about merging data into one big global database; we need to dig a little deeper on how to grow each side of our professions together.
Growth is never by mere chance; it is the result of forces working together
The surveying and mapping professions have been at a crossroad for some time and both sides continue to ignore each other. Both believe that geospatial data is theirs to control, and they both are right. However, each have a different stake in this geospatial data discussion and need to learn to respect each other’s role. Each side brings a different perspective how to grow and advance our world through effective and efficient surveying and mapping, but they must start talking to realize how much they can grow together.
With a little more focus and education of each other’s roles on both sides, an overlap of responsibilities could mean faster approach to modernizing many aspects of our respective professions. For instance:
Cross training of surveyors in GIS software, data collection requirements, parcel modules, and layer nomenclature
Encourage surveyors to apply for GISCI Certified GIS Professional (GISP) testing
Cross training of GIS professionals and technicians with survey technician programs
Encourage GIS personnel to apply for NSPS Certified Survey Technician (CST) testing
Both surveyors and mappers cross training with data collection systems capable of collecting geospatial data containing specific positional information and attributes
Identifying limitations of various equipment and techniques (i.e. using the right “tool” for the job)
Understanding of positional tolerance (precision versus accuracy) and metadata
Comprehension of coordinate systems and zones, including low distortion projections (LDP)
Distinguishing between surveying and mapping data collection (i.e. boundary/right-of-way determination versus infrastructure collection for inventory)
Light at the end of the tunnel
Technology has introduced our world to many advances not thought possible for our entire existence. The Fourth Industrial Revolution (see GPS World July 2019 column) is now taking aim at industries like surveying and mapping through automation and artificial intelligence capability.
Data is crucial to everything and our respective professions are in the center of the revolution. 2020 and our worldwide pandemic of COVID-19 has been (unfortunately) perfect example of how data affects our world in real time. The more critical and accurate data that is collected, the better we can make assessments of situations.
Surveyors and mappers are doing the same thing with data; survey data helps design our world through establishing accurate conditions, while GIS data helps to evaluate our current conditions and plan for future situations. Both professions rely heavily on data, collected in similar methods, but for separate but similar uses. Each has their strengths to bring to the collective table and can increase the effectiveness of digital modeling going forward.
Photo: PeopleImages/E+/Getty Images
Let’s make a plan
The world is moving toward digital twins, augmented and virtual reality along with autonomous travel; it would be in our best interest that the data used to identify the surroundings for those advancements be correct and seamless from all sources. Let us begin by dropping all the delusions of grandeur for our respective professions and formulate a plan to move forward together. The clock is ticking, and time continues to march on.
Technology continues, and soon Generation Z will be trying to do our work with their laptops and smartphones from the coffee shops without our help. Because they can. See, it is important, isn’t it?
Mobile GIS Services (MGISS) has equipped a team of urban surveyors with new satellite positioning systems to accurately map assets and features such as signage, lighting and landscape features. The technology supplied by MGISS included Leica smart antennas coupled with data management and mapping software.
For this project, MGISS worked with Occam’s Razor Consulting Limited (ORCL), a specialist in data capture for landowners, to achieve centimeter accurate asset mapping for open spaces and park management. ORCL works for local authorities and housing associations and due to the blocking effects of tall buildings and trees, its existing equipment was not capable of achieving the required levels of accuracy, MGISS said.
According to MGISS, ORCL had previously been using the Leica GG03 antennas with Leica rugged tablet computer computers. MGISS then recommended ORCL use the GG04 plus Leica smart antenna. ORCL is now operating its new smart antenna with a Leica controller running Zeno Field (an OEM version of ArcPad 10) software.
According to MGISS, in addition to the ArcPad GIS functionality, Zeno Field provides GNSS raw data logging, easy handling of GNSS configurations, feature accuracy management and an automated workflow between the field and office. ORCL also uses Laser Technology TruPulse rangefinders and Leica Smartnet for its RTK service, all specified and supplied by MGISS. Working with MGISS ORCL will monitor its current workflows as the software develops to support LTI laser rangefinders and will continue to explore new applications, MGISS said.
“We were interested in very high performance equipment capable of achieving centimeter accuracy in difficult urban canyon conditions and under dense tree canopies,” said David Brown, managing director of Occam’s Razor Consulting. “The new MGISS solution has slotted straight into our existing workflows without any issues at all and is a clear improvement on our previous system. The devices track the newer Galileo constellation, as well as the more established American and Russian satellites, reaching centimeter accuracy quickly and holding the signal well overcoming the challenges of tall buildings and trees.”
NEXTMap digital surface model (Image: Intermap Technologies)
The NEXTMap Elevation Data Suite from Intermap Technologies is now offered on the UP42 developer platform for Earth observation data and analytics. UP42 gives users direct access to extensive Earth observation datasets and advanced processing algorithms, and Intermap Technologies, based in Englewood, Colorado, is a provider of geospatial datasets, solutions and software.
The NEXTMap 3D elevation products are available as digital surface models and digital terrain models at one-, five- and 10-meter resolution. According to Intermap, NEXTMap One offers 1-meter spatial resolution, 1-meter vertical and 3.5-meter horizontal accuracy; NEXTMap 5 offers 5-meter resolution, 1.6-meter vertical and 3.5-meter horizontal accuracy; and NEXTMap 10 offers 10-meter resolution, 8.4-meter vertical and 17.5-meter horizontal accuracy.
“We are excited to add NEXTMap elevation models to the UP42 platform. Our customers need this data for a range of use cases, including monitoring of vital infrastructure projects such as pipelines, powerlines and railway corridors,” said Sean Wiid, CEO of UP42. “High-quality 3D data is critical in every phase of infrastructure management from construction planning to ongoing monitoring of vegetation encroachment.”
The addition of NEXTMap datasets to the UP42 marketplace enables users to build even more powerful geospatial solutions in the areas of infrastructure management, construction planning, geologic mapping, land cover classification, forestry, resource conservation and contour generation, UP42 said.
“Our goal at UP42 is to create a single platform where our users have access to all the geospatial data, analytics and processing infrastructure they need to build solutions that solve critical real world problems,” said Wiid. “Intermap’s NEXTMap elevation models dramatically expand our core data offering and, as a result, expand the range of use cases we can help our customers address.”
The NEXTMap datasets join a variety of Earth observation information already on the UP42 marketplace, including Pleiades 1A/B, SPOT 6/7, Landsat-8, TerraSar-X, Sentinel-2 and MODIS satellite imagery, Getmapping U.K. aerial data, exactEarth AIS data, and Meteomatics weather and ocean data.
Earth-imaging and scientific payloads have arrived in French Guiana, both designed for Ariancespace’s Vega mission in November.
The spacecraft were delivered by a chartered Antonov AN-124 cargo jetliner that touched down at Cayenne’s Félix Eboué Airport. They were then transported by road to the Spaceport, where processing is now underway in separate clean room areas of the S5 payload processing facility.
According to Arianspace, the Vega’s mission with these satellites is designated Flight VV17 in Arianespace’s launcher family numbering system.
The two satellites include SEOSAT-Ingenio, Spain’s optical observation satellite, and Taranis.
SEOSAT-Ingenio
Arianespace’s launch services contract for the SEOSAT-Ingenio satellite was signed with the European Space Agency for Spain’s Center for Development of Industrial Technology (CDTI). The satellite features optical technology, developed primarily by the Spanish space industry with Airbus in Spain as the prime contractor. Its liftoff mass will be approximately 840 kg.
High-resolution imagery from SEOSAT-Ingenio is to be used for civil and military purposes in such applications as security, land management, natural resources, border surveillance, agriculture and natural disaster crisis management, Arianspace said. The satellite is owned by the Spanish Ministry of Science and Technology, with the CDTI leading the spacecraft project by delegation and also assuming its cost.
Spain’s SEOSAT-Ingenio (left) is readied for the startup of its checkout process in the Spaceport’s S5 payload preparation facility, which will begin after the external wrapping is removed. The French Taranis scientific satellite (right) undergoes an initial inspection in another of the S5 clean room areas. (Photos: Arianspace)
Taranis
Taranis, or Tool for the Analysis of RAdiation from lightNIng and Sprites, is named after the god of thunder in Celtic mythology. It will study impulsive transfers of energy between the Earth’s atmosphere and the space environment that occur above thunderstorms.
Funded by the French CNES space agency, this satellite will have a liftoff mass in the 200-kg. category and is to provide data on the transient luminous events that have been observed in the past 30 years, particularly such phenomena that are called sprites, jets and elves.
According to Arianspace, both SEOSAT-Ingenio and Taranis will operate in similar orbits at an altitude of approximately 700 km. In ride-sharing this launch on Arianespace’s light-lift Vega launcher, the two spacecraft will be deployed by a VESPA payload dispenser, produced by Airbus in Spain for Avio.
The COVID-19 pandemic has brought uncertainties to all businesses, and the mapping industry has been no exception.
Slowdowns were observed during the first few months of 2020 as lockdowns were gradually enforced in Asia, then Europe, and finally the Americas.
As expected, projects were delayed during that initial period as companies were reorganizing their operations to allow for remote work.
Once that transition was overcome, a great number of projects resumed, and the geospatial field has been gradually coming back to normal since then. That can be explained by different factors, including, for example, several governments accelerating infrastructure projects to stimulate the economy.
A lot of mapping firms have turned the pandemic into an opportunity to improve their processes. Slower times allow reviewing production workflows and assessing bottlenecks. Once identified, new hardware and software solutions can be evaluated to optimize production.
Interestingly, the resulting investments into new solutions has been significant. Companies are seeing a quick payoff as their workload is rapidly accelerating, leading to an increase in their bottom line.
Overall, the mapping industry was able to rapidly adjust to the new reality caused by the pandemic. The changes that are being made in performing projects not only allow us to minimize risks in the short term, but also to increase profitability in the longer term.
SimActive is the developer of Correlator3D software, a patented end-to-end photogrammetry solution for the generation of high-quality geospatial data from satellite and aerial imagery, including drones. Correlator3D performs aerial triangulation (AT) and produces dense digital surface models (DSM), digital terrain models (DTM), point clouds, orthomosaics, 3D models and vectorized 3D features.
Powered by GPU technology and multi-core CPUs, Correlator3D ensures high processing speed to support rapid production of large datasets.
SimActive has been selling Correlator3D to leading mapping firms and government organizations around the world, offering cutting-edge photogrammetry software backed by exceptional customer support.
New process simplifies task of computational geospatial processing accessible via web services
The Open Geospatial Consortium (OGC) seeks public comment on a new draft OGC API standard: OGC API – Processes – Part 1: Core. Comments are due by Oct. 19.
The draft OGC API – Processes Standard specifies a Web API that enables the execution of computing processes and the retrieval of metadata describing their purpose and functionality. For example, these processes could combine raster, vector, coverage and/or point cloud data with well-defined algorithms to produce new raster, vector, coverage and/or point cloud information.
The draft OGC API – Processes Standard builds on the Web Processing Service (WPS) 2.0 standard and defines the processing standards to communicate in a RESTful manner using JSON encodings. This API is a newer and more modern way of programming and interacting with resources over the web while allowing better integration into existing software packages.
In many cases, location data, including data from sensors, must be processed before the information can be effectively used. OGC API – Processes, just like the OGC WPS Interface Standard, provides a standard interface that simplifies the task of making simple or complex computational geospatial processing services accessible via web services.
Such services include well-known processes found in GIS software as well as specialized processes for 2D/3D/4D modeling and simulation. The API also makes it easy for developers to implement microservices that can handle location data.
The draft OGC API – Processes Standard provides a similarly robust, interoperable, and versatile protocol for process execution across the Web. OGC API – Processes supports both immediate processing for computational tasks that take little time and asynchronous processing for more complex and time-consuming tasks.
As with other OGC APIs, OGC API – Processes consists of optional parts that each provide extra functionality. This specification, Part 1: Core, is intended to be a minimal useful API for the execution of processes from the geospatial domain. There are no constraints on the types of processes that can be published through the API. Examples of processes that have been demonstrated during the development of the draft API standard include routing, contour generation, buffering, coverage processing and several others. The API is therefore expected to be applicable to several domains.