The United Kingdom and the European Union (EU) continue locked in conflict over Galileo post-Brexit, much akin to a divorce dispute over the children.
The European Commission has initiated proceedings to exclude the U.K. and its companies from security work on Galileo before the country’s exit from the bloc next year, a move that presages exclusion from use of the security features of the Galileo PRS signal.
The U.K. has responded with a demand for repayment of up to 1 billion pounds ($1.34 billion).
Both sides say they wish to continue working together on the GNSS, but the EU insists that it must be under new rules, including those preventing third countries from obtaining access to critical security information. The European Commission, executive arm of the EU, says the U.K. can no longer be trusted with sensitive data providing a secure back-up for the new satellite system.
“It’s simple: Britain is part of Galileo today as an EU member, but won’t be automatically part of Galileo tomorrow as a third-party state,” said an EU advisor. “That’s the mechanical, legal consequence of Brexit.”
The U.K. for its part has made unrestricted access a condition for a broader security collaboration.
There has been speculation that the U.K. would use the $1.34 billion alimony settlement to build a new GNSS, drawing on expertise from Australia — in effect, engendering offspring from a new marriage.
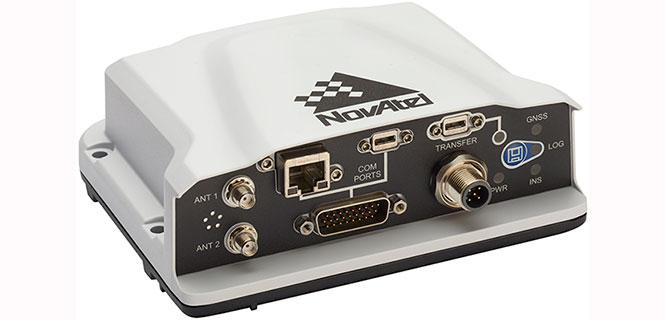
The PwrPak7D-E1 is a robust, high-precision receiver that has multi-frequency, dual-antenna inputs and provides GNSS multi-constellation heading and position data. These capabilities make the PwrPak7D-E1 suitable for ground vehicle, marine or aircraft-based systems. NovAtel’s Synchronous Position, Attitude and Navigation (SPAN) technology brings together GNSS positioning and inertial navigation to provide an exceptional 3D navigation solution that is stable and continuously available. The PwrPak7D-E1 has a powerful OEM7 GNSS engine, integrated Epson G320N micro electromechanical (MEMS) inertial measurement unit (IMU), built-in Wi-Fi and 16 GB of internal storage.
NovAtel has introduced several new precision positioning solutions for space-constrained applications. With enhanced positioning accuracy in a compact form, the PwrPak7D, PwrPak7DE1 and OEM7600 are suitable for automotive, airborne and other smaller unmanned systems.
PwrPak7D and PwrPak7D-E1 are dual-antenna, multi-frequency enclosures, and the OEM7600 receiver board, plus NovAtel’s new Waypoint Inertial Explorer Express post-processing software are being showcased this week at AUVSI Xponential 2018.
Dual-Antenna, Multi-Frequency Enclosures
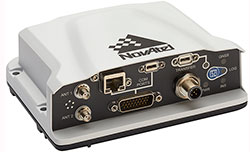
The new PwrPak7D enclosure. (Photo: NovAtel)
NovAtel’s new PwrPak7D and PwrPak7D-E1 enclosures provide space efficiency without sacrificing position accuracy and heading stability, even in stationary, slow-moving or hovering dynamics.
The PwrPak7D-E1 enclosure integrates an inertial measurement unit (IMU) with NovAtel’s OEM7720 dual-antenna receiver board to deliver GNSS and inertial navigation system (INS) capabilities.
When combined with NovAtel’s SPAN technology, positioning and attitude performance is optimized during extended GNSS outages.
Both the PwrPak7D and PwrPak7D-E1 include NovAtel’s Interference Toolkit with advanced interference detection
and mitigation features applicable to all stages of integration. A web user interface, accessible through Ethernet or
Wi-Fi, allows for quick and easy system configuration and control.
OEM7600 Receiver Board for Smaller Autonomous Systems
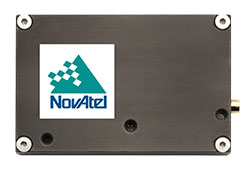
The OEM7600 receiver board. (Photo: NovAtel)
The OEM7600 receiver board features NovAtel’s high-performance positioning solutions in an extremely small form factor, wrapped with protective shielding to isolate emissions from surrounding electronics in confined spaces.
This new receiver integrates easily with NovAtel’s SPAN technology to optimize performance during extended GNSS outages.
The new OEM7600 will be commercially available this summer.
New Post-Processing Software for UAVs and Small Project Areas
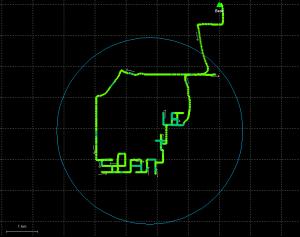
Inertial Explorer Xpress centroid circle. (Image: NovAtel)
Inertial Explorer Express provides the same core processing and utilities as the
Waypoint Inertial Explorer software for applications including unmanned aerial vehicles (UAVs) and smaller projects.
Inertial Explorer Express will produce centimeter-level position and attitude solutions compatible for lidar, camera and other sensor data with faster processing times and reduced complexity
“We are very excited to be introducing our new OEM7-based and Inertial Explorer solutions at Xponential 2018,” said Neil Gerein, director of product management at NovAtel. “These systems provide robust positioning and accuracy in a compact footprint for UAVs and smaller autonomous projects. An advanced range of software options, including NovAtel’s tightly coupled GNSS+Inertial SPAN technology and Interference Toolkit, provide assured positioning anywhere.”
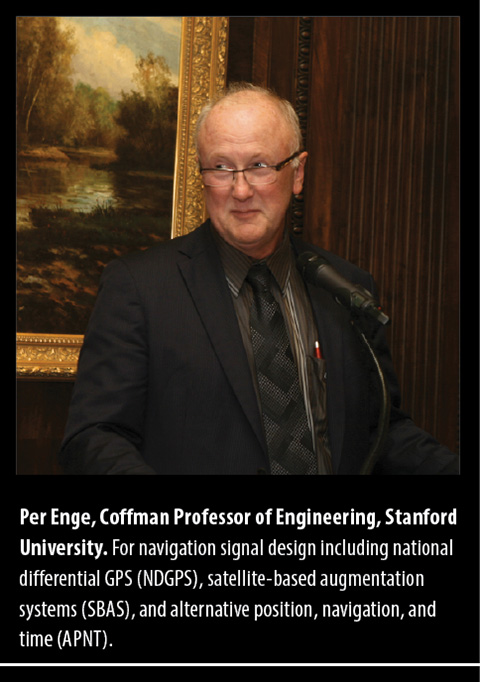
With great sadness we must report that Per Enge passed away on April 22, at home and surrounded by family. Per was a genial friend and colleague to many, and a pillar of the PNT community. He is greatly missed by all.
At the culmination of his long, fruitful career he served as the Vance and Arlene Coffman Professor of Engineering at Stanford University, where he also directed the Stanford Center for Position Navigation and Time.
For many years he conducted research funded by the Federal Aviation Administration, directed at safe and secure air navigation and leading to development of the Wide Area Augentation System (WAAS) and Local Area Augmentation Systems (LAAS). WAAS became fully operational for aviation in the United States in 2003 and is currently carried by more than 110,000 aircraft; similar systems have been deployed in Europe, Japan and India.
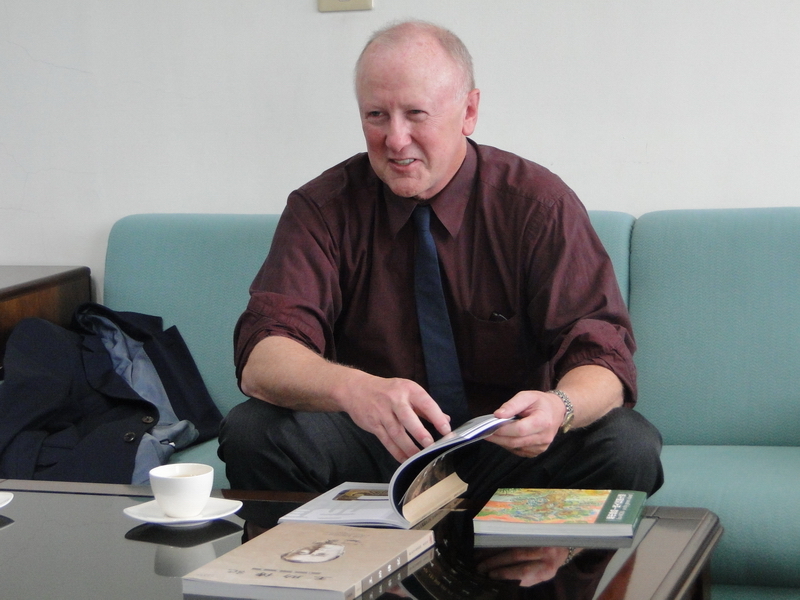
Per Enge at National Cheng Kung University (courtesy Shau Shiu Jan).
He received the Kepler Award from the Institute of Navigation in 2000 and was inducted into the GPS Hall of Fame by the U.S. Air Force in 2012. He served as a member of the Space-Based Position Navigation and Time Federal Advisory Committee since 2007. In 2013 he received the GNSS Leadership Award for Signals from this magazine, for signal design including national differential GPS, satellite-based augmentation systems, and alternative positioning, navigation and timing sources. He co-wrote Global Positioning System: Signals, Measurements, and Performance.
Always an educator, Per served as instructor, mentor and gentle encourager of many, many Ph.D. and other graduate-level students at Stanford who have gone on to distinguished careers of their own. In a lifetime marked by great achievements, this is perhaps his greatest and ultimately will be the most far-reaching.
Born in Norway and brought to the U.S. at age 2, he received a B.S.E.E. from the University of Massachusetts and M.S.E.E. and Ph.D. degrees from the University of Illinois.
Speaking at GPS World dinner, accepting Signals Leadership 2013 award. (Photo: GPS World file)
In remarks on accepting the GNSS Leadership Award for Signals, Per cited Faflick’s theorem, “that you will never ever work on any projects that are both interesting and important.” After calling out both GNSS and WAAS as exceptions to the theorem, he identified a third outlier: spoofing.
“Today’s e-security is based on three security factors: what we know (passwords), what we carry (key fob), and what we are (fingerprints, iris scan). And it is not enough. To meet this challenge, we need to rejuvenate the original security factor: location. In the past, transactions were secured by our presence. In the world of e-commerce, this factor has disappeared, and we must use GNSS to approximate this ancient and effective security factor.
“All of this will require the best effort of this precious community of ours.”
Further biographical details are available in an article published by the Stanford News. Among the tributes included there is this one by Brad Parkinson, who recruited Enge to Stanford in the early 1990s. “Anyone who works in GPS is aware of Per and his influence. He was just an intellectually talented person who could understand many scientific nuances and integrate them in ways others could not.”
Teaching the massive online open course.
The article also reminds us that he co-originated and co-taught, with Frank van Diggelen, a massive open online course to share GPS knowledge with a worldwide audience, far beyond Stanford’s walls. Titled “GPS: An Introduction to Satellite Navigation, with an interactive Worldwide Laboratory using Smartphones,” it enrolled 31,000 people from 192 countries. It is available here.
Per’s Stanford colleagues Sherman Lo, Todd Walter and Sam Pullen assisted GPS World with this article and provided these photos from personal archives. The Stanford group is working on setting up a scholarship in Per’s name. More information on it and how to support it will be on the SCPNT website once it becomes available.
Frank van Diggelen has sent further photos, below.
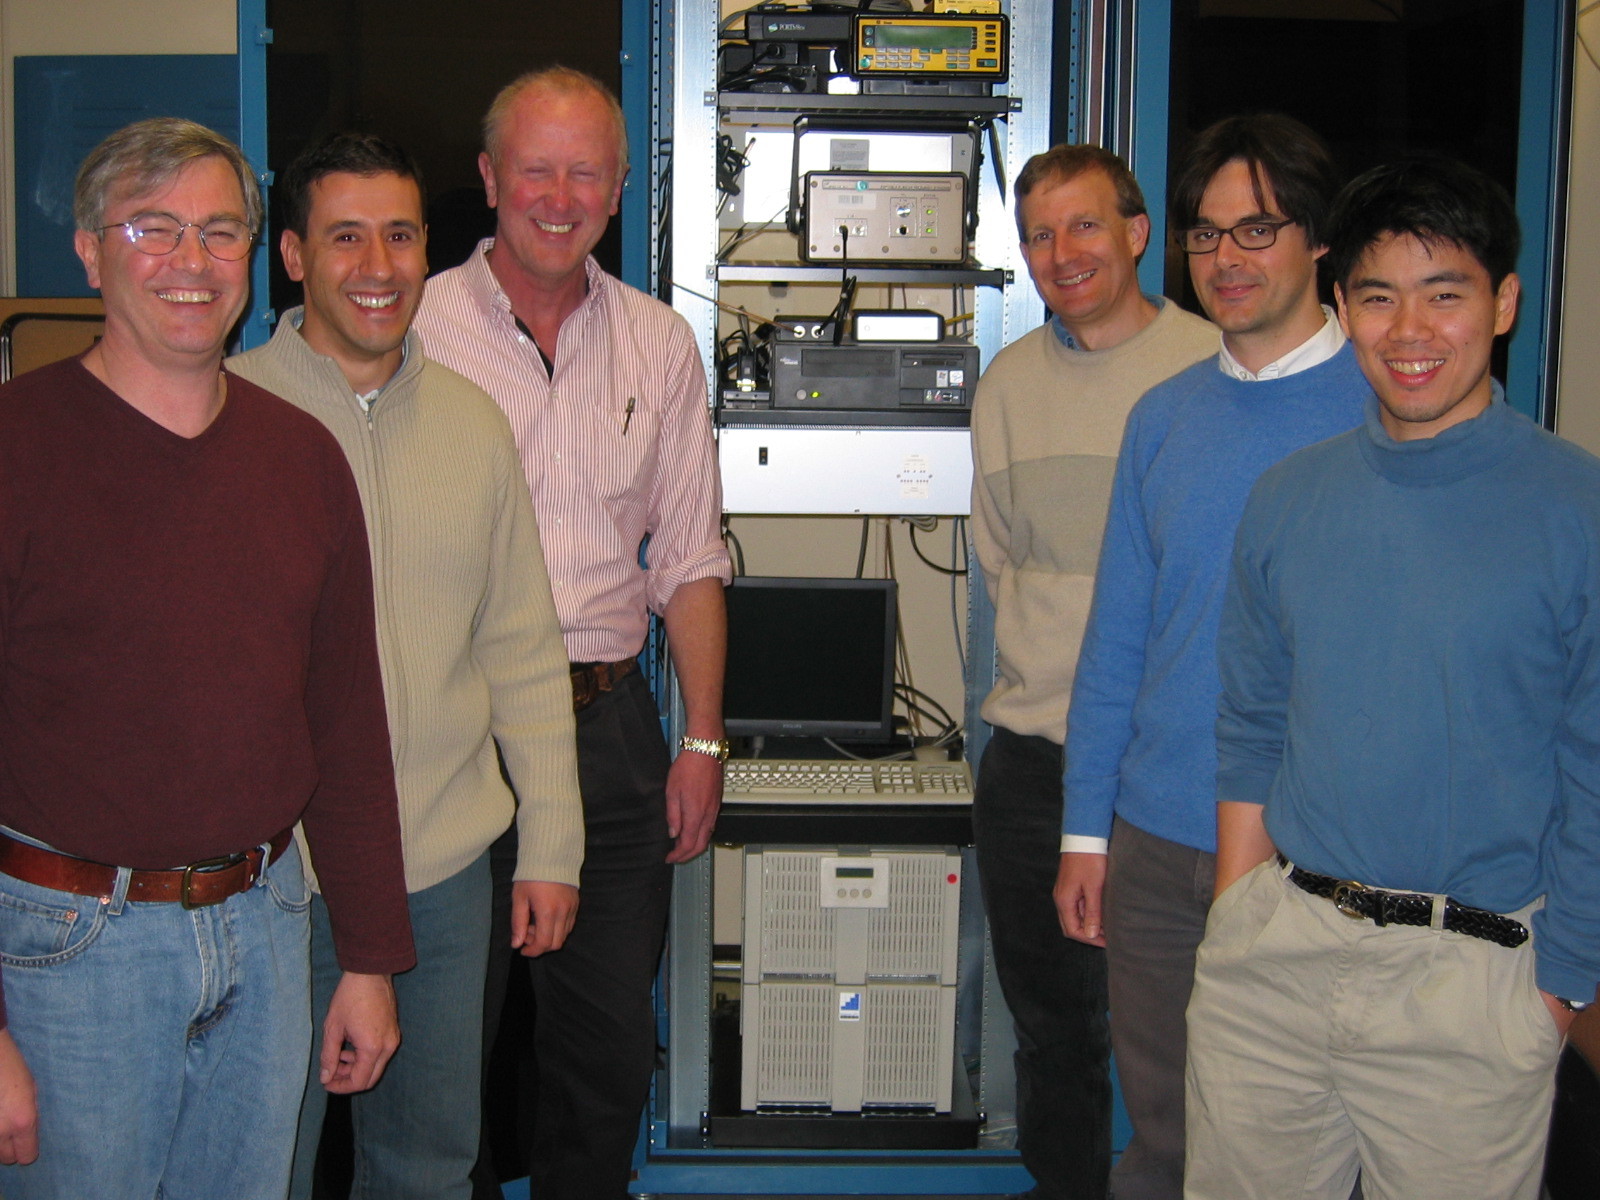
At the Stanford GPS Lab with colleagues from Stanford and DLR (German aerospace agency).
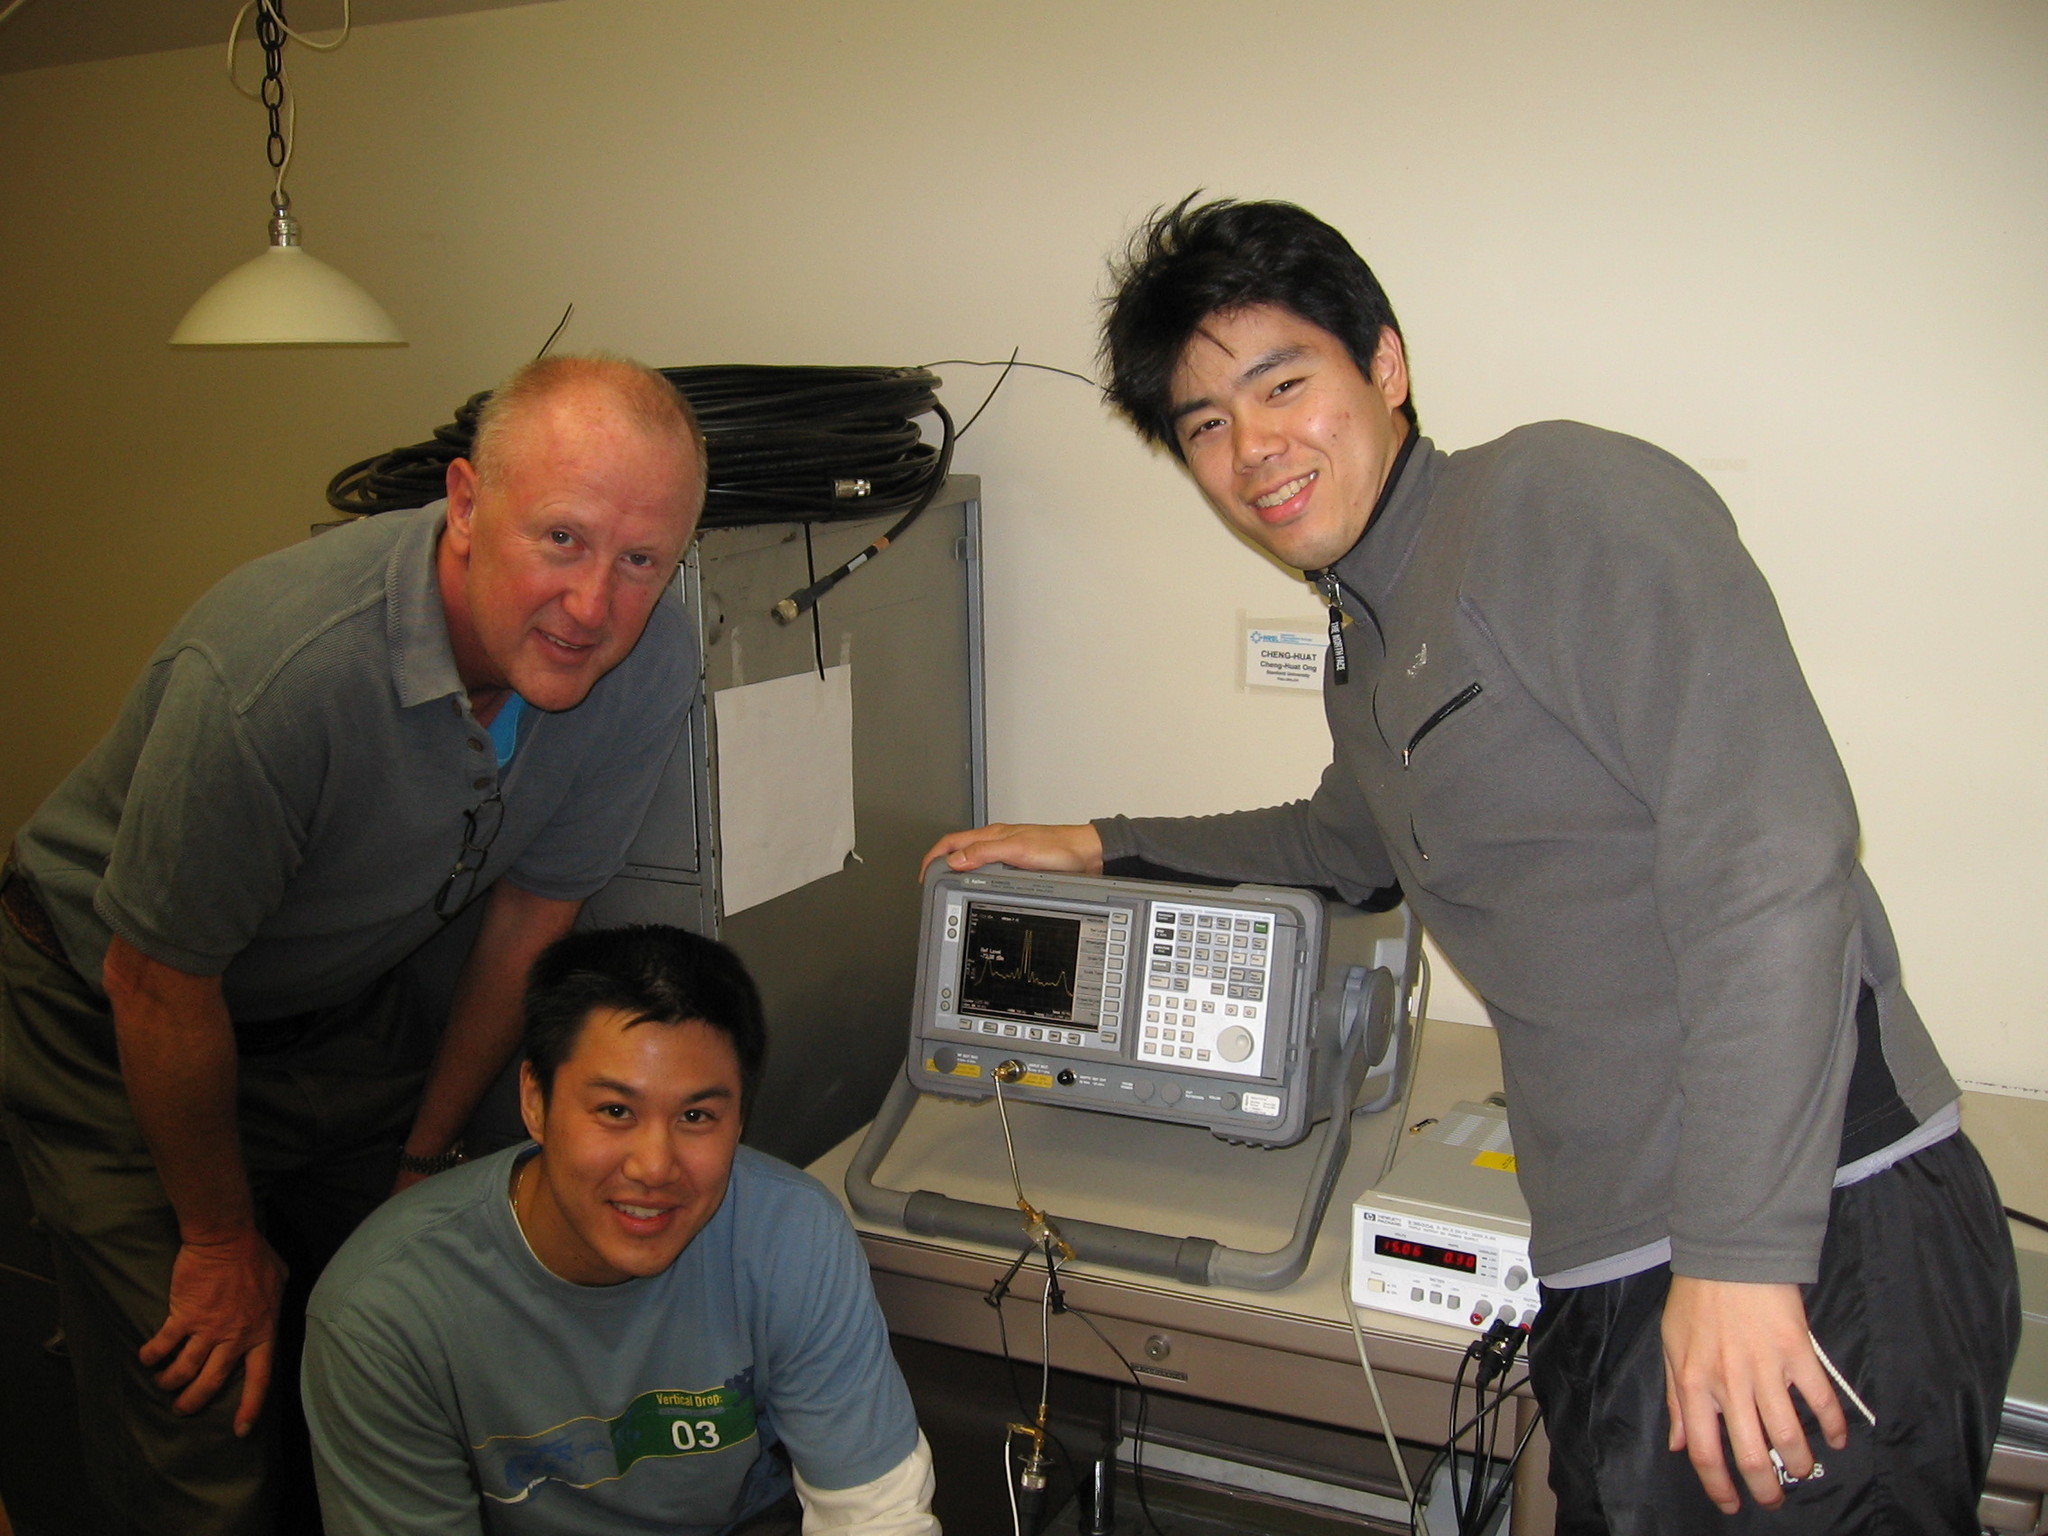
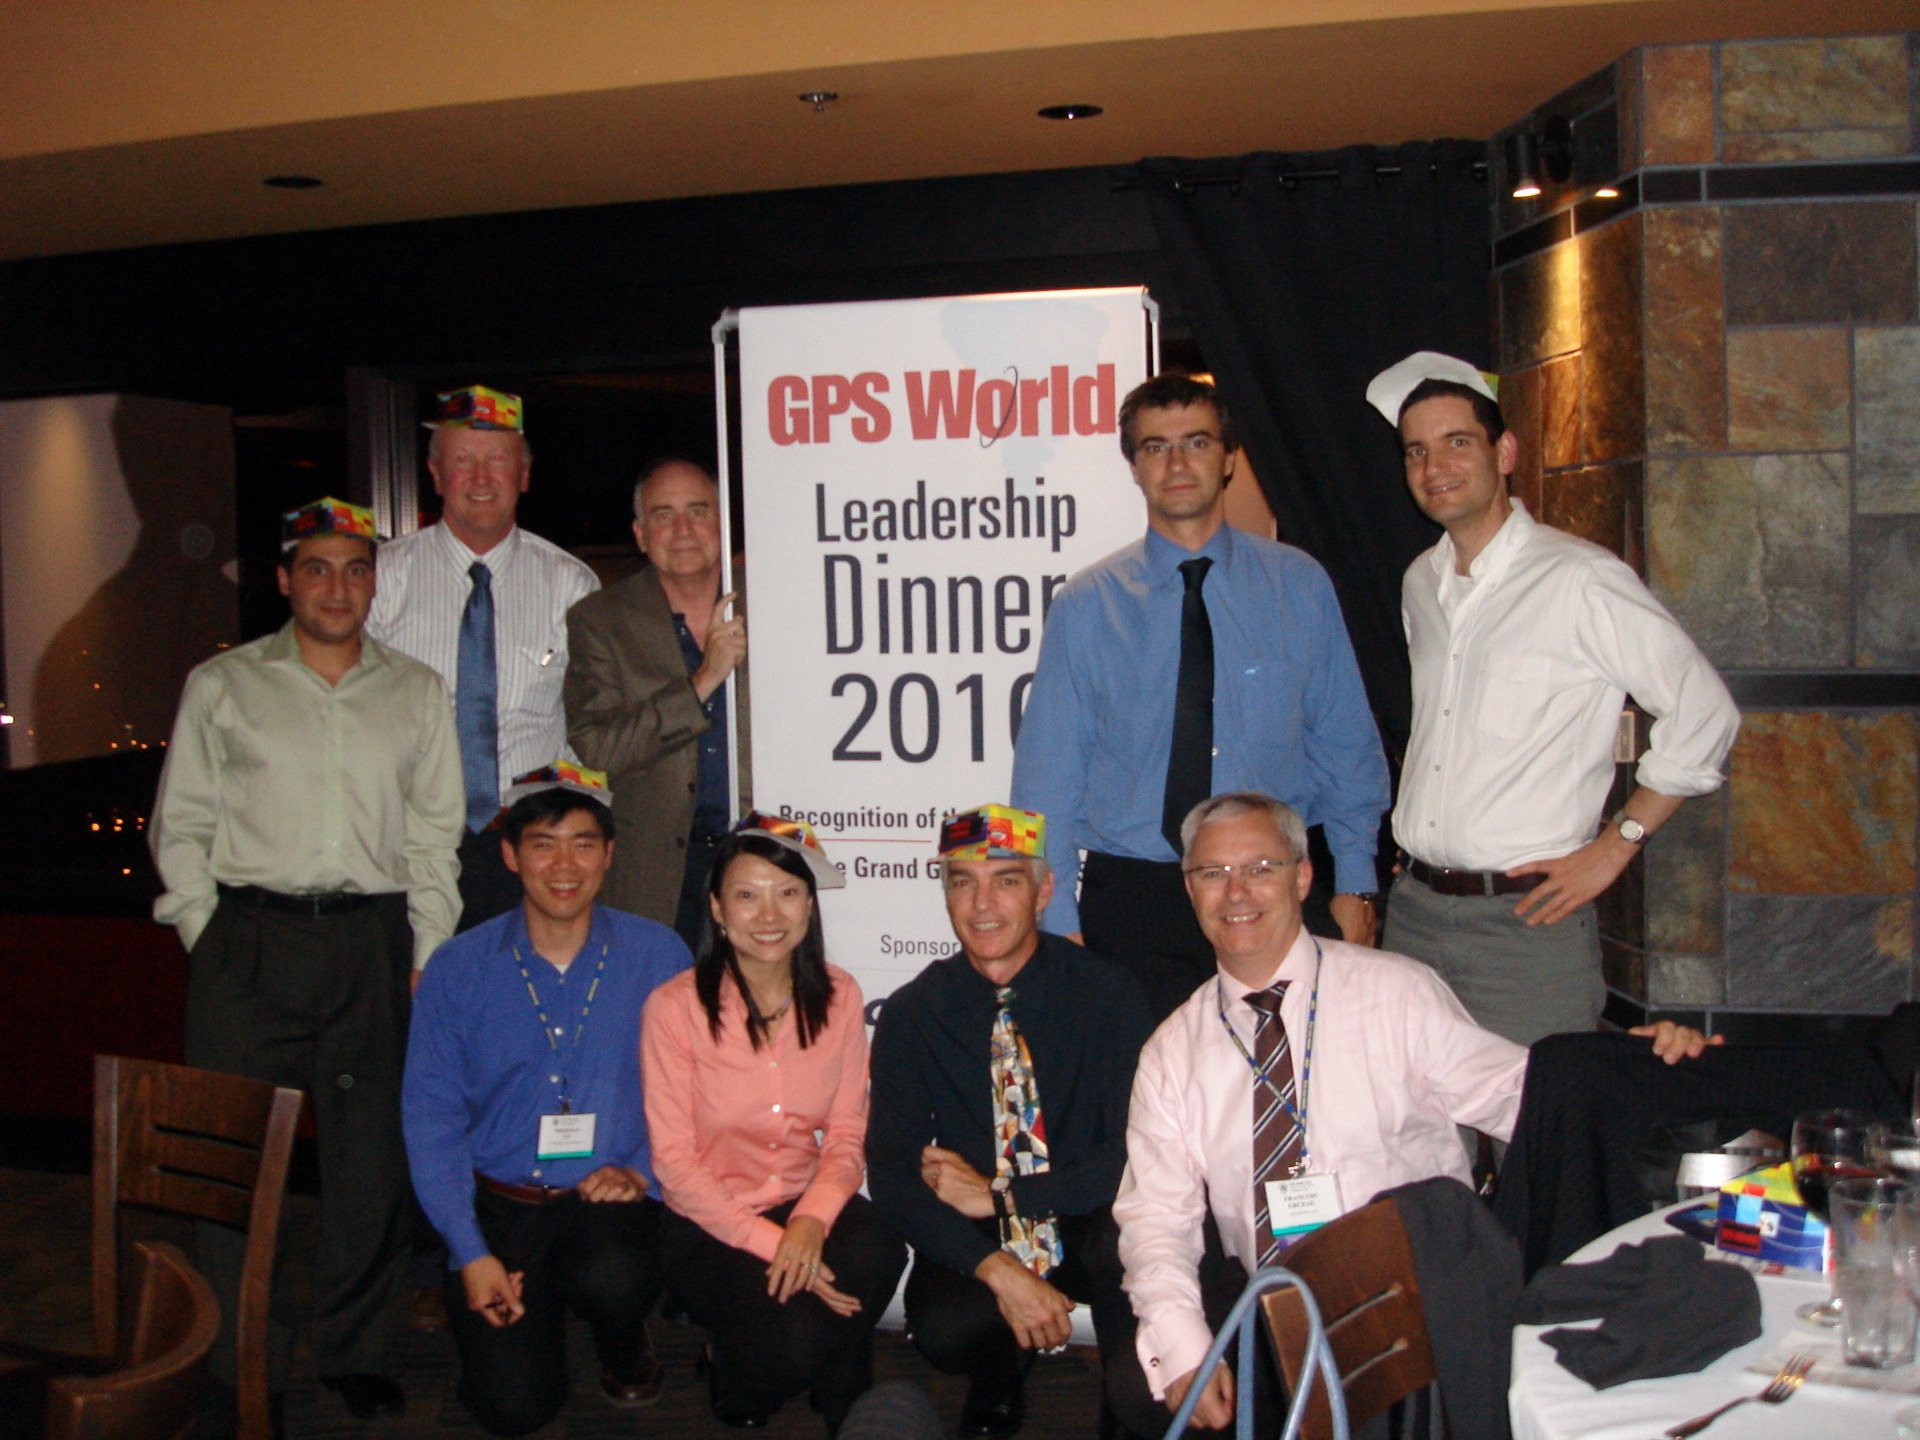
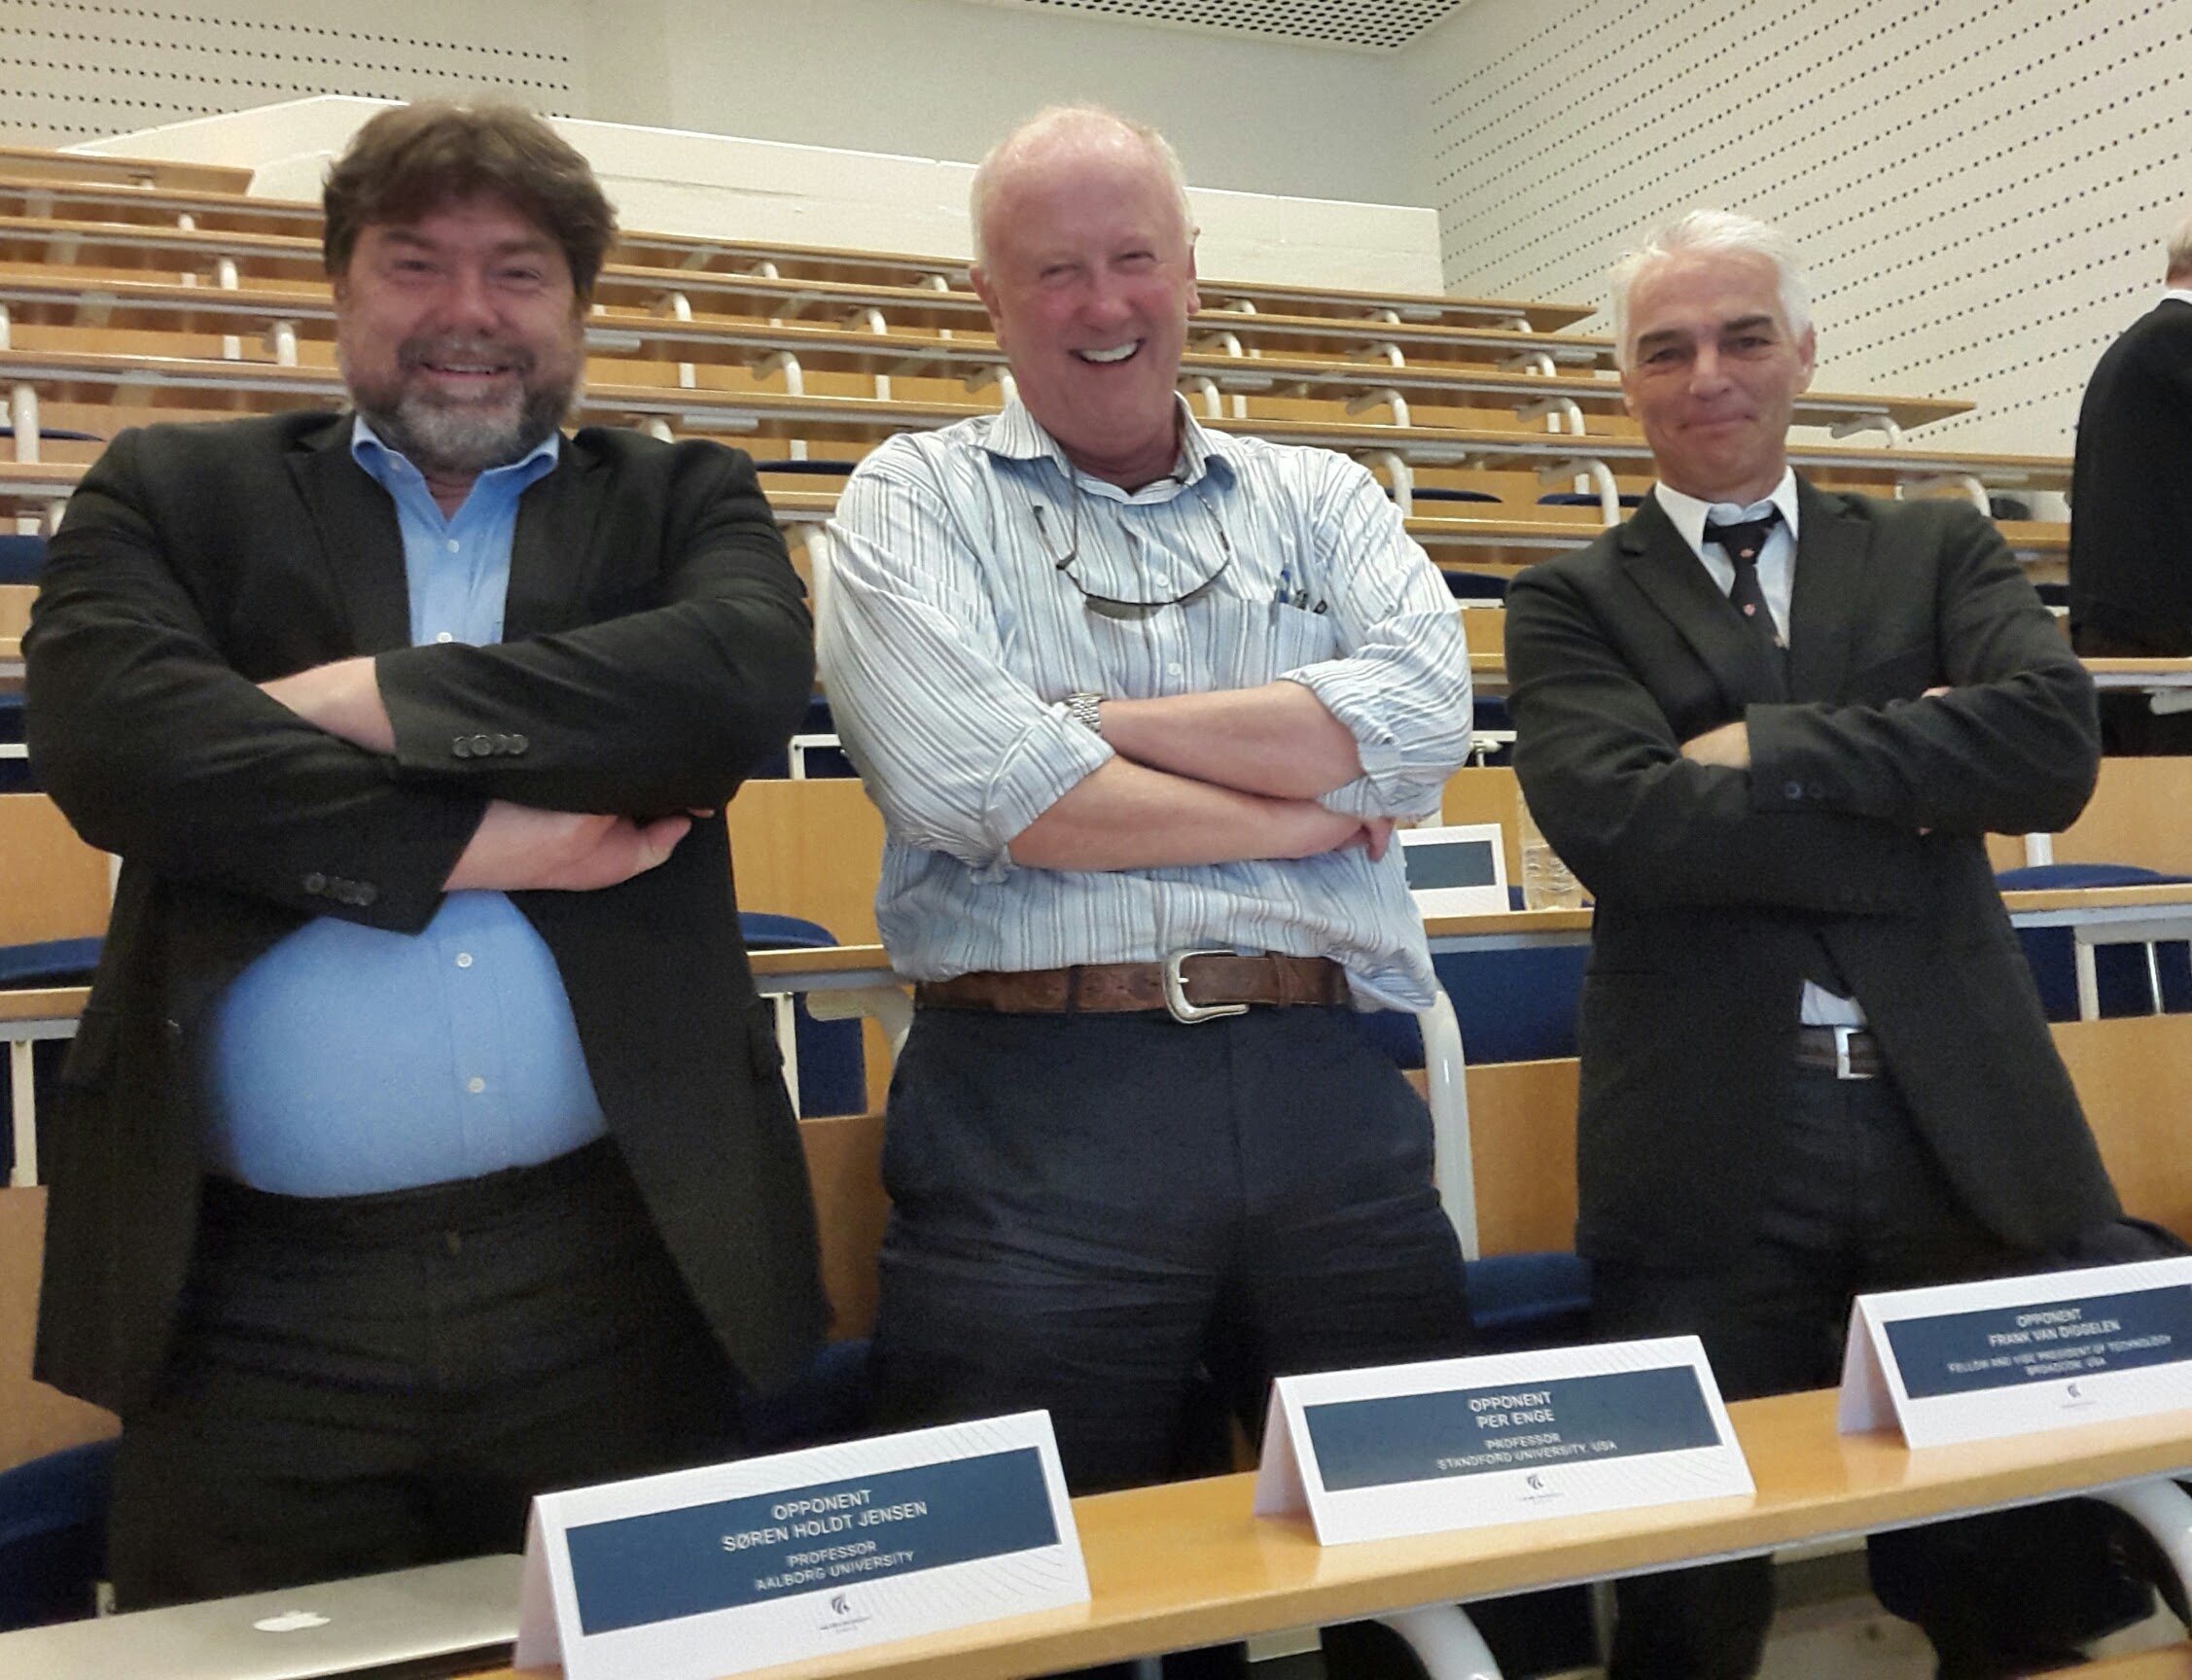
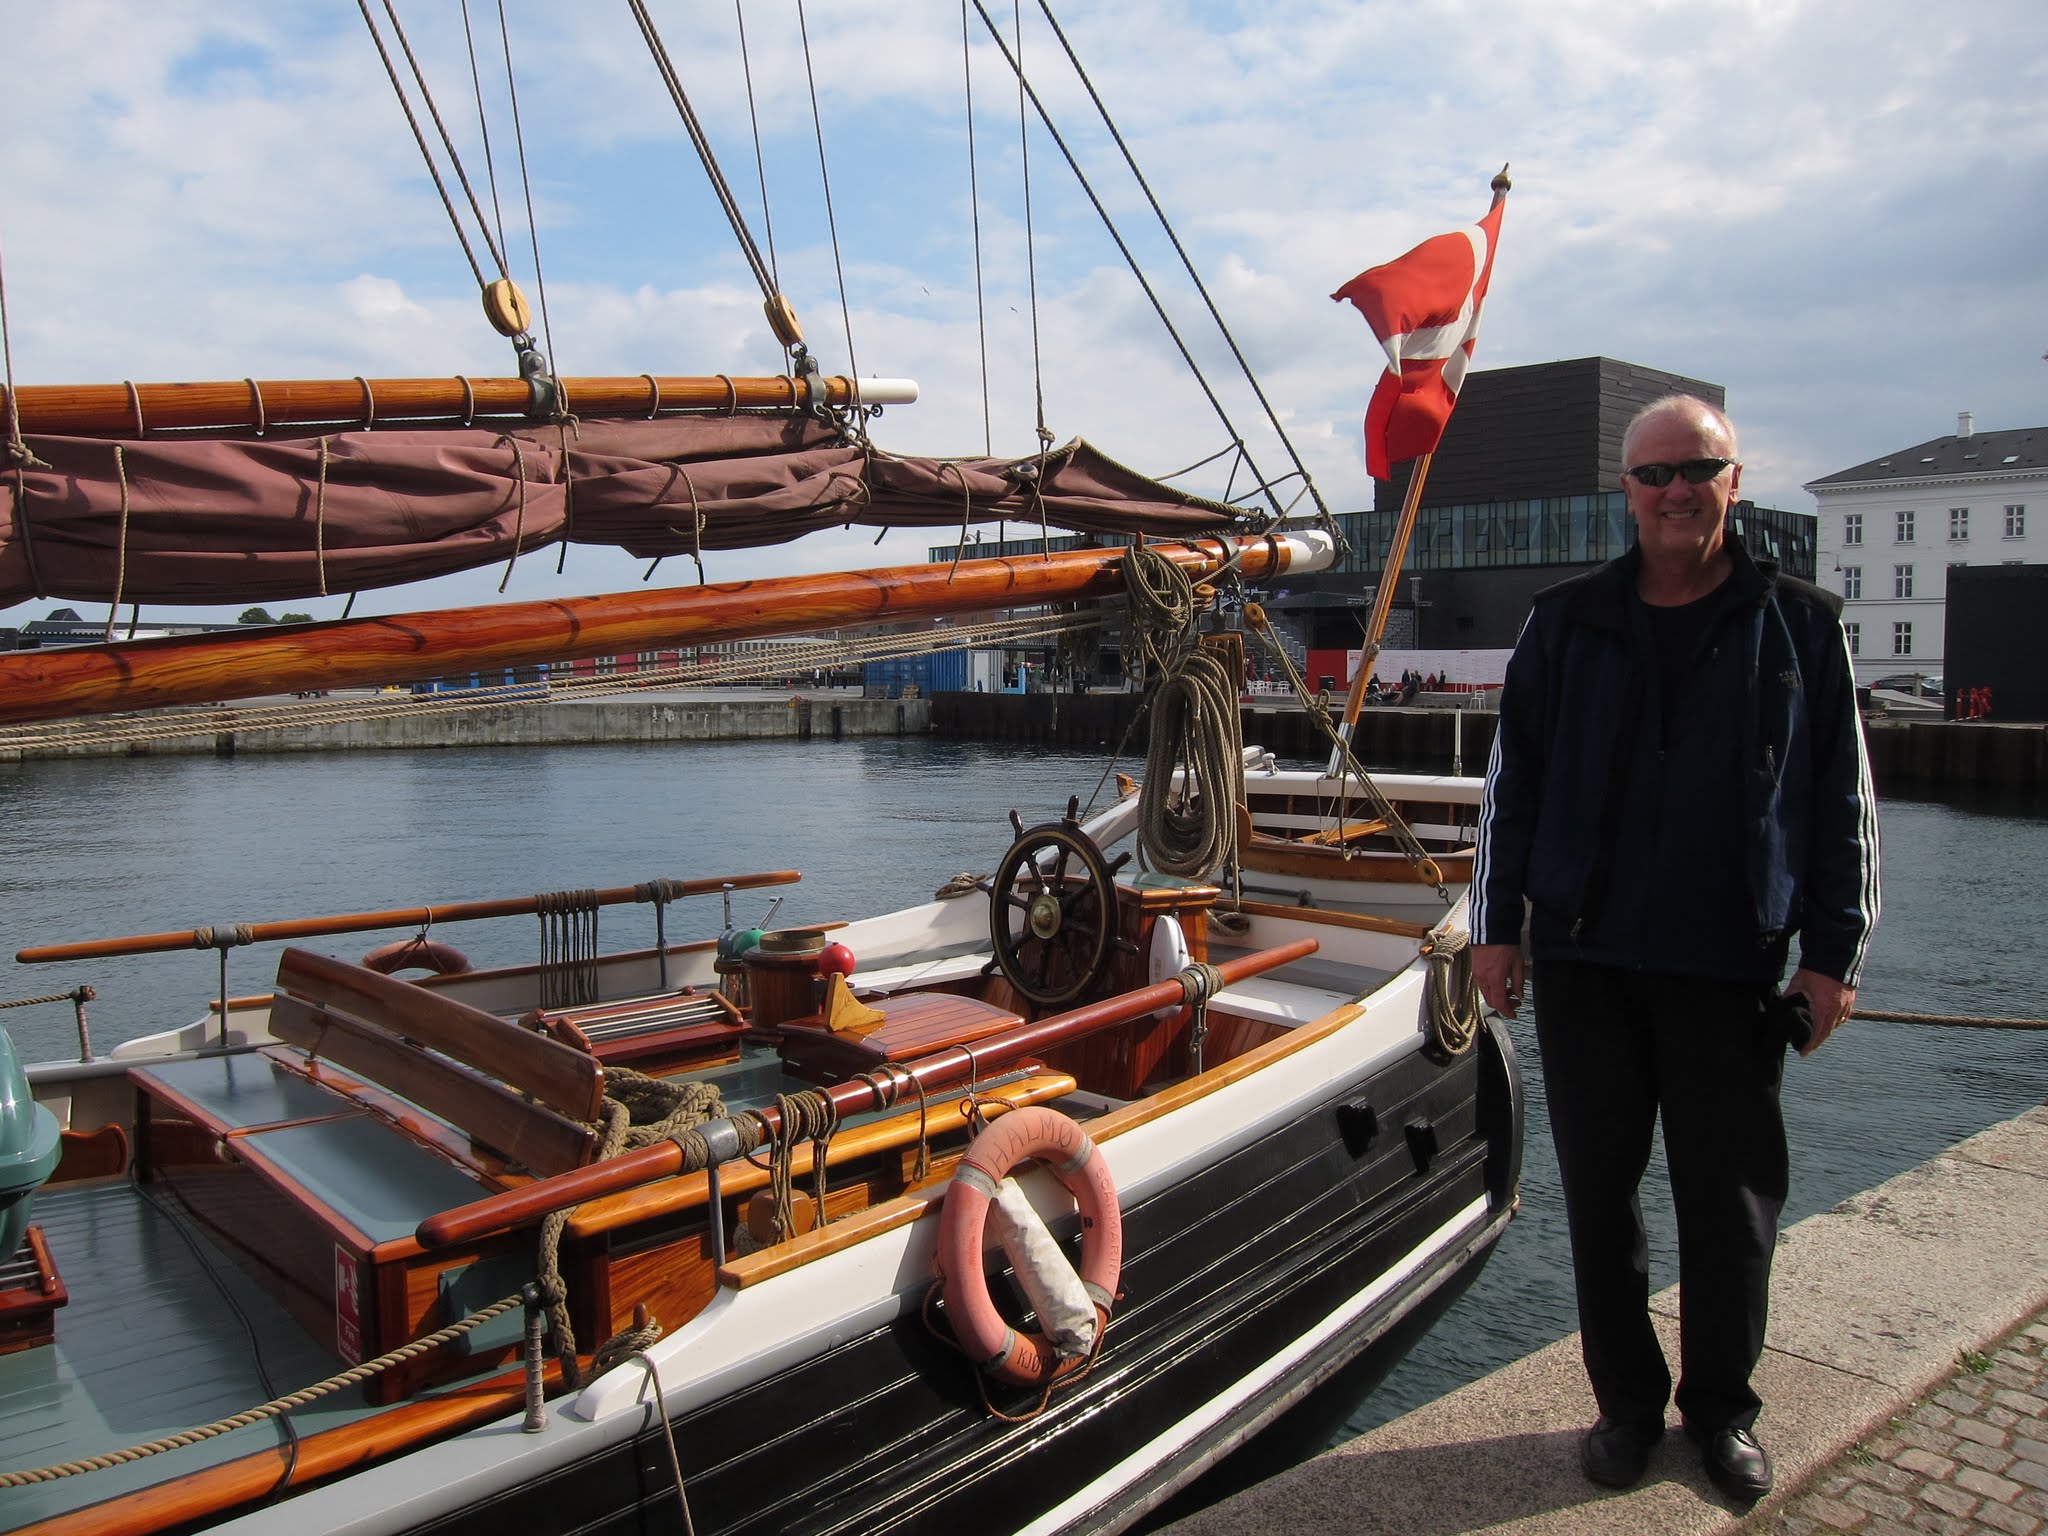
Dinner discussions with US-EU bilateral group.With Alan Chen, Sherman Lo and an early spectrum image of GIOVE-A (or Galileo).Visiting Neuschwanstein Castle in Bavaria after 2005 European Navigation Conference.At the Stanford Center Position, Navigation and Time, which he co-founded in 2005.Team China Consumers at GPS World dinner 2010. The winning team in the Grand Game of GNSS.Fierce “opponents” (examiners) for Ph.D. defense of Ignacio Fernández Hernández of EC/Galileo. Aalborg University, Denmark.Prepared to come aboard in Kobenhavn.The co-authors of Global Positioning System: Signals, Measurements, and Performance (with Pratap Misra).
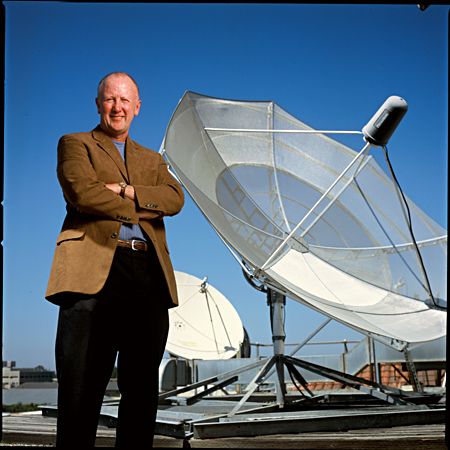
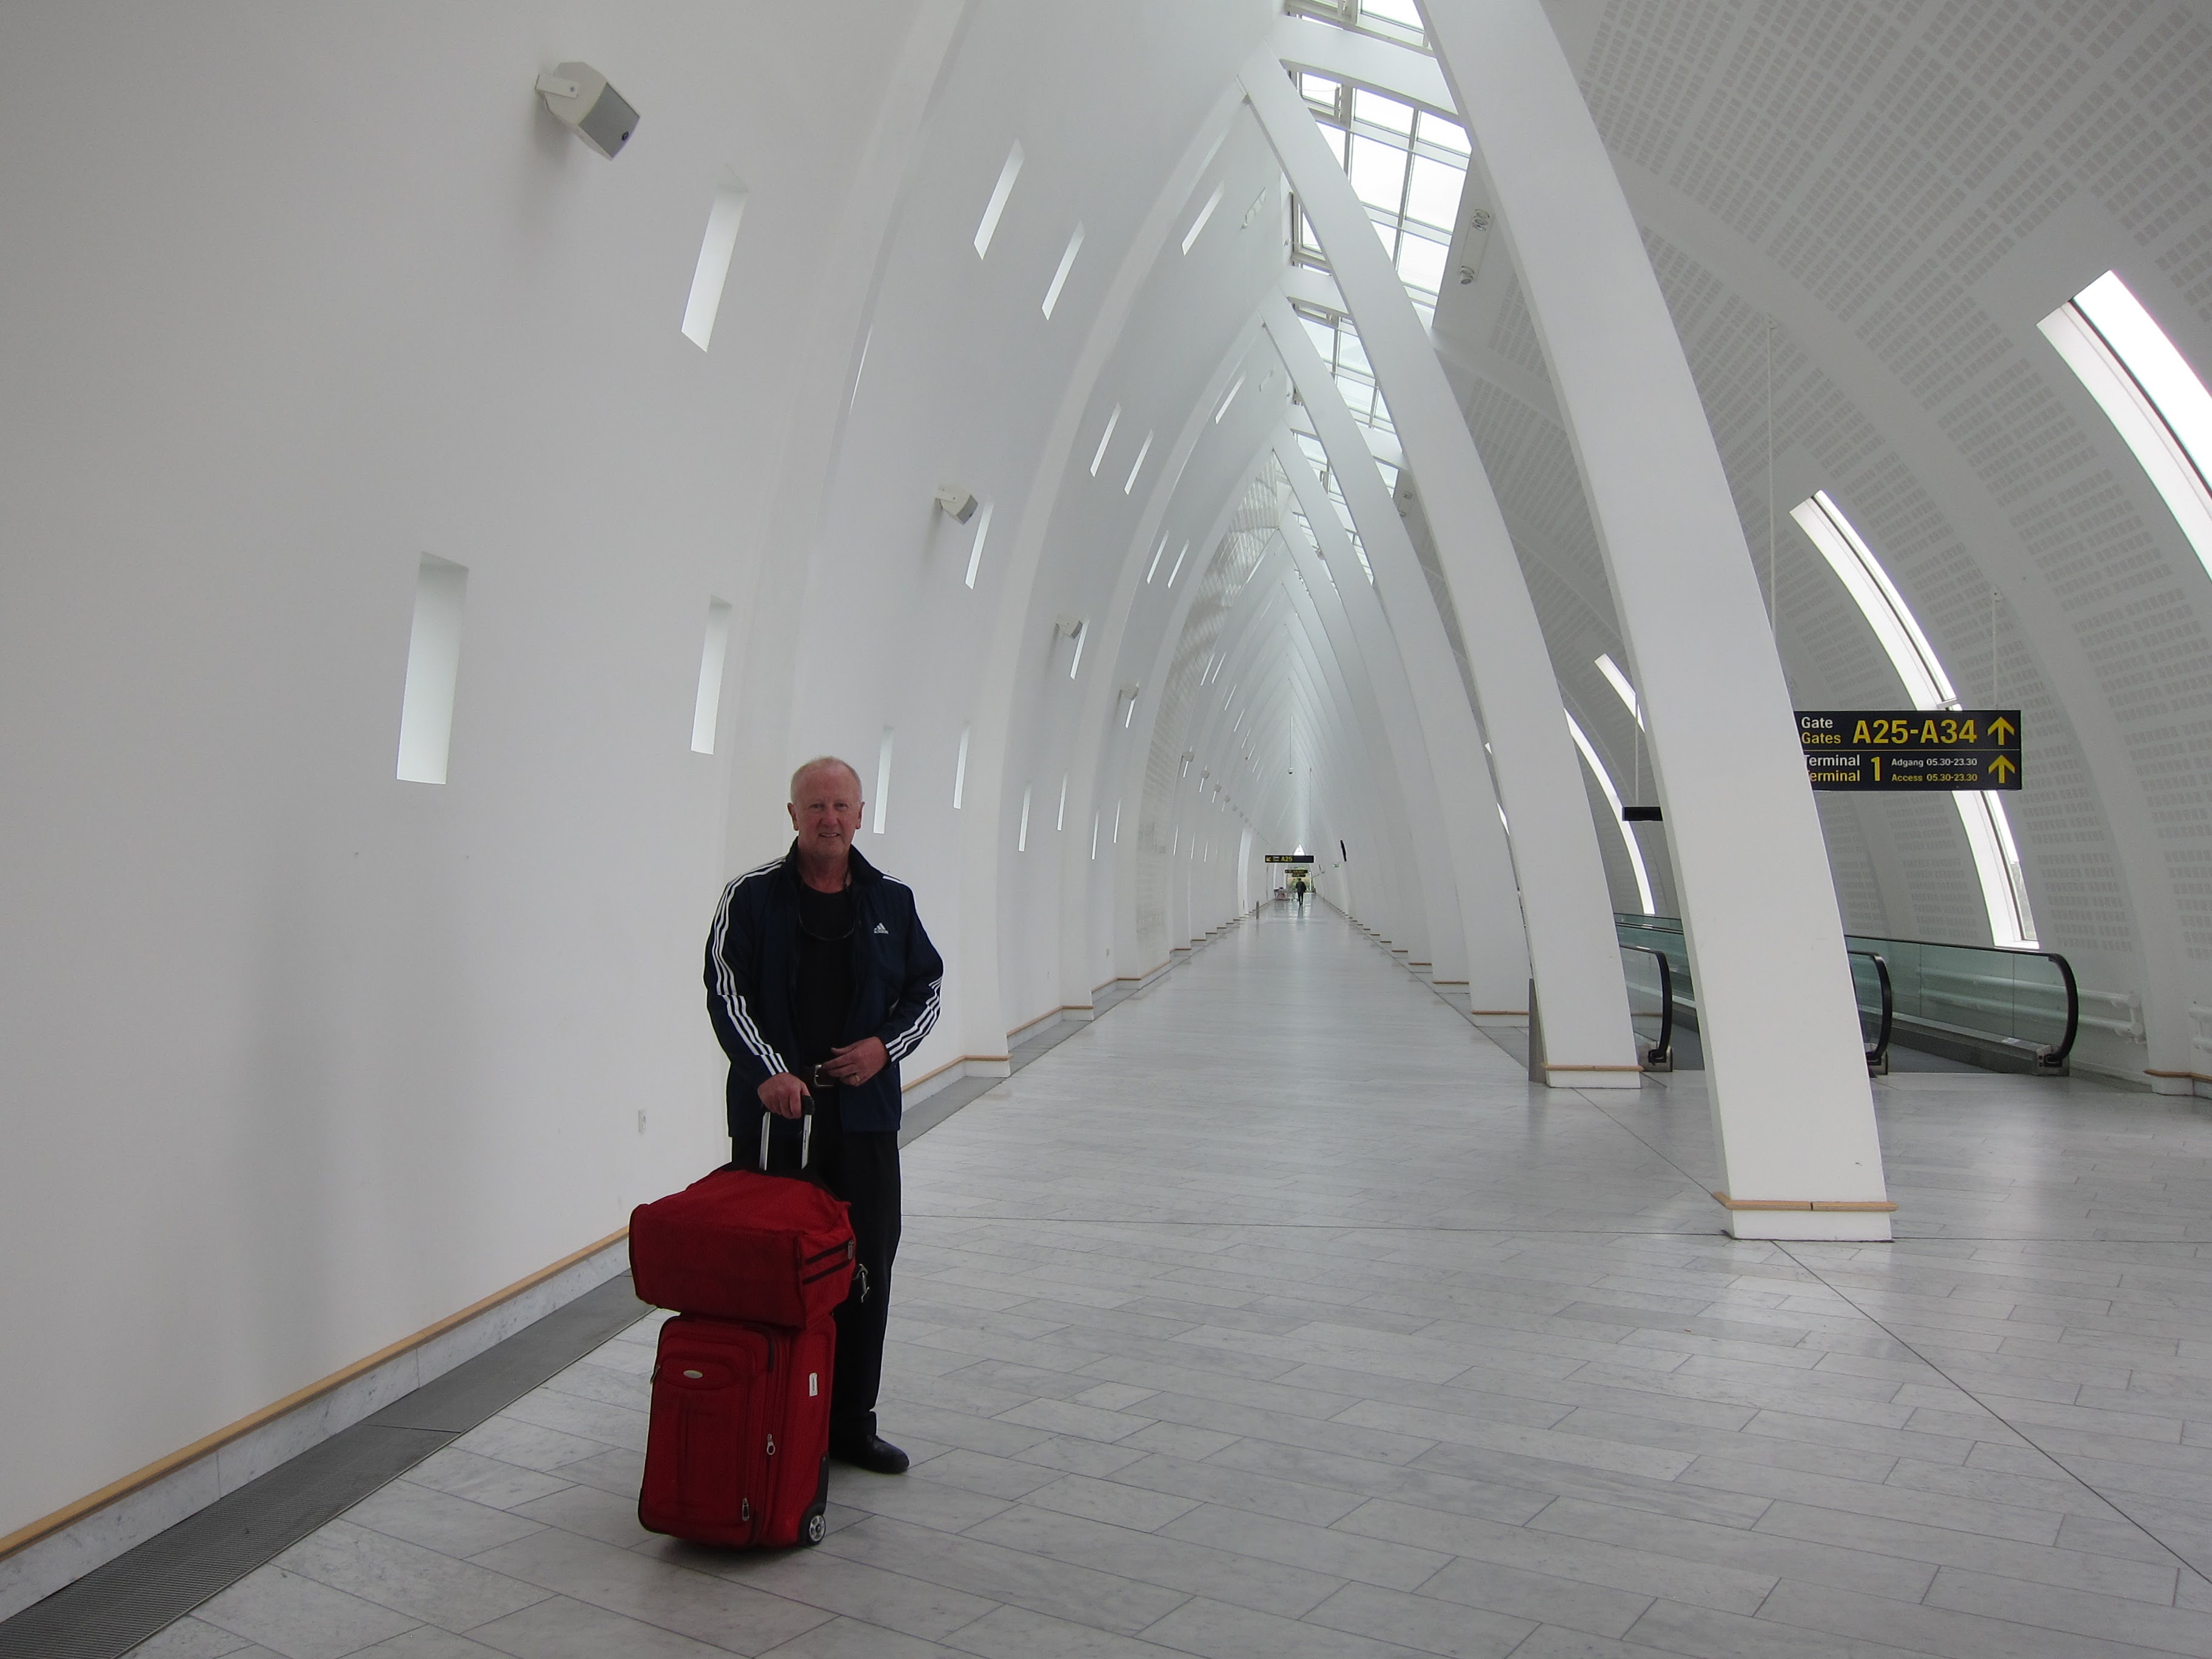
A road warrior for GNSS.
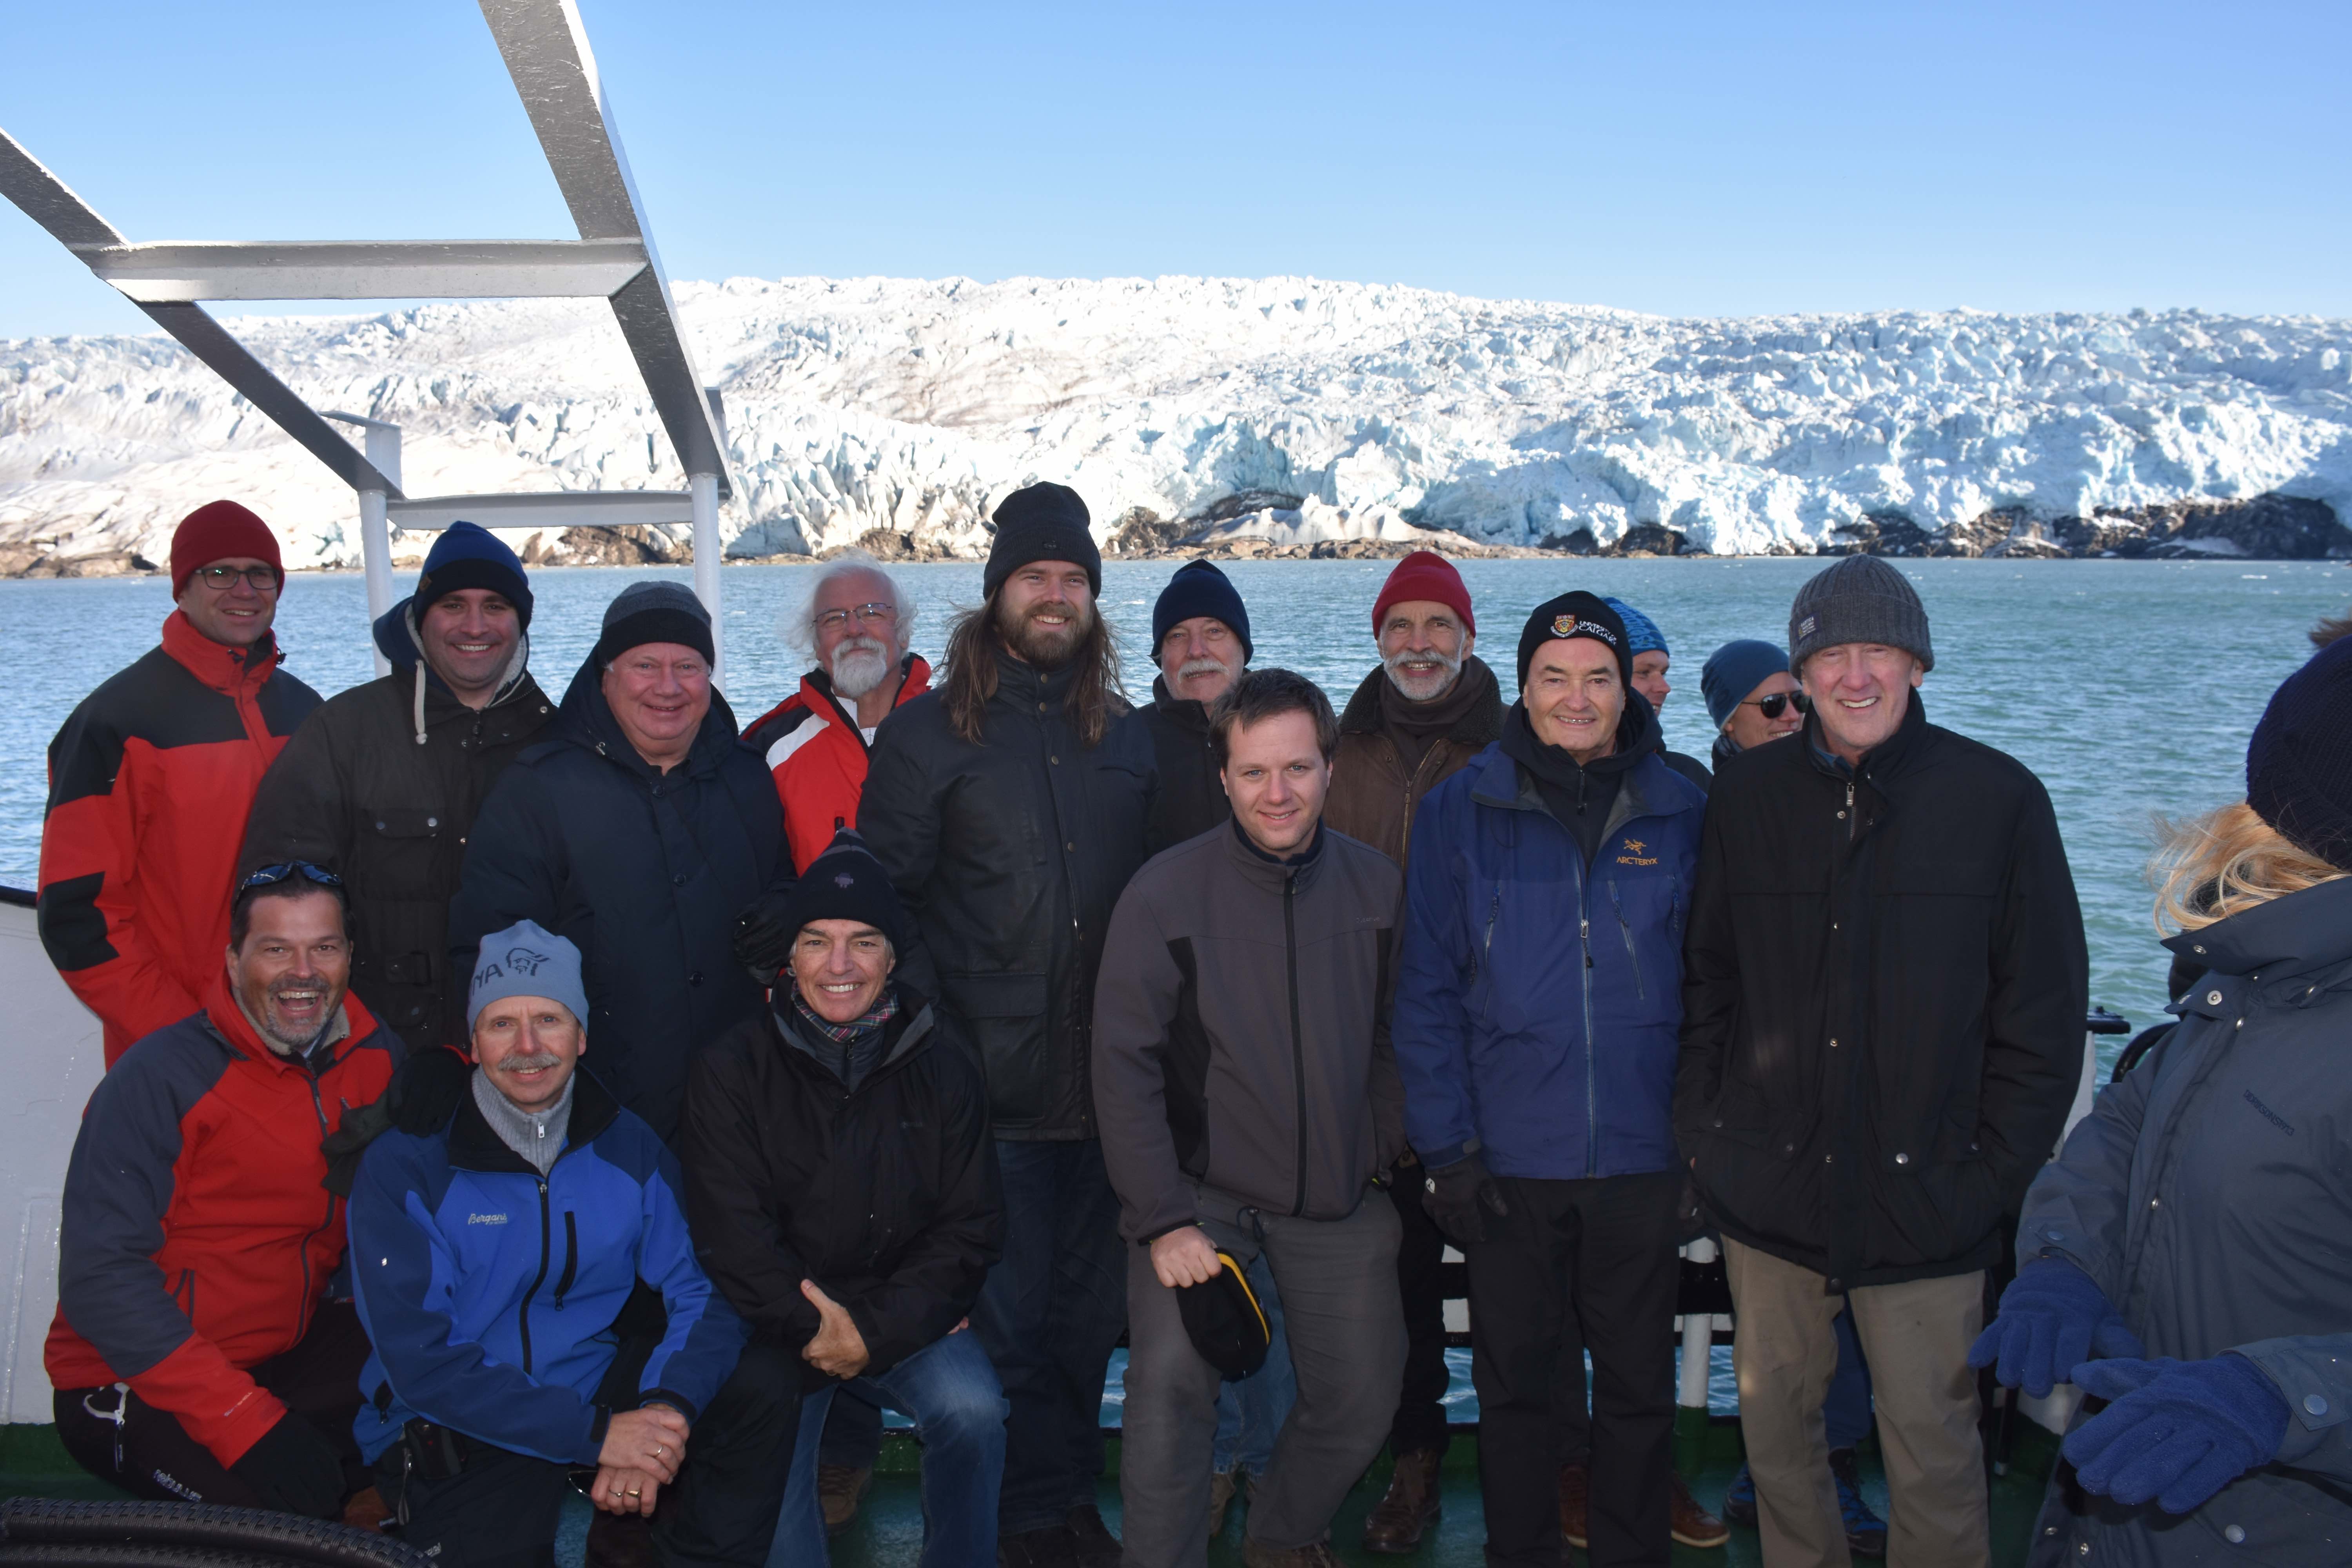
Faculty of the GNSS Summer School at Svalbard, Norway (Arctic Ocean, 78.7° N).
The ninth Workshop on Satellite Navigation Technologies, NAVITEC 2018, will be held Dec. 5-7 at the European Space Research and Technology Centre (ESTEC) in Noordwijk, the Netherlands.
The workshop, themed “Golden opportunities for PNT,” is organized by the Radio Navigation Systems Implementation & Verification Section of the Directorate of Technical and Quality Management, European Space Agency (ESA).
NAVITEC 2018 will include the GNSS Signals and Signal Processing Workshop in coordination with CNES, DLR and the University of the Federal Armed Forces Munich.
The aim of the workshop is to provide an open forum to space and terrestrial satellite navigation technology designers, developers, integrators, users, universities and agency representatives.
“We are now seeing an explosion of new applications using position and time,” stated an ESA event announcement. “People expect PNT to be available always and everywhere. Solutions require reliable service outdoors and indoors, high-accuracy and able to survive in challenging environments with new security threats. All this at ever lower prices. These solutions require innovative technologies such as integration with other sensors, cloud processing, low power technologies, all with the latest security measures.”
Participants will have the opportunity to share their technical expertise and experiences by formal presentations, informal discussions and round tables. The workshop will provide an overview of satellite navigation technologies that are available, or being developed, especially in the frame of current research and development programmes.
Scope and topics of interest
The scope of the workshop will include navigation equipment and techniques: receivers, payloads, signals, navigation algorithms, signal processing techniques and applications of GNSS (terrestrial and space).
A call for papers will be issued soon. The papers should describe new equipment developments and systems concepts, innovative technologies and designs, testing/validation procedures, linked to the topics that are listed below.
Mass-market GNSS/Galileo results
GNSS in IoT (low-power & snapshot processing)
Positioning and Timing for 5G
Cloud and collaborative positioning techniques and applications
Precise Positioning in challenging environments
Augmentation services
Interference, Spoofing and Authentication and Cyber Security
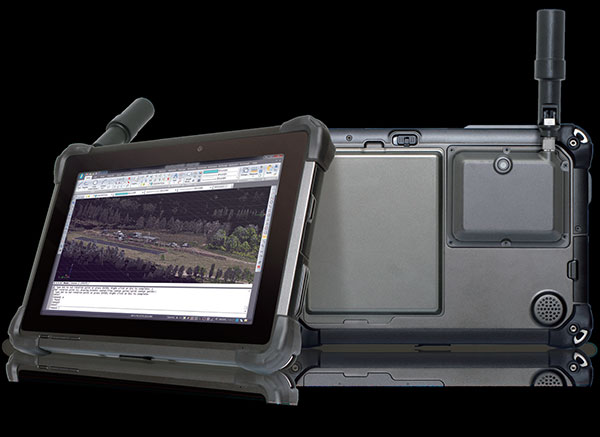
DT Research has released the DT301T rugged RTK tablet (DT301T-RTK), a lightweight military-grade tablet purpose-built for GIS mapping applications. It features real-time kinematic (RTK) satellite navigation to enhance the precision of GNSS position data.
The tablet enables 3D point cloud creation with centimeter-level accuracy, meeting the high standards required for scientific-grade evidence in court.
The DT301T-RTK is a rugged tablet with scientific-grade GNSS. (Photo: DT Research)
The DT301T Rugged RTK tablet is military-grade with an IP65 rating. Because it’s lightweight, the DT301T can be used in the field, office and vehicles, the company said.
A dual-frequency GNSS module is built into the tablet, which uses real-time reference points within 1–2-centimeter accuracy to position 3D point clouds created from aerial photogrammetry, using GPS, GLONASS and Galileo receivers. Users can measure with the RTK GNSS positioning directly using a foldable antenna or connect to an external antenna for more robust receiving and survey-grade precision.
“We’ve seen a dramatic uptick in the need for rugged tablets to be purpose-built for a range of mapping uses across industries,” said Daw Tsai Sc.D., president of DT Research. “In designing the DT301T with RTK satellite navigation, we also took into consideration the other features and capabilities necessary within a rugged tablet to quickly and easily conduct forensic mapping, land surveying, e-construction, building information modeling (BIM) and other mapping scenarios.”
The DT301T is compatible with existing GIS software for mapping applications and brings together the advanced workflow for GIS data capture, accurate positioning and data transmitting.
Uses
According to DT Research, the tablet can be used in a variety of scenarios.
Forensic mapping. Public safety teams, investigators and crash reconstructionists can use the DT301T Rugged RTK tablet to accurately collect measurements that are scientifically defensible by using the real-time centimeter reference points to position 3D point clouds created from aerial photogrammetry or take stand-alone measurements.
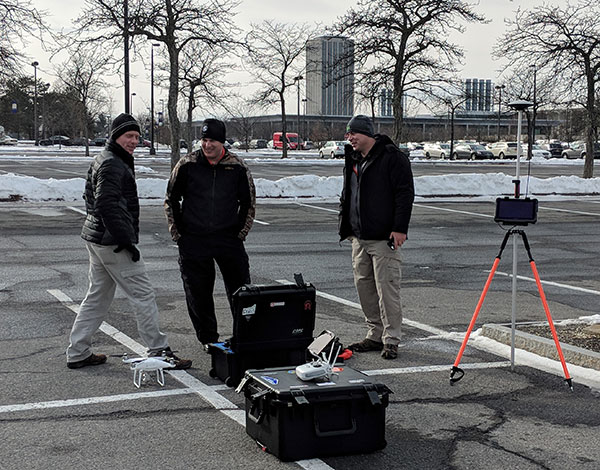
DT301T-RTK tablet during forensic mapping training. (Photo: DT Research)
The results will have the precision necessary to stand up as evidence in court, said Andrew S. Klane, a former Massachusetts State Police Lieutenant who teaches Forensic Mapping and is now the chief operating officer at Forensic Mapping Solutions Inc.
“As more drones are being used for mapping, there is a growing need for ground-control positioning devices,” Klane said. “By using a DT301T Rugged RTK Tablet in combination with a drone, users can more quickly and cost-effectively create a 3D model to deliver an accurate representation of the scene with scientific-grade tolerance that will hold up in a court of law.”
It could also help clear crash scenes faster, restoring the normal flow of traffic on congested roadways, reducing secondary crashes and lowering the chance of first responders and other workers getting hurt while clearing the scene.
Land surveying. Surveyors can use the DT301T tablet to measure the altitudes, angles and distances on the land surface so that they can be accurately plotted on a map to determine property boundaries, construction layout and mapmaking.
E-construction. Construction workers can manage the collection, review, approval and distribution of highway construction contract documents in a paperless environment using the DT301 tablet.
Building information modeling (BIM). Architecture, engineering, and construction (AEC) professionals can use the tablet to create 3D models to efficiently plan, design, construct and manage buildings and infrastructure.
FEATURES
The DT301T Rugged RTK tablet has been purpose-built for precision mapping in a variety of environments and includes the following features and capabilities:
Dual-frequency GNSS module: GNSS L1 and L2 RTK that receives GPS, GLONASS and Galileo signals up to 372 channels with RMS 10 mm + 1 ppm accuracy.
High-performance CPU and Windows OS: Intel 6th-generation core i5 or i7 processor with Microsoft Windows 7 Professional or Windows 10 IoT Enterprise. Units come with either 8 GB or 16 GB of RAM.
Sunlight-readable display: A 10.1 inch LED-backlight, sunlight-readable screen with capacitive touch and 1920 x 1200 resolution.
Wireless connectivity: Long-range Class 1 Bluetooth powers connectivity up to 1,000 feet and 4G mobile broadband for LTE, HESPA+, GMS/GPRS/EDGE, EV-DO, Rev A and 1xRTT.
Storage: For field data collecting, the tablet can store up to 1 terabyte of data.
Military standards: The tablet is fully ruggedized to meet the highest durability standards with an IP65 rating, MIL-STD-810G for vibration and shock resistance, and MIL-STD-461F for EMI and EMC tolerance.
Battery pack: High-capacity hot-swappable battery pack delivers 60 or 90 watts for up to 15 hours of continuous mobile communications.
Accessories: Those available include external antennas, pole mount cradles, detachable keyboards, battery charging kits and digital pens.
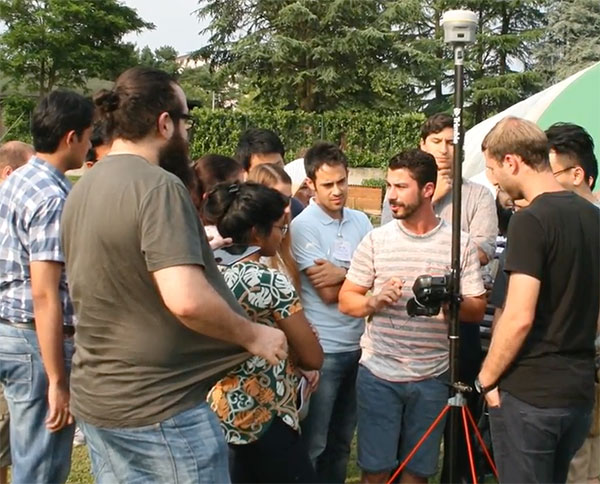
By Simon Batzdorfer, Markus Bobbe, Martin Becker and Ulf Bestmann, Technische Universitaet Braunschweig
All images courtesy of the authors.
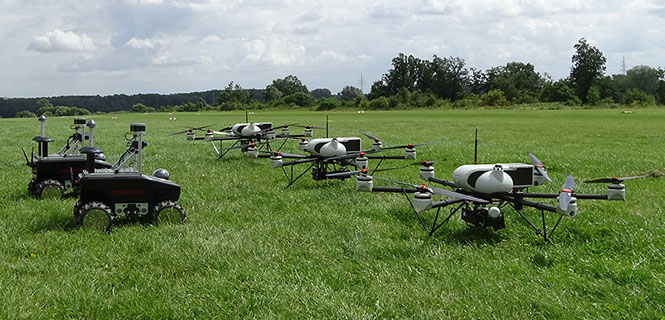
Autonomous vehicles equipped with different environmental sensors, such as optical or thermal camera or a lidar, performed a team survey controlled by a central ground station. The ground station serves as a user interface to define missions and tasks and also to visualize exploration task results online. 2D stitched orthophoto or lidar point clouds are transmitted for display and processing into 3D photogrammetry. Georeferencing data is gathered by an integrated GNSS/IMU positioning system.
In disaster scenarios such as fires, floods or search-and-rescue tasks, good situational awareness is indispensable for responders coping with a complex and often chaotic environment. In most cases, a prior known map data are outdated, and an efficient situational proceeding such as path planning or creation of a search pattern cannot be performed. This information can often only be gathered by manned exploration using ground or airborne systems, with limits on availability.
The research project Automated Navigation and Communication for Exploration (ANKommEn) seeks to create an automated unmanned system to close this gap by providing up-to-date scenario information while increasing the safety of human resources, using unmanned aerial (UAV) and ground-based (UGV) vehicles.
To provide up-to-date information of the desired destination area, all vehicles are equipped with identical positioning and communication hardware complemented by diverse sensors (RGB camera, infrared [IR] camera, lidar) for visual exploration. The visual sensor information is transmitted to a central ground station for visualization and/or analysis. To increase the advantages of the system, the unmanned systems should have a high grade of automation to reduce the workload of the operator so that only basic inputs have to be done by the operator. For example, just by marking a destination area and choosing a predefined task, the mission will be planned automatically, and after the corresponding waypoint-list has been transmitted to the vehicles, the mission will start.
Automated procedures of a UAV in particular require valid position information related to accuracy, availability and continuity. In exploration areas where the UAV operates in low altitude or using a UGV, the reception of the GNSS signal can be degraded by the topology (buildings and such). Using more than one GNSS can increase the availability of position information. Vehicle control, georeferencing environmental sensor data and exploration results all require high-frequency absolute position and attitude and heading information. This data is gathered by fusing GNSS and inertial measurment unit (IMU) data.
OVERALL SYSTEM DESIGN
The overall system consists of three UAVs, two UGVs (Opening photo) and a central ground control station. The latter serves as a central human-machine interface to monitor and manage cooperative operation of the UAVs/UGVs by an operator. Based on a priori known map data, exploration areas and tasks are defined and assigned to the UAVs/UGVs and will be updated with actual information of the visual sensors while performing a mission.
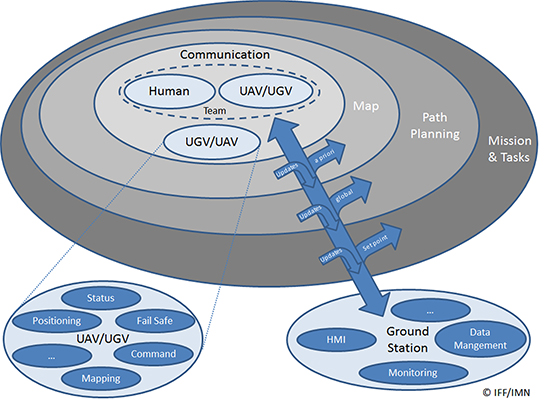
Figure 1 shows the interaction and information exchange between the different vehicles and sensors.
Figure 1. Diagram of interaction and information exchange.
All UAVs/UGVs are equipped with a navigation and communication unit (NAV/COM) and an environmental sensor payload (ENV) unit, including an RGB camera, thermal camera or a lidar respectively.
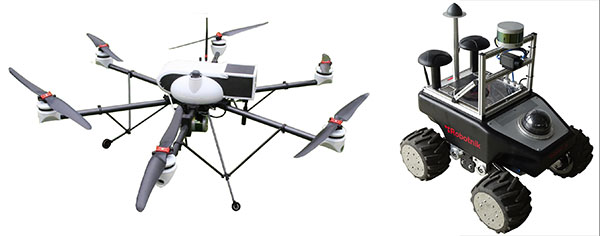
UAV/UGV and Sensor Hardware. The UAVs carry a payload of 2.7 kg (NAV/COM unit, mounted in the upper compartment, and ENV unit mounted under the UAV) and a flight time of up to 30 minutes (Figure 2, left). The payload sensors are carried and stabilized by a two-axis-gimbal. The environmental sensor payload unit is based on three different types of sensors, which are interchangeable between the different UAVs: RGB camera, lidar and IR camera.
For ground-based exploration, two four-wheel-drive UGVs carry a pan-tilt-zoom (PTZ) camera at the top of front chassis (Figure 2, right), and are equipped with a lidar and a thermal camera, or a stereo RGB camera, respectively.
Figure 2. UAV carrying a lidar (left) and UGV carrying lidar and IR camera (right).
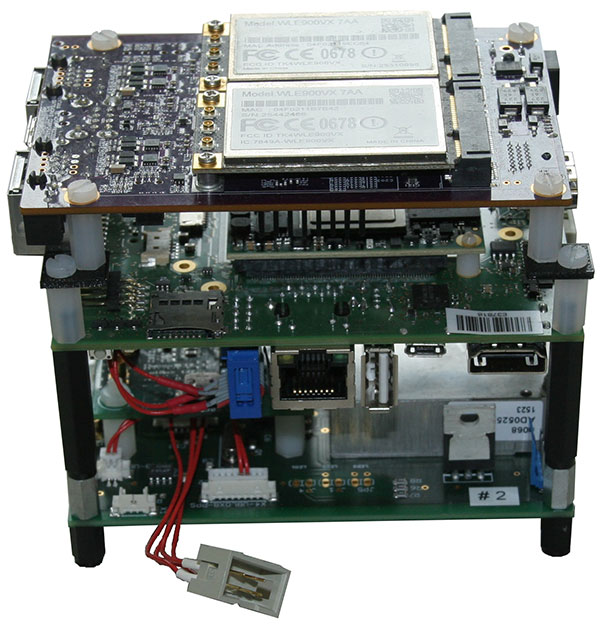
The navigation and communication unit mounted as a stack includes a network processor board for communication and data exchange between the UAV/UGV and the central ground and control station. An embedded processing board provides position calculation and GNSS-NTP-based time server. Data for the position calculation is provided by a custom-designed break-out-board (Figure 3).
Figure 3. Navigation and communication unit.
Data traced by these sensors cannot be sent directly to the ground station because of the huge data amount and the limited bandwidth of the communication link. Therefore, data from the sensors are preprocessed or compressed on a small form-factor personal computer and then transmitted to the ground station.
Ground Station. The ground station is the central device for command, control and visualization of the total system. It provides several options to display the data from the sensors and vehicles and a combination of them, and also provides automated path planning and calculation of the 3D reconstruction (photogrammetry) and online 2D stitched orthophoto.
Software Frameworks. The basic software for determining the vehicle’s state in 3D position, velocity, attitude and heading is established within a modular navigation software framework, with the option to process data of different sensors in real time as well as post-processing for data evaluation and development purposes. Several algorithms for sensor data fusion are implemented. The algorithm for IMU/GNSS fusion is based on an extended Kalman filter and also provides an IMU data-based state vector, stabilized by GNSS information, for the visual sensors. This state vector is published by using the robot operating system (ROS), a framework for inter-process communication based on a TCP or UDP publisher/subscriber concept. The visual sensors and embedded PCs subscribe to different ROS messages, for example, the state-vector-message or information of other sensors.
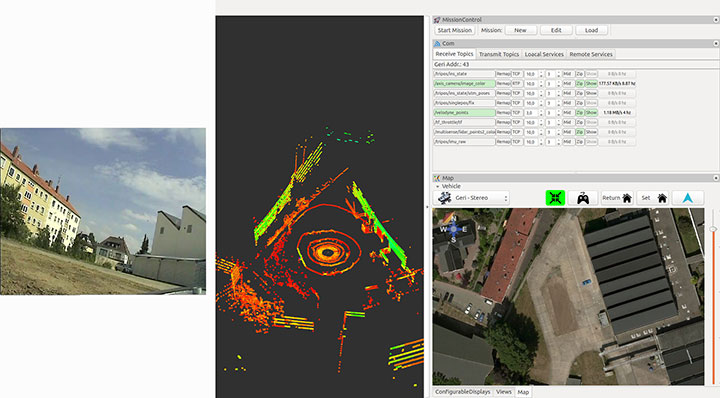
Figure 4 shows examples of the actual camera view from the UGV, and point cloulds and map generated by the UAV. The software layout can be customized by the user.
Figure 4. From left to right: the actual view by the PTZ camera onboard the UGV, the point cloud gathered by the UAV’s lidar, and the mission parameters and map of an aerial view.
POSITIONING OF UAV AND UGV
Automated operation of UGVs and UAVs requires valid position as well as attitude and heading information. In the case of using only one GNSS, signal quality and availability can be degraded by the environment (buildings) and can result in less precise or even a lack of position information.
GNSS Multi-Constellation. To overcome the risk of poor availability of GNSS-based position information, parallel usage of different GNSS can raise the number of received satellite signals: GPS, GLONASS, the evolving Galileo and BeiDou. When using a multi-constellation approach for positioning, one has to take care of several differing aspects between the GNSS. Each system uses a different geodetic reference frame and time basis. Measurements gathered from another GNSS system must be transformed into the reference frame of the desired system. The geometric distribution of the satellites is improved by using more than one GNSS constellation, indicated by a lower dilution-of-precision value.
The navigation software framework is designed for real-time computation and also for post-processing. In post-processing, the recorded sensor data is streamed to the software framework with the option of changing several parameters and settings for calculation. One option is to exclude satellites at low elevation from position calculation by changing the cut-off elevation for these satellites. This parameter will be changed to simulate environmental conditions that block receiving GNSS signals, like buildings within urban scenarios, to compare the availability of received GNSS signals for single- and multi-constellation-based position calculation.
Recorded data of a real-world test serves as the database for the post-processing with different cut-off elevation parameters. At the beginning of the field test, there was a short initialization period to boot the OS and to start basic processes for positioning. After that, a predefined mission was flown and the GNSS measurements have been saved for the described post-processing.
Post-processing has been performed with different cut-off elevation parameters of 5° up to 35°. In the case of 35°, the number of GPS satellites is reduced to the minimum for position calculation of four, in contrast to 5–7 available satellites for a multi-constellation based solution.
GNSS/IMU Fusion. Using the GNSS multi-constellation approach can increase availability of position information. For attitude and heading determination, an IMU is nevertheless indispensable. Additionally, the frequency of the pure GNSS-based positioning information is usually between 1 Hz to 5 Hz within the described hardware setup. Meaningful georeferencing of the environmental sensors requires much higher frequency position and attitude information.
The IMU provides high-frequency 3D measurements of accelerations and angular rates. Using common strapdown algorithm processing, high-frequency position, velocity, attitude and heading information is provided in real time. Due to the short time stability of pure inertial navigation, the GNSS positioning results are used for aiding purposes within the Kalman filter’s update step. To overcome the absence of GNSS aiding information even when using multi-constellations, there are mainly two options. First, a short coasting period is possible after the data fusion has reached a steady state.
Second, due to the highly modularly design of the navigation software framework, it is possible to use position or attitude increments from environmental sensor data processing for aiding the IMU.
The vehicle’s state vector is then distributed with high frequency within the system for georeferencing measurements of the environmental sensors, especially the RGB camera and the lidar for photogrammetry and simultaneous location and mapping (SLAM) applications.
PHOTOGRAMMETRY AND SLAM
In major fire scenarios, maps can be out of date. Therefore, techniques have been developed to gather a 2D overview based on several single RGB pictures taken and processed on board a UAV and transmitted to the ground station via data links. Additional processing of a 3D reconstruction of the scenario is an integrated feature within the ground station. Both approaches were implemented to get an automated rapid aerial mapping solution.
In the case of the 2D overview, SLAM algorithms, often used in robotic research, are adapted for this specific use case. These algorithms provide good results for a rapid aerial mapping solution to get an overview of the scenario, because the map is updated incrementally with every new image, but they are less precise, which can be compensated for by using the photogrammetric 3D reconstruction. The live mapping (SLAM) approach is based on the ORB-SLAM algorithm, and the photogrammetry-based approach uses commercially available photogrammetry software.
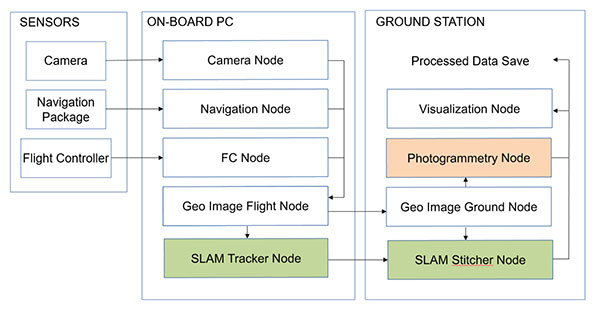
The systems, on the UAV for 2D and for 3D on the ground station, use the ROS framework for processing the visual sensor data and the described techniques for positioning, georeferencing and attitude determination. For data exchange between these frameworks, several software interfaces have been implemented. Figure 5 displays a flowchart of the implemented workflow.
The sensor/input data is received by corresponding nodes on the aerial vehicle. After adding the camera pose information to the image in the geo-image flight node, the image is sent to the geo-image ground node on the ground station. The SLAM process is separated into two parts. The SLAM tracker node calculates the transformation between images, and the SLAM stitcher node applies the transformations. The transformed images are displayed by the visualization node. The photogrammetry node receives the georeferenced images, stores the data, and initiates the photogrammetric processing once the survey is finished. The results can also be displayed by the visualization node and exported in a desired format.
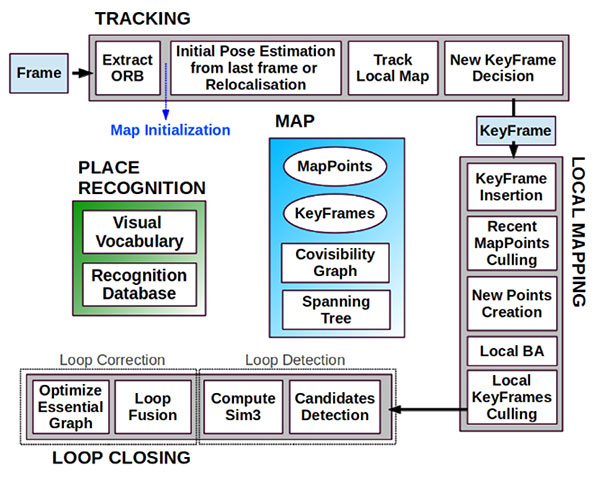
Visual SLAM. Computer vision-based algorithms have developed rapidly over the last few years. One method estimates a pose by using monocular image processing, known as parallel tracking and mapping (PTAM). This integrates a bundle adjustment and separates the tracking and the mapping procedure into different threads, leading to a real-time capable framework. These basic PTAM principles have been integrated into a robust loop-closing and another method of relocalization, known as Oriented FAST and Rotated BRIEF (ORB SLAM), shown in Figure 6. Here, tracking, local mapping and loop closing are separated into different threads (gray boxes), with the main map and place recognition in the middle.
Figure 6. ORB SLAM system overview [Mur-Artal, 2015].The tracking thread predicts the current pose from the last known position and movement by using a constant velocity model and performs a guided search of map points. If these points are found near the estimated position, the velocity model is valid and the tracking procedure continues. Otherwise, the tracking is lost and a relocalization in the global map starts by using a subset of features, which are increased after detection of corresponding features in other keyframes to optimize the camera pose and, finally, the tracking procedure continues. The last step of this procedure is to decide whether the current frame contains enough information to be inserted as a new keyframe for further calculations.
To mark a frame as a new keyframe, the frame must fulfill all of the following conditions:
More than minimum number of frames has passed.
Local mapping is on idle or condition 1 fulfilled.
A minimum number of 50 points is observed.
A maximum of 90% of the features is already observed by the other frames.
When a new keyframe is passed to the local mapping procedure and inserted as a node into a co-visibility graph structure, new correspondences are searched in the connected keyframes to triangulate new points. Based on the information accumulated during the tracking, a point culling keeps only high-quality points in the map as well as a culling of redundant keyframes.
Then a loop closing is performed. This is one of the main improvements compared to PTAM. If a loop is detected, the drift accumulated in the loop is computed, and both sides of the loop are aligned and visible points are fused. In a final step, a pose graph optimization is done to achieve global consistency.
This information of the 3D camera pose is used to generate a 2D orthophoto in real time while the vehicle is flying. To create a 2D orthophoto, a common reference frame is approximated, which is orthogonal to all camera measurements. The projection is performed by using a projection model based on a pinhole camera.
After the compensation and distortion, the whole image can be stitched to the current global map.
Photogrammetry. This approach uses off-the-shelf photogrammetric processing software. The processing is triggered automatically when the survey is completed and all images are transferred to the ground station via data link. For georeferencing of the images, the camera location and the inner camera geometry were written to the EXIF file of each image by the geo-image ground node (Figure 5). To ensure an acceptable compromise between orthophoto quality and the required processing time, an analysis regarding the impact of the most relevant processing parameters has been performed.
Figure 5. ROS node layout with SLAM (green) and photogrammetry workflow (red).
The photogrammetry process consists of four steps:
camera alignment (optimizing the homographic equation)
mesh creation by generated tie points
orthophoto creation (dense cloud or digital elevation model)
export.
Analyses and Evaluation. To evaluate the correct workflow of both approaches of 2D live-stitching and the 3D photogrammetry, a real-world flight test above agricultural cropland has been performed. The results of both approaches are shown in Figure 7 and Figure 8. Generally, agricultural cropland and its mean textured surface pose a challenge for mapping processes because of the limited number of trackable features.
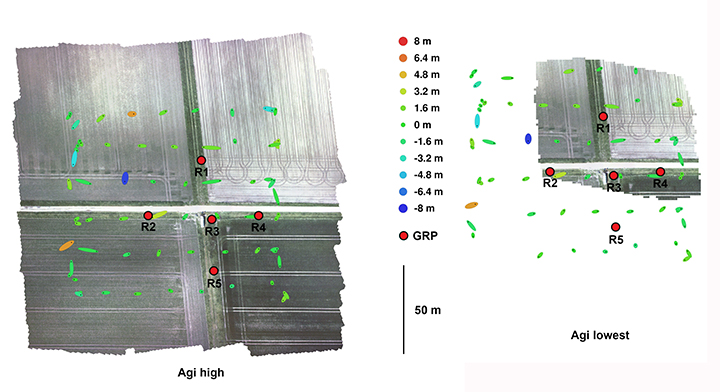
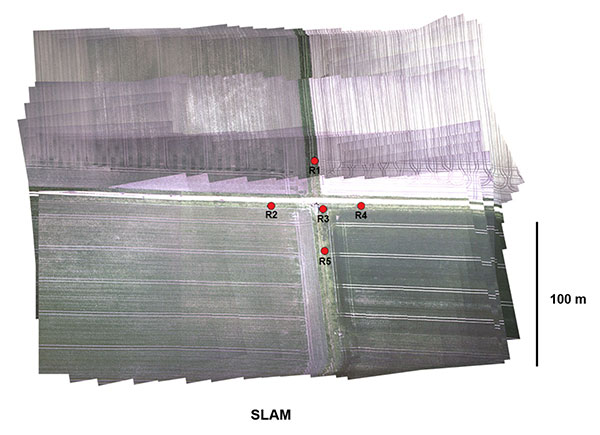
Figure 7. Orthophotos created with the profiles high and lowest (including ground reference points).Figure 8. Orthophotos created with 2D live stitching approach of cropland.
Four predefined profiles were used to cover the requirement of compromise between processing duration and quality of the generated orthophoto. Each profile level generates a corresponding level of alignment accuracy and mesh face count: lowest, low, medium and high.
To estimate the accuracy of the created maps by the different profiles, five ground reference points (GRPs) were distributed over the mission area. The location of the GRPs was determined using a RTK-GNSS system leading to a horizontal RMSE below 2 cm. To enable robust processing for this scenario, the overlap and the sidelap was chosen to be 70%. A ground-sampling distance (GSD) of 2 cm was needed to identify the GRPs. This resulted in a mission consisting of six times 100-meter (m) lines with a distance of 25 m in an altitude of 60 m over ground. During the flight time of 4.5 minutes, 271 images were taken.
To compare the profiles, they were triggered one after another with the same set of images. The created results are shown in Figure 7. All profiles resulted in consistent solutions and were successfully georeferenced. The map based on the lowest profile could not recreate the complete area (Figure 7, right). The remaining profiles led to similar results without notable differences to visual inspection. The processing time varied between 1.2 and 3.6 minutes. A comparison of this and other criteria is given in Figure 9.
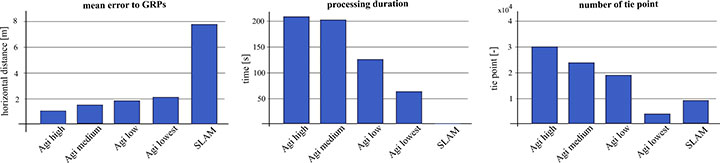
Figure 9. Evaluation and comparison of defined software profiles and visual SLAM.
The created final image of the SLAM pipeline is shown in Figure 8. The image was updated with every new image and was therefore finished before the UAV landed. The mean location error measured using the reference points was about 8 m, significantly larger than the errors observed in the photogrammetry results. In Figure 9 the results are contrasted to the results of the photogrammetry approach.
While the mean error in the low profile is half as high as in the lowest profile, the calculated errors using the medium and high profiles are not enhanced significantly. The number of tie points created by the lowest profile is an order a magnitude lower compared to the other three profiles.
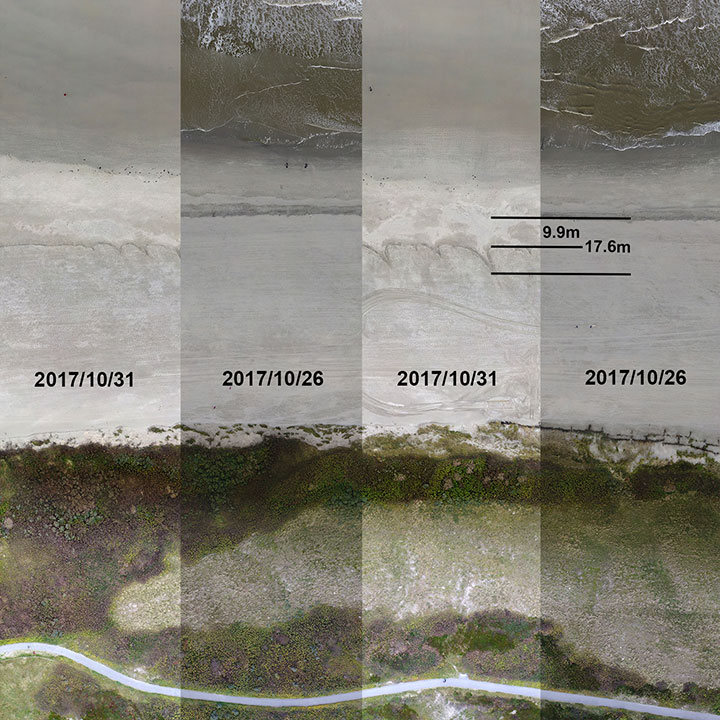
We conducted flight tests on Langeoog island in the North Sea, to gather information on efforts to protect the island’s coastline from water erosion. For this reason, sand was selectively washed up to the coastline by dredgers at the beginning of October 2017. Between Oct. 26 and 31, due to severe weather with a storm flood, a huge erosion of the washed up sand occurred, and the result is shown in Figure 10. The level of erosion was determined by comparison of the orthophoto of the same area. The dislocation averaged out to 9.9 m with some peaks up to 17.6 m.
Figure 10. Evaluation of erosion.
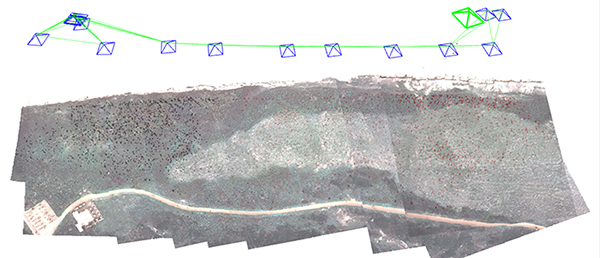
The 3D photogrammetry provides a more detailed image compared to the image of the 2D-live-stitching approach (Figure 11), but both approaches can provide the desired information of the area.
Figure 11. Result of the SLAM approach with camera poses and tracked features.
Both implemented approaches were successfully integrated to get the desired fully automated rapid aerial mapping solution. This also includes the basic tasks of the automated mission planning, camera control, image transport to ground station, automated processing and the visualization of the results.
CONCLUSION
The benefits of multi-constellation GNSS positioning have been demonstrated with a focus on UAVs and UGVs operating in catastrophic scenarios, especially where GNSS signal reception might be blocked. This position information is also used for georeferencing of images and visual reconstruction of the area. The overall system has demonstrated the capability of an automated orthophoto generation. Both implemented mapping methods — a 2D live stitching and a 3D photogrammetry — provided results that fulfill the requirements to get an instantaneous 2D overview and a contemporary 3D reconstruction of the area.
ACKNOWLEDGMENTS
This work was done within the joint research project ANKommEn, funded by the German Federal Ministry of Economic Affairs and Energy, administered by the Space Administration of the DLR (funding code: 50NA1518). Project partners are the Institute of Flight Guidance (IFF), the Institute of Mobile Machines and Commercial Vehicles (IMN) — both part of Technische Universität Braunschweig — and AirRobot GmbH & Co. KG, a German manufacturer of multirotor UAVs. The professional fire brigade of Braunschweig and the Lower Saxony Water Management, Coastal Defense and Nature Conservation Agency also participate as associated project partners.
SIMON BATZDORFER holds a Dipl.-Ing. in mechanical engineering and is a research engineer at the Technische Universitaet Braunschweig, Institute of Flight Guidance (IFF).
MARKUS BOBBE holds a M.Sc. in aerospace engineering and is a research engineer at the Braunschweig IFF.
MARTIN BECKER holds a Dipl.-Ing. in aerospace engineering and is a research engineer at the Braunschweig IFF.
ULF BESTMANN received his Dr.-Ing. in mechanical engineering from TU Braunschweig. He is head of the navigation department of the IFF. He co-founded the company messWERK GmbH, a service provider in flight testing and certification.
The 10-day school will cover all aspects of satellite navigation, up to and including the creation of a satnav-based business. It is open to graduate students, Ph.D.s and postdoctoral researchers, as well as young engineers and academics working within industry or agencies, aged 35 or younger.
The number of participants is limited to 50, on a first-come, first-served basis.
Internationally renowned scientists and specialists will be giving lectures as well as overseeing practical exercises and lab work.
Participants will receive a full-spectrum overview of satellite navigation, starting from the theoretical basis of Global Navigation Satellite Systems, their signals, the processing performed by signal receivers and how the position-navigation-time solution is worked out.
Also discussed will be threats to the satnav systems, such as spoofing or jamming, and countermeasures available against them, along with back-up navigation solutions for a GNSS-denied environment.
Practical exercises will include receiving the various satnav constellations now in orbit — including Europe’s Galileo — to give course members direct, hands-on experience.
In addition, lectures will cover business aspects, including patents and intellectual property rights.
The main emphasis of the course will be the development of a group business project, building on an innovative idea to take in the planning of the product or service, its technical realisation and finally its marketing to customers.
Image: Summer School
The school takes place in cooperation with Stanford University in the United States, the Institut Supérieur de l’Aeronautique et de l’Espace ISAE-SUPAERO in Toulouse, France, Graz University of Technology in Austria, and the University FAF Munich in Germany.
Austria is this year’s host nation, and the summer school is supported by Graz University of Technology and the Austrian Institute of Navigation.
By Tommaso Panicciari, Mohamed Ali Soliman and Grégory Moura
All images provided by the authors
A real-time system combining a simulator and a GNSS propagation model reproduces an authentic multipath environment. The propagation model relies on a 3D-model reconstruction of the urban environment, which generates a multipath signature strictly dependent on the location of the receiver’s antenna. This yields important results for a moving vehicle, which may be affected by very different multipath conditions depending on trajectory and location.
Positioning and navigation can be degraded in urban environments by multipath, and the error can increase considerably if not properly compensated. In situations where the line-of-sight (LOS) is obscured by surrounded buildings, the receiver may still be able to navigate by using the non-line-of-sight (NLOS) signal, which originates from single or multiple reflections/diffractions of the GNSS signal.
The use of 3D models has been one of the preferred solutions to recreate the multipath environment as seen by a GNSS device. This solution brings the capability to generate a multipath signature that is representative of the position of the antenna in a specific time and space. However, this solution comes with a certain degree of complexity. In fact, an accurate 3D model is required to simulate the obscuration of the GNSS signal, and a good propagation model is needed to generate phenomena like reflection and diffraction.
Figure 1. Example of propagated signal simulation. (Image: Tommaso Panicciari, Mohamed Ali Soliman and Grégory Moura))\
3D models have become more accurate and widely available and are mainly used to predict the satellite availability in specific locations, for example in evaluating the signal availability in urban canyon, and for both reflection and diffraction. Other uses of 3D models are as an aiding tool to assist navigation, sometimes together with an INS solution.
In this article, we present a novel real-time system capable of simulating realistic multipath in different environments. The system can simulate multiple GNSS constellations and is comprised of a GNSS simulator interfaced to a propagation model. The system can create a whole range of signals, effects, error models and trajectories in a real-time closed loop. The propagation model controls the simulation of multipath from the interaction of the GNSS signal with the 3D scene and objects. This article describes a novel real-time system for the simulation of realistic multipath in different environments and compares simulated and field-test data. The comparison is based on signal availability, horizontal error, carrier-to-noise (C/N0), pseudorange and Doppler residuals.
RAY-TRACING WITH 3D MODELING
The model simulates the propagation of GNSS signals in constrained environments, considering obscurations and multipath. It uses a proprietary ray-tracing kernel (based on bounding volume hierarchy techniques using processing unit [GPU] resources) coupled with geometrical optics and uniform theory of diffraction to compute the interaction between the signal and the local environment. The computation uses as main input a synthetic environment (that is, geometrical and physical modeling of a real or realistic environment) to assess the impact of obscurations related to signal availability issues and multipath (the cause of fading effects and performance problems).
The objective of ray-tracing is to find all the possible paths from the observer to the source of the signal considering a limited number of interactions per emitted rays. A ray-tracer (or ray-tracing algorithm) uses a primary grid to cast primary rays. Then, it iteratively computes the possible interactions between these rays and the virtual scene (often defined using triangles). If those interactions exist (if they comply with the law of physics) and if the number of interactions to reach the emitter is below the maximum number of interactions set by the user, then a ray (or multipath) is created. This is a deterministic method that can be used to calculate the obscuration due to the local environment (and therefore detect the signal availability) and the geometrical characteristic of the computed path. Combined with physics modeling, path attributes such as received power, delay, Doppler, and phase are also provided.
The main characteristics of ray-tracing techniques to model GNSS propagation are:
All the signals arriving at the receiver can be model-based on the virtual environment.
As it is a deterministic method, the more realistic the environment modeling, the more compliant with reality the results. Moreover, the simulation results are repeatable.
The specular multipath can be displayed in 3D, and the attributes (for example, receiver power, phase, polarization, Doppler, geometry of the ray) are known. For example, this is relevant when the effect and signature of the environment on the propagation signal need to be studied and understood.
Nonetheless, ray-tracing techniques must account for three major difficulties:
They are time-consuming algorithms. Indeed, depending on the complexity of the scene (defined in terms of the number of triangles), a combinatorial problem to find the possible multipaths reaching the receiver makes the ray-tracer very resource-demanding. That is the reason why the most difficult task to achieve during the coding of a real-time ray-tracing algorithm is to develop acceleration techniques to quicken the computation process. Several solutions exist to either improve the intersection determination (for instance, based on spatial hierarchies such as bounding volume hierarchy [BVH] techniques), or to decrease the number of cast rays (often based on adaptive sampling techniques), or even to replace rays with beams or cones. Moreover, it is possible today to use the resources of graphic boards to accelerate the computation. Indeed, as ray-tracing can be coded by a large number of primary functions that can be treated simultaneously, it can be easily ported into GPU.
Their accuracy depends on the resolution of the primary grid. Details and therefore rays may be missed if the 3D scene is made of small details. This issue is called aliasing. Aliasing artefacts are raised for instance in parts of the scene with abrupt changes (such as edges) or in complex areas with lots of constituent objects. Solutions (or antialiasing techniques) exist to overcome this issue such as adaptive or stochastic samplings.
When it is combined with geometrical optics, these algorithms only compute the specular rays. Even if some techniques exist to model the scattering signals, only physical optics can render the global signal with high fidelity.
MULTIPATH SIMULATION SYSTEM
The proposed system can model two of the main propagation issues encountered in urban environments, such as obscuration (which leads to limitations in signal availability) and multipath (which generates interference that causes fading of the signal and positioning errors). To model realistically such a complex phenomenon, the system uses a GPU ray-tracing algorithm combined with geometrical optics and uniform theory of diffractions. The ray-tracing algorithm relies on 3D-model reconstructions of the urban environment. The computed obscuration and multipath effects are then used to generate signal corrections (in terms of power, delay and Doppler variation) to be used in the GNSS simulator, which generates the carrier, code and navigation messages for different GNSS constellations into a single RF output. Some of the advantages of this system is its ability to run in real time, and to visually show all the reflections/diffractions of the GNSS signals that cause multipath interference.
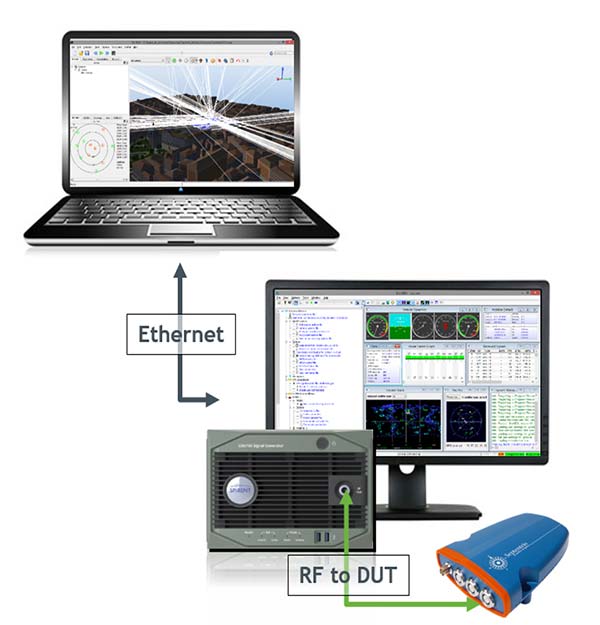
Figure 2 shows the diagram of the system set up in conductive mode. The system includes a SE-NAV PC controller, simulator software suite controller, GNSS simulator and device under test (DUT). A different mode is also available called over the air (OTA). This mode uses an anechoic chamber and a set of antennas distributed uniformly to generate the RF signal including the multipath. The DUT can then be placed at the center of the chamber and will be able to receive LOS and NLOS signals from different angles of arrival.
Figure 2. System diagram that shows propagation simulator controller (top), the GNSS simulator (bottom) and the device under test connected to the RF output of the simulator. (Image: Tommaso Panicciari, Mohamed Ali Soliman and Grégory Moura)
The GNSS simulator software suite is used to generate and control the generation of the satellite signals (including multipath) at RF, whilst the propagation simulator is used to calculate the propagation information (delay, Doppler and attenuation) of the reflected signals through a 3D urban model. The propagation software is interfaced with GNSS simulator software by means of a package of remote-control facilities that greatly enhances the flexibility of the propagation simulator. Those commands can be sent and received through the transmission control protocol/use datagram protocol (TCP/UDP) with different data streaming rates (10 Hz was used for this article).
It is also important to point out that the propagation simulator computes all the possible multipath signal generated by the 3D model given the position of the satellites and receiver. However, the physical limitation of the number of channels in the simulator causes the rejection of some rays. This rejection or filtering process can be done according to power (used in this article) or delay.
EXPERIMENT SET-UP
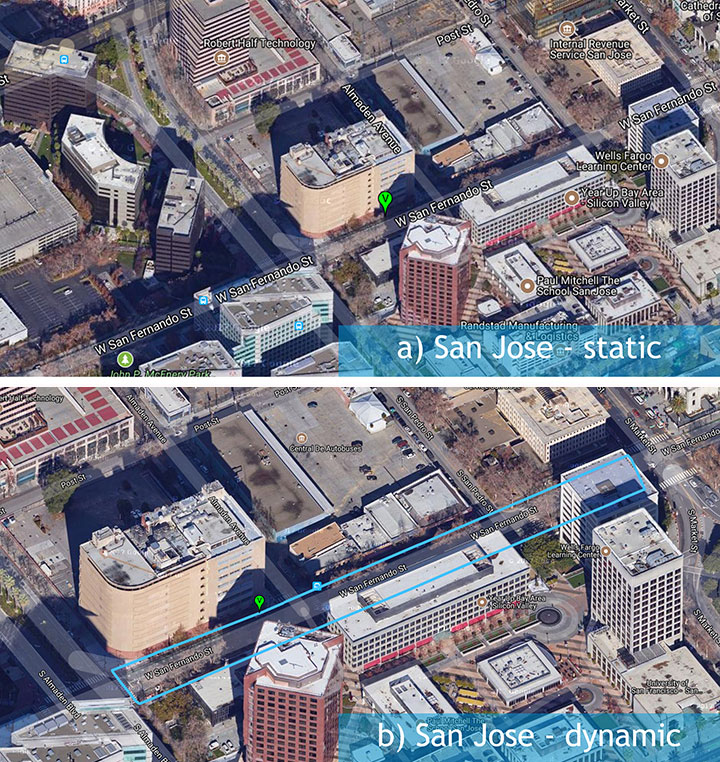
A set of different field-test campaigns where carried out in August 2016. Each campaign aimed to evaluate the ability of the system to assess the performances of a GNSS receiver using simulated signals in urban environments. Figure 3 shows the trajectory (blue line) used for the experiment in an urban environment — San Jose, California — with a static (a) and dynamic (b) scenario.
Figure 3. A set of three measurement campaigns where carried out during Aug. 9–10, 2016: a) urban environment with static antenna; b) urban environment with dynamic antenna. (Image: Tommaso Panicciari, Mohamed Ali Soliman and Grégory Moura)
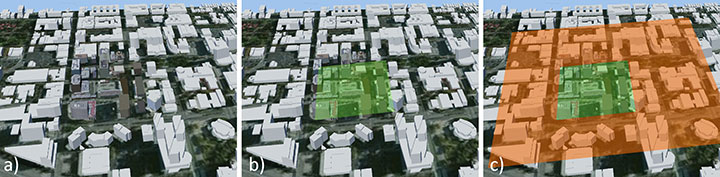
Figure 4 shows the 3D scene used to replicate the San Jose urban environment. The buildings in close proximity of the antenna (green area in Figure 4b) contain details like material, 3D facade and windows. In contrast, the buildings far from the antenna were only corrected for height, and the material was modeled as concrete only.
Figure 4. The San Jose model contained most of the details around the receiver antenna (b), with only height corrected for buildings far from the antenna (c). (Image: Tommaso Panicciari, Mohamed Ali Soliman and Grégory Moura)
An exception was made for one building in San Jose because its complex architecture was believed to contribute to more reflected rays than would a more simplistic box (concrete) model (Figure 5).
Figure 5. Improvement (right) in one San Jose building because its complex architecture was believed to generate more reflections than the more simplistic box model (left). (Image: Tommaso Panicciari, Mohamed Ali Soliman and Grégory Moura)
EXPERIMENT RESULTS
A direct comparison of C/N0 power, pseudorange residual, and Doppler residual was performed between the field test and simulation.
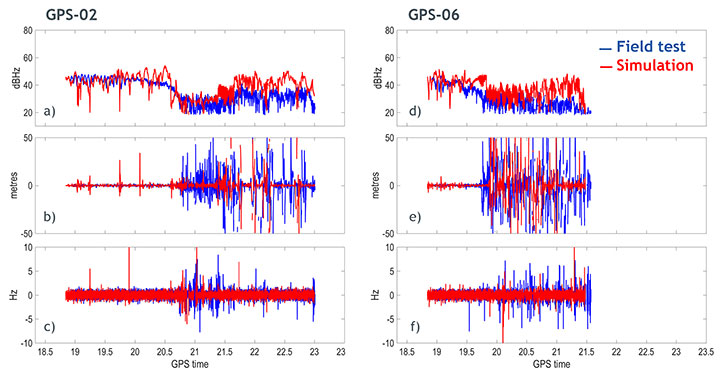
San Jose Static Results. Figure 6 shows the results obtained from the San Jose static scenario for satellites PRN02 and PRN06: C/N0 ratio, pseudorange residual and Doppler residual for field test (blue line) and simulation (red line). Although the simulation sometimes creates deeper fading than in the field test, a first comparison indicates a good correlation of simulated data with field-test data.
Figure 6. Carrier-to-noise ratio (top), pseudorange residual (middle) and Doppler residual (bottom) for PRN 02 (left column) and PRN 06 (right column). (Image: Tommaso Panicciari, Mohamed Ali Soliman and Grégory Moura)
The signature of the multipath caused by this urban environment is visibly captured in the simulation. More interestingly, the pseudorange residuals and, to a lesser extent, Doppler residuals also indicate that the model is replicating the dynamics of the multipath environment in close correlation with the field test.
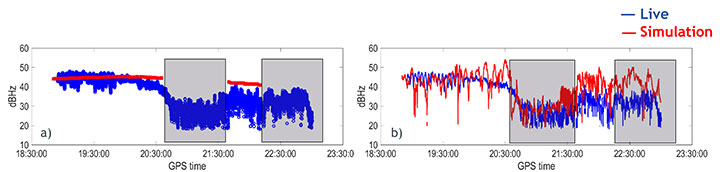
Figure 7 shows the C/N0 obtained from the field data (blue), and simulated data (red) with only obscuration (a) and with obscuration and multipath (b) for the static scenario.
It can be noticed that the receiver can still track PRN02 without the LOS, therefore, relying on just the NLOS signal. This can be clearly seen in Figure 7a where a sudden drop in power is associated to an obscuration of the same satellite (based on our 3D urban model).
Figure 7b shows the C/N0 obtained from the simulation (red line) when both obscuration and multipath were enabled. In this case the receiver could track the satellite even in the case of only NLOS as in the field test.
Figure 7. Carrier-to-noise ratio for satellite PRN02 with only obscuration (a) and with multipath (b). (Image: Tommaso Panicciari, Mohamed Ali Soliman and Grégory Moura)
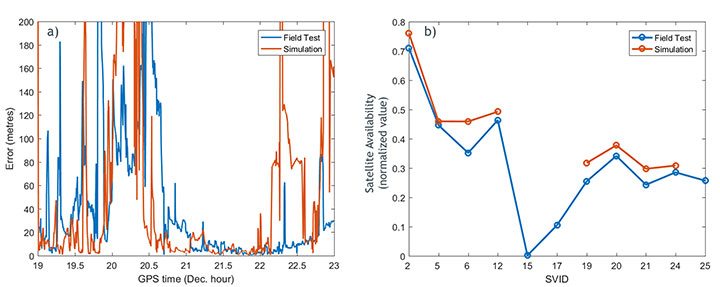
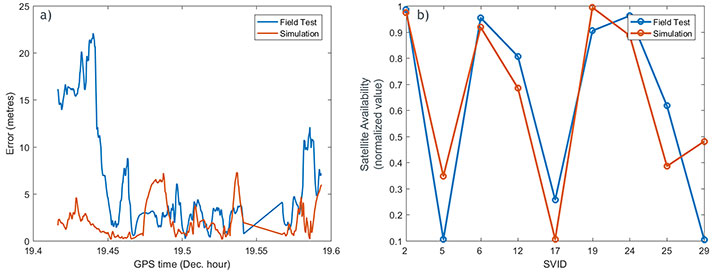
The positioning error for the San Jose static scenario is shown in Figure 8a. The simulation and field-test data have a comparable error. The error is relatively big at the beginning of the simulation and decreases after time 20.6. At the time 22.3, a moderate increase in the positioning error is visible in the field data until the end of the test. The simulation also shows a similar trend in this last part of the test, but tends to generate a higher positioning error.
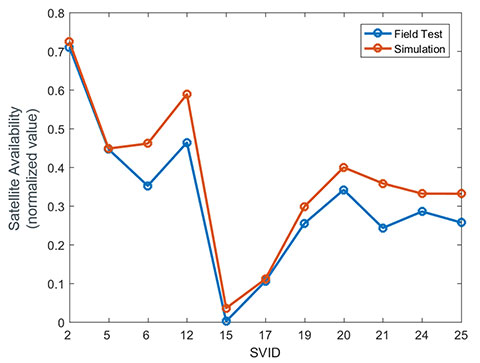
The satellite availability is shown in Figure 8b for both simulated (red) and field test (blue). The availability of the satellites generated with simulated data is in close relationship with the field data. However, some satellites could not be tracked in the simulation.
Figure 8. a) positioning error for field-test (blue) and simulation (red); b) satellite availability for field data (blue) and simulation (red). (Image: Tommaso Panicciari, Mohamed Ali Soliman and Grégory Moura)
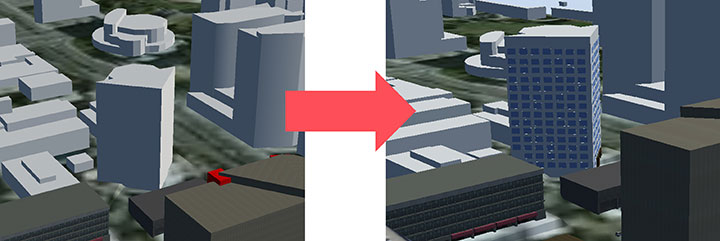
The importance of the accuracy of the 3D scene is evident in this example. In fact, we noticed that one of the buildings that was simulated as a simple concrete box was more complex in the real environment. Therefore, we applied some modifications to scene, as in Figure 9.
Figure 9. 3D scene improvement. (Image: Tommaso Panicciari, Mohamed Ali Soliman and Grégory Moura)
After those changes, a general improvement in the results was visible, but most importantly, the missing satellites could finally be tracked by the receiver (Figure 10).
Figure 10. Satellite availability for field data (blue) and simulation after scene improvement. (Image: Tommaso Panicciari, Mohamed Ali Soliman and Grégory Moura)
SAN JOSE DYNAMIC TEST RESULTS
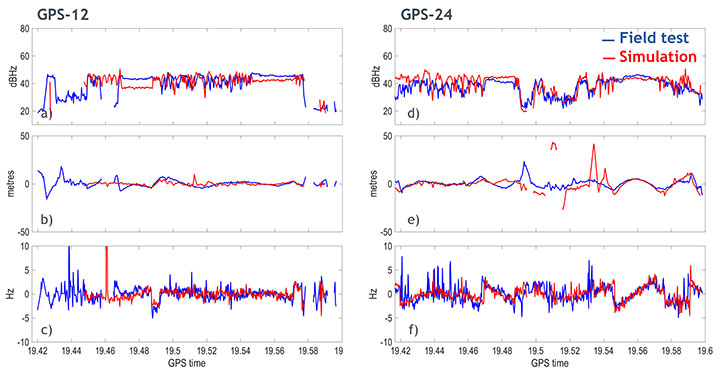
Similar results were obtained with the dynamic test in San Jose. Figure 11 shows the results obtained for satellites PRN12 and PRN24. The walking trajectory included two points where the antenna was stopped because of a traffic light. Those points correspond to a relatively flat C/N0 that can be clearly seen in the field test and simulation data for both PRNs. When, instead, the antenna was moving, a higher variation in the C/N0 is noticeable in both simulation and field test.
Figure 11. Carrier-to-noise ratio (top), pseudorange residual (middle), and doppler residual (bottom) for PRN 12 (left column) and PRN 24 (right column). (Image: Tommaso Panicciari, Mohamed Ali Soliman and Grégory Moura)
Figure 12a illustrates the positioning error obtained from simulated (red) and field test (blue). The first part of the simulation produced an error smaller than the one obtained from field data. However, from the time 19.48, a good agreement can be seen. The satellite availability is also shown in Figure 12b. This last result was obtained with the improved model described in Figure 9.
Figure 12. (a) Positioning error for field-test (blue) and simulation (red); (b) satellite availability for field data (blue) and simulation (red) after scene improvement. (Image: Tommaso Panicciari, Mohamed Ali Soliman and Grégory Moura)
CONCLUSIONS AND FUTURE WORK
A new real-time system for multipath simulation is designed to generate realistic multipath that depends on time, position and type of urban environment. The 3D scene is used to calculate the multipath (reflection and diffraction) caused by the buildings and objects around the antenna.
Some first results demonstrated that realistic multipath can be generated by simulating reflections and diffractions even with a simple 3D model. However, the inclusion of finer details in the model can improve the simulation and make it even closer to reality.
As always, simulation interest is a tradeoff between reliability in all conditions and efforts to adapt (that is, to specify) a generic and simple model. The added value of our model consists in its simplicity and its good compliance with field data.
Ray-tracing techniques coupled with geometrical optics and uniform theory of diffraction are efficient and simple methods to simulate the propagation of GNSS signals in complex urban environments. Their efficacy is demonstrated by a good agreement between simulation and field measurements. Some discrepancies still exist and are due to the limitations of such a model:
The accuracy of the model is never perfect and, as ray-tracing is a deterministic method, the returned results strongly depend on the quality of the input data used to generate the model.
Geometrical optics is a simple (but efficient) method. Only specular rays are modeled, thus the system won’t be able to generate all the signals coming from other phenomena such as scattering. Another limitation is given by the hardware. In fact, the number of simulated multipath depends on the number of available channels in the simulator.
The simulation parameters try to mimic the field conditions. However, the simulated trajectory is approximated, and other factors like pedestrian motion, vegetation (isolated trees or forest) and traffic may contribute to reduce some of the discrepancies that can be observed between simulation and field
All of these limitations can explain the differences between simulated and measured data. Currently, the impact of vegetation (forest and/or isolated trees) models, pedestrian motion and traffic on the multipath signal can also be simulated and their performances are under evaluation.
ACKNOWLEDGMENTS
We thank Colin Ford and Ajay Vemuru from Spirent Communications and Antoine Boudet, Yann Dupuy, Arnold Duquesne and Paul Pitot from OKTAL Synthetic Environment.
MANUFACTURERS
The system described in this article consists of a Spirent GNSS simulator equipped with a SimGEN software suite and the SE-NAV simulator developed by OKTAL Synthetic Environment. SE-NAV is interfaced with SimGEN via the SimREMOTE protocol, a real-time control and motion API.
Tommaso Panicciari obtained a Ph.D. in telecommunications from the University of Bath (UK). He is a software/project engineer at Spirent Communications where his main activity focuses on spoofing and multipath simulation.
Mohamed Ali Soliman is completing a master’s degree in telecommunications with business at University College London. He is a product manager at Spirent Communications, managing multiple products including the multipath simulation offering.
Grégory Moura graduated from the French Institute of Aeronautics and Space with an M.S. in cosmology from Université de Toulouse. He manages the GNSS activities of the French company OKTAL Synthetic Environment.
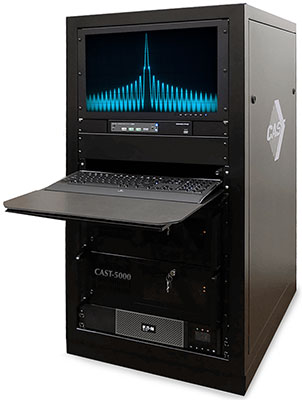
The CAST-5000 produces a single coherent wavefront of GPS RF signals to provide repeatable testing in the laboratory environment or anechoic chamber. The basic system generates four independent, coherent simulations that reference a single point and is upgradeable to support seven elements for CRPA testing. With an intercard carrier- phase error of less than 1 millimeter, the CAST-5000 is extremely accurate.
The system generates a wavefront of GPS when its GPS RF generator cards are operated in a ganged configuration. Each generator card provides a set of GPS satellites coherent with the overall configuration. Several RF generator cards may be utilized together, ensuring phase coherence among the bank of signal generator cards.
The CAST-5000 Controlled Reception Pattern Antenna (CRPA) tester allows a full end-to-end test of the antenna system. The CRPA antenna, antenna electronics and the GPS receiver can be tested as a unit with or without radiating signals.
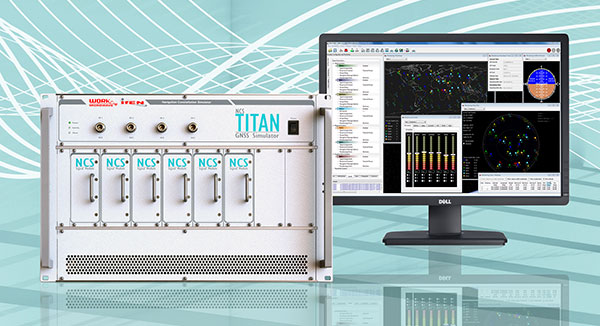
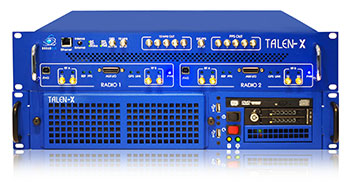
The NCS TITAN GNSS simulator is a leading-edge satellite navigation testing and R&D solution. It is fully capable of multi-constellation and multi-frequency simulation for a wide range of GNSS applications. The NCS TITAN GNSS simulator consists of the TITAN RF signal generation unit and NCS Control Center navigation simulation software (on MS Windows and Linux OS).
The NCS TITAN is flexible and offers exceptional performance. With up to 256 channels and up to 4 RF outputs per chassis, the extra complexity and cost of using additional signal generators or intricate architectures involving several hardware boxes is minimized. For customers with advanced simulation needs, several TITAN units can be combined (CRPA testing with 8, 12 or 16 RF outputs at several frequencies simultaneously).
The NCS TITAN GNSS simulator provides all current and future signals for GPS, GLONASS, Galileo, BeiDou, NavIC/IRNSS, QZSS, SBAS L1 and L5 in one box. All signals are available using a flexible licensing scheme.
NavX-NCS Essential Simulator
The NavX-NCS Essential is an easy-to-use multi-constellation GNSS simulator focused on R&D, system integration and production testing for single-frequency applications such as consumer, automotive and location-based services (LBS) applications.
The NavX-NCS Essential provides unique capabilities, including emulating various vehicle motion sensors for today’s multi-sensor vehicle navigation systems. It offers integration with Google Earth (for accurate trajectory visualization), superior high-dynamic range (for indoor and urban canyon simulation) and Assisted-GPS (A-GNSS) performance test case support.
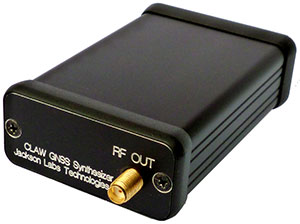
CLAW 18-channel real-time GPS simulator for manufacturing testing, laboratory and desktop simulation applications
The CLAW simulator operates as a fully stand-alone simulator with multipath simulation capability, external real-time NMEA to GPS-RF transcoding capability, sub 5-ns UTC time-encoding accuracy. It can work either from internally stored motion files, a fixed-position, externally applied NMEA stimulus input, or controlled via a Jackson Labs Windows application. The CLAW allows comprehensive scenarios to be set up inACKcluding uploading of custom almanac and ephemerides via RINEX import, and full control of simulation time and date making it easy to simulate GPS events such as leap seconds and week 1023 rollover events. The highly accurate simulator can be used as an embedded module to transcode modern GNSS or inertial navigation system (INS) position, navigation and timing signals including SAASM and M-code into legacy GPS RF signals. This capability allows retrofitting any existing legacy GPS receiver to the latest Assured-PNT capability. It can also be used as a GPS firewall to automatically detect and mitigate spoofing and jamming events.
RSR transcoder GPS simulator for retrofitting existing legacy GPS equipment to any GNSS, INS and atomic holdover capability
The size of a postage stamp, the RSR Transcoder is based on the Jackson Labs CLAW simulator technology and is designed to be integrated into systems requiring retrofit of existing GPS legacy equipment with INS and atomic clock holdover capability, as well as the latest GNSS capability such as Galileo, GLONASS, BeiDou, SAASM, M-code and CSAC technology. Because the RSR Transcoder is fully self-contained, it also can work as a generic stand-alone GPS simulator for manufacturing environments or laboratory use. It is compatible with various external MIL-STD GPS receivers for glueless integration into existing vehicles by replacing the existing GPS antenna with the RSR Transcoder connected to an external GNSS receiver and optional high-performance INS. The RSR Transcoders ability to convert latest-generation GNSS receiver NMEA information into legacy GPS RF signals can also be used to upgrade low-performance legacy GPS receivers with modern –167 dBm and SBAS tracking capability for indoor reception and increased PNT accuracy in challenged environments.
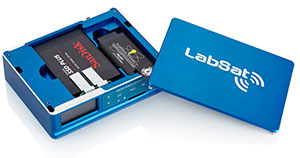
LabSat is a cost-effective and intuitive GNSS simulator.
New to the LabSat range of GNSS record and replay devices is LabSat 3 Wideband, which continues with the established reliability, cost-effectiveness, and simplicity of operation that are the benchmarks of the LabSat system.
A recording bandwidth of 56 MHz allows for the capture of a very wide range of live-sky satellite signals:
GPS: L1 / L2 / L5
GLONASS: L1 / L2 / L3
BeiDou: B1 / B2 / B3
QZSS: L1 / L2 / L5
Galileo: E1 / E1a / E5a / E5b / E6
IRNSS: L5
SBAS: WAAS / EGNOS / GAGAN / MSAS / SDCMx
Depending on the desired bandwidth, recording resolution can be set to 2, 4, or 6 bit. Check out the GNSS frequency guide on the LabSat website — labsat.co.uk — to see exactly which signals can be recorded and at which resolution.
Even with this greatly increased capacity over the original LabSat 3, the new simulator remains extremely easy to use: one-touch recording, no connection to PC required, battery powered for up to two hours, and with a removable 1-TB solid-state hard drive that can be replaced in no time, the LabSat 3 Wideband is convenient to use. It measures a compact 167 x 128 x 46 millimeters and weighs 1.2 kilograms.
The LabSat 3 Wideband can now be controlled via a web browser. Easily accessed via the Ethernet connection, the HTML interface graphically displays bandwidth, center frequency and signal capture.
An online demonstration of this is also available on the LabSat website.
SDX uses GPU-accelerated computing and software-defined radios (SDR) to create an advanced and fully-featured GNSS simulator. SDX is available as a complete turnkey system or software only, from simple test benches to 32 RF outputs test systems. The software-defined approach offers many benefits:
COTS hardware offers economies of scale and eliminates dependency upon dedicated hardware platforms
Generic hardware enables users to repurpose their equipment for different projects.
Uncompromised performance with high dynamics and accuracy
Record user interactions and export them as scripts to automate complex use cases intuitively. The export feature reduces the learning curve for advanced concepts
Advanced signal customization (signal signature, private encryption, etc.)
SDX key features
SDX is ideal for design and validation of GNSS receivers, complex integration, academic research, NAVWAR and test engineering. Applications include radiated emissions testing in anechoic chambers, CRPA testing, receiver testing under interference (jamming and spoofing), aerospace and automotive scenarios, RTK and more. Skydel engineering and research teams offer direct support to clients to ensure prompt deployment and integration, or to review advanced customization requirements.
Multi-constellation (GPS, GLONASS, Galileo, BeiDou, SBAS), multi-frequency (upper and lower L-band) support
Selectable RF, IF frequency and IQ File Data
Encrypted GPS codes
Fully-integrated jammers (static or moving) with more than 120-dB jamming-to-signal ratio
Multipath
Additive pseudorange ramps
Message modification and corruption
1000-Hz update rate and high dynamics
Space (LEO-GEO), air and ground vehicle with 6DoF trajectories
Spirent Federal provides test equipment that covers all applications, including research and development, integration/verification and production testing.
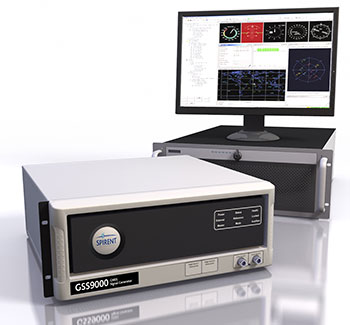
GSS9000
The Spirent GSS9000 Multi-Frequency, Multi-GNSS RF Constellation Simulator can simulate signals from all GNSS and regional navigation systems. The GSS9000 offers a four-fold increase in RF signal iteration rate (SIR) over Spirent’s GSS8000 simulator. The GSS9000 SIR is 1000 Hz (1 ms), enabling higher dynamic simulations with more accuracy and fidelity. It includes support for restricted and classified signals as well as advanced capabilities for ultra-high dynamics. Users can evaluate the resilience of navigation systems to interference and spoofing attacks, and have the flexibility to reconfigure constellations, channels and frequencies between test runs or test cases.
CRPA test system
Spirent’s Controlled Reception Pattern Antenna (CRPA) Test System generates both GNSS and interference signals. Users can control multiple antenna elements. Null-steering and space/time adaptive CRPA testing are both supported by this comprehensive approach.
GSS6450
The GSS6450 RF Record Playback System (RPS) takes RF recording and playback systems to a new level of performance and flexibility, while being housed in a small (8.5 x 7.8 x 3 inch) portable case. The GSS6450 can record any GNSS signals currently available with bit depths up to 16 bits (I&Q) and bandwidths of up to 50 MHz. The flexible product structure allows the system complexity to grow with the user’s testing needs.
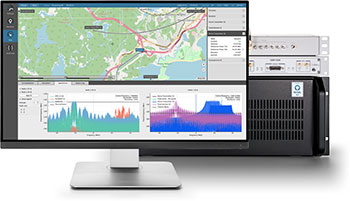
GSS200D
The GSS200D is an end-to-end solution that builds up a complete picture of interference activity at the site of interest. It continuously monitors the GNSS frequency bands for interference, and then captures them for analysis. The GSS200D supports multi-frequency applications.
Constellator is a high-end GNSS simulator capable of supporting all constellation signals available today and tomorrow and providing a high level of service: standalone mode (on ground and in space), hardware-in-the-loop mode with very small latency and high internal frequency update (1 kHz), multi-frequency, up to 200 channels, all typical synchronization interfaces, and the ability to generate any additional signal for realistic simulation (jamming, spoofing, multipath, etc.).
The Constellator product is available in different ranges, from an entry-level unit supporting L1C/A up to a six-signal-frequencies/200 channels rack, supporting the most demanding configurations.
Constellator is used extensively in the aeronautic, space and defense industries, where the requirements are highly demanding. Constellator has been carefully evaluated and selected by major industrial companies and agencies worldwide, and is used to test aircraft receivers, spacecraft, launchers and similar systems for defense and armies. Particularly in the space domain, Constellator implements the most accurate models (earth gravity, drag, etc.) needed to achieve “meter-precision” in standalone mode around a complete orbit.
Constellator is based on modern, powerful software-defined radio (SDR) systems, which make it capable of extreme adaptability and upgradeability after purchase, even without any hardware upgrade. Though a high-end simulator, it is cost-effective because of its software-based architecture; instead of requiring one RF stage per signal, it requires just one per frequency band used.
The Echo Record and Playback unit allows users to record real-life signals and environments and replay them in the laboratory, which is always more realistic than any simulation.
Echo is typically used to replay predefined complex and very long realistic scenarios, avoiding the need to use costly satellite simulators for long-run tests or for production tests.
Echo offers three RF channels of 100-Mhz bandwidth each, 16 bits I, 16 bits Q, and more than 10 hours of record and replay duration. As such, it is high-end record/replay equipment, offering high-end replay fidelity.
www.syntony-gnss.com
Email: François Goudenove, chief sales officer, [email protected] (ask François for the contacts of distributors in the U.S., Europe, India, China, South Korea, Japan.)
Phone: +33.5.81.319.919
For users responsible for mission-critical positioning, navigation and timing (PNT) applications, the Spectracom GSG series of GPS/GNSS simulators is an essential tool to evaluate risk of jamming, spoofing or other threats.
Spectracom GSG-5/6 series simulators are an easy-to-use and feature-rich way to harden GPS-based systems without the limitations of testing from “live sky” signals. The Spectracom platform approach allows users to buy only what they need today and upgrade later. The adaptability of the GNSS RF generation platform can extend to applications for intelligent repeating.
Test solutions
Position accuracy and dynamic range/sensitivity
Simulate movements/trajectories anywhere on or above Earth
Sensitivity to GPS impairments: loss of satellites, multipath, atmospheric conditions, interference, jamming and spoofing
Conducted or over-the-air RF
GPS time-transfer accuracy
Effect of leap-second transition
Multi-constellation testing
Modernization signals/frequencies
Keyless military SAASM, dual-frequency and survey-grade receiver testing
Application packages for RTK, CRPA (controlled radiation pattern antennas)
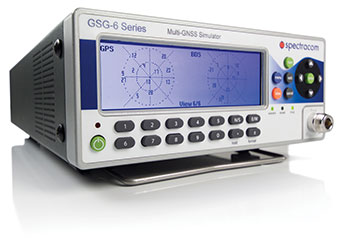
The GSG-6Series 64-channel multi-frequency, advanced GNSS simulator is powerful enough for any cutting-edge test program. GPS, GLONASS, Galileo, Beidou, QZSS and NAVIC (IRNSS) signals are available across multiple frequencies. It is designed for military, research and professional applications.
The GSG-5Series 16-channel multi-constellation L1-band GNSS simulator is designed for commercial development/integration programs. For users developing commercial products with GNSS capability, the GSG-5 will shorten test programs with confidence.
The GSG-51 single-channel signal generator is designed for one purpose — fast, simple go/no-go manufacturing test and validation, ensuring the manufacturing line is operating at full capacity with confidence in quality.
The software-based GNSS receiver allows customers to add full GPS functionality with design flexibility and long-term upgradeability at a minimal cost, low power and no physical size to today’s cost-sensitive internet of things (IoT) applications, according to Cadence Design Systems.
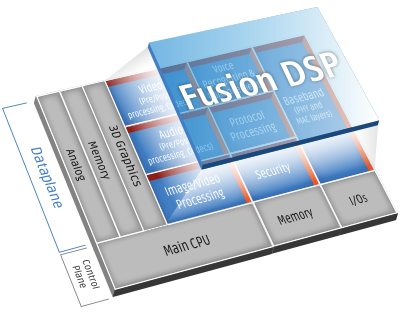
To get the lowest possible power, GSN accelerated the performance of its GPS software receiver by creating several custom instructions to run on the Tensilica Fusion F1 DSP. As a result, the GPS software requires less than 110 MHz for full 12-satellite functionality.
Additionally, with this software-based solution, customers can reduce the overall processor requirements to meet less-demanding location-based use cases such as asset tracking.
“The Tensilica Fusion F1 DSP delivers outstanding performance for the implementation of our GNSS receivers, providing a low-power footprint required for IoT applications,” said Eli Ariel, CEO at GSN. “This enables customers to easily upgrade their Fusion F1 DSP-based designs to future satellite systems such as Beidou, GLONASS and Galileo via software. By leveraging several customized instructions in the Fusion F1 DSP, we were able to keep the required processor speed at the same frequency compared to DSPs with more than three times the processing power.”
“GSN’s software-based approach for GNSS allows our Fusion F1 DSP customers to precisely scale their GNSS receiver requirements to meet their applications needs,” said Gerard Andrews, group director marketing, at Cadence. “The availability of GSN’s technology on this low-power DSP platform allows our customers to add location-based services at minimal cost and power.”
The Tensilica Fusion F1 DSP offers low-energy, high-performance control and signal processing for a broad segment of IoT/wearable markets. This highly configurable architecture is specifically designed to excel at always-on processing that requires a merged controller plus DSP, ultra-low energy and a small footprint.
The DSP is efficient in running the narrowband wireless communications standards typically associated with IoT device communications, including protocols such as Bluetooth Low Energy, Thread and Zigbee using IEEE 802.15.4, Wi-Fi 802.11n and 802.11ah and GNSS.
Korea will build its own navigation satellite system by 2034, providing independent positioning and navigation signals over an area spanning a 1,000-kilometer radius from the country’s capital, Seoul.
The Ministry of Science and information and communications technology (ICT) announced that it would finalize a plan for the Korean Positioning System (KPS) at a Space Committee meeting on Feb. 5.
According to a preliminary statement from the Ministry of Science and ICT, the KPS initiative will develop a ground test in 2021, core satellite navigation technology by 2022 and begin actual satellite production in 2024. The system will comprise a total of seven navigation satellites, three of them geostationary above the Korean Peninsula.
Figure from the 2016 paper shows a conceptual view of real-time WADGPS operation. The reference station transmits observation data at 1 Hz frequency to the master station. The master station is operated in real time and creates correction information and basic integrity information thereby configuring a message. A message is sent to the satellite communication simulation device according to its own transmission protocol. The satellite communication simulation device performs broadcasting of WADGPS correction information into the L1 band. A message created in every sec is coded with reserved GPS PRN C/A code and modulated with L1 frequency. Since additional correction information transmission medium such as geostationary orbit satellite or pseudolite is not considered in this study, radio frequency (RF) signals are created using simulation devices and performance was verified while connecting the signal with user receivers via cable. Additionally, a commercial communication network was used to transfer correction messages in order to verify user performance, which is located remotely. (Image: Korean Journal of Positioning, Navigation, and Timing)
Korea currently relies on the U.S. GPS system, which has suffered repeated local area jamming emanating from North Korea.
“As the GPS becomes a necessity in everyday life, broken signals for any reason can set off a nationwide chaos,” said an official for satellite navigation at the Korea Aerospace Research Institute (KARI).
Officials stated the the KPS will also improve available un-aided accuracy of GPS in its service area from about 10 meters now to less than one meter.
“Advanced nations are trying to secure strong GPS capabilities by sending up satellites to prevent a chaos that can take place while they depend on other nations’ satellites,” stated the KARI spokesperson.
The initiative appears to be separate from the Korean Wide Area Differential GPS System, whose development was the subject of a 2011 paper presented at the Institute of Navigation (ION) International Technical Meeting. The abstract for that paper stated:
“[The] project is scheduled for 2010 to 2014 under the contract with the Ministry of Land, Transport and Maritime affairs (MLTM). After that, Korea will launch a geostationary multifunctional satellite with a navigation payload which will be broadcasting augmenting signals for GPS.”
In March 2016, the Korean Journal of Positioning, Navigation, and Timing published a paper titled “Performance Analysis of WADGPS System for Improving Positioning Accuracy,” by Hyoungmin So , Jaegyu Jang, Kihoon Lee, unpyo Park and Kiwon Song. Its conclusion section stated:
“In this paper, configuration of observation reference stations and master station and initial experiment results were presented to verify accuracy correction performance of the WADGPS. The wide area correction algorithm was implemented using eight reference stations and one master station. For the initial performance verification, static and dynamic experiments were conducted. The experiment result showed that the static experiment had a horizontal accuracy performance with a level of 1 m (95 percent). In the dynamic experiment using a vehicle, performance degradation occurred compared to that of static experiment. The reason for this was due to the measured value error at the user receiver caused by multipath and visibility limitation. In summary, the implementation and performance of the algorithm of early stage were verified. For the future study, user operation characteristics will be considered and additional performance analysis on created correction information will be conducted.”
 The United Kingdom and the European Union (EU) continue locked in conflict over Galileo post-Brexit, much akin to a divorce dispute over the children.