This photo shows drifting icebergs from the Amundsen during research expedition. (Photo: courtesy of Greg McCullough, University of Manitoba)
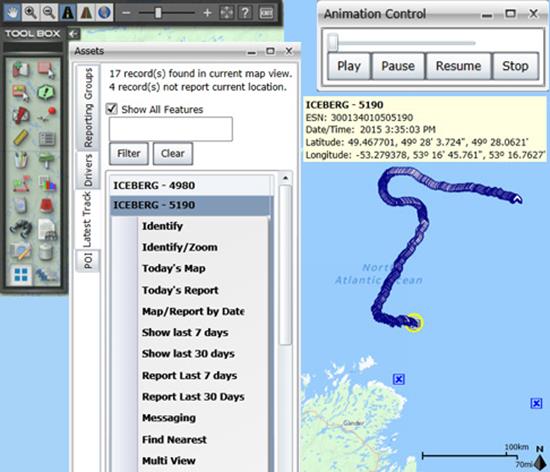
A Canadian expedition team used GeoDecisions’ GeoILS platform to help track icebergs during a voyage to better understand how icebergs drift. An intelligent location server using the EsriArcGIS platform, GeoILS enables users to monitor and locate assets and facilitate quick and coordinated responses.
GeoDecisions, an information technology company specializing in geospatial solutions, partnered with Solara Remote Data Delivery Incorporated, Canada’s Carleton University and Esri during the project.
Led by University of Manitoba Scientist David Barber, the crew of Canadian Coast Guard Icebreaker Amundsen sailed off the coast of Newfoundland and Labrador to research ice hazard mitigation, the effects of climate change, and polar region technology requirements. GeoILS location intelligence helped crew members visualize, analyze, and leverage project-pertinent data.
“During the expedition, researchers and scientists used GeoILS to assess drifting through sensor monitors attached to the icebergs,” said Brian Smith, vice president of commercial solutions with GeoDecisions. “In addition to reporting and notifications, GeoILS provided the project team with maps that were tailored by selecting desired iceberg information and the geographic area of interest based on user-defined criteria.”
Above is a representative snapshot of GeoILS’ features and range of functionality used during the Canadian iceberg expedition.
GeoDecisions’ data portal was used with Iridium Solara tracking devices during the iceberg research project. “We are excited to provide tools to scientists who are gaining critical insights into the behavior of icebergs and global climate change,” said Tom Tessier, president of Solara Remote Data Delivery Incorporated.
Solara Field Tracker 2000.
“GeoILS and the satellite tracking beacons worked very well during this project,” added Derek Mueller, assistant professor and physical geography program supervisor with Carleton University. “Thanks to our partners’ efforts, we now have a great new suite of tools for examining our data.”
Geospatial Solutions’ and GPS World‘s Art Kalinski reports from eMerge Americas, held May 4-5 in Miami. Florida International University had numerous technology displays, but its autonomous catamaran doing bathymetry data collection and mapping was impressive.
Lockheed Martin Corporation demonstrates its Indago UAS at Unmanned Systems 2015, held May 4-7 in Atlanta. The Indago payload system features a quick disconnect adapter which allows the operator to choose the appropriate payload for the mission, according to Lockheed Martin. The payloads are available for a variety of different applications, including agricultural, mapping, inspection and ISR.
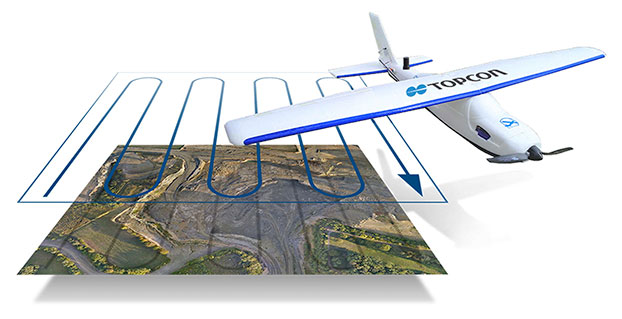
Topcon Positioning Systems has received a national exemption from the Federal Aviation Administration (FAA) that allows for operation of its unmanned aerial system (UAS) in the United States. The exemption covers the operation of the Sirius Basic and Sirius Pro for aerial data collection.
The Sirius Pro and Sirius Basic systems are designed to produce accurate solutions for the automated mapping of a wide range of sites — regardless of terrain — including construction sites, mines and quarries. The UAS are designed for land surveying, transmission line and pipeline inspection, and agricultural operations such as field mapping and livestock management. With the Sirius Pro model, Topcon eliminates the need for ground-control points by combining real-time kinematic (RTK) GNSS solutions with precision timing technology to provide accurate mapping results, Topcon said.
“This exemption is exciting news for the U.S. marketplace,” said Eduardo Falcon, executive vice president and general manager of the Topcon GeoPositioning Solutions Group. “It allows Topcon to be a resource for end-users and provide UAS demonstrations and training. Aerial data collection has a strong impending impact on all the industries we serve, and the possibilities for survey, construction, and agricultural applications are seemingly limitless.
“Building on the success the Sirius models have already seen in the European and Australian markets, this exemption allows Topcon to expand on that momentum in the U.S.,” Falcon said.
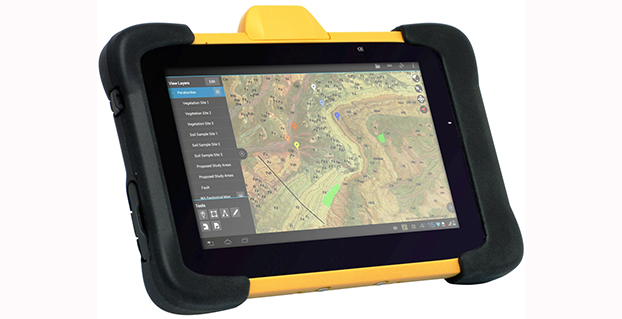
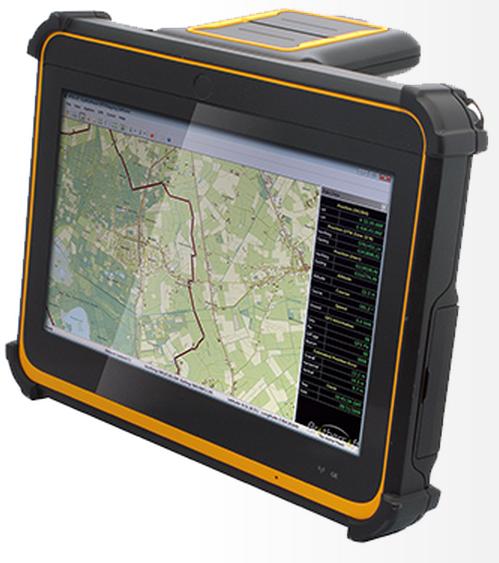
DT Research Inc. has launched a new line of rugged tablets with the GNSS modules for surveying and mapping applications. The DT391GS, DT395GS and DT307GS rugged tablets feature integrated high-accuracy GNSS receiver modules with built-in antenna for seamless data capture, the company said.
Built to travel and provide reliable operations in the real world, the tablets are designed for field work in mapping, geographic information systems (GIS), and accurate synchronization, tracking and networking.
The DT391GS combines a 9-inch sunlight-readable, capacitive touch display with an energy-efficient Intel dual-core processor in a compact, durable package. With the high-accuracy GNSS module options (Hemisphere or Trimble), the foldable antenna, and Windows or Android operating system. The DT391GS also offers protection in demanding environments with IP65 and MIL-STD-810G ratings for dust and water, and shock and vibration resistance.
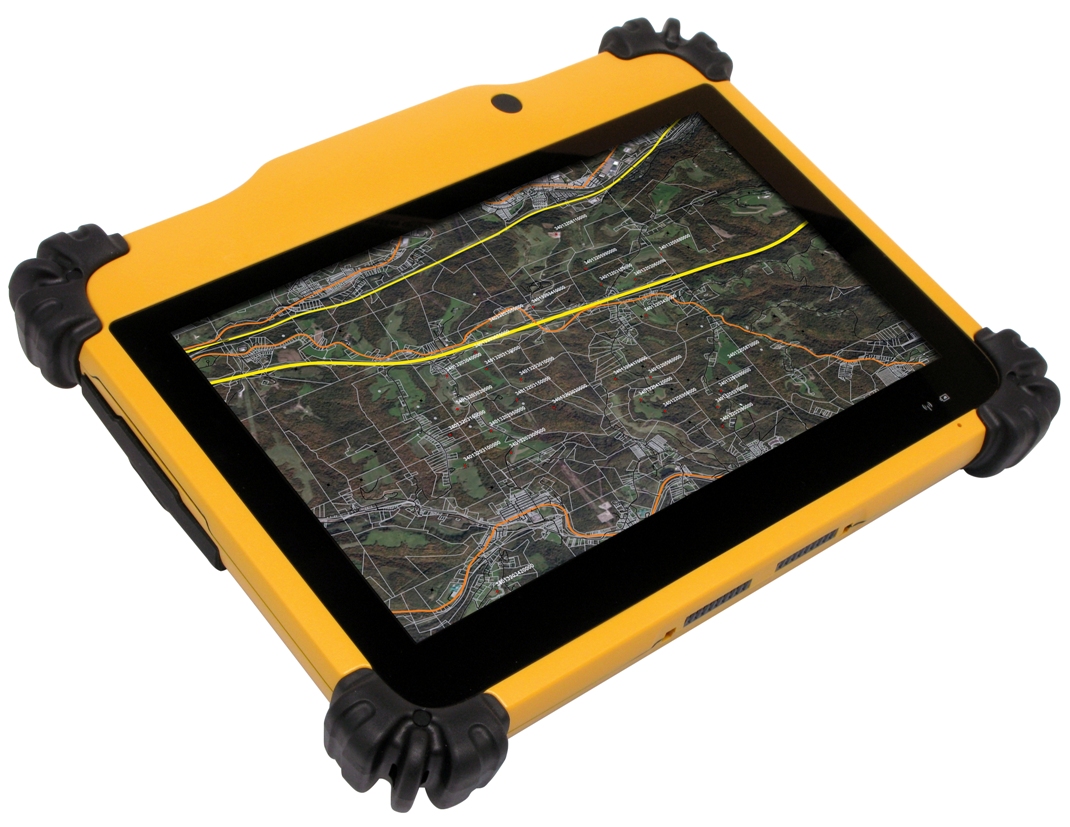
The DT395GS tablet.
The DT395GS offers a 9-inch sunlight-readable capacitive touch screen, an energy efficient Intel dual-core processor, and a choice of Windows or Android operating systems. The GNSS positioning module has u-blox GNSS module. The IP65 rating, and military-standard MILSTD-810G and MIL-STD-461F ratings, as well as wide temperature range, make the DT395GS reliable even in harsh, mission-critical environments.
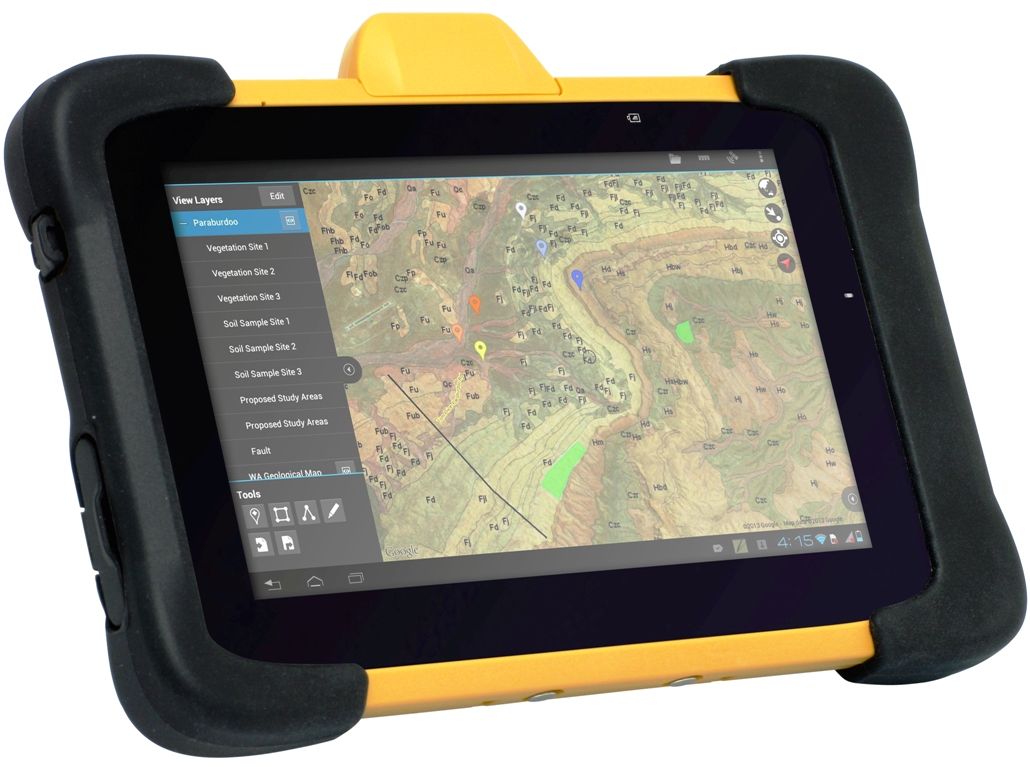
The DT307GS GNSS tablet features a brilliant 7-inch capacitive touch screen and a quad-core, energy efficient processor with a built-in, high-accuracy u-blox GNSS module. The size and weight of the DT307GS make this tablet portable for long-term handling in the field, DT Research said.
The DT307GS tablet
All of the DT Research Rugged GS Tablets offer hot-swappable batteries for continuous operation, enabling real-time project efficiency between staff in the field and in the office. With wireless support for Bluetooth, 802.11, WCDMA and HSPA+ connectivity and optional GSM networking, the tablets keep staff connected from any location.
The DT391GS and DT395GS have Trusted Processing Module (TPM) encryption for security support, and a choice of Microsoft Windows Embedded Standard 7 or 7 Professional, or Android operating system making these tablets flexible to integrate with existing applications.
An optional 5-megapixel camera offers another data capture tool to record visual information, and an optional 3G cellular data module provides data connectivity for navigation and real-time data transfer, DT Research said.
The DT391GS, DT395GS, and DT307GS are available now, form more information, contact DT Research at [email protected].
DT Research Inc. has launched a new line of rugged tablets with the GNSS modules for surveying and mapping applications. The DT391GS, DT395GS and DT307GS rugged tablets feature integrated high-accuracy GNSS receiver modules with built-in antenna for seamless data capture, the company said.
Built to travel and provide reliable operations in the real world, the tablets are designed for field work in mapping, geographic information systems (GIS), and accurate synchronization, tracking and networking.
The DT391GS combines a 9-inch sunlight-readable, capacitive touch display with an energy-efficient Intel dual-core processor in a compact, durable package. With the high-accuracy GNSS module options (Hemisphere or Trimble), the foldable antenna, and Windows or Android operating system. The DT391GS also offers protection in demanding environments with IP65 and MIL-STD-810G ratings for dust and water, and shock and vibration resistance.
The DT395GS tablet.
The DT395GS offers a 9-inch sunlight-readable capacitive touch screen, an energy efficient Intel dual-core processor, and a choice of Windows or Android operating systems. The GNSS positioning module has u-blox GNSS module. The IP65 rating, and military-standard MILSTD-810G and MIL-STD-461F ratings, as well as wide temperature range, make the DT395GS reliable even in harsh, mission-critical environments.
The DT307GS GNSS tablet features a brilliant 7-inch capacitive touch screen and a quad-core, energy efficient processor with a built-in, high-accuracy u-blox GNSS module. The size and weight of the DT307GS make this tablet portable for long-term handling in the field, DT Research said.
The DT307GS tablet
All of the DT Research Rugged GS Tablets offer hot-swappable batteries for continuous operation, enabling real-time project efficiency between staff in the field and in the office. With wireless support for Bluetooth, 802.11, WCDMA and HSPA+ connectivity and optional GSM networking, the tablets keep staff connected from any location.
The DT391GS and DT395GS have Trusted Processing Module (TPM) encryption for security support, and a choice of Microsoft Windows Embedded Standard 7 or 7 Professional, or Android operating system making these tablets flexible to integrate with existing applications.
An optional 5-megapixel camera offers another data capture tool to record visual information, and an optional 3G cellular data module provides data connectivity for navigation and real-time data transfer, DT Research said.
The DT391GS, DT395GS, and DT307GS are available now, form more information, contact DT Research at [email protected].
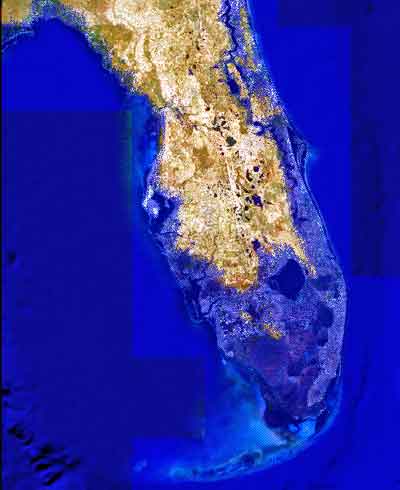
Image showing projected Florida flooding, from flood.firetree.net, using Google Earth with NASA data. Image from flood.firetree.net, using Google Earth.
Surveyors, prepare to get your feet wet. Global warming is about to hit you in the job list. By 2050, a majority of U.S. coastal areas are likely to be threatened by 30 or more days of flooding each year. This according to a December report in Earth’s Future, a journal of the American Geophysical Union.
[Parenthetically, the next issue of Survey Scene, in May, will be written by an actual geodesist. Until then, you have to put up with GPS World’s editor in chief — by no means a surveyor. Patience.]
The study used data from National Oceanic and Atmospheric Administration (NOAA) tide gauges to show the annual rate of coastal floods has accelerated in recent years. These are now five to 10 times more likely today than 50 years ago — and getting worse.
Mitigation decisions could range from retreating further inland to coastal fortification or to a combination of “green” infrastructure using both natural resources such as dunes and wetland, along with “gray” man-made infrastructure such as sea walls and redesigned storm water systems. And that’s not even mentioning such basics as redrawing property lines. Any way you look at it, surveyors are going to be involved.
“As communities across the country become increasingly vulnerable to water inundation and flooding, effective risk management is going to become more heavily reliant on environmental data and analysis,” said Holly Bamford, NOAA acting assistant secretary for conservation and management.
The recent U.S. Hydro 2015 conference in National Harbor, Maryland — an area particularly called out for vulnerability to the oncoming floods — naturally found a lot to talk about in this and related areas of interest for surveyors, with session tracks including: Effects of Climate Change on our Oceans and Waterways; Coastal and Ocean Mapping Initiatives; Advances in Unmanned System Technology, and several more.
Some of the papers presented that GPS World found of interest, and hopes to present or encapsulate in some form in the near future, include:
Resolving Systematic GPS Interference from Aeronautical Distance Measuring Equipment during Mission-Critical Shallow Water Multibeam Surveys
GPS Water-Level Buoy for Hydropgraphic Survey Operations
Examining the Uncertainty Associated with the Establishmenbt of an Ellipsoid to Chart Datum Separation Surface Using GNSS Buoys
Comparison of Horizontal and Vertical Resolvable Resolution between Repetitive Multibeam Surveys Using Different Kinematic GNSS Methods.
And those just came from the poster sessions. In the technical sessions, Jack Riley from the NOAA Coast Survey’s Hydrographic Systems and Technology Program presented a GPS Buoy Water Level Uncertainty Case Study.
Data from on High
Since you can’t get at a coastline from all angles — with any degree of stability, that is — data from overhead, sometimes far overhead, proves invaluable. Such as that provided by aerial digital imagery, LiDAR, and increasingly, satellites.
Because digital aerial images are already in electronic form, they can quickly be processed and made available to users. Most of the special cameras in use nowadays provide direct georeferencing capability, which allows camera position and orientation to be determined automatically using GPS and inertial measurement equipment. An entire mini-industry has grown up around integrating aerial data with that taken from ground surveys.
Light detection and ranging (LiDAR), a remote sensing system, became available for commercial topographic mapping in 1993. An airborne laser scanning system paired with a kinematic GPS receiver and an inertial navigation system can calculate and produce a highly accurate spot elevation. It is possible to obtain point densities that would likely take months to collect using traditional ground survey methods. The National Geodetic Survey (NGS) is currently implementing LiDAR into their shoreline mapping production process.
Our Record So Far
Coverage of these salty issues has been sparse in GPS World and associated newsletters, but not entirely absent. In 2006, the May issue featured “GPS Buoys Nautical Measurement.”
In 2008, Richard Langley edited an Innovation column on “Tsunami Detection by GPS,” featuring work for which co-author Attila Komjathy eventually won a GPS World Leadership Award in 2013. And in 2010, Langley brought forth an Innovation column on “Monitoring Water Level with GNSS.”
And way, way back in 2005, we published “Abreast of the Waves: Open-Sea Sensor to Measure Height and Direction.” This was prior to our digital era, so until we can scan a paper copy into here, we’ll simply give the abstract: “Accurate and timely information on open-sea wave conditions can help in preventing large-scale maritime disasters. This article describes a new, low-cost Global Positioning System (GPS)-based sensor that measures wave height with an accuracy of several centimeters and direction with an accuracy of 5 degrees. The receiver is mounted on a buoy, and a high-pass filter is used to extract the movement of the buoy and thus minimize GPS positioning errors. The data provided by the sensor is intended to improve wave prediction models. In addition, since this GPS-based sensor transmits only analyzed ocean wave data, it reduces the volume of data and leads to lower operating and acquisition costs. The article describes the concept of the GPS-based wave sensor, algorithms that are used for filtering and extracting wave data, as well as the results of open-sea trials.”
So there’s more to come. Watch this space. In the meantime, we leave you with Bob Dylan’s prophetic words, circa 1967.
Well, it’s sugar for sugar And salt for salt If you go down in the flood It’s gonna be your own fault.
Ride service Uber is buying mapping and search startup deCarta, reports Mashable, which said it learned of the deal from an Uber representative.
The deal was expected to close earlier this month. Uber plans to use deCarta’s technology and talent to fine-tune its products and services that rely on maps, including UberPOOL, the smartphone-based ride-sharing app.
Thirty out of 40 deCarta employees will remain with the company, including Kim Fennell, chief executive officer and president, Mashable said. deCarta will continue to operate as a wholly-owned subsidiary of Uber, but will use its own name.
Founded in 1996, deCarta is privately held, and headquartered in San Jose, Calif., with international offices and distributors in Germany, China, Brazil and South Africa. deCarta is a global location-based services (LBS) technology company that provides specialized geospatial technologies for online mapping, routing, navigation, geocoding, local search and geo-data integration and processing. The company’s platform is used by high-volume LBS applications and services in the mobile, Internet, enterprise-fleet and automotive markets. Customers and technology partners include Samsung, Inrix, T-Mobile, FullPower MotionX GPS Drive, Appello, Denso, Ford, GM OnStar, Masternaut, Wireless Matrix, eMapgo, Nokia/HERE, Spot-On-Time, Telstra/Sensis, TomTom, WHERE/eBay.
In February, Uber announced a partnership with Starwood Hotel and Resorts where Starwood Preferred Guest members earn points towards free hotel stays for every dollar spent riding Uber.
Esri and RouteSmart Technologies, Inc., are collaborating to help postal organizations deliver packages reliably, efficiently, and accurately. The companies provide comprehensive dynamic routing solutions based on Esri’s ArcGIS platform.
National postal and global and regional parcel delivery services, including Whistl, Posti, and Swiss Post, are among the customers that leverage these routing solutions. Most customers have experienced cost savings of 15 percent, on average, through reduced working hours, mileage, and new vehicle acquisition. Customers also report growth opportunities through opening new lines of distribution business to support the burgeoning e-commerce delivery segment.
“By integrating location-based analysis with a postal organization’s traditional business systems, such as sorting machines and address management systems, we are solving territory planning and route management challenges these organizations are facing,” said Chris Walz, vice president of sales and marketing for RouteSmart Technologies. “With our help, they can align to the new realities of postal and parcel distribution economics brought on through the growth of e-commerce shipping volumes and declining letter volumes.”
Esri and RouteSmart will share how they are helping postal organizations continue to be drivers of innovation in transportation and operational efficiencies at the European Post and Parcel Services Conference in Vienna, Austria, March 24–26.
“One of the biggest upcoming challenges for the postal industry will be the adoption of fully automated vehicles for deliveries,” Hall said. “With our partner RouteSmart, we provide a path for migration with the help of advanced location intelligence, optimization, and analysis tools.”
Fugro has released an upgrade to its EZ-FRISK package — seismic hazard analysis software used by consultants and academics. The new upgrade includes the Next Generation West 2 ground motion prediction models, and improved user interface along with software fixes.
By early 2015, the software will incorporate the U.S. Geological Survey (USGS) 2014 National Seismic Hazard Maps for the continental U.S., with the exception of California, and will include the Uniform California Earthquake Rupture Forecast (UCERF) version 2. Fugro provides UCERF version 3 ground motion reports for California as an independent consulting service.
The EZ-FRISK single site probabilistic and deterministic tool enables engineers and geoscientists to study seismic hazards in an easy and flexible manner. As with earlier releases, EZ-FRISK has modules for probabilistic and deterministic seismic hazard analysis (PSHA/DSHA) (with globally available regional seismic source models and a database of ground motion prediction models); spectral matching (adjusting an accelerogram to match a target response spectrum, while preserving realistic time-dependent characteristics of the ground motion); and site response (calculating the ground motion at the surface given a bedrock ground motion and the layers of soil and rock that overlay the bedrock at the site).
EZ-FRISK can quickly create design ground motions for engineering purposes that use earthquake modeling and statistical analysis to accurately reflect the desired level of safety, provide realistic time-dependent behavior, and consider site-specific soil and rock layering.
The model was developed using a regional grand inversion process. The outputs are in the form of participation rates, rather than individual faults with defined slip rate or segmentation models. Instead faults are assigned magnitude frequency distributions that include participation of adjoining faults based on over 200,000 rupture scenarios.
“Fugro continues to extend its legacy of developing state-of-the-art software for the industry. We listen to our clients, and our engineers and geoscientists work closely with them to ensure that we provide the necessary tools for performing seismic hazard analyses worldwide,” said Recep Yilmaz, president of Fugro Consultants.
PD Ports is streamlining the way it shares hydrographic data by using GIS software from British software developer Cadcorp. PD Ports is a port, shipping and logistics company headquartered in Middlesbrough, UK, where it owns and operates Teesport — a major deep-water complex and one of the largest container ports in the North of England.
Teesport is a major deep-water complex and one of the largest container ports in the North of England, handling around 40 metric tons of cargo per year, according to Captain Jerry Drewitt, Harbor Master for Teesport and Hartlepool. “Our first priority is to ensure the safe movement of the considerable amount of river traffic handling this cargo. We rely a lot on hydrographic survey charts which provide an up-to-date record of the depth of the river in berths, approaches, and channels.
“Until recently, our survey department not only carried out hydrographic surveys, but also produced the associated charts. This is changing as we have come to recognize that having surveyors spend time on creating cartography was an unnecessary step in the sharing of hydrographic data, and was actually delaying data publication.“
Drewitt continues, “Hydrographic charts don’t only depict depth data. They also show topography and contextual data about features and boundaries along the river. The position of these features and their attributes, tend to be relatively stable — certainly when compared to the constantly changing topography of the riverbed. We wanted the survey department to concentrate on recording this more dynamic hydrographic data.”
“The less dynamic data — topography, assets, boundaries, Admiralty Charts, Ordnance Survey MasterMap, and aerial photography — can be managed as separate overlays in our GIS, Cadcorp SIS Map Modeller,” Drewitt said.
“We now create composite hydrographic charts by displaying the hydrographic data the surveyors capture, against whatever reference layers are appropriate for a task in hand,” Drewitt said. “This is done in the knowledge that all features will be represented in their true location. We now take XYZ soundings directly from the survey department; drag and drop this data into the Cadcorp GIS, and pass it through a simple filter to indicate three categories of depth zones. Red indicates where the river is too shallow, blue where it is OK, and white where it too deep. “
The outcome of these changes allows the harbor master to share information with the Vessel Traffic Service and pilots much more quickly than before. For example, whenever there is suspected slippage in the river bed, the survey department can be alerted to make a new survey of the affected area. The outcome of their echo-soundings will exported as XYZ files to Map Modeller. The GIS is used to delineate any areas which are deemed to be out of bounds. It is then a simple matter to insert a map into a Word document as a “Shoaling Notice” that can be distributed by email.
Drewitt hopes his deputy harbor masters and pilots eventually will be able to accept map data from Teesport directly in digital form and in real time. However, for the moment, GIS is playing a transitional role somewhere between a map creator and a map viewer. This can be seen in current project where Captain Drewitt is using GIS to match vessels to available berths. He uses the GIS to create and display templates of vessels originally designed as DWG files in AutoCAD. By superimposing these templates, along with tugs and towlines, over maps and charts, it becomes possible to assess the maximum size of vessels that can be accommodated in different berths.
“It is easy to generate a family of templates, and a simple matter to superimpose them against maps,” Drewitt said. “While I can’t yet share them online, I can take map representations to meetings, where the serve an important evidential role.”
“GIS applications don’t have to be complex to deliver real business benefit,” said Mike O’Neil, CEO of Cadcorp. “Teesport have shown this. Their use of GIS isn’t about intricate analysis and modelling. On the contrary, it is about the value you get by bringing together different data sets, quickly and easily. The combined value of these different data sets is often much greater than the sum of its parts.”