Carlson Software has released its Scan2K Laser Scanner, a versatile, fast, easy-to-use solution for the creation of accurate 3D survey data up to a range of 2K (2,000) meters. Carlson introduced the product at the Pennsylvania Society of Land Surveyors’ 2020 Conference.
Carlson’s Bradley Husack, Special Projects Engineer, and Michael Hyman, Regional Director with the Scan2K at the Pennsylvania Society of Land Surveyors’ conference. (Photo: Carlson)
Built with surveyors in mind, the Scan2K is at home in the field with its weather-proof housing, user-friendly sunlight-visible touch screen interface with simple, menu-driven operations for quickly collecting and georeferencing point cloud data. With an integrated high-resolution camera, inclinometers, a compass, and an L1 GNSS receiver, the Scan2K can be deployed in many environments and orientations, including mobile operations.
Carlson’s partner on the Scan2K project is Teledyne Optech, a world leader in 3D survey systems. Carlson will be the exclusive global distributor of the OEM Scan2K solution.
“The Scan2K addresses the diverse range of applications for a laser scanner in the surveying and mining industries,” said Bradley Husack, a Special Projects Engineer at Carlson. “Carlson is bringing to market an all-in-one solution that now leads the market in versatility, speed, and value.”
The Carlson Scan2K has a simple, sunlight-visible touchscreen interface. (Photo: Carlson)
Beyond its impressive 2,000 meter range, the Scan2K also has short- and medium-range modes, as well as the capability to record over 500,000 points per second, all within the chosen scanning target window.
Additionally, each laser pulse from the Scan2K records up to four returns, providing the capability to record the first return for a blocking object (such as a leaf) as well as the last return for an object behind it (such as a wall), and the versatility to exclude one or the other.
The Carlson Scan2K comes bundled with ATLAScan software, a powerful yet simple solution for registering the point cloud, as well as Carlson Point Cloud Advanced for feature extraction into Carlson’s suite of CAD office products.
The Scan2K comes ready to be equipped with an additional external camera, an external GNSS receiver, or for mobile operation.
Whether on a tripod, a vehicle, or another moving platform, the performance offered by the Scan2K easily makes it a versatile terrestrial laser scanner for the market.
Aerial imagery company Nearmap has acquired technology and assets from Pushpin, a deep learning and analytics technology company that extracts data from 3D models to provide roof geometry insights to a variety of sectors including roofing, solar and government.
The technology acquisition allows Nearmap to rapidly extract and disseminate roof geometry from its wide-scale 3D models and offer a new form of location content to its customers.
‘‘By acquiring Pushpin’s 3D geometry extraction technology and pairing it with our rich data, we bring the best of both worlds together at unprecedented scale’’ said Rob Newman, Nearmap CEO. “Over the past couple of years, we’ve evolved our offering from 2D imagery to a multi-product portfolio, and this acquisition is an important milestone in our approach to continue adding new content types for our customers. This addition aides our company mission by providing 3D geometry data at unmatched speed, thereby changing the way our customers perform their work.”
With this new technology, Nearmap can provide a semi-automated calculation and extracted representation of any roof geometry within an hour, significantly reducing turnaround time. The combination of Nearmap’s 3D content and Pushpin’s geometry extraction technology opens up a diverse range of use cases, enabling businesses to fast-track job estimation, determine solar irradiance, plan drone delivery routes and model 5G propagation.
“The addition of Pushpin’s 3D geometry extraction technology into our large-scale 3D reality models will enable us to further evolve our offering and produce at scale roofing geometry,” said Tom Celinski, Executive Vice President, Technology and Engineering at Nearmap. “With the added ability to provide roof geometry data, we will be able to provide even deeper insights on what’s happening on the ground, and help businesses and government organizations transform the way they work and do their job more efficiently.”
The roofing and solar industries are poised for significant growth. Currently, 1% of the United States population has solar panels on their homes. According to the Solar Energy Industry Association (SEIA), total U.S. solar capacity will more than double over the next 5 years.
Additionally, a significant number of U.S. residential homes have their roofs replaced every year due to roof damaging storms and changes in roofing trends and material. This new product offering from Nearmap is poised to significantly impact these markets, as companies are expanding their use of technology to assist with tasks such as roof material and project quoting through reports, project management through roofing specific software, and customized sales and marketing tools for the roofing industry.
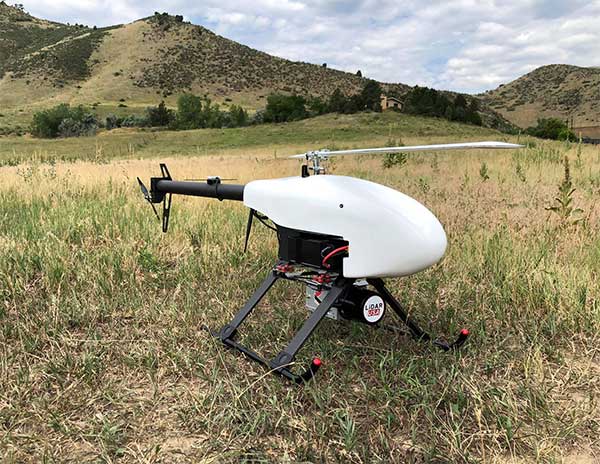
Lidar USA is partnering with Innoflight Technology, a manufacturer specializing in UAV systems for surveying, mapping and inspection.
As a result of the partnership, Lidar USA is offering the Galaxy 950 platform to carry any of its sensors while consistently providing flight times over 30 minutes.
Based in Somerville, Alabama, Lidar USA specializes in the design and integration of economical lidar sensors.
Innoflight and Lidar USA’s partnership is another step for both companies to offer turn-key solutions focused on quickly and safely acquiring high-quality data.
Innoflight designed the Galaxy 950 to simplify the flying aspect of remote sensing with UAVs. The helicopter includes a parachute, automatic takeoff and landing, and extended visual-line-of-sight capabilities to maximize productive time.
For corridor/electric utility line projects, the Galaxy 950 pairs well with the recently announced CL-90 by Teledyne Optech. As the first integration partner of the new compact lidar system, Lidar USA is offering maximum productivity at UAV flight ceilings while achieving improved canopy penetration and exceptional downward point density.
“Lidar USA and Innoflight Technology are both committed to customer success, and this partnership provides the whole package for lidar mapping solutions with UAV,” said Jeff Fagerman, CEO of Lidar USA. “Innoflight’s Galaxy 950 offers exceptional performance in safety, flight duration, and ease of use, which is what our customers need for their projects.”
The Galaxy 950 is now available from Lidar USA as an integrated package with any of their scanning systems.
How have improvements in mapping data-collection advanced other PNT technologies?
Tony Agresta
“Real-time positioning, navigation and timing (PNT) benefit from high-resolution aerial maps captured and published on a consistent basis. With sub 3-inch aerial photographs streamed through custom applications or instantly accessible solutions, governments and commercial use cases apply these maps for emergency 9-1-1 dispatch, routing guidance, and new information applications to inform citizens.” Tony Agresta
Nearmap
Ismael Colomina
“In principle, PNT shall be based on linear/angular motion sensors. However, since the origins of aerial triangulation down to contemporaneous hybrid multi-sensor systems, mapping and motion sensors have cooperated in PNT tasks. Current visual- and lidar-odometry are brilliant examples thereof.” Ismael Colomina
GeoNumerics
Members of the EAB
Tony Agresta Nearmap
Miguel Amor Hexagon Positioning Intelligence
Thibault Bonnevie SBG Systems
Alison Brown NAVSYS Corporation
Ismael Colomina GeoNumerics
Clem Driscoll C.J. Driscoll & Associates
John Fischer Orolia
Ellen Hall Spirent Federal Systems
Jules McNeff Overlook Systems Technologies, Inc.
Terry Moore University of Nottingham
Bradford W. Parkinson Stanford Center for Position, Navigation and Time
Terra Drone Europe, a group company of Terra Drone Corporation, has completed an aerial 3D survey and produced a 3D model of an offshore oil rig platform in the North Sea for Shell.
According to Terra Drone Europe, the platform complex that was surveyed was positioned several years ago when GNSS survey techniques were neither very advanced nor common. Several coordinates were known and as-build drawings were available, but Shell wanted to know the position of each and every element on the platform to facilitate accurate drill rig positioning.
Terra Drone Europe completed an aerial 3D survey and produced a 3D model of an offshore oil rig platform in the North Sea for Shell. (Photo: Terra Drone)
Thus, the company recruited Terra Drone Europe to capture the as-is conditions through a high-precision oil rig platform survey. According to Terra Drone, the survey was divided into two parts: one part dedicated to creating a 3D point cloud and the second to accurately check the position of the platform using GNSS readings.
Two GNSS receivers were installed at several different locations on each platform and used to log in the raw data which was later processed. When this data was combined with the 3D point cloud created by Terra Drone Europe, the coordinates of each asset on the platform structure were determined.
Terra Drone Corporation recently established new branches focusing on the oil and gas sector in Argentina, Angola, Kazakhstan and the United Arab Emirates. The company also formed a new branch to provide advanced nondestructive testing and inspection services to the oil and gas industry.
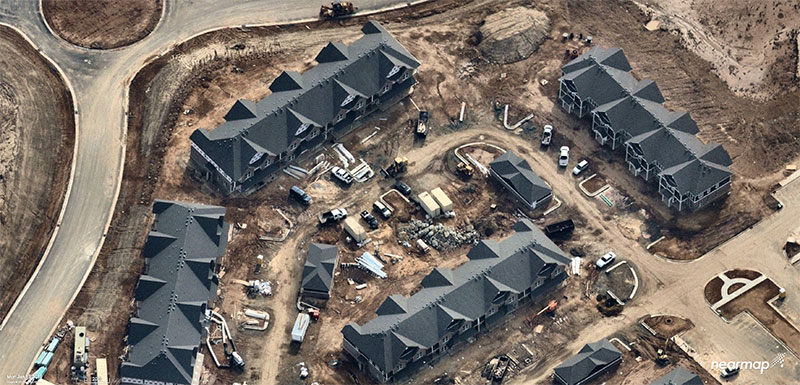
Government agencies are increasingly turning to high-precision aerial imagery to solve city-planning conundrums. Three recent case studies show how emergency 9-1-1 services gather data to provide updated maps to emergency services to get to the right locations as soon as possible; reveal how a city’s public works department streamlines data collection for more efficient infrastructure management; and how to give GIS professionals instant access to the most current information available — all in the cloud.
Photo: Nearmap
It’s said a picture is worth a thousand words. In the case of aerial imagery, where location data is packed into every pixel, a picture could save lives.
Emergency dispatch is just one type of government agency now relying on high-quality aerial imagery. With up-to-date georeferenced imagery of their own towns and counties, agencies are not only improving response to emergency calls, but also streamlining public works and enhancing city planning.
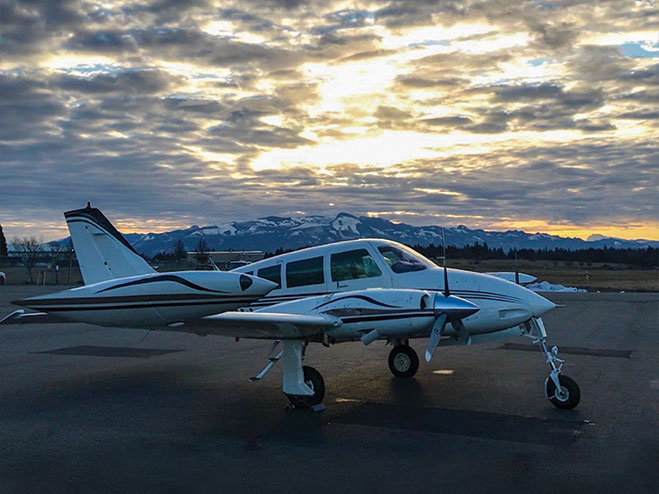
A company providing that imagery is Nearmap, which serves more than 8,200 organizations and businesses globally using small aircraft for image capture. The aerial mapping company provides high-quality imagery as a subscription service delivered through the cloud. Its photo maps are taken at least twice a year, with leaves both on and off the trees, to provide different views of locations in different seasons.
Nearmap’s patented camera system and software pipeline enables it to capture aerial photos, stitch them together into seamless digital maps, and publish the content online within days of capture. Above, Nike’s headquarters in Portland. (Photo: Nearmap)
Aircraft offers a huge advantage over unmanned aerial vehicle (UAV) or satellite imagery. Airplanes can cover much greater distances than UAVs, and pilots pay heed to the weather and fly below cloud layers to deliver the clearest visuals possible. Unlike space-based platforms, airplanes operate at lower altitudes, also increasing the resolution, and can fly on demand, unlike satellites that have set orbits dictating their periodicity for returning to a target area.
Nearmap’s powerful, patented technology allows it to deliver high-resolution aerial imagery as a service: orthographic (straight down) maps, multi-perspective panoramas and oblique aerial views — all at resolutions four times clearer than free satellite imagery.
Once photographed, the images are stitched together in the cloud in a matter of days, where they are available for viewing and analysis on desktop, tablet and mobile devices via a subscription service.
Nearmap’s proactive capture model is based on population — the larger the population, the more captures it takes per year. Nearmap images 88% of Australia’s population, 70% of the U.S. population, and 75% of the New Zealand population.
Nearmap captures many areas multiple times throughout the year; for many locations this gives customers a leaf-off and leaf-on view. Providing spring leaf-off captures allows customers a view of the ground that is typically obstructed by foliage the rest of the year.
The flight plans cover approximately 430 urban areas that are flown, captured and processed, and then served up via the MapBrowser in-browser tool, or supplied via application programming interface (API) for use in various design platforms. When a user subscribes to Nearmap, the capture is immediately available with any and all historical captures, without the need to pay for a dedicated flight.
“To capture imagery for a map, a plane has to crisscross over its own flightpath. Each sweep has to overlap the previous by approximately 70%,” explained William Tewelow, GPS World’s contributing editor for geointelligence. “Vertical (or nadir) is straight overhead. Oblique is everything else, but usually not exceeding 30% to either side because it distorts the structures and vertical features (parallax), makes mosaicking difficult, and shadows structures behind other structures.”
That said, oblique imagery is important for building 3D meshes for imagery point clouds, Tewelow said, as well as seeing various angles of a structure.
Following are examples of the creative — and surprising — ways government agencies are using Nearmap imagery to improve their services today, and prepare for future changes in their communities.
Better 9-1-1 address mapping
Shelby County is the largest county in Tennessee in both population (927,644) and geographic area (785 square miles). Memphis is the county seat, home to the county’s Emergency Communications District, for the operations of the local 9-1-1 emergency system.
The district provides Shelby County residents with an efficient emergency telephone number service using the latest technology, equipment and training for the various emergency service providers and dispatch centers.
For each dispatch center, the district provides county address location mapping. A secure database known as an ALI (Automatic Location Identification) contains the exact 9-1-1 address for any given associated phone numbers.
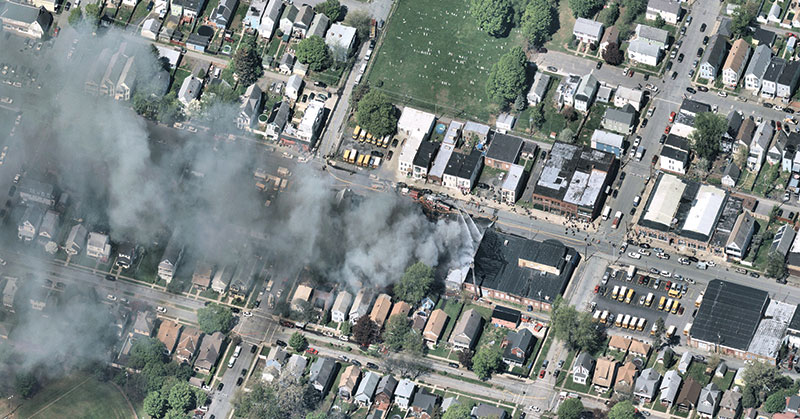
Albany, N.Y.: A house fire in progress. (Photo: Nearmap)
When a 9-1-1 call comes in, the database is queried by the Public Safety Answering Point to obtain the caller’s location. This data is then placed in the computer-aided dispatch software and 9-1-1 mapping software used by the district to help fire and rescue, emergency medical services and law enforcement gain instant access to updated maps containing GIS data needed to get to the right locations as soon as possible.
The 9-1-1 mapping system uses geodetic coordinates to plot wireless calls on the map. The system also reverse geocodes the coordinates to provide the 9-1-1 telecommunicator with a calculated civic address based on proximity of other features in the map, such as address points or streets.
Out-of-Date Imagery. For years, Shelby County’s aerial image process required a contracted flight to photograph the county areas. Because of the high cost of capturing those images, the county purchased images once every two years, after pooling resources from various county entities.
“We had gaps where we wouldn’t have updated imagery,” said Timothy Zimmer, the district’s GIS administrator. “While the images were high resolution, there were issues with mosaicking the separate images together, and since the imagery was taken every two years, many rural and unincorporated areas were out of date.”
With out-of-date images, the county had to develop alternate methods to locate addresses for the 9-1-1 systems.
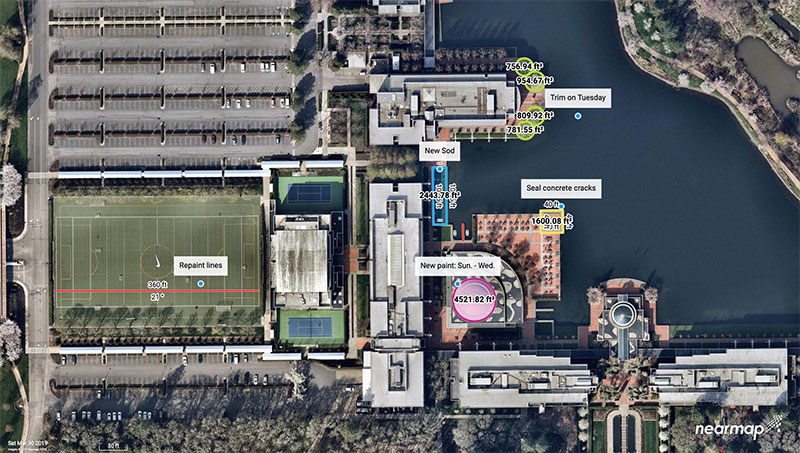
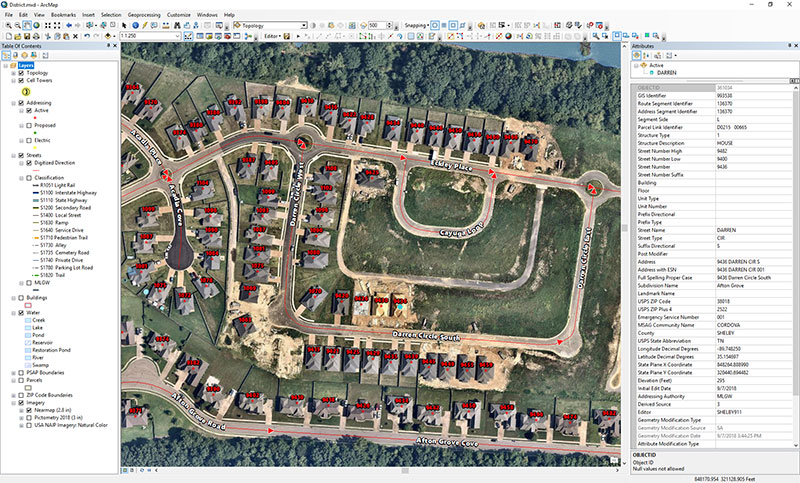
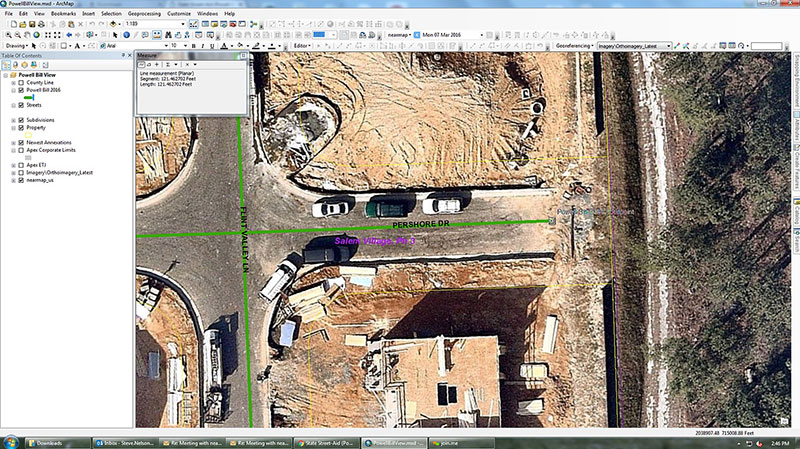
Moving into the Cloud. In the summer of 2018, Zimmer began to work with Nearmap. With Nearmap, Zimmer and his team can access current imagery to geocode new addresses and developments as well as plot new roads into the 9-1-1 mapping systems (Figure 1).
For Zimmer, the biggest advantage is that Nearmap’s imagery integrates directly into Esri’s ArcMap, ArcPro and ArcGIS Online applications, so he can overlay GIS information directly over the high-resolution imagery.
“I really like how Nearmap is integrated into the GIS stack,” Zimmer said. “We’re able to stay on top of new developments, roads, and addresses. Being able to have Nearmap imagery integrated into our GIS systems helps us be much more accurate.”
The combined impact of data services, base maps, Nearmap imagery and third-party data are improving all aspects of public safety, including law enforcement, fire and emergency medical services.
Other Shelby County agencies also are using the district’s imagery and GIS data. “The county clerk and the utility company are using our address mapping data because Nearmap has helped enable us to be much more current,” Zimmer said.
Public works in a fast-growing city
Durham is one of the points in North Carolina’s high-tech Research Triangle and home to Duke University.
An economic and cultural renaissance is happening in the city. With a revitalization of its downtown district, the redevelopment and repurposing of former tobacco districts into tech hubs, and chic loft-style apartment complexes, Durham is rapidly growing beyond its most recently reported 250,000 population numbers.
Impervious Challenge. In early 2018, the city’s growth explosion prompted Edward Cherry, GIS administrator for the City of Durham Public Works Department, and his staff of 14 GIS professionals to seek ways to streamline their data collection.
The department manages all infrastructure data for the city, including mapping the impervious area. As defined by the U.S. Geological Survey, impervious surfaces include highways, streets, pavement, driveways and even house roofs — any surface that won’t absorb rainwater. Rather, the rain runs off into storm sewers and then into local creeks; localized flooding is often the result.
Durham Public Works manages half a billion square feet of impervious area. The city’s $16 million-a-year Stormwater Utility Fee income was a driver for Cherry’s team to explore satellite imagery options. Imagery from satellites, however, were infrequent and too low-resolution to meet their needs. The satellites captured images only once-a-year, and that might be on a cloudy or rainy day. Clouds cast shadows, and rain makes pavement appear newer than it is.
Nearmap’s aerial imagery, captured in Durham three times a year at a 2.8-inch ground sample distance (GSD), solved the problem (the GSD of each individual pixel in the imagery represents 2.8 inches on the ground. See Figure 2).
Figure 2: Rapid growth requires frequent imagery. Above is a new Durham neighborhood under construction. (Photo: Nearmap)
Dozens of projects in the Public Works Department — from road maintenance and pothole patching to water sampling and degradation — are using the improved imagery, which has saved the city money, reduced time spent in the field, and allowed crews to use real-time imagery when they are working in the field.
Monitoring Pavement Conditions. The City of Durham is responsible for maintaining most of its roads, and conducts a road-condition survey that samples different sites, evaluating the level of degradation.
Since 2014, Nearmap has regularly captured Durham streets at the same resolution and accuracy, and both the historical and current data are available to the department. With multiple high-quality image captures at high resolution, surveyors can see sections that have been recently paved. “We don’t need to send crews out to an area where a stretch has already been paved,” Cherry explained.
Road Repair Documentation. As in any city, the patching of potholes is an ongoing project for Durham’s public works department. With imagery, the city has been able to streamline the process.
Traditionally, the streets department sent out inspectors to spray paint and circle areas that required repairs. “Then we would produce maps and hard copies to direct [road repair contractors] ahead of time on a scheduled event,” Cherry said.
Now the city uses an application integrated with Nearmap imagery by which contractors can view the job on their smartphone or tablet while in the field. The surveyors can edit and draw the areas that need patching instead of physically going out and spray-painting them. “Then, in real time, the people doing the patching can see a very high-resolution image of where they need to do the work,” he said.
The pothole image captures are recorded, so the city knows where and how many potholes were patched. “We can see where work has been done when we are billed for it,” Cherry said. “We can visualize the work, which is an added bonus.”
Mapping Riparian Zones. With imagery previously taken only when the leaves had fallen (known as leaf-off), surveys of riparian zones in Durham proved limiting.
With imagery captured during both leaf-off and leaf-on seasons, riparian buffers around streams can be properly monitored for expansion. The buffers can be altered if there are issues with a stream’s path, such as sediment clogging the flow, repeated flooding or people intruding on a buffer.
Change Detection. High-resolution imagery has improved Durham’s billing process by producing web service maps that capture individual storylines. Stormwater billing customers, for instance, can visualize their properties with the impervious areas mapped out and tied to their billing records.
With up-to-date imagery providing data for change detection software, records also show when a customer has added a driveway or an extension to their house.
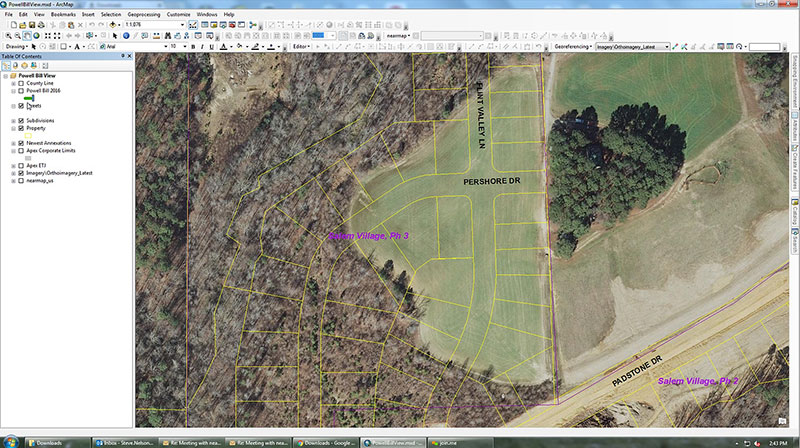
Figure 3: Aerial Imagery of an Apex neighborhood displayed in ArcGIS from Esri. (Image: Nearmap)
“Having access to imagery back to 2014, we’re able to go back in time during the thrust of development and monitor it forward,” Cherry said.
Nearmaps’ library of historical imagery allows for change detection algorithms to run in Esri’s ArcGIS imagery analysis software suite.
More efficient government
GIS data combined with aerial imagery is tailor-made for city planning and managing urban growth.
For instance, the population of Apex, N.C., has more than doubled since 2000. Situated near Raleigh and the state’s Research Triangle Park, Apex was rated number one in Money magazine’s 2015 “Best Places to Live,” which cited Apex’s charming downtown, highly rated schools and high-paying technology jobs.
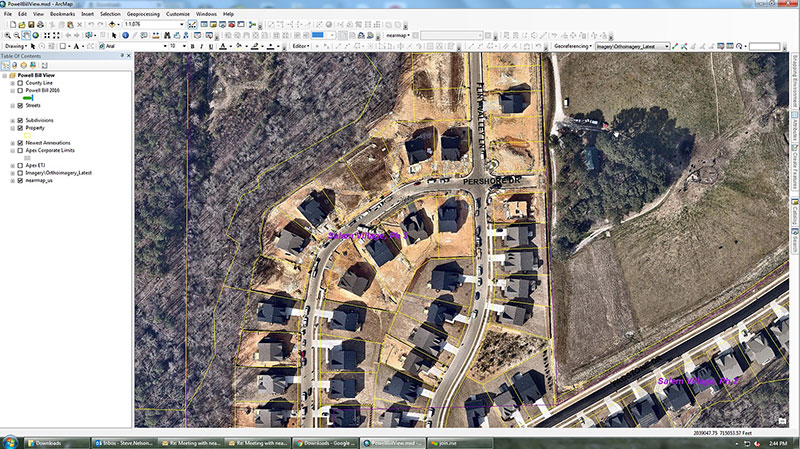
Figure 4: The post-construction image of the same neighborhood is much more accurate. (Image: Nearmap)
To manage the explosion in development, Apex’s GIS professionals needed instant access to current information. The old-school method required planners to drive the streets, inspect roadways, and roll out the measurement wheel. Now, the combination of Esri ArcGIS for mapping and Nearmap high-resolution aerial imagery allows them to visualize and measure within six inches of accuracy.
“Our ability to leverage our GIS operation improved dramatically with Nearmap. The flexibility of its cloud solution and ability to integrate with ArcGIS has redefined how we rapidly respond to staff and citizen requests,” said Steve Nelson, a GIS professional with Apex.
The use cases for these solutions are diverse. Law enforcement calls on GIS professionals from Apex to quickly provide current, clear, aerial photography for active or ongoing investigations. Planners focused on development are charged with meeting state regulatory reporting guidelines when it comes to building and maintaining roads. Environmentalists want to know if anyone is digging on protected land.
Figure 5: Measuring for reimbursement in Apex. (Image: Nearmap)
For the State Street-Aid Program, financial allocations are made to incorporated municipalities eligible under North Carolina law. State routes that pass through incorporated cities are maintained by the cities. Cities are responsible for paving new roads, but the state has the power and economic means to reimburse them.
To qualify for reimbursement for new roads developed and maintained, Apex needs to submit a report to state engineers for review. The report documents the distance for all newly paved roads.
Before the new system was in place, GIS professionals had access to imagery from 2013, but the actual development took place after this. In (Figure 3), the 2013 imagery simply outlines the parcels and rights of way. It has no detail with respect to where the roads start and end, so a lot of field work was needed to take measurements, drive roads scattered across the county, and collect data.
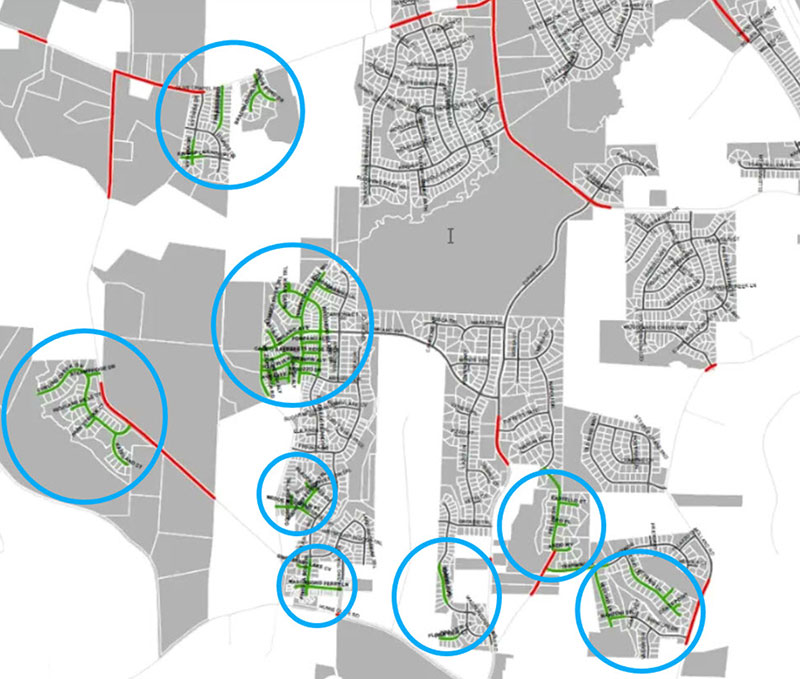
Figure 6: Green lines indicate new streets in Apex in a single year (2013). (Image: Nearmap)
With the new system, workers have instant access from their desktop to the same location as it currently is. They can see exactly where the edge of the road starts and stops (Figures 4 and 5), which is different from the yellow-lined “right of way” depicted in Figure 3. While in the office, GIS professionals can measure distances precisely, creating an accurate representation of ground truth.
Figure 6 highlights a small portion of new roads built in Apex in one year. The green lines highlighted are scattered across the city. As Apex continues to grow and annex adjacent territory, the dynamic nature of the growth will be captured and uploaded to the cloud.
Unlocking Potential
As cities grow in complexity, mapping becomes integral to planning. With the advances aerial imagery provides, cities are starting to unlock the full potential of location data and visualizing a better future.
Esri’s Jesse Smith discusses how the U.S. Coast Guard’s International Ice Patrol is using Esri’s ArcGIS Enterprise platform to improve marine safety at the 2019 Esri User Conference in San Diego. Currently, the organization is using the platform to map, observe and track icebergs.
Satellite imagery and mapping have proven to be critical technologies when it comes to disaster relief efforts.
The NASA Earth Science Disasters Program has harnessed these technologies to help communities and governments recover from natural disasters like earthquakes, hurricanes and more.
“[The goal of the program is to] try to prevent natural disasters or limit their impact and also help people recover from them more quickly,” Jeremy Kirkendall, senior GIS administrator for the NASA Disasters Program, told GPS World in an exclusive interview at the 2019 Esri User Conference in San Diego. “We provide the products free to anyone to use, and data is only available if there is a good satellite pass.”
When a natural disaster strikes, researchers at the NASA Disasters Program will take satellite imagery of the affected location and create a map to show what the area looks like from an aerial perspective. Authorities who request this information can then compare the disaster map with maps of what the area looked like before the disaster took place.
“We do take requests from agencies or governments for disasters if they need help if data is available,” Kirkendall said. “We’ll create the products that show where the earthquake damage happened, where the fire burned or where the flooding is, and then users take that — combined with their local information — to determine what needs to be checked.”
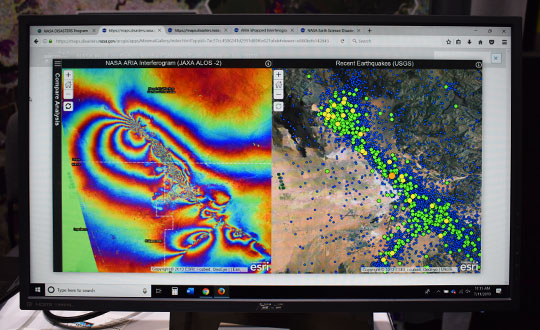
For example, the NASA Disasters Program was able to map out the magnitude 6.4 July 4 Southern California earthquake.
“The earthquake that happened on July 4 caused a lot of deformation to the ground, so we mapped out that surface deformation and shared that information with other emergency managers, the Federal Emergency Management Agency, National Guard and U.S. Navy,” Kirkendall said. “You can look at things like roads, utilities, underground pipes for natural gas or geothermal wells, or fiberoptic cables. Then when you provide the product to these end users, they can overlay it with utility and infrastructure information to identify what’s the most at risk and what needs to be investigated.”
Sometimes, when a natural disaster occurs over a longer period of time, data is mapped throughout the duration of the occurrence, as well. This can help with search-and-rescue missions, infrastructure repairs and post-disaster analysis.
“We will create products during responses that can last a long time, like for Hurricane Florence or the flooding that recently happened in the Midwest,” Kirkendall said. “We’ll keep turning out flood products day after day when there’s good satellite passes that show that information.”
Kirkendall added that the National Guard has used the live data, along with 911 calls, to find individuals trapped in flooded houses. The data also serves as a tool for post-disaster analysis to understand where damage occurred, ways to fix it and how to prevent it from happening again.
“The program itself is gearing toward a resiliency effort, where we can provide these products when communities says, ‘We get flooded here all the time, over and over,’” Kirkendall said. “That’s where we need to be prepared to fix something. We need to do something to prevent that.”
Jeremy Kirkendall, senior GIS administrator for the NASA Disasters Program, gives GPS World an overview of the program at the 2019 Esri User Conference in San Diego. Watch this video to find out how satellite imagery produced by the program helps with disaster response efforts.
The surveying profession has come to a crossroads, and is divided amongst itself to boot. A gap exists within the profession, and yes it is a generation gap, based on how technology has evolved and how the different generations experience it differently. In this column I explore the histories both of the generations and the technology to reach conclusions on how best to move forward — together.
Surveyors now have more tools than ever before available to them to perform their tasks. But surveyors of different ages regard these tools differently. Not to put too fine a point on it, the younger porfessionals among us feel their creativity and desire to further the profession is being stifled by the group who is supposed to be leading and mentoring them.
Why is this crucial to consider? Because these are the future users, purchasers and adopters of geospatial equipment and software, and the future setters of industry standards. All involved, from manufacturers to distributors to surveyors themselves, would do well to think deeply upon this.
As we enter the final stretch of the 21st century’s second decade, many things have changed since the Y2K scare and the proliferation of the Interweb. From deregulation of the surveying profession to changing coordinate systems and datums, the surveying profession faces many challenges in 2019. One of the biggest challenges we face has nothing — yet everything — to do with technology.
Talented people are necessary to grow our profession. We are falling well short of having enough to keep up with demand. Sounds like a simple problem; just hire more surveyors and technicians. This sounds easy, but several roadblocks confront us.
A select few still invest in their surveying future by going to college to get a degree and eventually become a licensed surveyor. These individuals find, however, that the road to success has lots of potholes along the way, just as their elder predecessors did.
Recently, I participated in a group discussion with the National Society of Professional Surveyors (NSPS) Young Surveyors Network to discuss surveying, technology and the young surveyor’s role in promoting future career opportunities. This discussion was part of Network’s series of meetings and seminars held in parallel with the main NSPS Spring Business Meetings.
It was great to see the higher proportion of women in the young surveyor group than in the typical professional society meeting. Their feedback was consistent with that of the young men in the group. All together, their perspectives led me to write this article.
While I think of myself as still “young-ish” (in my early 50s), being the oldest participant in that group was intimidating, to say the least. These young technicians and surveyors are driven and focused, yet they seek the same feedback and mentoring that I desired when I was their age.
In the weeks after that meeting, some of the items discussed continued to resonate with me and forced me to reflect on my own experiences and career path. To be fair to them and truly understand their views on today’s surveying profession, I needed to look beyond the profession, policies and procedures to which I hold fast in my ethical approach to the craft. These younger generations have been exposed to a completely different world than the one I remember fondly, and the world they grew up in has subjected them to challenges to which I cannot relate. To help explain the conundrum of trying to find a way to relate, we need to take a step back and look at not just generational values but how the many industrial revolutions have affected us as well.
TALKING ‘BOUT MY GENERATION
The first part of my research to help me find a way to step into the shoes of these young surveyors was to look at past generations and how they relate to each other. Going back to the turn of the 19th century, we get the following breakdown:
Traditionalists or Silent Generation: Born before 1945
This timeframe contains sub-groups including the “lost generation of 1914,” the “interbellum” and the “greatest generation.” Alaska and Hawaii were not included in the United States during this period. Most of the country west of the Colonial states was subject to the government Public Land Survey System started in the early 1800s. The Great Depression took its toll on much of the population, and previously rapid expansion slowed to a standstill.
Baby Boomers: Born 1946 – 1964
World War II changed the world. Soldiers returning from military duty to start or resume families accelerated population growth and a departure from traditional social attitudes. Two-income families emerged, and prosperity ruled for many years. Surveyors, teaming with civil engineers, helped fuel an unprecedented explosion of real estate expansion through planned developments across the country.
Generation X: Born 1965 – 1976
The children of the fast and free-living Baby Boomers grew up to become the Gen Xers. They were the first “latchkey” kids, more likely to be raised by divorced or remarried parents. As young adults, in their effort to enhance their lifestyle more than their parents, they did many things to the extreme with no consideration of cost. This led to massive real estate developments, “McMansions” and increased debt. Surveying continued to flourish but most growth was enjoyed by engineering firms who absorbed surveyors to expand their services.
Millennials or Gen Y: Born 1977 – 1995
This group is often labeled as the “Peter Pan” generation for its predisposition to put off typical adulthood norms like marriage, having children and buying real estate. They have a propensity to be more mobile and nomadic, as they take advantage of technology and rapidly changing environmental factors. With this generation we find the slowdown in career choices towards surveying, even though technology and spatial data acquisition have exploded with potential.
Gen Z, iGen, or Centennials: Born 1996 – Current
This generation was born into technology, and it affects everything they do. From infancy they were experienced soothing music, dancing screens, interactive toys, and dolls teaching them new skills. This generation doesn’t know of a world without computers, cellphones, GPS-based maps or high-speed internet. Surveying has also benefitted from the technology explosion but it hasn’t captured the imagination of this generation sufficiently to develop future practitioners.
YOU SAY YOU WANT A REVOLUTION. WELL, YOU KNOW…
The generational differences only tell part of the story. Each one faced its own challenges when it came to technology (or lack thereof), societal standards, and other facets of their respective eras. A succession of several Industrial Revolutions brought new tools for completing a wide array of tasks and procedures. Here is a summary of each of them in chronological order:
First Industrial Revolution (1784)
Mechanical production via water and steam power led the way during the late 1700s and began a trend of radical changes in the ability to create larger items. The Gunter chain and surveyor’s compass, both invented in the 1600s, were the mainstay of measuring tools during this time period.
Second Industrial Revolution (1870)
Mass production and increases in labor opportunities coupled with the adaptation of electricity in many areas enabled people to flourish like no other time to date. The optical theodolite with horizontal angle measurement was introduced and then mass produced in the late 1800s to help surveyors make more progress westward.
Third Industrial Revolution (1969)
A significant leap forward in technology occurred with the invention of the microprocessor in the late 1950s, followed quickly by rapid development of electronic machines designed to follow manual instructions. Programmable controllers and devices were born from the fast-paced development of sophisticated miniaturized circuitry. These developments were used to create measurement devices for sending infrared and visible light waves across long distances. In the late 1970s, technological advancements led to the development of electronic theodolites or total stations. These instruments were the first to be able to electronically determine the horizontal and vertical angles normally read manually by the operator, and to combine this data with electronic distance measurement. Further development created methods of storing this data electronically for input into computer calculation and drafting programs.
Fourth Industrial Revolution (Current)
Industry experts differ as to when the Fourth Revolution began, but all agree we have turned the corner and are now fully entrenched into a new realm. Further miniaturization of computer chips, advanced sensors and storage, and robotic mechanisms have introduced a new reality for everyone, including the surveyor. Today’s practitioner has many sophisticated tools available for work, including GNSS receivers, laser or LiDAR scanners, UAVs with a multitude of sensors, hydrographic vehicles with single and multi-beam fathometers, and many more instruments currently under development.
Surveyors now have more tools than ever available to perform their tasks. Now we must cross-reference these revolutions with the practitioners from the various generations to help us understand upon which road the profession is headed.
TECHNOLOGY MEETS GENERATIONAL DIFFERENCES; WHAT COULD GO WRONG?
One thing that stood out in my aforementioned discussion with the young surveyors’ group was how much they were embracing technology not just in their every day lives and communication, but how they understood the enhanced abilities of the latest tech and instruments for surveying. They see the value in large data, point clouds and BIM (building information modeling) needed for industry use.
The general consensus from this group was that my generation (Gen X) and earlier (Baby Boomers) are easily dismissive of their enthusiasm for incorporating these new technologies into our workflow simply as ways to shortcut old methods done by more labor-intensive means. While I initially tried, myself, to dismiss this suggestion, further research has only proven their point: their creativity and desire to further the profession is indeed being stifled by the group that should be leading and mentoring them.
Cross-correlating the generations with their various personalities and quirks with the amalgamations of industrial revolutions turns up some interesting results. Gen Xers and earlier surveyors were strictly taught by their managers and mentors that both historical data and original monuments are sacred and not to be denied. This information was derived from the most basic of survey instruments and measuring equipment, with accuracy that is not acceptable by today’s standards.
But the tradition remained: if it was good enough for our forefathers to establish the early frontier, then more accurate measuring devices are simply overkill. New sophisticated robotic total stations, GNSS receivers and robust data collectors available as a result of the Third Industrial Revolution are shiny objects that stand in the way of “good surveying,” in the opinion of the elder surveyors.
Millennial surveyors, meanwhile, look at the world with a different vision and much different solutions. Most of them were not exposed to televisions with just three channels, telephones mounted on walls, or kitchens without microwave ovens, to just to name a few “antiquities.” Their families have always owned a computer and the library is a place where you go to study. Research isn’t looking in an encyclopedia; you Google. They embracw cellphones with a multitude of apps and functions, including location services within a few feet, practically as extensions of themselves.
The equipment produced for surveyors today is well within their wheelhouse as it maps a multitude of points and features in a blink of an eye. Accuracy and detail are no longer an issue — but adapting that data to legacy deeds and maps is where us old timers can help bridge the gap.
Another problem that has proven to be a yawning void between the generations is the remnants of the economic slowdown of 2007-2012. Many Baby Boomer and Gen X surveyors learned to do more with less. Times were tough and we couldn’t afford to upgrade to the latest versions of total stations, GNSS, software, or invest in new technologies like laser scanning. There was also an exodus of technicians simply because there was no work in surveying for the time period, and they found employment in other professions. That left a void in who was doing the work (now being completed by upper level surveyors with older skill sets), and having no younger personnel to train and groom for future career growth.
There were many technological advancements during that time frame but overall the industry suffered because of the economic downturn. The Millennials, most of whom were too young to be employed during this period, now are faced with working for an older profession that couldn’t afford to stay current with technology and who have trouble relating to the motivations of the younger generation.
CAN’T WE ALL JUST GET ALONG?
I believe the surveying profession is at a crossroads, one based upon the gap caused by the generation / technology combination described above. Steps must be taken to rectify this. Here are a few of the pathways to closing the gap and becoming a solid profession for the future:
Embrace the mentor/mentee relationship, but be open to reversing the roles. The younger generations have a handle on the latest technology, so us old timers need to be more willing to close our mouths and open our ears and minds.
Create more opportunities for younger surveyors to participate in organizations so they can also be influencers. Keep in mind that they don’t typically like to “belong” to an organization, so adapt our professional groups and keep their interests in mind.
Change the way we communicate. Many Baby Boomers / Gen X members are critical of the younger generations and social media, yet this trend shows no sign, at all, of stopping. Smartphones are here to stay, so let’s learn to adapt, to remain in step with the youngsters.
Be willing to invest in new and emerging technology. Who know where the next radical survey technique will come from if you don’t have an open mind and checkbook? Invest not only in equipment but your young staff’s future.
Encourage younger staff to get involved in something. Anything. Social interaction can lead to better communication skills and expose them to more business situations. Don’t push them in over their head,s but get them to be “uncomfortable” occasionally. They will thank you for it.
Many professions and occupations will suffer in the next 3–5 years because of attrition through retirement, incapacitation and death. These workforces will lose 20–40% of their workers. Those left will have to pick up the slack and then some. We need to either
A) hire a lot more surveyors, or
B) figure out how to make it work with less bodies.
The conversation that took place in that meeting room with the young surveyors has made a deep impression on me and has changed my focus on the future of surveying. How does this apply to an article in a geospatial publication? Simple: these are the future users, purchasers and adopters of geospatial equipment and software, and the setters of industry standards.
The younger generation understands how to use today’s technology, and the surveying profession overall needs to embrace that fact. The technology won’t mean a thing if we don’t have the bright minds to use it to its full potential.
So I ask you again to embrace, encourage and listen to the young surveyors; they will thank you for it.
Toyota Research Institute-Advanced Development Inc. (TRI-AD) and Carmera Inc. have joined forces to conduct a proof of concept about developing camera-based automation of high-definition (HD) maps for urban and surface roads.
This is the first step towards realizing TRI-AD’s open software platform concept known as automated mapping platform (AMP) to support the scalability of highly automated driving, by combining data gathered from vehicles of participating companies to generate HD maps.
Automated driving requires highly reliable road information based on HD map data. While the creation of highway HD maps is underway, this coverage represents less than 1% of the worldwide road network.
The next challenge is to create and maintain maps for urban areas and local roads that go beyond the highway road network.
TRI-AD/Carmera mapmaking from vehicle cameras in downtown Tokyo. (Image: Toyota/Carmera)
In this proof of concept, the two companies will place cameras in Toyota test vehicles to collect data over several months from areas of downtown Tokyo. The cameras installed in the test vehicles use Toyota Safety Sense components that Toyota installs on its vehicles globally.
Images and other data gathered from TSS will be processed on Carmera’s real-time platform to automatically generate HD map data.
In addition, by placing commercially available dashcam drive recorders in Toyota test vehicles, the project will demonstrate automated map generation from a broader range of sources that do not have TSS.
This draws upon Carmera’s millions of miles of driving video collected, structured and enriched through safety monitoring partnerships with professional fleets in other complex environments like New York City.
Carmera feature detection image in downtown Tokyo. (Image: Toyota/Carmera)
By combining maps automatically generated via the techniques employed in this project with digital maps available today, it will be possible to provide even more reliable road information to automated vehicles in the future. And by generating HD maps based on data acquired from commercially available vehicles around the world, automated driving can be enabled on all roads.
“Currently automated driving map development relies on highly expensive specialized mapping vehicles deployed in limited numbers, and a lengthy manual process for reliable HD map creation,” said Mandali Khalesi, vice president of automated driving at TRI-AD. “We’re excited to partner with Carmera to automate HD map generation and help enable automated driving mobility for all.”
“Carmera was founded to deploy next-generation street intelligence at low cost, high speed and automotive-grade reliability, in order to democratize autonomous mobility at global scale,” Ro Gupta, CEO at Carmera, said. “We’re excited to collaborate with TRI-AD in putting the flexibility and modularity of our platform to work to build HD maps, beginning with one of the largest and most dynamic urban environments in the world.”
We’ve all been there before: static on our wireless call or, worse, the call drops at the most inopportune time. Like instant response when we surf the web, consumers have come to expect clear, consistent call connections when using mobile. With too much of a bad thing, the churn risk soars to untenable heights.
5G, shorthand for Fifth-Generation Wireless Systems, holds the promise of transforming our daily lives. Using massive bandwidth, extremely low latency and high speeds, almost everything that requires sending and receiving data gets a boost. Unique radio frequencies transmitted with precise directions improve on the older 4G approach by taking advantage of higher frequencies. The signals take less time to transfer from one device to another, dramatically reducing wait times.
How does this help business and the consumer? Video conferencing is better, call connections are clearer, and smart homes get their Ph.D. How does this become reality?
Rather than using satellite-based towers, 5G depends on shorter signals using antennas and other transmission devices installed closer to the ground, on the tops of buildings and existing utility poles. Herein lies the rub. Ground features such as trees or tall structures can interfere with transmission. On top of this, there’s the need to plan for change. Vegetation grows over time, new construction takes place, and the cycle of interference continues. Imagine trying to plan a 5G network in an urban environment replete with hundreds or thousands of tall buildings. How would a telecom decide where to place the hardware and optimize the network?
The answer rests in aerial imagery, also known as aerial mapping. Rather than relying on satellite imagery that’s less clear and prone to atmospheric conditions, high-resolution camera systems mounted inside planes are photographing the world — all in 3D. Within predefined coverage areas, every point on and above the ground is being photographed and transformed into a variety of 3D models. For the telecom industry, planners can predict zones of interference and place hardware accordingly. They can better service their customers and quickly adapt to changing conditions in support of maintaining the network.
One type of output from these advanced camera systems is called a digital surface model, providing detailed elevation profiles of ground features, building, bridges, you name it. Also knows as DSM, the elevation detail contained within the imagery facilitates analysis to optimize the placement of 5G antennas and transmission devices.
When combined with other forms of imagery that allow users to clearly visualize every aspect of the landscape in photorealistic, immersive 3D, this enables telecoms to quickly model all the transmission permutations.
These high-tech companies use machine learning to identify clear signal areas and sections of the landscape where a tree, for example, may degrade the 5G radio frequency. Armed with such intelligence, strategic placement of hardware unlocks the optimized network — all without having to leave the office to collect data from the field.
The race is on to roll out 5G. Fortunately, advances in aerial photography have been combined with machine learning and artificial intelligence (AI) to speed up network planning and change modification. With tens of thousands of access points needed for large cities, advanced uses of aerial imagery and data science provide the answer for fast 5G deployment.
Less than a decade ago, mobile mapping systems were being designed and sold using computer systems that rivaled most desktop computers. Mobile mapping vehicles had to be custom-fit for large displays and computer systems, usually with large, expensive, bulky redundant arrays of inexpensive disk (RAID) storage systems that would consume the back of a van or, at the very least, the back seat of a car. Wiring for these systems completely entangled the vehicle, making it a dedicated part of the mapping system. Many of these systems are still being used today, as their utility is only lost on space consumed but not on usability or productiveness.
In 2019 we face the ever-increasing demand for smaller size with greater performance, especially in the instance of UAVs, where size, weight and power consumption are precious commodities.
Wires? Nobody wants or expects to see any wires or cabling running between devices, with the possible exception of power. A desktop computer, laptop or RAID system is no longer a consideration. Storage is replaced by high-speed, high-capacity media such as Compact Flash, Flash memory cards, and solid-state drives.
And all of those wires? They are replaced by Wi-Fi or Bluetooth working directly between the onboard microprocessor (at most the size of a deck of cards) and what else? Your cell phone. Maybe a tablet.
The inertial navigation system inside these UAVs, the central nervous system of a mobile mapping set-up, can no longer afford to weigh several kilograms. It must weigh under 1 kilogram, with less than 500 grams preferred. The accompanying antennas must also shrink.
At the same time, cost must drop while performance must be maintained or improved. More users will adopt the technology, and they will no longer be experts. Reliability and durability will be of utmost importance.