Riegl now offers several new sensors and systems for airborne data gathering at various elevations.
At Intergeo 2018, the company unveiled sensors designed for low-flight altitudes, such as with UAVs. Riegl also introduced sensors designed for medium-flight altitudes used in large UAS/UAV/RPAS with higher payload capacity or in manned helicopters, and scanners and systems for data acquisition at high flight altitudes using manned fixed-wing aircraft.
The Riegl VQ-480II and VQ-580 II on display at Intergeo 2018. (Photo: Riegl)
Medium altitude. The Riegl VQ-480 II (Mark 2) and VQ-580 II (Mark 2) are designed for airborne applications at mid-altitudes for use on both manned and unmanned aircraft. Based on the capabilities of their predecessors VQ-480 and VQ-580, their new, sophisticated designs lead the quality of the systems to a new standard of performance and user-friendliness.
Both offer a measurement rate of up to 1,250,000 measurement/second and a wide field of view of 75 degrees, suitable for corridor mapping, city modeling and applications in agriculture and forestry.
With approximately 10 kg of weight, they are ready for integration into helicopters as well as unmanned UAVs with a higher payload capacity, and are compatible with stabilized platforms and even small hatches.
The VQ-480 II and VQ-580 II are prepared for smooth GNSS/IMU integration, offer interfaces for up to five optional cameras, and are equipped with a removable storage card and an integrated SSD for data storage.
While the VQ-480 II works at a laser wavelength of 1550 nm, the VQ-580 II works at 1064 nm wavelength suited to measure on ice and snow.
Laser scanning. Riegl’s VUX series, focusing on unmanned laser scanning, has also been expanded. With the Riegl VUX-240, a new airborne lidar sensor with less than 4 kg weight and a sophisticated design offering 75-degree field of view is now ready to be integrated on both small manned and larger unmanned aircraft.
The high measurement rate of 1,500,000 measurements/second and a high scan speed of up to 400 lines per second are the basis for high scan efficiency, especially in applications like power lines, railway tracks, pipeline inspection or topography in open-cast mining. Interfaces for an optional GNSS/INS system integration and up to four optional cameras are further convincing key features of the new scanner.
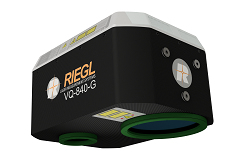
The Riegl VQ-840-G. (Photo: Riegl)
Bathymetry. For the bathymetric segment, the Riegl VQ-840-G has entered the marketplace. Designed for combined topographic and hydrographic surveys for use with large UAVs from lower flight altitudes, the scanner carries out laser range measurements for high-resolution surveying of underwater topography utilizing a green laser beam.
The scanner’s compact, lightweight and robust housing also can include an optional digital camera and an additional, fully integrated infrared laser rangefinder, and is compliant with typical hatches in aircrafts and with stabilized platforms.
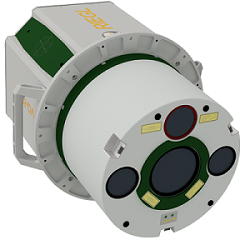
The Riegl VQ-880-GII. (Photo: Riegl)
Airborne laser scanning. The Riegl VQ-880-GII is a further improvement of the VQ-880-G topo-hydrographic airborne laser scanning system, offering online waveform processing and full waveform recording.
The improved setup includes a green laser channel, an integrated infrared laser channel, and an integrated dual camera system for RGB and IR. Typical applications include coastline and shallow water mapping, acquiring base data for flood prevention, and measurements for aggradation zones.
Also available are the VQ-780i airborne laser scanner and the VQ-1560i dual wavelength airborne mapping system.
A roundup of recent products in the GNSS and inertial positioning industry from the November 2018 issue of GPS World magazine.
OEM
Simulator signals
GPS L5 and Galileo E5 added to simulator
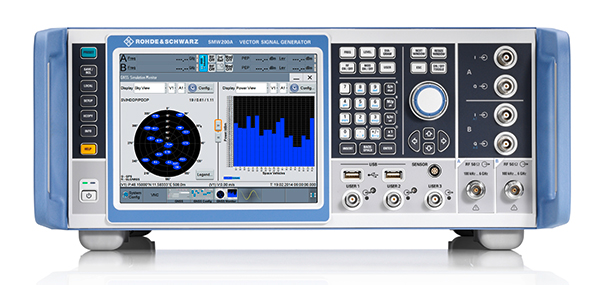
Photo: Rohde & Schwarz
Rohde & Schwarz has added GPS L5 and Galileo E5 simulation capabilities to its R&S SMW200A GNSS simulator. The R&S SMW200A GNSS simulator is designed for efficient test and characterization of multi-constellation and multi-frequency GNSS receivers. It now enables generation of complex and highly realistic test scenarios with up to 144 channels in the GNSS frequency bands L1, L2 and L5. In addition to GPS (L1/L2/L5), GLONASS (L1/L2), Galileo (E1/E5) and BeiDou (L1/L2), the R&S SMW200A also supports signal generation for QZSS and SBAS on L1. Channels can be routed to up to four RF outputs, so that even multi-antenna systems can be tested. The R&S SMW200A can generate complex coexistence and interference scenarios with multiple interferers.
The BlueSky GNSS Firewall enables critical infrastructure providers to harden the security of their operations from GPS threats and deliver a more reliable and secure service. The security-hardened system provides protection against GPS threats such as jamming, spoofing and complete outage. It also supports a range of precision timing technologies, including atomic clocks, to enable continuous operation when GPS may be completely denied for extended periods. The TimePictra software management suite provides centralized control and visibility of GPS reception across regional, national and global geographic areas. It can incorporate an optional internal miniature atomic clock.
For reference deployments, CORS networks and monitoring
The VeraChoke GNSS antenna. (Photo: Tallysman)
The VeraChoke is a high-accuracy choke ring antenna with a choice in form factor for reference and monitoring applications. The VC6100, the first model variant of the VeraChoke, shares a common high-efficiency element design with its counterpart VeraPhase. With the choke-style form-factor, however, the rings have been optimized for all GNSS signals and are slightly pyramidal in shape to improve reception of low-elevation satellites. The VC6100 offers a tight phase center variation (PCV) of no more than ±1 mm for every frequency. It is capable of receiving all GNSS signals, and achieves a very low axial ratio. The antenna also supports large and small SCIGN radomes.
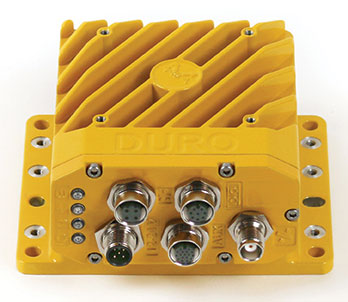
Duro Inertial is a ruggedized version of Swift Navigation’s Piksi Multi dual-frequency real-time kinematic (RTK) GNSS receiver combined with Carnegie Robotics’ SmoothPose sensor fusion algorithm, which fuses GNSS and inertial measurements into a combined solution. The blending of GNSS and inertial measurements provides a dead-reckoning capability that allows Duro Inertial to provide a highly accurate, continuous position solution during brief GNSS outages and to deliver a robust precision navigation solution in harsh GNSS environments.
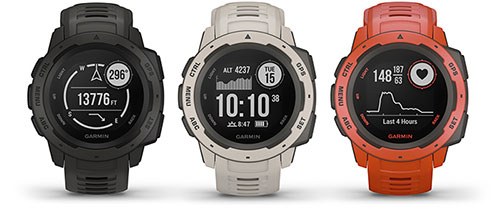
The durable Instinct has GNSS; three-axis compass; barometric altimeter; and wrist-based heart-rate sensor. The watch includes a built-in sports apps, smart connectivity and wellness data. It is built to endure challenging environments, and is constructed to military standards for thermal, shock and water resistance. The multi-GNSS feature helps users track their location in challenging environments, while the Garmin Explore app helps plan and track a trip.
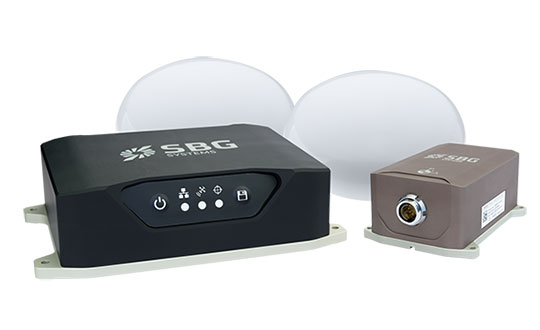
The Navsight Land & Air Solution provides high-performance inertial navigation to make surveyors’ mobile data collection easier, whether for mobile mapping, GIS or road inspection. The solution consists of an inertial measurement unit (IMU), available at two different performance levels, connected to Navsight, a rugged processing unit embedding fusion intelligence and a GNSS receiver. It also has connections for external equipment such as lidar, cameras or computer. SBG’s fusion algorithms allow the company to get the best performance from inertial, odometer and GNSS technologies; exclude false GNSS fixes; and improve the trajectory in complicated areas such as urban canyons, forests and tunnels. The solution supports all GNSS constellations, and real-time kinematic (RTK) and precise point positioning services such as Omnistar and TerraStar.
iSTAR Pulsar is designed to capture 360-degree data while mounted on a vehicle, drone or on foot. An upcoming feature in cloud-based processing software VR.WORLD uses artificial intelligence and image recognition to analyze the images captured by iSTAR Pulsar so that objects like cars, trucks, traffic lights, road signs, pedestrians and cyclists can be automatically identified in images. Handheld 3D mobile mapping company GeoSLAM and mobile mapping software company Orbit GT have introduced integration with iSTAR Pulsar.
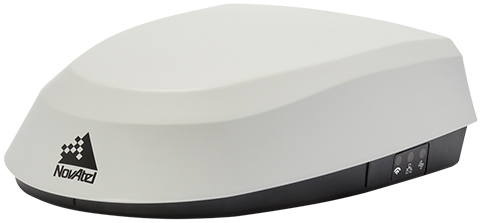
The SMART7 family features NovAtel’s GNSS + inertial navigation system (INS) SPAN technology; future-ready GNSS; Wi-Fi and internet protocol connectivity; superior tracking performance; and TerraStar-C PRO corrections. It is designed to increase GNSS availability, accuracy and reliability for major precision-agriculture equipment manufacturers. The SMART7-S includes SPAN technology, the SMART7-W includes Wi-Fi and an integrated NTRIP client, and the SMART7-I model also incorporates Ethernet. All SMART7 models provide exceptional positioning availability using signals from all constellations and frequencies to deliver assured positioning anywhere.
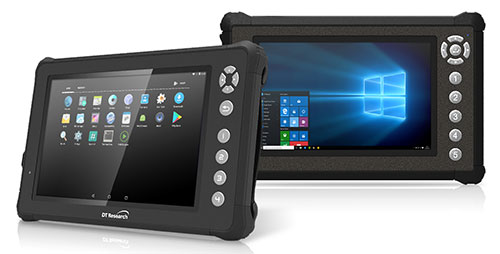
The DT301X rugged military-grade tablet is purpose-built to enhance the precision of 3D surveying, crime and crash scene reconstruction, and bridge and other construction inspections. An option is a dual-frequency GNSS module for real-time mapping and positioning. The tablet integrates the Intel RealSense depth camera, which provides real-time 3D imaging providing accurate measurements for CAD, engineering, design, utility management and crime-scene forensics. A high brightness 10.1-inch touchscreen offers flexible viewing in a wide range of lighting, and an Intel eighth-generation Core i5 or i7 processor offers high-performance while still being energy efficient. With high-capacity 60- or 90-watt hot-swappable batteries, the DT301X keeps working continuously, complemented with a variety of battery chargers so fully charged batteries are always available.
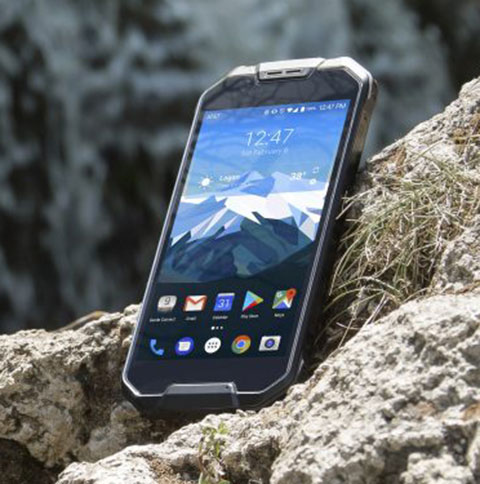
The Cedar CP3 rugged smartphone is capable of data collection and communication. It has a high-visibility 5.5-inch AMOLED display; 14- to 16-hour battery life operating at full brightness and running GPS; 16-megapixel user-facing camera and dual 12-megapixel rear camera; and 6 gigabytes of RAM with 64 gigabytes of internal storage.
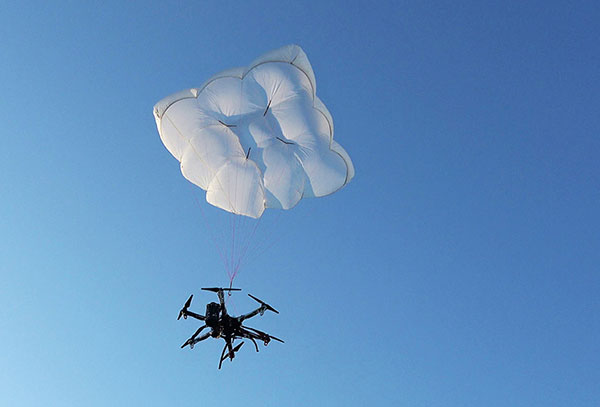
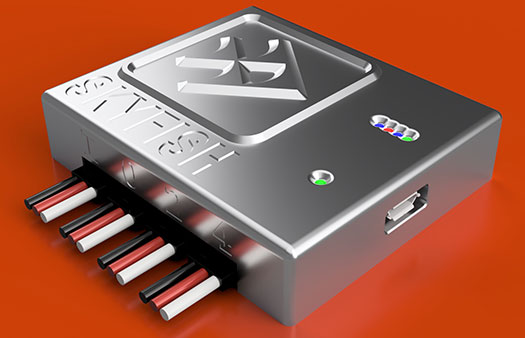
Parachute rescue system DRS-5 is designed for multicopters up to 8 kg; the DRS-10 for multicopters weighing 5–20 kg. The system consists of a carbon cage in which the parachute is stored as well as associated electronics. The electronics, including the sensors, monitor the flight status of a drone independent of the flight controller. A sophisticated algorithm merges this sensor data, enabling automatic crash detection and parachute ejection. All flight data and movements are recorded in a black box.
PrecisionPass assesses UAV data collected in the field. The toolkit lets pilots quickly determine if a data-collection job meets the required criteria or if it needs to be collected again. PrecisionPass assesses coverage, assesses image resolution and quality, reviews required metadata, speeds upload and processing times, and packages data for processing. The immediate feedback reduces the risk of failures during the analysis stage, all but eliminating the need to re-fly a mission, so customer needs are met in a timely and cost-efficient manner.
The Skyfish computing platform fully automates crucial infrastructure inspection and measurement tasks. It supports DJI and PixHawk flight controllers and other drone architectures, as well as 3D modeling software from companies such as Bentley Systems. Its easy-to-use interface enables anyone to fly, inspect and model complex infrastructure. The platform also pre-processes the collected infrastructure data and metadata to help create impeccable 3D models.
OpenIMU is a professionally supported, open-source GPS/GNSS-aided inertial navigation software stack for low-cost precise navigation applications. Integrating an inertial measurement unit (IMU)-based sensor network improves navigation and self-location capabilities. It is aimed at developing autonomously guided vehicles for industrial applications, autonomous cars, industrial robots and drones. OpenIMU enables advanced localization and navigation algorithm solutions; its extensible software infrastructure provides the code needed for algorithm development. A hardware development kit includes JTAG-pod, precision mount fixture, EVB and an OpenIMU300 module that features Aceinna’s 5 deg/hr, 9-Axis gyro, accelerometer and magnetometer sensor suite with an onboard 180-MHz ARM Coretex floating-point CPU.
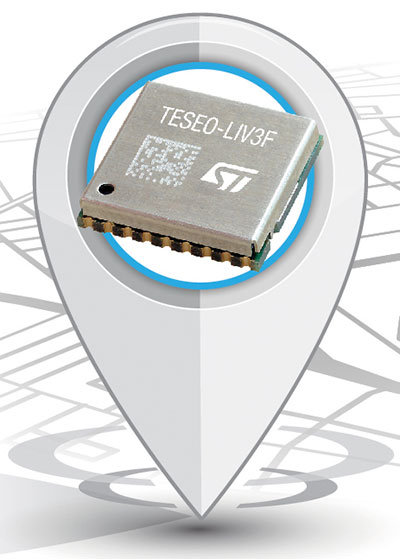
The Teseo-LIV3F module incorporates the Teseo III receiver. It speeds application development and adds up to 16 MB of Flash memory for firmware updating or data logging without a backup battery. Used by automotive and industrial sectors, the Teseo III multi-constellation receiver combines high accuracy with fast response time and low power consumption. The Teseo-LIV3F module enables makers and small engineering teams to leverage the Teseo III advantages in creating new products in the industrial and consumer market segments such as vehicle trackers, drones, anti-theft devices and pet locators, and systems for services such as fleet-management, tolling, vehicle sharing or public transportation.
Audi’s latest e-tron electric car will launch in Europe with a digital rear-view system. Developed by Ficosa, the camera monitoring system is made up of cameras and displays that replace traditional external side mirrors to increase safety and comfort. The vision system is comprised of two cameras, integrated into the sides of the car’s chassis, and two tactile displays inside the doors.
The UAV inspection industry continues to grow, as evidenced by these photos of actual end-user application. Unmanned systems follow precise flight paths to gather the data needed for inspection missions in the fields of insurance (home roof inspection), mining, construction and the pulp paper industry.
A free webinar on Thursday, Oct. 25 will show more of these applications and cover the requirements and challenges for positioning technology in commercial applications in urban and remote areas, including those generated by concerns about interference and spoofing.
Latest trends and challenges for drone-based aerial intelligence platforms for insurance and roofing applications
GNSS technology requirements for safe UAV BVLOS operations and a view of the regulatory frameworks
Importance of UAS traffic management systems (UTM)
Use cases in linear infrastructure inspection (railways, roads, power lines and others)
Challenges for GNSS systems in autonomous aerial vehicles and growing concerns about safety
Robustness of multi-GNSS receivers to jamming and spoofing
Latest innovation in GNSS technology concerning inspection applications and real-time accuracy/reliability
Earthworks contractors use this drone technology to perform detailed topographic surveys of project sites throughout all phases of construction. The new survey tool is reducing costs and time, allowing earthworks contractors to increase their profitability and ensure project success. (Photo: Paul Ross/Kespry)
In addition to a tailored application for roof inspections, targeted at insurance companies, UAV manufacturer Kespry provides a complete solution for construction and engineering companies to manage proposed and active earthwork operations. Without using multiple, cumbersome ground control points, survey-grade field data can be collected for an entire site in as little as 30 minutes.
In the webinar, attendees will learn how drone technology is being used to:
Validate proposed earthwork – reduce rework and extra earthmoving costs before the job begins
Safely measure earthwork activity – ensure subcontractor work and delivered material are constantly measured
Further application examples in construction projects will show how drones are providing construction companies with a new method for accurate survey work throughout their entire worksite that can:
Reduce up to 20 percent of total project costs by eliminating rework through regular cut and fill analysis of drone data
Eliminate up to 10 percent of earth moving costs through more accurate volumetric analysis
Perform more frequent surveys in-house with drones, reducing traditional survey equipment and service costs.
Kespry provides a complete solution for construction and engineering companies to better manage proposed and active earthwork operations. Without using multiple, cumbersome ground control points, survey-grade field data can be collected for an entire site in as little as 30 minutes. (Photo: Nathan Stump/Kespry)
In the first example show above, insurance claims for roof damage, the fully-autonomous system improves safety, reduces loss adjustment expenses, and delivers more accurate risk assessments, while reducing overall costs. For commercial property, the UAV solution helps prevent losses and informs underwriting decisions with high-resolution aerial and thermal imagery to identify exposures. Accurate, unbiased reports are easily prepared and shared with all parties. Mobile tools are provided to review inspection quality imagery within minutes of flight; artificial intelligence (AI) technology generates fully-dimensioned wireframes and 3D roof models
Drones for the pulp and paper industry
The drone and analytics platform enables companies to improve profitability through quick, cost-effective, and accurate surveying of chip and roundwood sites.
UAV applications in pulp and paper industry will be demo’d in the Oct 25 webinar (Photo: Jason Nichols/Kespry)
Kespry enables production plant and production managers to analyze stockpile inventories, better manage supply chain activity, and improve site operations — maximizing profitability across production and supply chain operations.
The company also supplies a drone-based AI platform for the aggregates and mining industry supplies accurate inventory management and mine planning. It will be demonstrated in the free October 25 webinar.
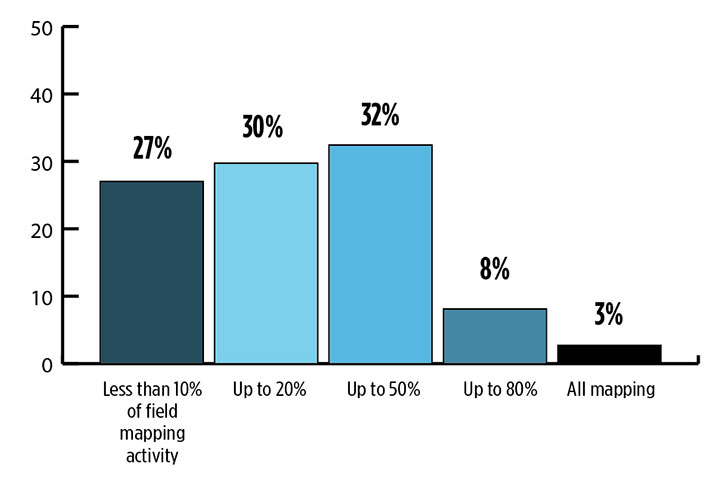
While UAVs are an exciting new technology for mapping, most respondents to our survey recognize the continued value of hands-on, in-the-field data collection.
Most respondents think UAVs could be used for as much as half of data collection, but very few expect UAVs to be used for more than that. UAVs are just one mobile collection method, of course. Others include autos such as SUVs, boats and all-terrain vehicles.
What role will UAVs play in the mapping industry over the next three years? (Source: GPS World 2018 State of the GNSS Industry survey)
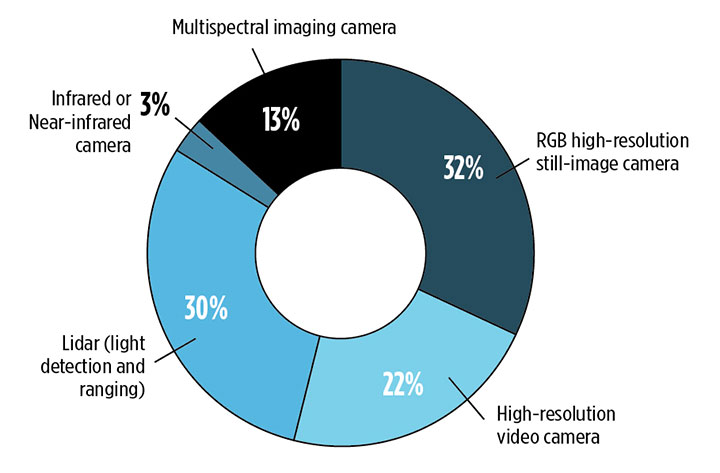
We also asked respondents how they use UAVs for data collection. RGB high-resolution still-image cameras and lidar are the most frequently used, with video cameras not far behind. Other specialty cameras collect infrared or thermal imagery, while specialty sensors collect everything from temperature to pressure and methane levels.
Whether mounted on a UAV, a vehicle, or on the ground, these technologies are used in fields as diverse as forest management, disaster response and infrastructure planning.
For instance, urban planners rely on mapping data for land value, topography and water and electricity resources. Meanwhile, forestry experts use infrared to detect areas of disease or die-off in the early stages.
Software in the Cloud. Turning to software, developments in cloud storage and open-source and subscription platforms are constantly improving geographic information systems (GIS). A wealth of GIS and GPS data is available from Google Maps, Apple Maps, OpenStreetMap and other applications. Specialty applications include Esri ArcGIS, Maptitude, Surfer and more. In the coming years, expect an increase in 3D modeling, digital elevation models (DEMs) and augmented reality.
What is the most valuable sensor to use in conjunction with GPS/GNSS aboard a UAV for mapping and data-collection purposes? What role will UAVs play in the mapping industry over the next three years? (Source: GPS World 2018 State of the GNSS Industry survey)
The automotive sector has been adopting digital mapping applications for use in self-driving cars, as well as fleet management, logistics control systems, and advanced driver assistance systems (ADAS).
Every year, more satellites are launched for mapping and GIS data collection, and they don’t all provide photo imagery. For instance, NASA’s Aqua satellite detected and mapped huge concentrations of carbon monoxide drifting east across the U.S. from western wildfires — important information for public health planning.
For more results from the 2018 State of the GNSS Industry, see this page.
Conducted online in July 2018, the GPS World State of the GNSS Industry survey compiled detailed answers to 30 key questions from 273 respondents, spread across six continents.
Prominent insights gained, and outlined in these pages: the PNT sector is booming, as opportunities outnumber obstacles; well-trained engineers are at a premium; and the Internet of Things is the newest market driver, perhaps the most powerful yet.
No, this is not a drill or a major motion picture event.
During my lifetime, many natural disasters that have taken place around the globe. These unfortunate events have created mass destruction and caused many deaths by a variety of environmental elements, ranging from earthquakes and volcanic eruptions to hurricanes and snowstorms.
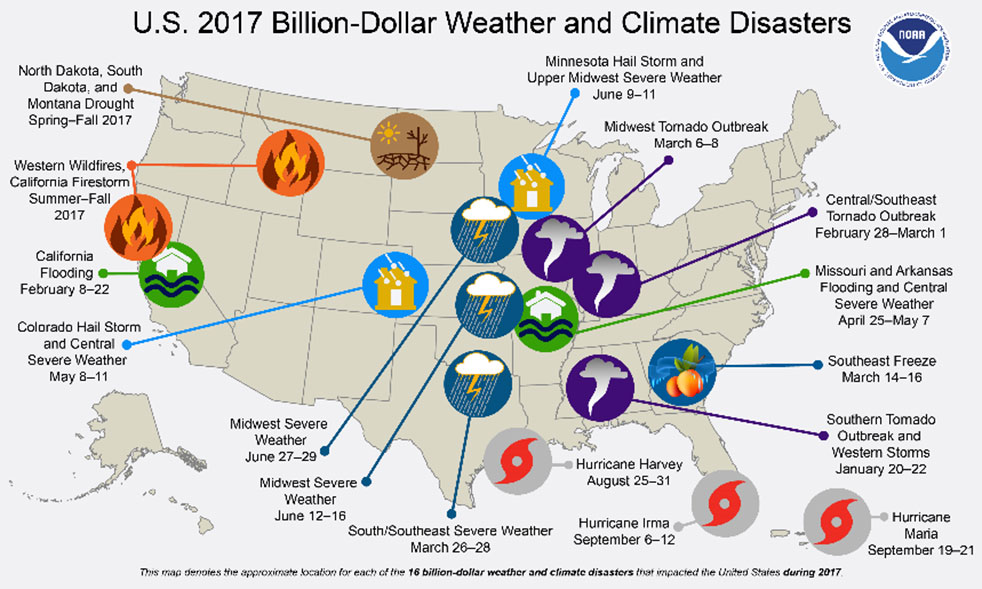
Disasters in the United States. (Image: FEMA)
Once Mother Nature decides to unleash her wrath, rarely anything stands in her way. Some types of disasters create situations worse than others, but all have a reputation of leaving a trail of death and destruction.
Search and rescue is the first and foremost priority when it comes to these disasters, with cleanup and rebuilding to soon follow.
The role of the land surveyor, however, doesn’t usually enter the discussion when it comes to these situations. It has always been considered an occupation that fills an important role in development, construction and parcel ownership, but rarely is discussed in the same terms as a fireman, policeman or doctor.
We will take a closer examination at how the surveyor uses skills developed through education, technical training and practical application of geographical data to quietly assist those in need through these difficult bouts with Mother Nature.
First, however, we will discuss various types of the deadliest natural disasters, the amount of destruction that has been caused and types of problems (besides deaths) that were left because of these tragedies.
Disasters throughout history
When describing natural disasters, the obvious ones come to mind: earthquake, hurricane/typhoon/cyclone, tornado, wildfire, flooding/monsoon, drought/famine, volcanic eruption, tsunami, sandstorm, avalanche, and snowstorm.
All of these have wreaked havoc on mankind for centuries, with more physical destruction taking place in the past few centuries.
Some of the factors leading to an increase in this devastation are gains overall population and amount of buildings and improvements in populated areas. Let’s look at how each disaster impacts the areas in which it occurs:
Flooding/Monsoon
Historically the deadliest type of natural disaster, rainfall through storms and monsoons cause flood events that have caused millions of deaths in several instances around the world. Most of the deaths caused by flooding situations are due to drowning in floodwaters that inundate areas not normally affected by normal amounts of rain.
The largest flood in recorded history took place in China during 1931, combining melting snow and ice with ongoing rain events to create a continuous flooding event that lasted most of the year. Death toll estimates range from 400,000 to almost 4 million, as many of the victims either died or moved to other regions with no trace.
Hurricane/Typhoon/Cyclone
This is another type of flooding disaster, but it combines large amounts of rain gathered from ocean storms with high winds to batter shoreline and inland areas. These storms can often stall in place, causing significant damage by both wind and rain.
Tornado
Most weather systems associated with creating tornadoes are believed to occur in the United States, but they happen all over the world. Many of the deadliest tornadoes have taken place in the Middle East, including Bangladesh, Russia and Pakistan. These storms can include torrential rain, but most of the damage caused by tornadoes is wind-related.
Earthquake
Shifting tectonic plates and earth-shaking tremors are a significant cause of damage and deaths throughout the world. Most of the highest death tolls have taken place in Asia, with the biggest loss of life occurring in Shaanxi, China, on Jan. 23, 1556, with more than 830,000 deaths.
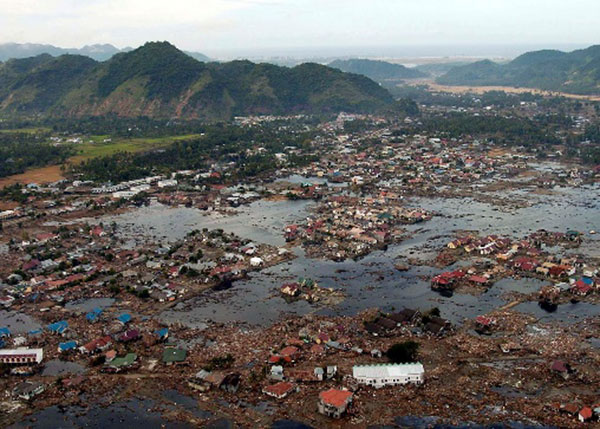
Indian Ocean (Jan. 2, 2005): A village near the coast of Sumatra lays in ruin after the Tsunami that struck South East Asia. (Photo: U.S. Navy/Photographer’s Mate 2nd Class Philip A. McDaniel)
Tsunami
Often a secondary disaster generally associated with earthquakes in coastal areas, tsunamis kill thousands by inundating shorelines with huge waves and sending vast amounts of water into low-lying areas and poorly constructed seaside villages. The largest tsunami in recent memory was on Dec. 26, 2004, in the Indian Ocean off the coast of Indonesia, with the death toll reaching 280,000 people.
Volcano
The biggest cause of earthquakes is typically molten lava expanding to shift tectonic plates, but volcanoes are formed with the lava and associated gases finding an escape in the Earth’s crust.
Once a volcano has formed, an eruption can lead to significant damage from lava flow onto adjacent land and hot ash spewed into the atmosphere. Many volcanic eruptions throughout history have buried local cities and villages, making them virtually disappear.
Wildfire
Grabbing the headlines more recently has been the proliferation of wildfires. While not causing the substantial loss-of-life associated with many other natural disasters, wildfires are responsible for scorching hundreds of thousands of acres of forest and brush areas, as well as decimating neighborhoods.
Avalanche
This disaster only takes place in locations with significant snow pack and elevation changes. After large amounts of snowfall, various factors lead to movement of large areas of snow and ice down mountainous slopes. Often these events take place near cities and villages in mountainous regions and can leave the inhabitants buried and unreachable.
Other Types of Natural Disasters
While the varieties of events listed above can create large-scale destruction, there are others that, while smaller in nature, can collectively cause great damage and loss of life. Thunderstorms, snowstorms and sandstorms are wind-related and can be devastating to the areas being affected.
Other natural disasters that often don’t get the same recognition as those listed above include drought and famine. These environmental tragedies ruin thousands of lives, and it take years to recover from the damage caused by these inflictions.
Disaster hits. Now what?
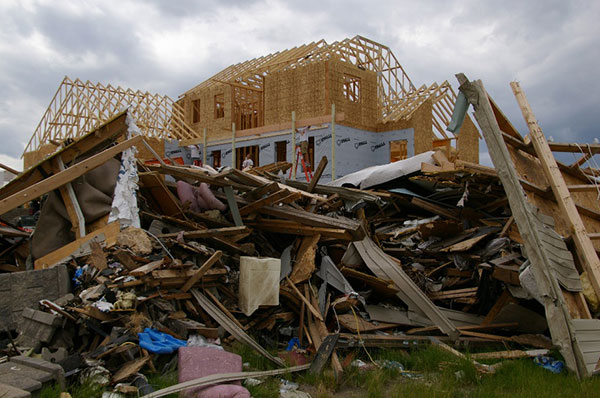
June 28, 2008: A house in Parkersburg, Iowa, is being rebuilt while debris from a deadly EF5 tornado still covers the ground. (Photo: FEMA/Richard O’Reilly)
All of these disaster types have led to a great number of fatalities and total devastation of cities and roadways. To help us understand what type of assistance the surveyor can provide, we first need to identify the conditions left by each of these events.
Most of the disasters simply wipe out whatever is in its path; from tornadoes, hurricanes, and wildfires to earthquakes, avalanches and tsunamis, the regions affected are left in shambles after the occurrence.
The initial search and rescue through the rubble takes manpower and careful identification of areas where people are known to inhabit, either as residences, places of employment or public spaces. These areas require retracement of existing mapping and atlases to accurately identify those places for timely recovery.
Once the search-and-rescue efforts have ceased and cleanup/rebuilding commences, the destroyed areas will need to be remapped based upon existing parcels and ownership rights. Reconciliation of existing parcels, subdivisions and rights-of-way will be required to properly return the injured areas to a habitable state.
The one disaster that’s a big wildcard, however, is the earthquake. The devastation is like the others and generally will need rebuilding like the others, but with one large difference; putting everything back where it belongs.
When large tremors cause significant shifts in inhabited and/or complex parcels, the ability to retrace existing parcels, subdivisions and rights-of-way to place them in their original location becomes a nightmare.
How surveyors and GNSS help before and after disasters
As expert measurers and establishers of boundaries, the surveyor provides guidance for the creation of parcels and rights-of-way. Through extensive education, training and experience, the surveyor combines field reconnaissance, legal definitions of parcels and high-level mathematics to provide direction for the creation and retracement of real property.
After experiencing a devastating event like the ones described above, the surveyor becomes a key position in rebuilding the affected area.
Prior to the invention and proliferation of GNSS technology, however, the use of state plane coordinate data was a tedious and time-consuming task (see my January 2017 article at GPS World).
Establishing coordinate values across a large region and/or utility system was not practical from a time or cost viewpoint. The arrival of GNSS technology in the 1990s changed that situation with the ability to determine coordinate values in real-time and create large databases of infrastructure and utility information. Government agencies (and surveyors) now could replicate, with acceptable accuracy and precision, locations of improvements and utilities throughout their jurisdiction.
Surveyors are now being called upon to assist with search and rescue efforts when these disasters hit to help locate and turn off existing utilities (i.e. electricity, gas, water), and to provide mapping assistance for retracing where people may be in the rubble. Because lives are at stake, timely location is essential for these services and GNSS technology use by the surveyor provides a much-needed service.
Once these disaster events being a rebuilding mode, the surveyor steps in to find the existing parcel and right-of-way lines to assist the respective owners where a deed or roadway was previously located. Most times, the surveyor can retrace existing line by locating buried monuments and recreating existing deed descriptions and/or roadway locations.
Where there becomes a problem is when the devastation is large enough to destroy all existing monuments and leave no trace of any occupied land. The surveyor must expand the search area, as far as needed, to find the closest available monuments in which to begin rebuilding the parcel descriptions.
Depending on the site conditions, GNSS equipment is used to locate the positions of the nearest monuments so the surveyor can perform retracement calculations for the disturbed area.
Once the area to be re-established to calculated, the surveyor can return to the site and place markers signifying parcels and rights-of-way for the rebuilding of roads, utilities and buildings. GNSS receivers are again utilized to increase the proficiency of the field crew by allowing the installation of the markers over a large area in a short amount of time.
How surveyors can prepare for future events
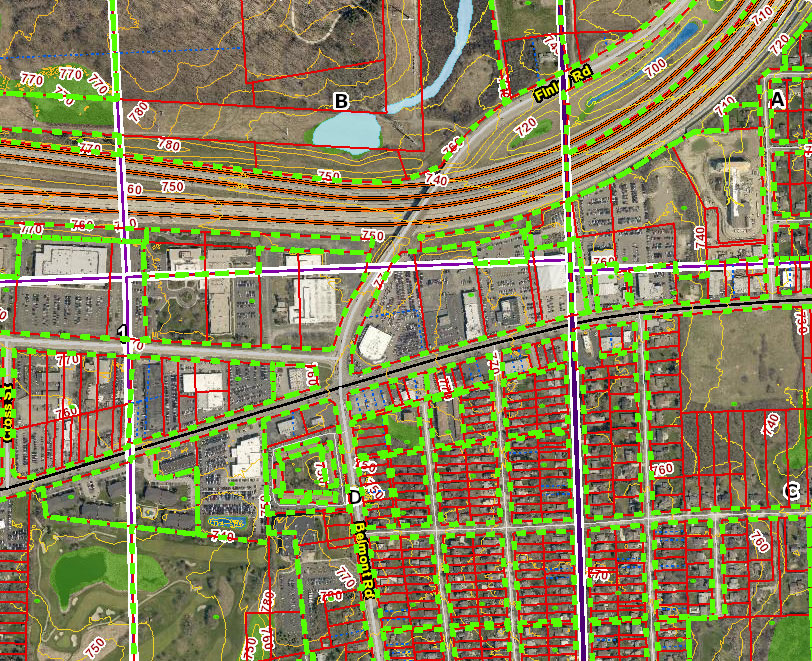
Image: DuPage County, Illinois, GIS
As previously written in my January 2017 column, GNSS technology has helped expand geographic information systems (GIS) into a database beast, containing everything from voter districts, zoning regions and floodplain maps to locations of most municipal utility maps and databases.
When these databases have included a geodetic layer of survey information overseen by the licensed land surveyor, the GIS is now more than a glorified digital Etch-A-Sketch. These entities within the database have geolocation as part of its dataset, with varying accuracy depending on the source of the data.
By having all this information available in a digital format, typically saved in a cloud-computing location, the ability to replicate these entities becomes a simple exercise. As more information becomes available, it needs to be included into the database for future mapping consideration.
All relevant data, together with a geolocation tag, becomes valuable for future retracement. This information could be used to locate possible survivors during a disaster event.
Upcoming technology to assist surveyors with disaster relief planning
Image: Esri
Many of the tools being utilized by surveyors have the capability of helping with mapping and data collection of municipal and public facilities for GIS database inclusion.
We currently use laser and lidar scanners both terrestrially and aerially to collect point-cloud data for establishing existing conditions of various sites. This point cloud, along with high-resolution photography, can be used to augment and enhance new and existing GIS databases with extensive datasets.
By having this additional information collected and available digitally, qualified experts can perform disaster simulation tests to depict various environmental events and determine what strategies will be necessary for search-and-rescue efforts.
These experts can also use this data to predict potential flood paths, conduct seismic modeling to determine building shift, and combine weather conditions with conceivable wildfire-capable areas. All these potential life-saving exercises can utilize the surveyor as a significant data-collection source.
Coming to a theater near you…
Whether one believes in climate change or just being affected by an active environmental cycle of natural disasters, the entire world is prone to have an occurrence of at least one of these events.
Since these events are not going away, remember to help your fellow man, woman or child in their time of need. It is the duty of the surveyor to provide a service that is intended to protect the public, and being there for disaster planning, prevention and recovery is part of our mission.
Think of us like the Avengers; now there’s a sequel I’d pay to see.
A number of geospatial companies played a key role in the government’s response to the Kilauea Volcano eruption. The volcano on the Big Island of Hawaii began erupting May 3, and while quiet for more than a week, it could resume erupting at any time.
Mapping the flow. As a resident of Hawaii, Brennan O’Neill, Hawaiian branch manager of Frontier Precision, was in a unique position to offer support. Frontier Precision provided free access to technology and expertise to assist in mapping the lava flow.
“I had to help out,” O’Neill said. “It was tearing at my soul. For a geologist, it’s even more powerful than that. The lava flow is like a living mass that has a mind of its own, creeping, glowing — an upside-down conveyor belt surging forward and burning everything in its path.”
Through Frontier Precision, O’Neill offered high-tech mapping equipment, his own expertise, and the help of Nathan Stephenson, an applied geospatial engineer working in the company’s Denver office.
“We used a combination of Trimble R10s and Trimble R8s to gather accurate data points on the ground,” Stephenson said.
This thermal map shows the fissure system and lava flows as of 6 a.m. on Saturday, Aug. 11. The thermal map was constructed by stitching many overlapping oblique thermal images collected by a handheld thermal camera during a helicopter overflight of the flow field. The base is a copyrighted color satellite image (used with permission) provided by Digital Globe. (Map: USGS)
The mapping team flew UAS drones over the flow to gather visual imagery data, matched it to the ground reference points, stitched the photos together and draped it over county maps. The process was repeated as often as needed — daily, and sometimes even hourly — to show the speed and direction of the flow.
Stephenson isn’t new to mapping lava flows. As a graduate student at the University of Hawaii – Hilo, he worked on collecting data on the Pahoa eruption in 2014, and he’s seen advances in technology in just a few years.
“One thing we have now that we didn’t have in 2014 was a thermal radiometric camera that helps us map more accurately at night and enables us to capture large heat signatures.”
The collected data helps Hawaii Civil Defense and other agencies keep the public informed and safe, and in the long term it also contributes to the store of scientific knowledge about eruptions and lava flow behavior.
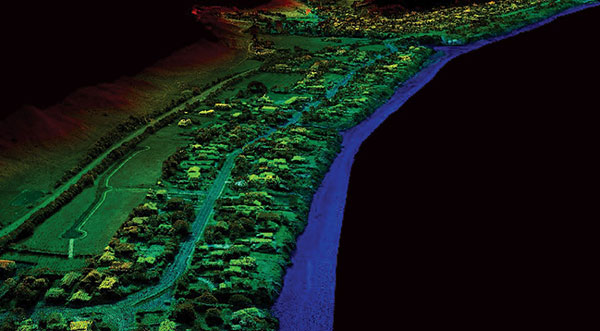
Lidar image of the Hawaii dataset showing the Kilauea Calderand the Halena’uma’u Crater and within it. (Image: Quantum Spatial)
Airborne lidar insights. Another technology that aids in volcano response is lidar. High-resolution lidar surveys help first responders, scientists and government agencies monitor Kilauea conditions and predict future lava flows.
Independent geospatial data firm Quantum Spatial Inc. (QSI) has conducted high-resolution lidar surveys of areas surrounding the Kilauea volcano eruption in Hawaii.
The emergency response effort was part of the U.S. Geological Survey’s (USGS) Rapid Response Imagery Products (RRIP) in support of the Kilauea’s 2018 East Rift Zone – Remote Sensing Acquisition Requirement.
The USGS Hawaiian Volcano Observatory (HVO), along with emergency responders, government agencies and academics, will use the data to better understand the conditions and characteristics of the volcano, and help planners model potential lava flows, which may better predict and respond to future flows and enhance safety of residents.
The QSI team, which included GEO1 and Windward Aviation, deployed within days to acquire high-resolution lidar at point densities averaging from 40 to 80 ppsm, with up to 150 ppsm in select areas and 100-mp digital imagery using a Riegl dual VUX-1 LR sensor pod equipped with ABGPS/IMU mounted on a Hughes 500D helicopter.
The project required 11 missions over the course of six days, operating at times as low as 500 feet above the ground and above active flows and nearby erupting calderas. With a need for a quick turn around, QSI deployed an analyst with the flight crew to post process each mission within hours of collection.
The data was uploaded to the Geospatial Repository and Data Management System (GRiD) interface, developed by the U.S. Army Corps of Engineers (USACE), where additional data products have been developed and provided to the response team that includes FEMA, Hawaii’s Emergency Operations Center (EOC) and the Hawaii County Civil Defense.
After data collection, QSI measured topographic shifts during the processing by comparing new data with a 2011 lidar collection from the same area. Survey specialists and USGS experts confirmed within hours of processing QSI’s lidar data that areas within the site had shifted up to 1.5 meters east, 2 meters to the north and 1 meter in elevation.
USGS scientists will continue to examine the new topographic data to better understand the nature of these shifts, and integrate it into lava flow models for more accurate predictive modeling.
The eruption in action. Using small unmanned aerial systems (sUAS) together with air-quality sensors, advanced imaging tools and Esri’s spatial analytics and mapping, a team from the Center for Robot-Assisted Search and Rescue (CRASAR) provided real-time aerial views of the eruption.
The five volunteers armed with drones, advanced sensor systems and GIS technologies joined the response effort May 14-19 at Kilauea Volcano Lower East Rift Zone to assist in tracking and predicting the ongoing volcanic eruption. The team supplemented the University of Hawaii Hilo’s (UHH) sUAS capabilities, allowing UHH sUAS operators to focus on geographical and volcanology.
The CRASAR team identified a new fissure not visible from the ground, projected the lava flow rate during the night when manned helicopters were not allowed to fly, and provided ongoing data collection from new thermal sensors technology.
During the six-day Leilani deployment, the CRASAR team flew 44 sUAS flights, including 16 at night, using DJI 200, 210, Inspire, and Mavic Pro drones. Esri’s Drone2Map for ArcGIS together with Hangar’s Enterprise Platform for 360-degree imaging enabled rapid 360-imaging for situational awareness.
DJI’s new XT2 thermal sensor provided unprecedented drone-based air-quality monitoring. Video and data were shared with local first responders using FirstNet, the first high-speed, nationwide wireless broadband network dedicated to public safety.
The CRASAR response marks the first known use of sUAS for emergency response to a volcanic eruption and first known use of sUAS for sampling air quality.
The GIS mapping and imaging technologies responders used on the scene at Kilauea Volcano Lower East Rift Zone are available here.
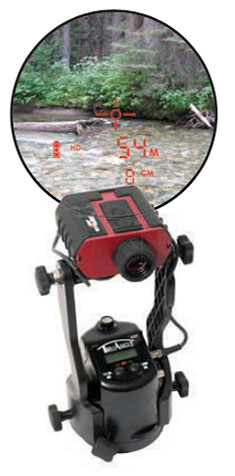
Using lasers in conjunction with GPS can collect richer data, faster, and streamline survey and mapping projects across many disciplines that draw on mapping and geospatial information systems.
To learn more about the exact processes involved in Integrating a professional measurement and mapping laser to your GIS toolbox, both saving time and enabling collection of additional attribute data attend GPS World’s free webinar on Thursday, Aug. 16: LaserGIS: Your Gateway to Collect More GIS Data in Less Time.
The webinar will be available for download 24 hours after broadcast time, for those unable to attend live.
The applicable fields for this enabling technology include surveying, construction, ecosystem management, watershed analysis, geological mapping, environmental impact assessments and more.
Photo: Laser Technology Inc.
A natural resources ecosystem manager said, “I map areas that are either impossible to occupy or simply can’t be disturbed, so using laser-based reflectorless measurement technology is ideal for wildlife habitat research. When performing soil surveys, I can easily calculate the grade of a slope by using the missing line routine. I even used the Laser Technology TruPulse once to track the progress of a wildfire. This technology is a must-have for our crews because it’s highly portable and produces reliable data.”
A land conservation specialist performing watershed analysis added, “Stream channel surveying tools have come a long way since I graduated college. I’m now able to mark a stream’s course, calculate the gradient and measure the width of the riparian zone, all with a simple point-and-shoot TruPulse laser. For wetland delineation projects, being able to shoot directly to the bank saves a huge amount of time and keeps me and my crew as dry as possible.”
A geologist performing mapping as part of his work routine said, “I need to accurately track geological structures in mines and outcrops, and would really struggle with collecting measurements if it wasn’t for my TruPulse 360. With the laser, I can get a measurement to any type of surface and don’t have to stand in dangerous areas, so I can be extremely productive and safe. When I have to verify the volume of our biomass stockpile, I just integrate my laser with MapSmart and get reliable calculations in minutes, right in the field.”
Finally, an archaeologist performing an environmental impact assessment stated, “Conserving archaeology sites is just as important as researching and analyzing them. Integrating the TruPulse with GPS allows me to make better planning decisions with all types of resource considerations without compromising data integrity or delicate areas. The TruPulse’s onboard solutions for height and 3D missing line make my job so much easier and far more productive than conventional measurement tools.”
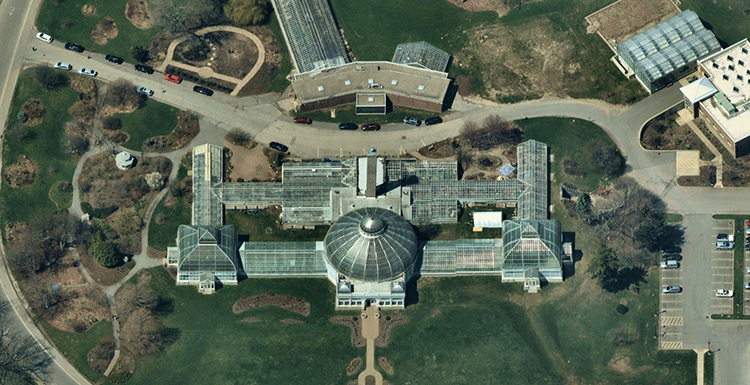
A capture of the Buffalo and Erie County Botanical Gardens in Buffalo, New York, taken in May 2018. (Image: Nearmap)
Fresh off an eye-grabbing appearance showcasing its new 3D products at last week’s Esri User Conference, Nearmap will deliver a free “Cooking with GIS” webinar Thursday, July 26.
The hour-long session will highlight ways that the company’s vertical, oblique and 3D aerial imagery can bring competitive advantage to surveyors, construction managers, telecomm engineers, city planners, realtors and investors, building contractors, property and natural resource managers, and many others. Using their geographic information systems (GIS) skills, these professionals can perform deep analysis and make decisions with confidence using detailed and up-to-date visual insights.
Nearmap won 2017 Esri’s Best New Content Partner Award in 2017, and the free webinar, subtitled “Esri + Nearmap,” focuses on the key advantages of seamlessly integration the company’s high-resolution aerial imagery into Esri mapping and software products.
Esri is an international supplier of geospatial information systems with more than one million users in 200 countries around the world. Nearmap’s ArcGIS Image Service Online provides users an easy and efficient way to incorporate high-resolution PhotoMaps within Esri ArcGIS Online. ArcGIS users can instantly access current 2.8” imagery within days of capture while also showing change over time using Nearmap’s historical archive.
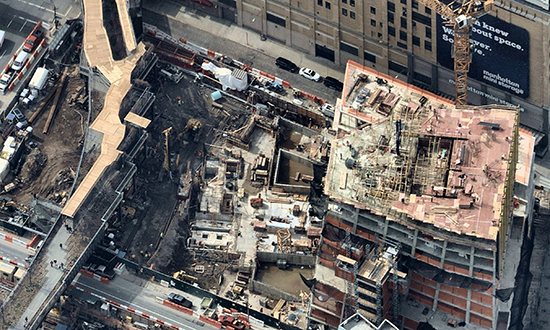
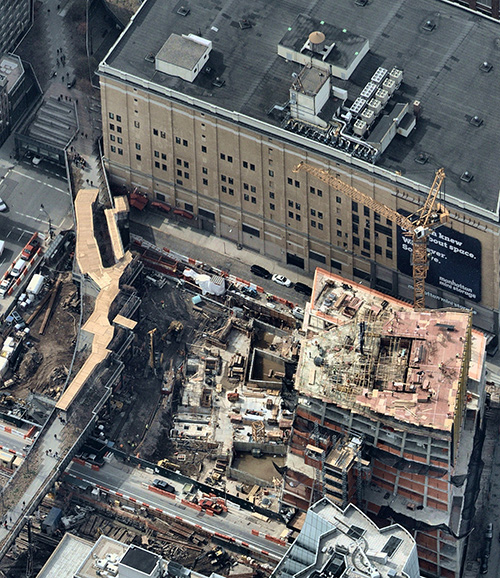
A New York City building site with temporary covered pedestrian walkway. (Photo: Nearmap)
As an integral partner in the ArcGIS ecosystem, Nearmap helped integrate their imagery with a wide range of Esri software solutions—both off the shelf and bespoke. Coupled with Portal for ArcGIS, the Nearmap ImageServer can be used in any application that is able to talk to ArcGIS Server, delivering power to the platform.
3D. Nearmap recently brought dramatic change to the aerial imagery market, announcing a national survey program providing high-resolution oblique imagery and derivative 3D products from its patented HyperCamera2 technology. The new camera system provides a high degree of overlap from different angles, so Nearmap can reconstruct the real world in detail, producing not only high-resolution orthomosaic and oblique imagery, but also surface and terrain models, natural color point clouds and textured 3-D meshes.
Users can immerse themselves in 3D textured mesh models, improving analysis and design activities. They can see different elevations and line of sight using the 3-D information. These features become important in many use cases, including airport or utility planning, or to determine the best location for a crane before a construction project.
Other applications include wireless telecommunications network modeling, solar panel design, tactical resource deployment, real estate development promotion, property valuation, insurance underwriting and smart cities.
Delivery. Nearmap is delivered through a user-friendly interface called MapBrowser or accessed via Esri, Autodesk and other third-party solutions.
Nearmap captures urban U.S. imagery multiple times per year, processes massive amounts of visual data, and uploads up-to-date aerial maps to the cloud within days. Patented imaging and processing technology delivery at speed of high-resolution aerial imagery as a service: orthographic (vertical) maps, multi-perspective panoramas and oblique aerial views.
The fully cloud-based PhotoMaps are accessible instantly via desktop and mobile, with 70% of the U.S. covered in major metros.
Clarity, color and 2.8″ GSD detail help users identify and accurately measure ground features with ease, detect change over time or monitor progress through the company’s library of precisely georeferenced historical imagery.
Nearmap imagery is refreshed up to three times per year principal coverage areas, with three orthomosaic captures incorporating one oblique capture. Nearmap’s orthomosaic imagery already covers nearly 70 percent of the U.S. population dating back to 2014.
Speakers on the July 26 webinar include Kevin Kwok, Nearmap technical product manager; Chuck Dostal, Nearmap geospatial technical engineer; and customer Mike Otillio, director of research for Colliers International, servicing the commercial real estate industry.
Esri has published its latest book, “GIS for Surface Water: Using the National Hydrography Dataset,” by Jeff Simley, which details how to use geographic information system (GIS) technology to visualize and analyze data sets. Simley is an award-winning cartographer and the former lead of the Hydrography Program at the United States Geological Survey (USGS).
The book examines the complexities of surface water systems and shows readers how to use the Esri ArcGIS software, the USGS’s National Hydrography Dataset (NHD) and the Watershed Boundary Dataset (WBD), and the U.S. Environmental Protection Agency’s NHDPlus dataset to better study and manage the United States’ vast water system.
According to Esri, the book thoroughly examines the representation of water features and their attributes in a GIS and then turns its attention on how that data is structured in the NHD, WBD and NHDPlus datasets. In addition, after seeing how surface water hydrography can be modeled in a GIS, readers can then learn how to use these tools to solve real-world problems, such as protecting and restoring the fisheries habitat in Washington.
The book also offers instructions to guide readers to create surface water flow-volume maps that show how much water flows through any given river system.
“This book is unique in that it is the most comprehensive, authoritative source for the NHD,” said hydrologist David Maidment in the book’s foreword. “But it is more than that: It is a monument to the intellectual craft and dedicated effort of a generation of digital mapmakers who devoted their professional careers to the completion of this enormous task.”
Esri will be hosting its 38th annual Esri User Conference July 9-13 at the San Diego Convention Center in San Diego. The company expects more than 18,000 mapping and GIS users to attend the event, which will include 345 technical workshops and 243 presentations.
Futurist Juan Enriquez will present the keynote speech, “Evolving Ourselves — Redesigning the Future of Humanity.” According to Esri, his talk will explore the future of humanity as it depends on the intersection of geography and genetics as we design our places and ourselves.
Attendees will also hear presentations from users who are creating smarter organizations that can tackle complex global issues, including how to create more sustainable businesses, address homelessness, diminish poverty and counter the effects of climate change, Esri added.
Other presenters will include:
Civil rights leader and activist Dolores Huerta, who will discuss how the Dolores Huerta Foundation utilizes Esri technology to inspire and organize communities to build volunteer organizations empowered to pursue social justice;
New York Times best-selling authors James and Deborah Fallows, who will discuss their book “Our Towns: A 100,000-Mile Journey into the Heart of America,” which provides anecdotal stories about the challenges small-town America faces; and
Felix Finkbeiner, a recent college graduate and recipient of the German Federal Cross of Merit, will detail his Trillion Trees Campaign — a commitment to the environment that has grown from planting 1 million trees to planting more than 15 billion trees in 190 countries under the guidance of the United Nations Environment Programme.
“The Esri User Conference is truly as the name suggests — a conference for our users,” said Jack Dangermond, Esri founder and president. “This is an opportunity for all of us to come together and learn from each other so we can take part in personal development and organizational advancement to further the impact that we can have on our planet.”
ILMF is a technical conference and exhibition showcasing the latest airborne, terrestrial and underwater lidar, as well as emerging remote-sensing and data collection tools and technologies.
According to organizers, the show will allow attendees and exhibitors to connect with hundreds of professionals seeking lidar and other 3D geospatial data collection technologies to support asset management, civil infrastructure, coastal zone mapping, emergency services and disaster response, land and natural resource management, urban modeling and more. It will also cover the latest advances in lidar technology.
Keynote speakers at the event will include the U.S. Geological Survey’s Jeff Sloan, who will discuss if data from UAS sensors will overtake manned and satellite sources; Colorado State University’s Michael Lefsky, who will discuss reconstructing historic land use and forest structure using aerial photos and structure from motion analysis; and the NASA Jet Propulsion Laboratory’s Eric Larour, who will address a new tool from NASA for coastal planners.
ILMF will be co-located with the ASPRS Annual Conference. The combined event will feature a single exhibit hall. The two events will still have their own technical programs, and attendees will have the option to purchase a conference pass for programs of their choice or a universal pass for all offered programs.