Skyward, a Verizon company, has announced its integration with Pix4D, a photogrammetry software suite for drone mapping. The partnership gives customers the ability to turn drone data into 2D maps and 3D models.
Enterprises and drone pilots can now plan flights, receive approval to fly in controlled airspace with LAANC, fly with Skyward’s InFlight ground control station, and process data using Pix4D — all from within the Skyward platform.
“Skyward has been bringing our customers tools to access airspace, plan and fly — now they can produce business-ready data deliverables without leaving Skyward,” said Mariah Scott, Skyward president. “Enterprises in construction, energy and utilities, and the public sector can get even more ROI out of their drone programs when combining Skyward’s drone management platform with Pix4D’s market-leading photogrammetry tools.”
Skyward Mapping & Modeling, powered by Pix4D, enables customers to create, view, measure, and export 2D orthomosaic maps and 3D photogrammetric models right from Skyward’s web app. With the processing power of Pix4D, Skyward customers can get business-ready data sets through a seamless plan, fly, process workflow.
“Enterprises are seeking to scale their drone operations and transform their businesses with better data and faster time to insight. Skyward’s platform, along with the power of Pix4D, delivers a powerful, comprehensive solution,” said Christopher Cressy, Pix4D managing director for North America.
To learn more about Skyward’s mapping and modeling features, join a webinar on June 8 at 2 p.m. ET. Enterprises and commercial operators can try Skyward Mapping & Modeling powered by Pix4D free for 30 days.
The worlds of UAVs, lidar and surveying overlap, with UAV-based lidar able to shed light on places that are difficult or dangerous to access by other means.
Two questions come into play when deciding whether to use UAV-based lidar for a surveying project. First, do you use a UAV or a manned aircraft? The answer concerns cost, safety and efficiency.
Second, do you use only photogrammetry or photogrammetry plus lidar? This answer depends not only on cost, but payload weight — the single biggest constraint with UAVs. Lidar scanners weigh considerably more than comparable digital cameras.
Far from being mutually exclusive, photogrammetry and lidar are complementary, because digital images make it possible to colorize lidar point clouds, making them easier to interpret. However, the less a UAV’s payload weighs, the greater its flight time per battery charge.
“Most surveyors do not want to be UAV pilots. They want to do their job faster and easier,” said Jake McCay, director of business development at Lidar USA. His company manufactures laser systems — integrated with IMUs and software — for backpack systems, UAVs and helicopters. UAVs make surveyors much more productive and yield more accurate data because they enable them to collect many more points, he said.
UAV versus manned aircraft
Traditionally, data for corridor mapping — such as for power lines and railroads — has been captured with helicopters. However, cost and safety considerations have increasingly shifted the balance toward UAVs, especially hybrid systems that can take off vertically then transition to horizontal flight.
UAVs are also able to fly much lower than manned helicopters, thereby capturing data at much greater resolution.
Nevertheless, manned aircraft still have advantages. “Typically, the break-even is somewhere between 20 km and 40 km on a corridor mapping project if you consider a multi-rotor setup,” said Philipp Amon, business division manager, ULS, Riegl Laser Measurement Systems GmbH. “It takes a week of data acquisition using a UAV and two staff out in the field for what you can normally collect in half a day using a manned aircraft. The costs are almost the same.”
Beyond-visual-line-of-sight (BVLOS) flights are challenging for UAV pilots, because it makes them nervous to lose sight of their expensive platform. Successful BVLOS flights require a dependable and redundant data link. High-quality video transmissions that allow operators to monitor their UAV’s behavior in real time and with no significant latency are also very helpful. “If you do not have all these systems in place, I would not risk it either,” Amon said.
Whether mapping a corridor with a UAV or a manned helicopter, it is best to fly in one direction to the side of the corridor, then return on the other side, capturing data at an oblique angle rather than at nadir. This doubles the point density, enables the correction of any shadows created in a single flight, and — in the case of power lines — enhances safety.
Manned operations require a team of four and a helicopter, as well and a much greater focus on safety than UAVs, said John “JP” Cannon. Cannon is a UAV pilot for PrecisionHawk and team lead of the company’s lidar flight operations, totaling five pilots and more than 10 lidar sensors.
With a manned aerial survey, “You are a little more efficient, but you are burning a lot more logistics to get to that point,” he said. With a UAV, “if you have a properly calibrated sensor and a well-trained pilot, you can get even better data because you can fly lower and slower.” A manned helicopter would require multiple passes to get the same quality of data.
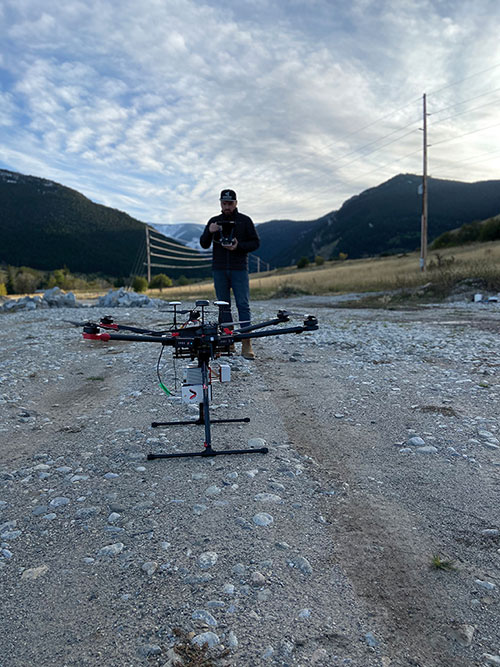
UAVs can collect data even in very remote locations, for later post-processing. (Photo: Lidar USA)
Lidar and photogrammetry
“We combine our lidar systems with all kinds of photogrammetry solutions, such as standard RGB cameras, in both nadir and oblique mounting options,” Amon said. “We also have multi-spectral cameras, hyperspectral cameras, and thermal-imaging sensors in our portfolio, and we offer fully integrated systems that combine all these sensors into one system.”
His customers prefer to use lidar sensors, especially to penetrate vegetation, Amon said. “That is often the most critical part of a survey, especially if you have dense vegetation and are looking for small objects, like in a powerline survey.” While a laser scanner’s multiple returns make it possible to extract surfaces even under vegetation, photogrammetry excels for spot detection.
“If you really want to nail down the error at a specific point, you will need to look at the photogrammetry data. If you want to do surface extraction, classification and remove vegetation, then you are looking for lidar.”
It is generally much faster to post-process lidar data because it does not require georeferencing and correcting thousands of images, but extracting and classifying features takes about the same amount of time.
Lidar “enables utility industry leaders to more effectively manage their networks,” said Cannon. It gives them “a visibility of their assets that photogrammetry just cannot provide, with more robust, precise and consistent data sets.”
Lidar data, he argued, is also less labor-intensive than photogrammetry, because the latter requires constantly tweaking camera features to deal with changes in the environment, such as the amount of light, whereas a well-calibrated lidar scanner “always performs.”
After having tried numerous lidar scanners over the years, PrecisionHawk chose the Riegl miniVUX-1DL, a downward-looking version that can shoot 23˚ off nadir, forward, center and rear. “We use it 20 times a day across multiple platforms.,” Cannon said. “Its data output is consistent and reliable.”
Dissenting voice
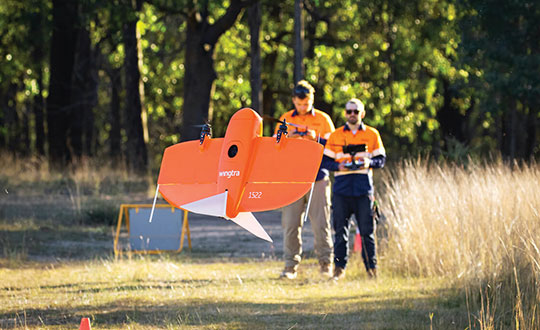
A dissenting voice is that of Wingtra, a manufacturer of vertical take-off and landing UAVs for mapping, survey and mining industry professionals, which has decided not to pursue UAV-based lidar for surveying. “We looked at different use cases, which sensor makes sense for each one, what is already there, and what can be done with manned aircraft and photogrammetry,” explained Andrea Nater, the company’s customer success manager.
“We found that the space for UAV-based lidar systems is very small. There are claims about very high accuracy, but we have not seen that. The point density we have seen so far is limited to 10-cm spacing, so you are really limited in an accurate and dense point cloud, whereas you can have a much higher resolution with photogrammetry.”
While the platform’s absolute position is independent of whether it carries a digital camera or a lidar sensor, “if you have fewer points on the ground, you also have less accuracy,” Nater said. For large areas, UAV-based lidar cannot compete with manned aircraft carrying expensive systems, she said.
“We have also compared manned aircraft with a UAV with low-cost lidar and an RX1 camera. For most use cases you are better off with a high-quality camera rather than a ‘low cost’ lidar. Despite the lidar being more expensive than the camera, the final outputs (point cloud or 3D mesh) generated by photogrammetry have a lower noise level and a higher point density.”
As a bonus, there are more tools for photogrammetry. “The workflows with the many photogrammetry companies are very simple to use, whereas for lidar it is still not as well established and easily adoptable by everyone as it claims to be,” Nater said.
Wingtra’s UAVs perform vertical take off and landing (VTOL), but fly horizontally. New European regulations easing restrictions on flight beyond visual line of sight (BVLOS) make this increasingly common. (Photo: Wingtra)
Positional accuracy
Achieving high positional accuracy with a UAV is challenging, due to the platform’s weight and size limitations for GNSS receivers and antennas. For dedicated UAV missions, Riegl uses the Applanix AV14 and AV18 antennas. The latter can acquire corrections directly from the satellites on L5 without needing a base station, achieving an accuracy of about 5–10 cm.
“We mainly couple our systems with Applanix APX-15 UAV or APX-20 UAV INS/GNSS components,” Amon said. “There are almost no cables needed for an overall system set-up besides power and GPS.” To achieve accuracies of a couple of centimeters, Riegl recommends that users post-process the data. Nearly all of them do, using a single base station in addition to the L-band corrections.
PrecisionHawk uses Riegl lidar equipped with the Trimble Applanix APX20 IMU for direct georeferencing of collected points. “It gives us an absolute and relative positional accuracy of about 2 cm to 5 cm horizontally, with a little bit less vertical accuracy, from 8 cm to 10 cm,” Cannon said. “We couple it with our NovAtel base-station data for PPK corrections. So, everything we do is post-processed, which enables us to focus on safety and efficiency in the field, rather than, say, pulling in RTK corrections and constantly stopping due to jammed signals.”
Lidar USA uses GNSS receivers from “pretty much every manufacturer,” McCay said. “What system we choose depends on the client’s specs. The performance varies greatly. You can buy a $5,000 GNSS-IMU or a $180,000 GNSS-IMU.” Likewise, Lidar USA is not married to a specific platform. “Our system is universal and can be put on several different platforms, as long as they have the payload capacity and have enough clearance for the system underneath.”
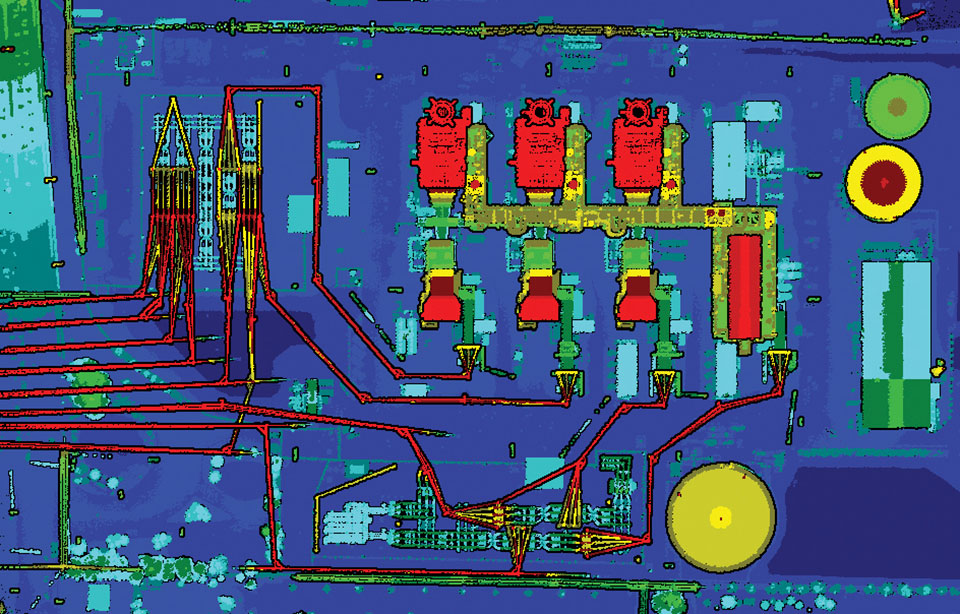
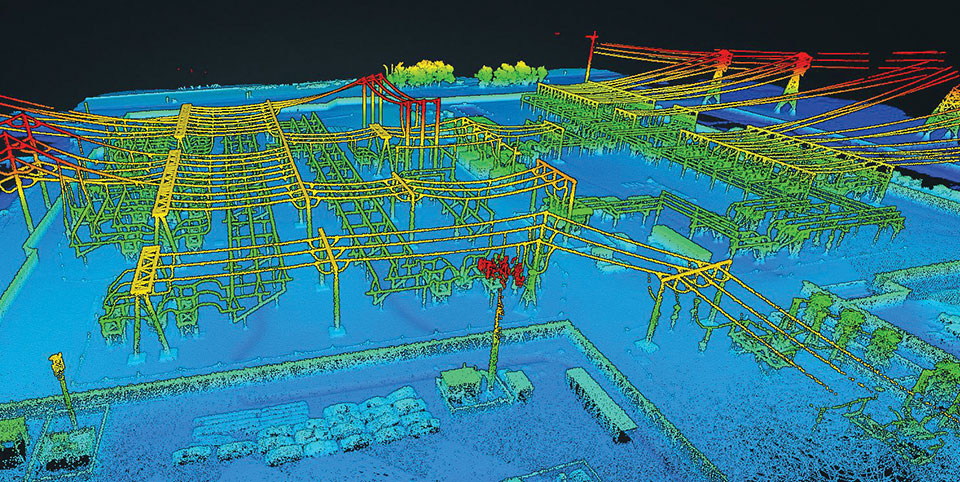
Lidar can reveal the intricate details of an infrastructure, such as this power plant. (Photo: PrecisionHawk)
Multisensory systems
The most common combination of sensors is lidar and RGB. Recently, however, demand for multisensory systems has increased Amon said, especially using hyperspectral integrations and multispectral cameras. “We are using well proven consumer-grade Sony cameras as well as thermal cameras such as the FLIR Tau 2.” The exact mix depends on the customer’s application.
While Riegl sells lidar sensors for customers to use in their own integrations, it also sells complete systems, especially lidar sensors coupled with Applanix INS/GNSS systems and complete turnkey solutions using the systems combined with a platform such as its RiCopter UAV platform.
“We also offer specialized integration kits for the most common UAV platforms, such as the DJI M600,” Amon said. The company also provides software libraries for self-integration, as well as its own data acquisition and postprocessing software.
PrecisionHawk couples its Riegl lidar scanners with Sony A6000 cameras for a dual RGB collection, enabling the company to generate colorized point clouds.
From Nat Geo to Bigfoot
“We have done all sorts of cool projects, from flying for National Geographic in Mexico to looking for Bigfoot in Oregon,” Cannon recalled.
A project for the largest utility provider in the South that has been ongoing for two years involves collecting hundreds of miles of distribution lines across an entire state, including a complete inventory of all the poles.
“These poles have been put up for 100 years. They get put and up and taken down every other day, due to storms and so forth, so who knows what is out there and how accurate it is? Some of the maps they have are from the 1980s.”
Besides accurately locating the poles, the project involves cataloging the assets on each one, such as AT&T equipment, as well as vegetation encroachment and sagging lines between poles. PrecisionHawk executes an average of 25 flights a day for the project, collecting more than one terabyte of lidar and RGB data each month. The data is analyzed using PrecisionAnalytics software.
Lidar USA recently scanned a remote open pit mine in Montana to assess elevation changes from gravel runoff. “There was no cellphone service, and the closest town was probably an hour away,” recalled McCay. “Even in that environment, it is amazing how well our system can perform. The most challenging aspect was that the mine was between two mountains and there were extremely high winds. At one point, the UAV went sideways. Fortunately, our pilot was very experienced, so he was able to correct for that.”
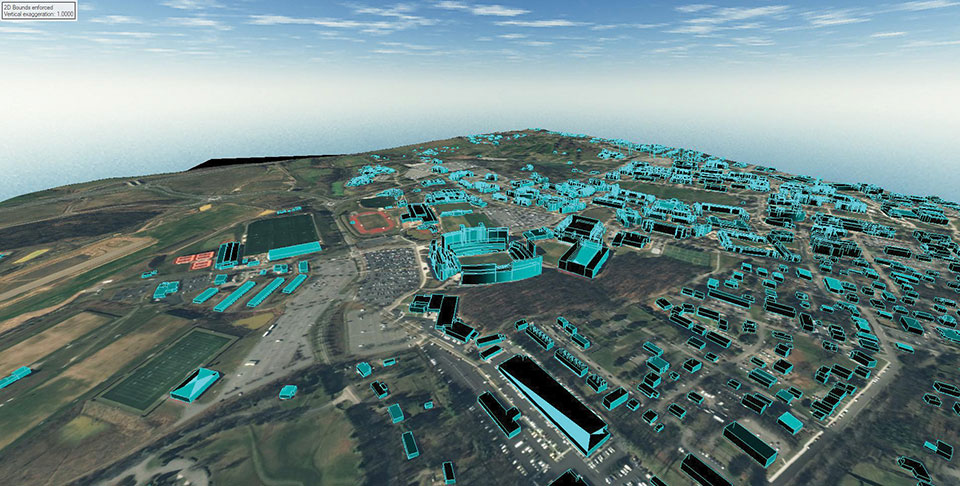
L3Harris provided a detailed digital map of Blacksburg, Virginia, to aid in the development of a Navigation Performance Forecast for UAVs, specifically for beyond-visual-line-of-sight flights.
L3Harris used a novel method of 3D map generation using a deep stack of high-resolution satellite imagery and artificial-intelligence technology without the time or expense of a site visit. This detailed mapping technology, known as multi-view photogrammetry, was used in a pilot study to determine the viability of using modern, automated, mapping technologies to build a scalable methodology that can be applied to very large-size mapping programs, potentially covering the urban areas of North America and Western Europe.
The company is using these 3D maps with its GNSS forecast technology to accurately predict GPS performance for UAS flight planning and operation. This prediction helps the unmanned aircraft service supplier and UAS operator ensure safe operations.
The L3Harris Geospatial Data Products team provided 2D and 3D products, including the vector map shown above.
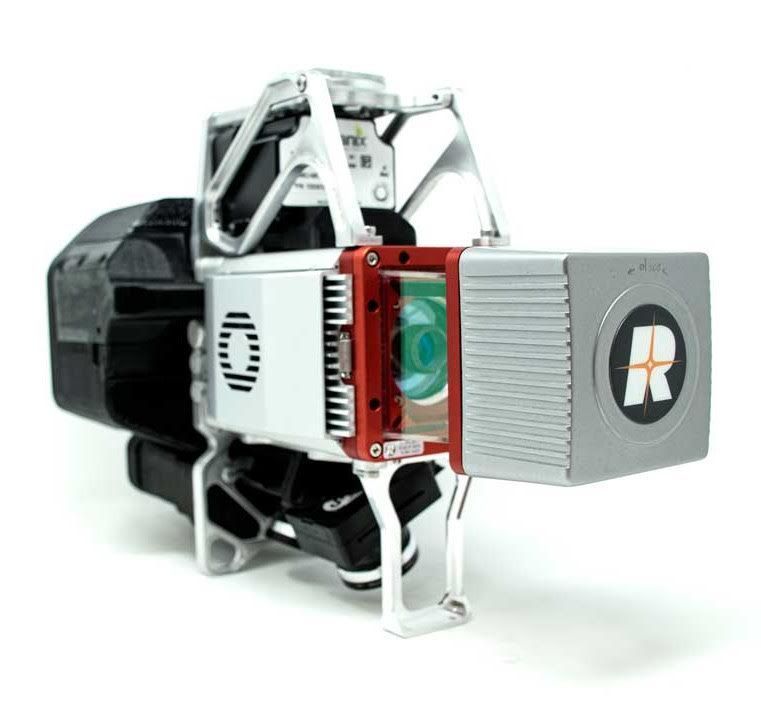
Lidar and photogrammetry payload maker Rock Robotic has finished development of its new Rock R2A payload. Featuring the Livox Avia lidar scanner mounted on an aluminum enclosure, the R2A is light enough to fly on the DJI Matrice 200 and 210 series (versions 1 and 2), Matrice 300 RTK, Matrice 600 Pro, Freefly Alta X and many custom platforms.
A major factor in Rock Robotic’s success has been its use of Inertial Labs’ inertial navigation systems in its payloads. The Rock R2A uses the INS-D-OEM, which features temperature-calibrated and precisely aligned tri-axis micro-electromechanical accelerometers and gyroscopes.
With 20 years in the position, navigation and timing industry, Inertial Labs has been able to develop hardware solutions integrating many different types of sensors to ensure accurate time synchronization among independent data packets, resulting in a guaranteed high-performing system-level solution.
These high-quality systems and components, paired with a robust onboard Kalman filter, result in trajectories with heading accuracies of 0.03 degrees and pitch-and-roll accuracy of 0.006 degrees. These values directly affect point-cloud accuracy, which for the Rock R2A means a system accuracy of 5 centimeters or less.
The advent of drone lidar payloads has had a profound impact on industrial inspections such as for powerlines, saving labor costs and improving safety. The multiple return method of scanning with the Livox Avia and excellent position and orientation accuracy from the INS-D-OEM ensure that the R2A provides a highly dense and accurate point cloud for powerline classification.
“The Inertial Labs team has a deep understanding of the whole navigation technology ecosystem,” said Rock Robotics CEO and Co-Founder Harrison Knoll (known on YouTube as Indiana Drones). “This has made their products offer world-class performance and maintain easy integration and interoperability with GNSS receivers and onboard computer systems.”
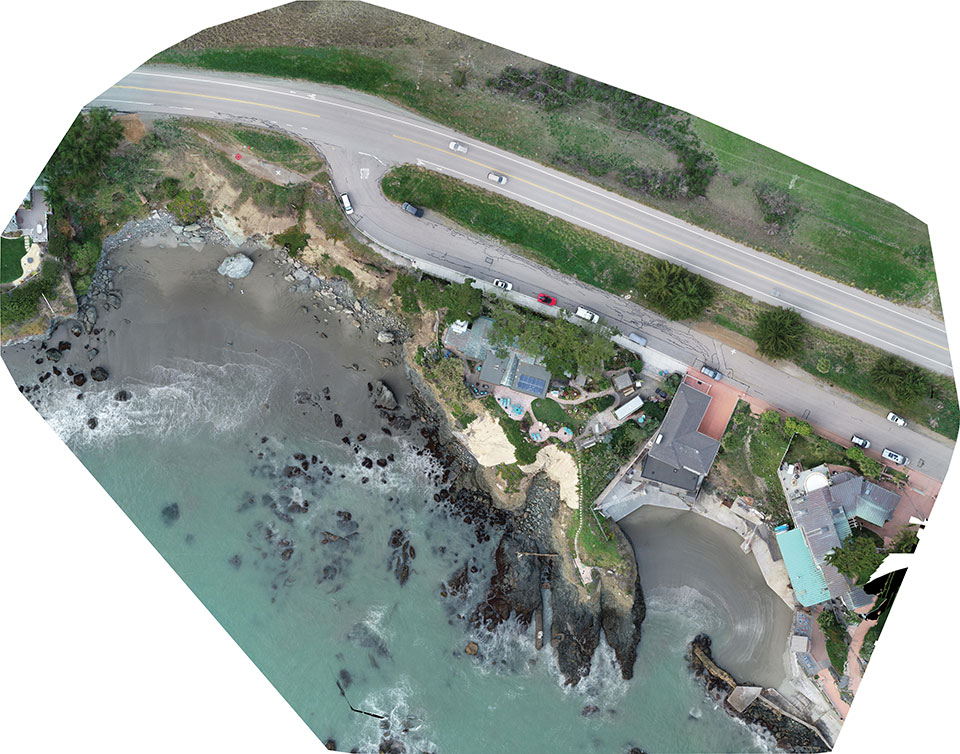
Cliff surveys are traditionally performed with fixed-wing aircraft that collect nadir photos. However, a photogrammetry company accurately triangulated oblique images and mapped them in 3D stereo, developing a new technique in the process.
The erosion survey — along Pacific Coast Highway 1 in Cayucos, California — required imaging the side of the cliff to produce a precise orthomosaic and topographic map of its structure and integrity. The project required a 0.5-inch orthomosaic, a 1.2-inch 3D topographic contour map and a vector-based digital terrain model accurate to 1.2 inches.
Surveyor Paul Reichardt and Robert Lafica, owner of Central Coast Aerial Mapping, placed ground control points around the property and beach, and then used a Trimble R8 GNSS receiver to measure their positions to within 0.04-foot accuracy. They also established four checkpoints for quality control in the photo triangulation process. The R8 and a Trimble 5600 total station were used to collect property corners and top-of-surface elevations to integrate into the 3D topographic map.
At an altitude of 131 feet, the UAS covered the site from both nadir and oblique camera angles in nine passes, collecting 158 photos at an average ground sample distance of 0.5 inches. To capture the cliff side, Lafica flew the UAS about 90 feet from its face and angled the camera at 40 degrees.
The photos and position data were loaded into Trimble’s Inpho UASMaster photogrammetric software to automatically triangulate the images. The software pinpointed 6,368 common features with multiple connections to match images to each other. After initial triangulation, precise coordinates were attached to each control point, a final triangulation was completed to create the maps, and a new technique for mapping cliff faces was born.
SPH Engineering has released a UgCS update, adding support for the DJI M300 commercial drone. UgCS supports all flight planning patterns of the DJI M300, such as photogrammetry, corridor mapping and facade inspections.
UgCS allows to manage the following route parameters: speed, altitude, heading, camera attitude, camera triggering modes (by time, and by distance), turn types (Stop & Turn or Adaptive Bank turn).
“It also supports video recording in full-motion video format,” said Alexei Yankelevich, head of software development at SPH Engineering. “The drone is smart and safe, equipped with various cameras and sensors.
UgCS support for DJI M300 cameras covers:
displaying videos from both FPV and main camera (H20/H20T) on the UgCS for DJI screen;
switching between main camera lenses: wide, zoom, thermal (for H20T);
changing general settings of the active lens;
manual camera triggering in all modes (wide/zoom/thermal)
video recording
‘We have tested DJI M300 in various scenarios and can confirm that it can be used in extreme weather scenarios,” Yankelevich said, “including low temperatures while battery capacities are significantly improved.”
The most awaited improvement is Waypoints 2.0 which allows users to create up to 65,535 waypoints and set multiple actions for one or more payloads. This improvement is crucial for UgCS as it allows the drone to fly long routes in terrain- following mode with UgCS.
SimActive Inc., a developer of photogrammetry software, has integrated its Correlator3D product into lidar systems for drones developed by Lidar USA.
Possible configurations include two side-by-side cameras that allow matching the footprint of the lidar sensor, a particularly useful setup for corridor mapping.
SimActive’s Correlator3D software is used for automatically registering the imagery with the lidar data. Once a perfect alignment has been achieved, the point clouds are colorized using the photos.
“The ability to directly use lidar as control for adjusting image positions really is a unique feature,” said Jeff Fagerman, CEO at Lidar USA. “Correlator3D allows our clients to quickly combine lidar with data from multi-camera systems and produce high-quality outputs.”
Correlator3D software is a patented end-to-end photogrammetry solution for the generation of high-quality geospatial data from satellite and aerial imagery, including drones. Correlator3D performs aerial triangulation and produces dense digital surface models, digital terrain models, point clouds, orthomosaics, 3D models and vectorized 3D features.
Powered by GPU technology and multi-core CPUs, Correlator3D’s processing speed supports rapid production of large datasets.
Lidar USA, also known as Fagerman Technologies, is a family owned business just outside of Huntsville, Alabama. Lidar USA specializes in laser scanning, photogrammetry, instrumentation and all things geomatics.
Everywhere we look, data is being collected, reviewed, analyzed and stored. It used to be that data was a static piece of information, like a piece of paper in a filing cabinet. Millions of pieces of data being created yet almost all of it never to be used again. The computer and electronic storage began a revolution of how we warehouse this information but that was only the beginning. Technology has turned data into a living, breathing beast few understand yet it controls most of our lives in various ways.
Mapping of the earth has not always been about establishing boundaries and parcels; many of the early maps and plats were created to depict the topography of our world. While there are some indications that Middle East maps depicted parcels, the first examples of topographic maps were created during the Roman Empire era of 300 A.D. It is common knowledge that the Romans utilized primitive yet cunning engineering for roads, buildings, and waterways but it was the initial topography that was mapped that allowed them to design those forward-thinking infrastructure components. Because of the lack of sophistication in the measuring methods and data collection, these topographic maps covered small areas and often crude because of the materials available. Considering what they were working with, it is still incredible what they were able to map, design and build.
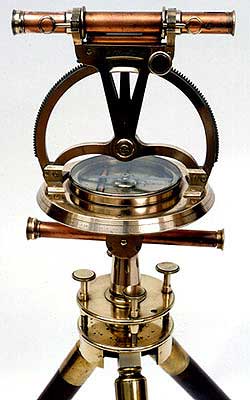
Measuring devices and methods of data collection expanded over the centuries like most occupations and professions. By the 16th and 17th century, mathematics has been introduced at a wider scale through many educational facilities. Another profession, geographers, also advanced with the evolution of measuring devices and mapping techniques. It was during this period that we began to see a crossover with surveyors with geographers to create topographic maps with greater accuracy and precision through triangulation.
In the 18th and 19th century, instruments became more sophisticated to assist in the determination of elevations and more accurate angle measurements. The concept of triangulation flourished during this period and significant mapping was made for most of the civilized world. The early 1800s saw the westward push of expansion in the United States and Thomas Jefferson, U.S. president and former surveyor, led the charge to map the existing states and divide the west into sectional land for sale to settlers.
Besides the establishment of the Public Land Survey System, surveyors also provided topographic information for map of all sizes for future development planning. The late 1800s brought a large amount of topographic mapping information to paper through efforts by the U.S. Geological Society to map the entire United States. This information has been called the first land database; although crude in overall nature compared to today’s standards, it contained an enormous amount of topographic information.
These surveys continued well into the early 20th century until a revolutionary invention coupled with a current technology merged: the use of a mounted camera taking aerial photographs from an airplane. Geographers and photogrammetrists were able to use surveying data to assist with scaling orthometric photographs to create aerial images of thousands of acres of land. These aerial photos became the base layer for determining topographic features and contouring, covering much more land than ever before. Additional innovations included advancements in stereo plotting and photogrammetric techniques to further create high sophisticated topographic maps for the era. This type of mapping was the gold standard for decades depicting existing condition and topographic features for most of the world until the early 1970s and the computerized data revolution.
Computers take over the world (literally)
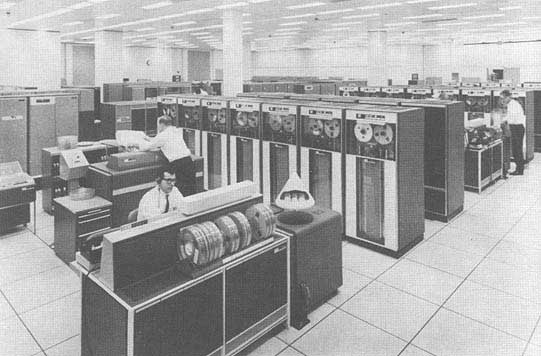
1960s mainframe computer (Photo: NASA)
While mainframe computers became more universally used in the 1960s, their use was contained to governmental agencies and large corporations. As the physical size of the computer reduced, the computing capacity increased, programming became easier to complete, and more applications were created to perform a variety of tasks. One of the biggest advancements for the era was electronic storage and analyzation of data through programming. Relational databases became a hot ticket for large datasets; geographic data was the perfect fit for this type of application. Modern mapping was on its way forward at warp speed.
Topographic mapping was not lost in this shuffle. The survey itself is based upon data points located on the face of the earth so each point is just another chunk of information within the database. Programming continued to advance and soon methods previous completed by manual methods over long periods of time were completed in a fraction of previous efforts without fail.
This effort was also joined with advancements in graphical technology to display this data on a computer video screen instead of lines of green text and numbers. Vector-based graphics, together with enormous point databases, helped create large topographical and geographical maps for many uses. During the same time the US put a man on the moon, mapping and platting of topographic information was also out of this world.
The turn of the century brings big changes
For the next decade, there were small advances in technology for topographic surveys and data points, but most were in presentation of data and increases in computing power. Pen plotters and smaller yet more powerful computers were becoming affordable to smaller companies, but it was still a large investment to get into the computerized data game for a surveyor. By the mid-1980s, electronic data collection with a total station was becoming the norm, but only meant collecting more points in a more efficient timeframe. The computing component did get faster but is still producing the same information of static data points.
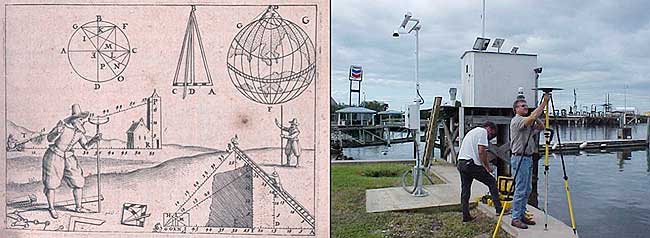
Ancient techniques and new technologies (Image: ngs.noaa.gov)
The mid-1980s also brought us a shiny new object: GPS technology. By the end of the 1990s, we were able to get out of our vehicle, start the receiver and collect geolocated points in minutes rather than hours. The big takeaway from this advancement is the geolocation component of the data point. Now everything can be related to one big dataset of topographical points. By creating a database with all our project data collected in the same georeferenced datums (horizontal & vertical), we can create digital models that replicate existing conditions.
We can also add another big advancement in data collection: remote sensing technology. From laser and lidar scanners, photogrammetry, SLAM technology and ground penetrating radar, the innovations to collect data at locations we can “see” through sensing are now a reality. Another significant improvement with this technology is the amount of data points remote sensing can collect, both in timing and spacing. We are now talking small scanning projects that consist of billions of points within the site point cloud. We are fortunate that our computing power and storage capabilities has increased exponentially along with the remote sensing. (Remember doing a “regen” on your CAD file and having time to get a cup of coffee?)
Lots of data — now what?
Data is powerful, especially when it is harnessed in a robust system that can analyze and model for future use. Yes, this condition also applies to the surveying world, even though you may not be thinking about it now. We can use this data to create a virtual world that mimics the one we live in; the difference is that we exist in ours yet model and manipulate the digital version in our computer system. The technology is now available, and we can make a replica of our current world; however, why would we want to do that? There are lots of reasons to use technology and data to make sophisticated topographic maps (because that is what they are) for recording the world around us.
One of the big differences now is that we have much more information about the data points we collect within our topographic maps. Sure, many surveyors will say that their data has not changed or evolved during their careers, but they would be wrong. Unless they are still manually writing it all down for hand plotting… (Hello! The 1960s called, and they want their field book back!) Every electronically collected point has attributes associated with the data.
These attributes, while they may be simple, contain important information about the datapoint it represents. Horizontal location? Check. Vertical elevation? Check. Assigned point number? Probably. Field code? Most likely. But it also has one other important component: time. We now know exactly when that point was collected. Why is that important?
Because, like a lot of instances, things change. Something collected today might not be there tomorrow. Time is just as important as the physical location and the type of point it represents.
Gather these points together, throw them in one big model and you have yourself a graphical database that can be analyzed, reviewed, and used for planning and design. It may be hard to visualize with just simple survey data using GNSS and/or a total station, but couple it with a scanner or photogrammetry, you have a powerful hunk of data for which to work.
Why is this workflow and modeling procedure important enough to dedicate an entire column about surveying and GNSS to? Because it used to be far in the future, but the need and availability to use it is now here in front of us. Surveying and GNSS are an important part of this effort to create three dimensional models. By using survey-grade data in conjunction with point clouds collected from remote sensing equipment, we can replicate the world around us in real time.
Yes, Virginia, there is a name for the modeling process…
Photo: iStock.com/alexsl
The name for the proposed modeling of this dataset is a digital twin. It represents a digital representation of a physical object or system. NASA famously used the concept for their space program to simulate situations and procedures of many different types of events. The concept has grown with the technology to graphically create almost anything through digitalization and computer modeling. Once the model is created, both actual and proposed data points can be included to represent the existing and future opportunities.
The idea of a digital twin is not new; technology, however, has pumped more life into its existence by leaps and bounds with computing power and data storage capability. I remember, early in my career, going into an architect’s office and seeing the scale model mockup of a new development or building. The streets in the model were perfect, there were no drainage issues, and it was a neat as a pin. Fast forward to the construction of the development and field changes were at every turn. A digital twin will allow for better planning, more thorough design and creating more cost-effective development. Many large cities have started compiling data and building their digital twin, including New York, Singapore, Boston, and Rotterdam. Engineering and planning for new and replacement facilities is very expensive yet analysts predict that having a digital twin to work will save a significant amount of money and time.
As a surveyor, what’s in it for me?
Software capability for the surveyor is already here. Companies, such as Hexagon, Trimble, Topcon and Esri to name a few, have been developing their software to accommodate this concept for many years. Still, lots of surveyors do not know about it. And we should. Many of us live in places where the infrastructure is well past its useful life period and should have been replaced long ago. By starting now with survey-grade data to be put into a real-time model, we can help our governmental agencies and their consultants to move towards a digital twin that will ultimately save money and possibly lives.
What this means for the surveyor is to further embrace technology and include remote sensing into your operation. If you have not started at least looking into UAVs and photogrammetry, you are already behind. Many aerial operations are making the next leap into mounting a LiDAR unit on their UAV to gain even more capability. Early adopters of laser scanners were probably second guessing their decision during the 2008 Depression but if they stayed with it, it will be a big payoff in the long run. The next leap will be into handheld scanning devices, including ones using SLAM (simultaneous localization and mapping) technology for locating interior and close-up improvements. These technologies will cost a significant amount of time and money to implement but municipalities, engineers and architects are going to be clamoring for the data any day now.
When it comes to surveying and mapping of existing facilities, the surveyor and technology makes a great team. Do not let point clouds, remote sensing, or terabytes of data scare you away from providing badly needed information to help assemble your local digital twin. In the long run, it will pay off for all who take on the challenge of building it.
GeoCue Group has released the True View 615 and True View 620 UAS lidar 3D imaging systems. The True View systems are compact, survey-grade 3D imaging sensors designed for small unmanned aerial systems.
True View 615 and 620 are equipped with Riegl’s miniVUX-2UAV laser scanner integrated with dual photogrammetric cameras. Position and orientation is provided by an Applanix APX-15 (True View 615) or extreme accuracy APX-20 (True View 620).
All True View 3D imaging systems are bundled with Applanix POSPac, True View EVO post-processing software and True View Reckon data management solution.
The Riegl laser scanner and dual photogrammetric cameras have been carefully configured to provide a fused lidar/imagery field of view of up to 120°. The system includes full post-processing software that generates a stunning ray-traced 3D colorized point cloud and geocoded images.
An upgrade path will be available to promote a True View 615 to a True View 620 by adding the Applanix APX-20 external inertial measurement unit.
The True View product line gives mappers and surveyors the ability to deliver high-quality analytic data with exact accuracies. These deliverables are generated using workflows and tools within GeoCue’s post-processing software, True View EVO. Examples of derived products include bare Earth models, profiles, cross sections, topographic contours, volumetric analysis and more.
“Our Quanergy-based True View 410 has rapidly become the standard for general purpose drone 3D Imaging, where moderate vegetation penetration and accuracies of 5 cm RMSE are adequate,” said GeoCue’s President, Lewis Graham. “The True View 615/620 provides a solution for situations where deeper vegetation penetration, wire extraction and extreme accuracy are required. These are great new additions to the True View product line.”
The True View 615/620 will be available for shipment late June.
U.S. CAD is working with Pointfuse to help shape the future of point cloud processing software. This collaboration began upon U.S. CAD completing Pointfuse’s authorized training program.
U.S. CAD is an architecture, engineering and construction technology consultant that has 20 years’ experience in combining BIM content creation and 3D modeling with application development and configuration services. U.S. CAD is a Pointfuse distributor and has been working with Pointfuse to align Pointfuse’s software with its existing product and service portfolio, learn the full capabilities and ROI of the software, and discover product development functionality.
Pointfuse software converts millions of individual measurements captured by laser scanning, photogrammetry and mobile mapping systems into useable 3D mesh models. Pointfuse is unique in automatically segmenting the mesh into discrete, selectable surfaces by identifying objects based on their geometry and assigning unique identifiers to them, the company said.
“We already knew the addition of Pointfuse point cloud processing software to our market offering would release the power of laser scanning, photogrammetry and mobile mapping systems for a range of digital construction, facilities management and virtual design workflows,” said Jeff Rachel, president at U.S. CAD. “However, working with Pointfuse to complete the training program we now truly understand how to help and support our customers as they integrate these technologies within their organizations.”
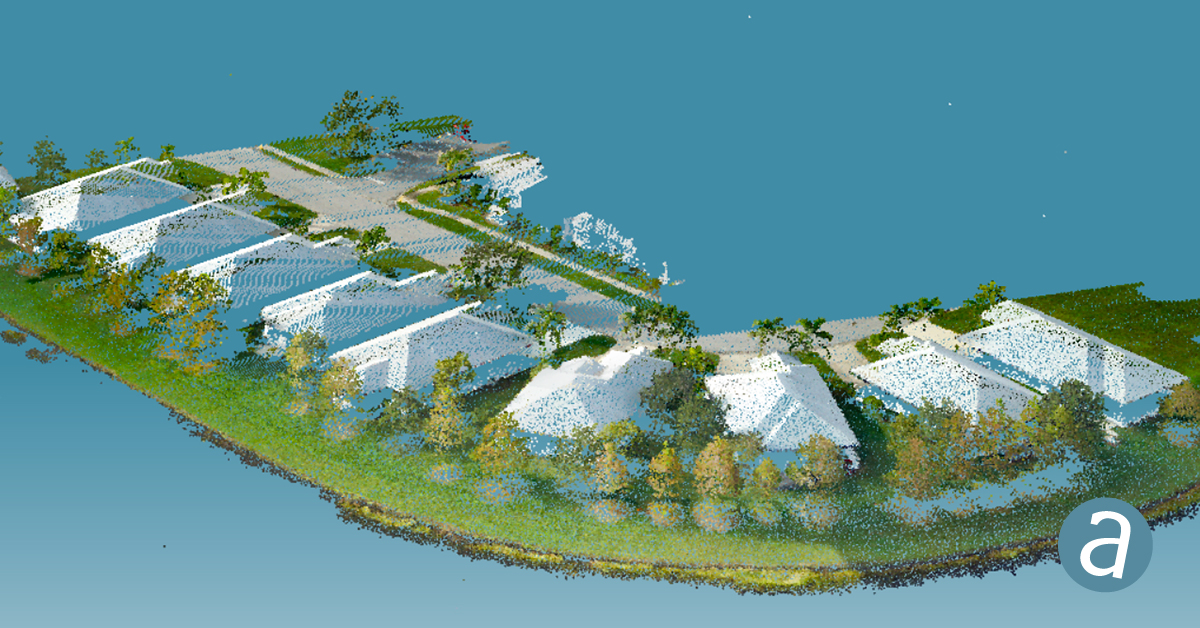
Dutch company NEO B.V. is using SimActive’s Correlator3D software to assess solar potential in multiple cities. (Image: SimActive)
SimActive’s Correlator3D software is being used by by Dutch company NEO B.V. to assess solar potential in multiple cities. Digital surface models (DSMs) are generated from WorldView and GeoEye satellite stereo images and serve to calculate solar panel capacity.
According to SimActive, DSMs covering hundreds of square kilometres are quickly generated by the software. Key metrics to estimate solar potential are then derived, including roof orientation, pitch and shaded areas.
“We have been impressed by the quality of SimActive’s DSMs, especially considering the limited spatial resolution of the imagery”, said Rob Beck, managing director at NEO B.V. “Another definite advantage of Correlator3D is the simplicity of the workflow, making it easy to use by our team.”
SimActive’s Correlator3D software is a patented, end-to-end photogrammetry solution for the generation of high-quality geospatial data from satellite and aerial imagery, including UAVs. Correlator3D performs aerial triangulation and produces dense digital surface models, digital terrain models, point clouds, orthomosaics, 3D models and vectorized 3D features.
Verified photomontages for UNESCO World Heritage sites achieves accuracy with Spectra Geospatial SP80
Verified photomontage is an important planning tool to envision how proposed surrounding development plans would affect UNESCO World Heritage sites. Verified photomontage demands the best accuracy for the best visualization to determine what a development may look like to a person standing at the photographic viewpoint.
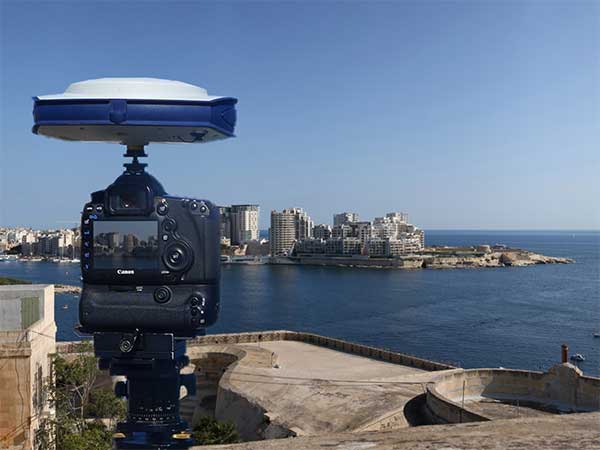
For MS Environmental (MSE), selected to provide verified photomontage for multiple UNESCO World Heritage sites, including in the UK Royal Botanical Gardens at Kew and the City of Bath, the Spectra Geospatial SP80 GNSS receiver enabled the highest quality visualization.
“The one-centimeter accuracy delivered by the SP80 is essential,” said Mike Spence, a verified photomontage specialist and founder of MSE. “The highest level of accuracy in the relationship between the actual camera location and the 3D model camera gives confidence in the visualization. In addition, The SP80 offers both simplicity and a robust design though it’s taken a few knocks over the years, it gives us the confidence we can use the equipment anywhere in the world and get the best results.”
At Kew Gardens, MSE was commissioned to produce accurate visualizations of views from within the UNESCO World Heritage Site. There was concern about development proposals for tall tower blocks in west London and how these might affect historic views from Kew Gardens.
The work culminated in a public inquiry, where evidence was presented that showed how views would change as a result of the proposed development. “Without the level of accuracy provided by the SP80 together with a transparent technical methodology it would have been unclear precisely how these historic views would change,” Mike Spence said.
At the UNESCO World Heritage City of Bath, the Bath and North East Somerset Council commissioned MSE to produce technical photography from strategic views around the World Heritage City to show how development proposals would affect strategic views across the city.