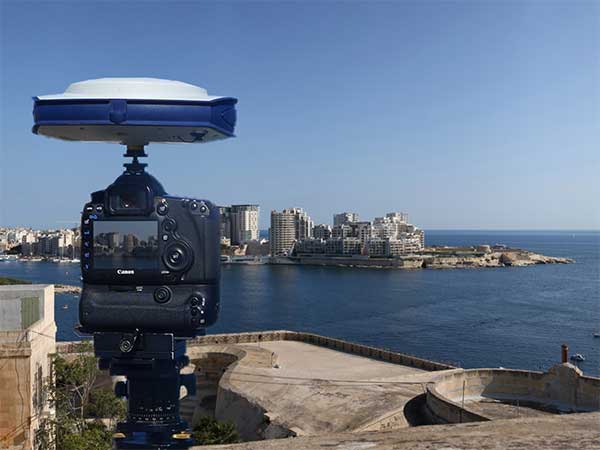
Verified photomontages for UNESCO World Heritage sites achieves accuracy with Spectra Geospatial SP80
Verified photomontage is an important planning tool to envision how proposed surrounding development plans would affect UNESCO World Heritage sites. Verified photomontage demands the best accuracy for the best visualization to determine what a development may look like to a person standing at the photographic viewpoint.
For MS Environmental (MSE), selected to provide verified photomontage for multiple UNESCO World Heritage sites, including in the UK Royal Botanical Gardens at Kew and the City of Bath, the Spectra Geospatial SP80 GNSS receiver enabled the highest quality visualization.
“The one-centimeter accuracy delivered by the SP80 is essential,” said Mike Spence, a verified photomontage specialist and founder of MSE. “The highest level of accuracy in the relationship between the actual camera location and the 3D model camera gives confidence in the visualization. In addition, The SP80 offers both simplicity and a robust design though it’s taken a few knocks over the years, it gives us the confidence we can use the equipment anywhere in the world and get the best results.”
At Kew Gardens, MSE was commissioned to produce accurate visualizations of views from within the UNESCO World Heritage Site. There was concern about development proposals for tall tower blocks in west London and how these might affect historic views from Kew Gardens.
The work culminated in a public inquiry, where evidence was presented that showed how views would change as a result of the proposed development. “Without the level of accuracy provided by the SP80 together with a transparent technical methodology it would have been unclear precisely how these historic views would change,” Mike Spence said.
At the UNESCO World Heritage City of Bath, the Bath and North East Somerset Council commissioned MSE to produce technical photography from strategic views around the World Heritage City to show how development proposals would affect strategic views across the city.
Septentrio’s post-processing kinematic (PPK) software has been upgraded with multi-GNSS and BaseFinder functionality. BaseFinder improves project efficiency by automatically finding the most suitable reference station data needed for centimeter-level accuracy.
Both GeoTagZ and PP-SDK now feature BaseFinder, which speeds up survey workflow by automatically finding reference data needed for augmenting GNSS logs with sub-centimeter accuracy. BaseFinder accesses an online database of reference networks and extracts the most suitable corrections available. BaseFinder is available via an app or via an API and can be incorporated into any existing software.
PPK is often used for ground surveys with aerial drones, allowing high precision georeferencing without the need for a real-time base station link or ground control points (GCPs).
“Surveying without a base station will allow users to reduce costs and set-up time. With this PPK upgrade we are improving the end-user experience as well as developer experience,” said Danilo Sabbatini, product manager at Septentrio.
The new release of this GNSS post-processing software also includes two additional GNSS constellations: European Galileo and Chinese BeiDou. Having access to all the signals from all GNSS constellations improves reference network compatibility. It also improves positioning availability in difficult environments. This is particularly important when working in areas of low satellite visibility such as near tall structures or under foliage.
When doing photogrammetry with a drone, GNSS data is often recorded and then post-processed together with base station data to achieve sub-centimeter positioning accuracy. This base station data can be obtained either with proprietary base stations or by using base station data from a public reference network (see diagram below). Septentrio receivers are designed to bring accurate and reliable positioning to photogrammetry, aerial inspection, marine survey as well as mobile mapping.
GPS Post-Processing SDK architecture, bringing high-accuracy positioning without the need for a real-time correction stream. (Diagram: Septentrio)
Pointfuse has released the latest version of its advanced point cloud processing software that converts the millions of individual measurements captured by laser scanning and photogrammetry.
Featuring new streamlined classification to ensure maximum efficiency and multicore processing for unlimited conversion power, the new version of Pointfuse is set to transform workflows within digital construction, facilities management and virtual design applications.
“Pointfuse is designed to make the use of point cloud data more accessible by removing many of the traditional barriers to use,” said Mark Senior, regional sales director at Pointfuse. “Obstacles such as processing time and computer power, incompatibility within existing workflows and outputs files that are large and complex; these have all been obliterated with the latest Pointfuse release.”
Pointfuse now includes a new streamlined workflow which makes object classification easy, using templates and shortcuts to ensure maximum efficiency. This ability to classify objects within Pointfuse has had a huge impact on how as-built data is utilized within digital design workflows; being able to quickly compare specific as-built objects with the design enables more accurate clash detection, reducing the number of false clashes being flagged.
IFC (Industry Foundation Classes — an open format data model that is intended to describe architectural, building and construction industry data) templates can also be created and edited for specific applications. With applications including architectural, MEP and HVAC, selected objects can be classified and mapped to ensure compatibility with onward workflows.
Pointfuse also includes a new conversion engine which uses multicore processing to manage and enable unlimited point cloud conversion to provide real scalability. In addition, Pointfuse’s mesh models are intelligently optimized, reducing the working data size by a factor of up to 100, making them easy to share with online 3D collaboration platforms, such as BIM 360, 3D Repo, Revitzo and Trimble Connect.
“Using Pointfuse we can create intelligent 3D mesh models in a fraction of the time,” commented Ben Callan, BIM coordinator in global construction services company ISG’s UK Fit Out business. “This accelerated modelling and reduced risk of error contributes to a direct reduction in costs when compared against traditional methods of modelling and point cloud data analysis. The easy to use, easy to consume outputs are also paving the way for new applications of the data including existing versus design clash avoidance and checks of temporary works against required construction activities.”
SimActive Inc., a developer of photogrammetry software, announced that Correlator3D is being used for mapping projects in Brittany, France, by Altimedias.
An eBee X equipped with senseFly S.O.D.A. 3D camera is flown along the shoreline to produce high-resolution true orthomosaics and 3D models.
“The quality of outputs from Correlator3D is exceptional and the mosaic renders the vivid colours of the Pink Granite Coast,” said Didier Wasselin, COO at Altimedias, which specializes in drone data collection and processing. “Such results are very useful for heritage conservation and decision making by local authorities.”
“The combination of SimActive software and senseFly eBee Plus X is an ideal combination, due to the accurate RTK/PPK and optimized aerial triangulation,” said Francois Gervaix, technical advisor at SimActive. “The S.O.D.A. oblique imagery leads to outstanding 3D textured models.”
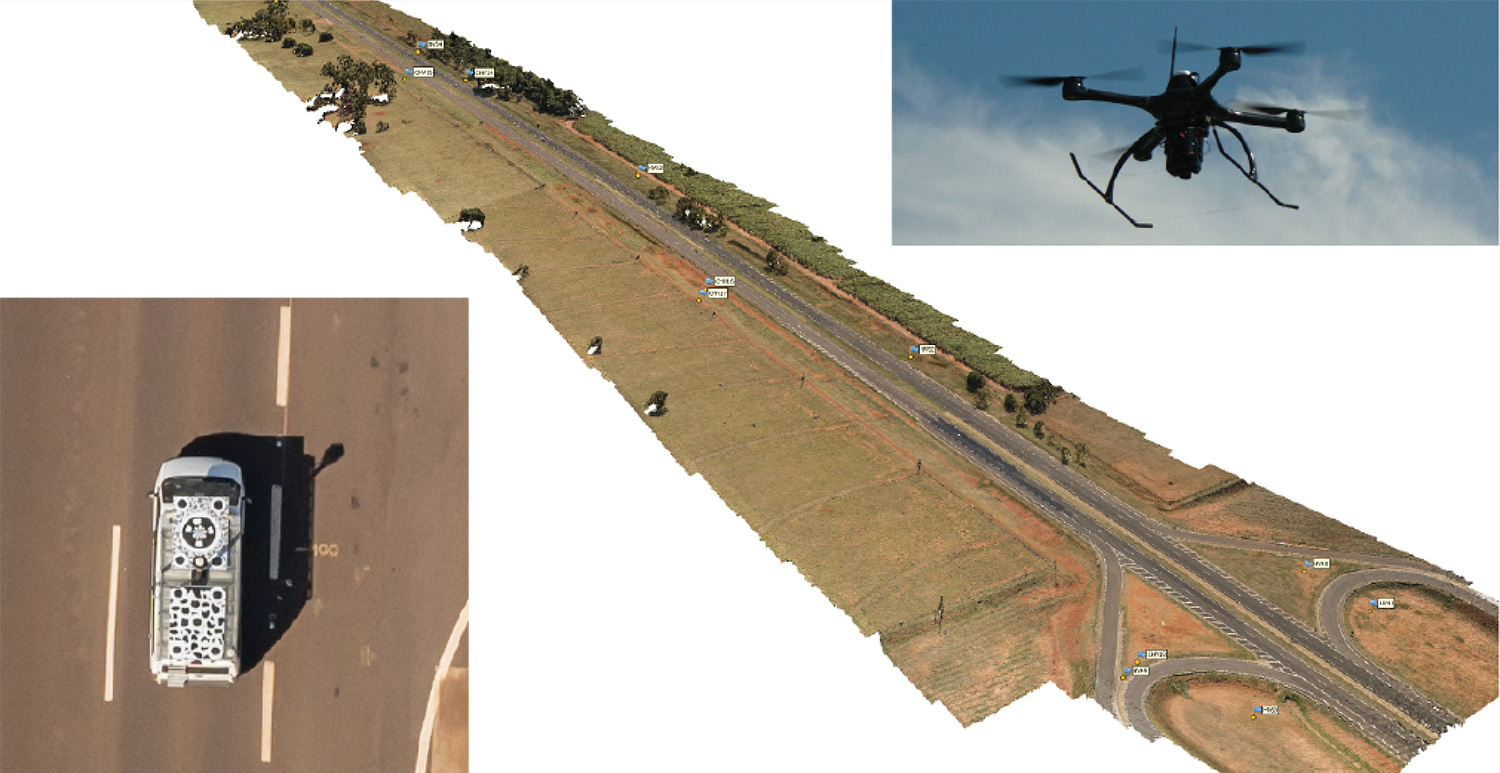
Kinematic Ground Control point for UAV photogrammetry: A dynamic duo of UAV and mobile van combine to deliver the accuracy of conventional methods with only 2+2 ground control points at the ends of the corridor.
By Ismael Colomina, Pere Molina and Roberto da Silva Ruy
A Brazilian and a Spanish company, ENGEMAP and GeoNumerics respectively, have finalized the accuracy evaluation of a mission conducted with the latter’s mapKITE technology on a Brazilian motorway in 2018.
The goal of the evaluation was to confirm the advantages of the mapKITE method and its kinematic ground control point (KGCP) concept over conventional corridor mapping methods.
The mapKITE and the conventional method delivered comparable accuracy results — the difference being that the latter requires a dense set of surveyed ground control points (GCPs) while mapKITE does the job with almost no GCPs.
For this purpose, a 4-kilometer segment of the Rodovia Raposo Tavares in São Paulo state was populated with a set of 37 evenly distributed, signalized, accurately surveyed ground points. The set was divided into two subsets of 23 GCPs and 14 ground check points (GChPs) — the ground truth — respectively. The 4-km road segment was also covered by 189 drone images and their corresponding 189 KGCPs. The image set was processed as a conventional aerial corridor block:
with the integrated sensor orientation (ISO) method in a 23 GCP + 14 GChP configuration, and
as a mapKITE aerial corridor block in a 4 GCP + 14 GChP + 189 KGCP configuration.
The two processes produced similar accuracy results: mean (μ), empirical standard deviation (σ) and root mean square (rms) error of the photogrammetric determination of the horizontal (EN) and vertical (h) coordinates of the GChPs against the ground truth. (All units are stated in millimeters.)
The mapKITE configuration uses only four GCPs (two at each end of the road segment) in contrast to the 23 GCPs of the conventional method. Nominal flying height of the drone was 120 meters above ground, producing an average ground sampling distance (GSD) of 2.3 cm. Forward image overlap was 80% resulting in a base-to-height ratio of 0.157.
MapKITE is a GeoNumerics patented method for 3-dimensional corridor mapping that combines the two latest geodata acquisition methods, terrestrial mobile mapping and aerial drone-based mapping. MapKITE is a tandem terrestrial-aerial mapping method and system composed of:
a terrestrial mobile mapping system (land vehicle and sensors) carrying
an optical metric target on its roof;
a drone aerial mapping system; and
a real-time virtual tether and post-mission software.
In a mapKITE mission, the drone follows the land vehicle, and thus the vehicle target becomes a kinematic ground control point visible and measurable on each image. It is a high-accuracy, high-resolution Earth observation method. MapKITE combines the advantages of mobile land-based encompassing images and 3D point clouds. MapKITE combines the advantages of mobile land-based (manned) and aerial drone (unmanned) mapping systems.
GeoNumerics (Castelldefels, Spain) is a research and development company specializing in geomatics and accurate navigation.
ENGEMAP (Assis, Sao Paolo, Brazil) is one of the largest and oldest mapping companies in Brazil. It has more than 100 employees, three aircraft, two mapping land vehicles, a number of rotary- and fixed-wing drones and a record of accomplished mapping and cadastral projects. ENGEMAP is officially authorized by the Brazilian Ministry of Defence (MD) and the Brazilian Department of Airspace Control (DECEA) to conduct mapKITE commercial flights in Brazil.
MANUFACTURERS
The mapKite campaign was conducted with a Sensormap SMM terrestrial mobile mapping system and a UAVision UX Spyro drone equipped with a NovAtel OEM2 GNSS dual-frequency receiver with a Maxtena antenna and a Sony α7R camera with a 25-mm camera constant lens. The INS/GNSS system in the Terrestrial Vehicle was a Span-CPT (Novatel) including dual-frequency antenna and DMI wheel sensor.
ISMAEL COLOMINA is chief executive and chief scientist at GeoNumerics. He has a Ph.D. in mathematics from the University of Barcelona.
PERE MOLINA is advanced applications program manager at GeoNumerics. He holds a master’s degree in mathematics from the University of Barcelona and a master’s in photogrammetry and remote sensing from the Institute of Geomatics, Catalonia.
ROBERTO DA SILVA RUY is technical manager at ENGEMAP. He has a Ph.D. from the Universidade Estadual Paulista.
Photogrammetry software Correlator3D was used for a large-scale project by First Base Solutions, announced software developer SimActive Inc.
The software allowed the processing of 50,000 large-format images at 200 megapixels, collected at a 10-centimeter resolution, on a single standard PC, the company added.
The size on disk for each image was 765 MB, for a total of 40 terabytes of raw data. Aerial triangulation was performed and digital surface models (DSMs), digital terrain models (DTMs) and orthomosaics were created, leading to more than 100 terabytes of output.
“We are impressed by the software speed and capabilities on large datasets,” said Brian Leggat, project supervisor of First Base Solutions. “Another advantage is SimActive’s support to quickly help us during our projects.”
First Base has been a user of the software for more than 10 years.
Datumate’s DatuSurvey 5.5 software offers 2D vectorized measurements and 3D point clouds models. (Screenshot: Datumate)
Datumate, a photogrammetry solution and 3D mapping software developer, has released its updated DatuSurvey 5.5 software, which offers 2D vectorized measurements and 3D point cloud models.
According to the company, with the updated software, users can now process thousands of images locally in an accelerated mode while maintaining survey-grade accuracy and professional engineering results. Organizations can also deploy Datumate’s solutions on single or multiple computers and take advantage of the accelerated and user-friendly processing of the project field data.
In addition, DatuSurvey 5.5 can process large amounts of drone imaging data locally and quickly. The software can also achieve survey-grade accuracy and geo-reference the model quickly and easily, the company added. Finally, it can plan and execute consecutive drone missions on unmapped and frequently changing areas.
According to Datumate, its team improved the geo-referencing workflow of the software when using ground control points. Users can now quickly and easily mark ground control points using zoomed-in image projections.
The company also added the ability to import coordinates to DatuFly Professional in addition to on-site or on-map mission planning. This will enable an efficient and accurate drone mission execution on specific and designated areas without depending on satellite and map source views, Datumate said.
According to SimActive, users can now process raw data, produce point clouds and digital surface models, and perform volumetric calculations with the Correlator3D workflow. (Photo: SimActive)
SimActive has updated its Correlator3D end-to-end photogrammetry software to include tools for users to generate precise statistics on mining activities, with improved volumetric calculation.
The integrated tools allow users to generate precise statistics on mining activities.
The Correlator3D software performs aerial triangulation and produces dense digital surface models, digital terrain models, point clouds, orthomosaics and vectorized 3D features.
Applications like mineral extraction monitoring can be done seamlessly within the software.
Users can process raw drone data, produce point clouds and DSMs, and perform volumetric calculations in the same Correlator3D workflow.
“Our clients often require project delivery within 24 hours”, said Jennifer Waugh, principal at Alietum Ltd., a Canadian company using unmanned technology to support construction, consulting and government clients. “SimActive enables us to meet this demanding turnaround time.”
Based in Montreal, Quebec City, Canada, SimActive has been a developer of photogrammetry software since 2003.
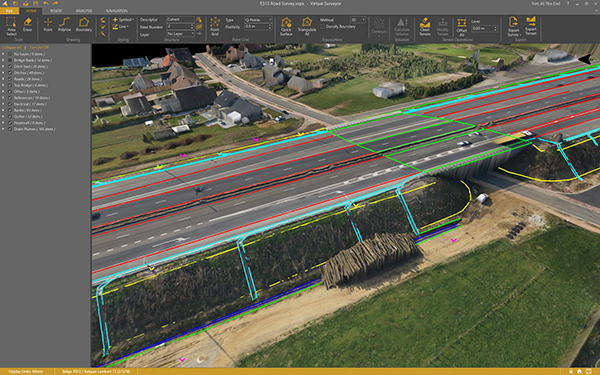
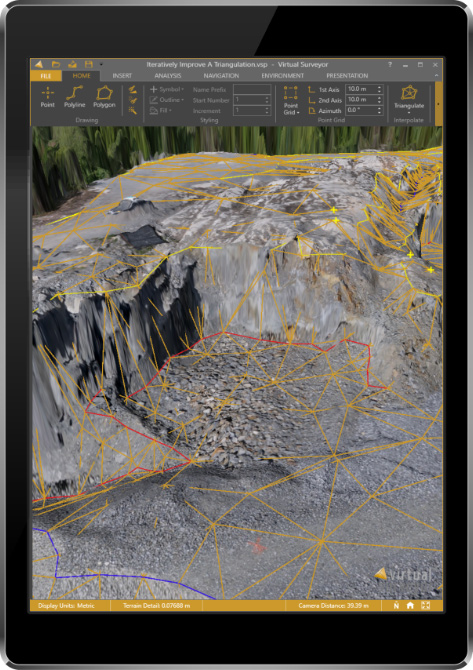
The newly released version 6 of the Virtual Surveyor drone surveying software offers a faster, more efficient workflow and better overall user experience in a more stable platform, according to the software maker.
Version 6 offers new capabilities, an improved licensing system and an extended free application.
“Surveyors who have used the Virtual Surveyor package in the past will be amazed at how easily they can manipulate data and how quickly the software renders results of even the most complex topographies,” said Tom Op ‘t Eyndt, managing director of Virtual Surveyor nv in Belgium.
Virtual Surveyor leverages the expertise and interpretation skill of a land surveyor and combines it with the computing power of the computer, the company said.The software generates an interactive onscreen environment through orthophotos and digital surface models, generated from the unmanned aerial vehicle (UAV), where the surveyor selects survey points and breaklines to define the topography.
Image: Virtual Surveyor
Virtual Surveyor enables land surveyors to complement traditional fieldwork with UAV imagery to generate highly accurate topographic products up to five times faster than otherwise possible. It bridges the gap between UAV photogrammetric processing software and engineering computer-aided design (CAD) packages.
“The focus of Version 6 development has been to streamline the workflow — from the importing of drone data to exporting topo information into CAD — to make the surveyor more productive,” Op ‘t Eyndt said.
Key enhancements in Virtual Surveyor 6 include the following:
Easier editing – The new editing functions allows users to quickly select, delete or move individual point and lines placed by the computer during the automated creation of elevation points. The associated Undo/Redo function allows reversing all edit operations.
Better CAD integration – The addition of Descriptor functionality means that point descriptions remain with the point during export to CAD, working the same way as the land surveyor collects data in the field.
3D geometry retained – All points, lines and other data imported into the software, either from a UAV or field surveyed data, retain elevation values and integrate seamlessly into the merged scene. This allows a surveyor, for example, to collect point values from a ditch bottom that may be obscured by vegetation in the drone image and have the bottom points accurately represented in the topography.
Improved drawing tools – Users can now densify (drape) lines and boundaries to map current surface conditions. Individual vertices are now adjustable in all directions and exact X, Y and Z locations can be specified as well. Sub-surface modeling is now possible with these new improvements. Created features can then be exported to CAD for profile or alignment creation.
Extended free plan – Referred to as the Valley version, the free Virtual Surveyor suite has added functionality, including the ability to import photogrammetric data.
Improved licensing – We better honor our principle: “The license follows the user”. With an improved licensing system based on a Virtual Surveyor Identity (email) the user will be able to work where he or she wants.
“The enhanced user experience will continue to appeal to professional land surveyors, who are our core client base,” said Op ‘t Eyndt. “And the seamless integration with CAD and advanced drawing tools will make Virtual Surveyor more attractive to design engineers.”
Virtual Surveyor is available in a free 14-day trial.
Drones and robots complement traditional platforms, delivering insights in unique use cases.
Guest column by Mike Fuller
Geographic surveys have changed in the last 150 years. What started with early film cameras strapped to hot air balloons, kites and homing pigeons has advanced — both in terms of sensors and the platforms on which they’re deployed. These innovations — which include drones and robots — are changing the way we can collect data, enabling us to gather greater detail and providing richer insights about the world around us.
These nascent platforms are set to explode in popularity. The global market for remote sensing platforms will more than double in the next four years. It’s projected to reach more than $21 billion by 2022, driven in large part by use of drones, according to an October 2017 report from MarketsandMarkets.
Despite the anticipated growth in drone and robot usage, they will not replace traditional remote sensing platforms such as airplanes, satellites and vehicles. The new technologies bring with them some limitations with regard to the number, size and weight of sensors they can carry, capture rates, area covered and and line-of-site restrictions.
As a result, drones and robots will offer new capabilities that complement the traditional platforms and provide greater geographic detail, as well as the ability to be quickly deployed and constantly monitor areas where humans cannot routinely go.
How far we’ve come
To understand how far geographic information system (GIS) mapping and remote sensing technology has come, it’s important to consider how it started. Inventors in the 1800s relied on early film cameras and somewhat unreliable, imprecise airborne platforms — such as hot air balloons, pigeons and kites — to conduct land surveys and do surveillance.
The introduction of a new kind of “bird” — the airplane — opened up new opportunities in the 1900s, supporting the use of more accurate aerial photography for reconnaissance and mapping.
Satellite technology launched remote sensing into space in the 1970s, supporting the collection of detailed multispectral data that led to improved understanding of minerals, soils, urban growth, agriculture and other geographic features.
Even though the technology has become more sophisticated, GIS professionals still leverage data from many of these historical platforms:
Manned aircraft – planes and helicopters
Satellites – high-resolution satellites and cubesats
Terrestrial – survey vehicles and handheld devices
But — much like the impact of airplanes and satellites — we’re on the precipice of another significant milestone for remote sensing. Marked by use of burgeoning drone and robotic technology, this new technology will complement traditional platforms and deliver more insights than ever before possible.
Rise of drones and robots
Drones and robots are the newest remote sensing platforms catching the eye of the GIS community. Not only are they cool and cutting-edge, they open up a new class of use cases that were previously not possible with traditional aerial survey methods. They offer new opportunities to monitor remote areas, and their form factors and cost enables a higher frequency of data collection compared to aerial survey.
Because of their unique features, users are envisioning how these platforms can be implemented for remote sensing in many fields, such as energy, oil and gas, aviation, forestry, transportation, emergency management, and natural resource preservation and restoration.
When the frequency of data from these platforms is coupled with analytics and cloud infrastructure, it is possible to acquire, analyze and act in ways that were not possible before.
Keep in mind, though, that each technology comes with trade-offs. Users should assess their goals, and weigh these factors, to determine if drones or robots will deliver the results they wish to achieve. Let’s take a closer look:
Drones
Drones are capable of delivering ultra-high-resolution data, with ground sample distances (GSD) of 1 cm and accuracy of under 5 cm. However, accuracy is highly variable; it can vary based on the drone model, terrain and software used to process the collected data.
The form factor of many drones also limits the ability to do multi-sensor flights. A drone typically can cover no more than a few square miles per day with a visible or multispectral camera, compared to manned aircraft that span hundred of thousands of acres a day carrying hyperspectral, lidar and orthophotography devices simultaneously.
Because they can be deployed quickly, and on a daily basis, drones offer a cost-effective, practical approach for covering small areas compared to other aerial survey methods. But drone usage currently faces a significant impediment.
Current regulations require operators to maintain sight of the devices during all flights. These line-of-site restrictions limit the distance a drone can go on each flight, and require operators to change locations multiple times for a single survey. As a result, frequent revisits can be labor intensive.
Battery life also plays a role in the usability of drones. Most commercial drones can fly for only about 45 minutes, despite continued improvements in battery technology. Combined with the line-of-site restrictions, battery life impacts the amount of territory drones can cover. Most can handle only a few square or linear miles during each flight, making helicopters or airplanes better suited for projects that span hundred of miles or more.
Despite some of the drawbacks, drones are proving ideal in many use cases — from damage assessment and power restoration after hurricanes to data collection for hydraulic modeling, stream restoration design and aquatic habitat assessment.
For example, drones equipped with bathymetric and terrestrial laser scanning sensors are ideal for supporting riverine mapping applications. In these cases, drones offer an effective alternative when the waterway cannot be accessed, or it is too dangerous to use ground- or water-based survey methods for collecting channel geometry.
Robots
Robotic platforms are flexible, enabling users to attach a variety of sensors, including thermal cameras, lidar and sniffers for natural gas or other hazardous material. They are rarely hampered by payload restrictions, like drones.
And, with programming, robots can return to their chargers when their batteries dip below a certain threshold.
Like drones, there are many potential applications for terrestrial remote sensing robots. One use is for precision agriculture to test soil, water and plant health.
Many utilities are expressing serious interest, too, for robots. These robots can include onboard spectral, thermal and lidar sensors, precision navigation and hazard cameras to perform fine-scale spatial mapping and can acquire a wide array of data from electrical substations.
In this scenario, the robotic platform could detect physical and spectral changes, identify objects, monitor corrosion, detect liquid and gas leaks, and conduct thermal monitoring. Using this model, utilities could track substation environments remotely, saving time associated with physical inspections and enabling earlier detection of potential problems.
Systemwide approach required
Traditional remote sensing platforms — airplanes, satellites and vehicles — will continue to play an important role in GIS mapping. Drones and robots give us new tools that will have a dramatic impact on the amount of detailed geographic information collected.
For these new platforms to be used effectively as complements to traditional platforms, the industry must adopt a systems approach that takes into consideration a number of factors:
The end application
The sensors and acquisition protocol that will collect data at the precision required by the end application
The actionable analytics that need to be extracted from the data
How the data and insights integrate with the business processes used for decision making.
By taking this approach, those who work in a variety of fields can gather the insights they need to do their jobs more effectively and efficiently, while leveraging the unique strengths offered by these emerging platforms.
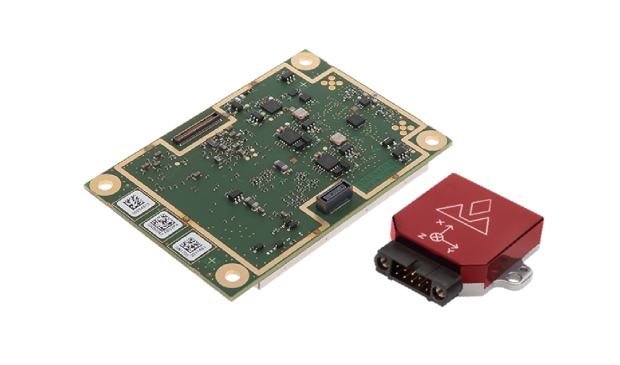
The AsteRx-i combines Septentrio’s latest compact, multi-frequency multi-constellation GNSS engine with an external industrial-grade MEMS-based inertial measurement unit (IMU). It can deliver accurate and reliable GNSS/IMU integrated positioning to the centimeter level as well as full 3D attitude at high update rates and low latency.
Key benefits for users:
IMU-enhanced GNSS positioning with full attitude: heading pitch and roll
AIM+ interference monitoring and mitigation system
High-update rate, low-latency positioning and attitude
Designed around demanding requirements for size, weight and power consumption, the AsteRx-i is suitable for optical inspection and photogrammetry.
Accompanied by a UAS-tailored carrier board, the AsteRx-i integrates seamlessly into light UAVs. The versatility of design and range of connection interfaces extend the AsteRx-i applicability to automation and robotics and as well as logistics.
The AsteRx-i includes Septentrio’s GNSS+ suite of positioning algorithms to convert difficult environments into good positioning: LOCK+ technology to maintain tracking during heavy vibration, APME+ to combat multipath and IONO+ technology to ensure continued position accuracy during periods of elevated ionospheric activity.
It also features AIM+ interference mitigation and monitoring system which can suppress the widest variety of interferers, from simple continuous narrowband signals to the most complex wideband and pulsed jammers.
“Complementing our GNSS portfolio with an INS offering is a natural evolution of our product range. At Septentrio, we design our GNSS solutions with a focus on reliability and availability. Smart integration of inertial sensors builds on these strengths to make affordable high-precision positioning and orientation solutions possible for ever more demanding applications,” said Francesca Clemente, product manager at Septentrio.
By Simon Batzdorfer, Markus Bobbe, Martin Becker and Ulf Bestmann, Technische Universitaet Braunschweig
All images courtesy of the authors.
Autonomous vehicles equipped with different environmental sensors, such as optical or thermal camera or a lidar, performed a team survey controlled by a central ground station. The ground station serves as a user interface to define missions and tasks and also to visualize exploration task results online. 2D stitched orthophoto or lidar point clouds are transmitted for display and processing into 3D photogrammetry. Georeferencing data is gathered by an integrated GNSS/IMU positioning system.
In disaster scenarios such as fires, floods or search-and-rescue tasks, good situational awareness is indispensable for responders coping with a complex and often chaotic environment. In most cases, a prior known map data are outdated, and an efficient situational proceeding such as path planning or creation of a search pattern cannot be performed. This information can often only be gathered by manned exploration using ground or airborne systems, with limits on availability.
The research project Automated Navigation and Communication for Exploration (ANKommEn) seeks to create an automated unmanned system to close this gap by providing up-to-date scenario information while increasing the safety of human resources, using unmanned aerial (UAV) and ground-based (UGV) vehicles.
To provide up-to-date information of the desired destination area, all vehicles are equipped with identical positioning and communication hardware complemented by diverse sensors (RGB camera, infrared [IR] camera, lidar) for visual exploration. The visual sensor information is transmitted to a central ground station for visualization and/or analysis. To increase the advantages of the system, the unmanned systems should have a high grade of automation to reduce the workload of the operator so that only basic inputs have to be done by the operator. For example, just by marking a destination area and choosing a predefined task, the mission will be planned automatically, and after the corresponding waypoint-list has been transmitted to the vehicles, the mission will start.
Automated procedures of a UAV in particular require valid position information related to accuracy, availability and continuity. In exploration areas where the UAV operates in low altitude or using a UGV, the reception of the GNSS signal can be degraded by the topology (buildings and such). Using more than one GNSS can increase the availability of position information. Vehicle control, georeferencing environmental sensor data and exploration results all require high-frequency absolute position and attitude and heading information. This data is gathered by fusing GNSS and inertial measurment unit (IMU) data.
OVERALL SYSTEM DESIGN
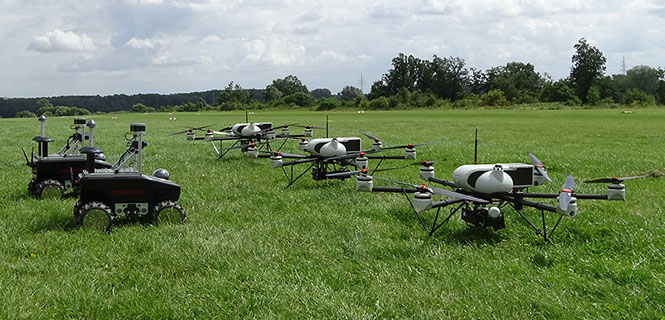
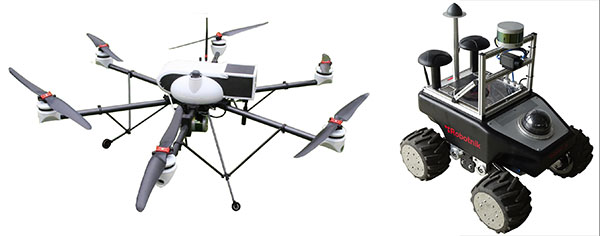
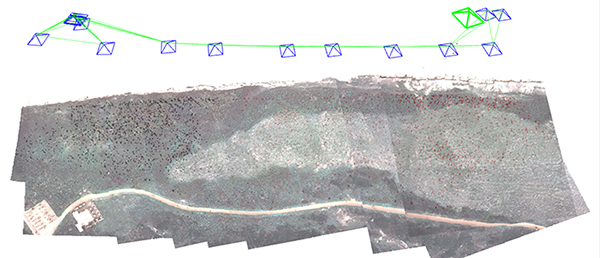
The overall system consists of three UAVs, two UGVs (Opening photo) and a central ground control station. The latter serves as a central human-machine interface to monitor and manage cooperative operation of the UAVs/UGVs by an operator. Based on a priori known map data, exploration areas and tasks are defined and assigned to the UAVs/UGVs and will be updated with actual information of the visual sensors while performing a mission.
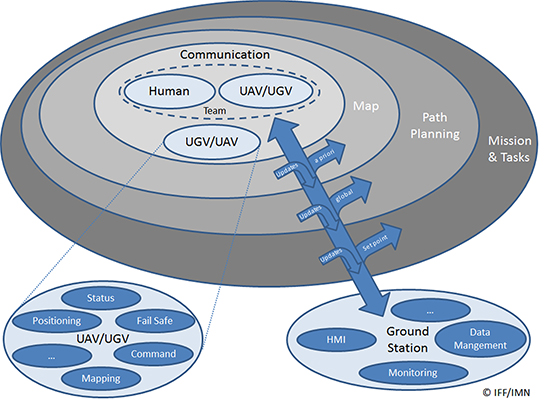
Figure 1 shows the interaction and information exchange between the different vehicles and sensors.
Figure 1. Diagram of interaction and information exchange.
All UAVs/UGVs are equipped with a navigation and communication unit (NAV/COM) and an environmental sensor payload (ENV) unit, including an RGB camera, thermal camera or a lidar respectively.
UAV/UGV and Sensor Hardware. The UAVs carry a payload of 2.7 kg (NAV/COM unit, mounted in the upper compartment, and ENV unit mounted under the UAV) and a flight time of up to 30 minutes (Figure 2, left). The payload sensors are carried and stabilized by a two-axis-gimbal. The environmental sensor payload unit is based on three different types of sensors, which are interchangeable between the different UAVs: RGB camera, lidar and IR camera.
For ground-based exploration, two four-wheel-drive UGVs carry a pan-tilt-zoom (PTZ) camera at the top of front chassis (Figure 2, right), and are equipped with a lidar and a thermal camera, or a stereo RGB camera, respectively.
Figure 2. UAV carrying a lidar (left) and UGV carrying lidar and IR camera (right).
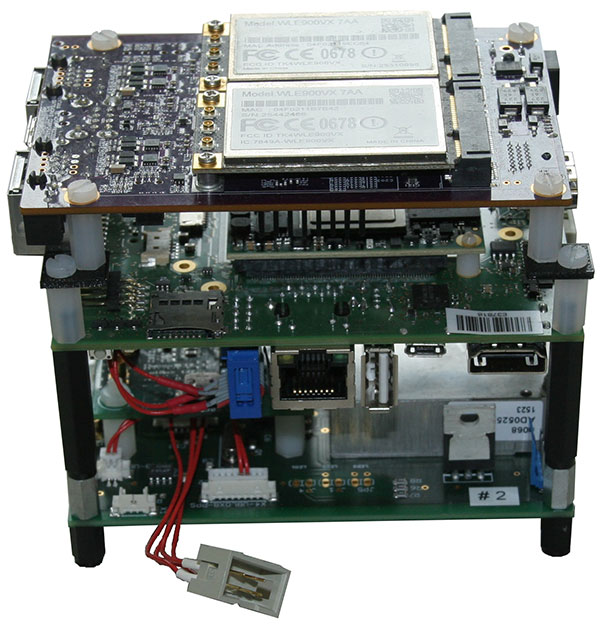
The navigation and communication unit mounted as a stack includes a network processor board for communication and data exchange between the UAV/UGV and the central ground and control station. An embedded processing board provides position calculation and GNSS-NTP-based time server. Data for the position calculation is provided by a custom-designed break-out-board (Figure 3).
Figure 3. Navigation and communication unit.
Data traced by these sensors cannot be sent directly to the ground station because of the huge data amount and the limited bandwidth of the communication link. Therefore, data from the sensors are preprocessed or compressed on a small form-factor personal computer and then transmitted to the ground station.
Ground Station. The ground station is the central device for command, control and visualization of the total system. It provides several options to display the data from the sensors and vehicles and a combination of them, and also provides automated path planning and calculation of the 3D reconstruction (photogrammetry) and online 2D stitched orthophoto.
Software Frameworks. The basic software for determining the vehicle’s state in 3D position, velocity, attitude and heading is established within a modular navigation software framework, with the option to process data of different sensors in real time as well as post-processing for data evaluation and development purposes. Several algorithms for sensor data fusion are implemented. The algorithm for IMU/GNSS fusion is based on an extended Kalman filter and also provides an IMU data-based state vector, stabilized by GNSS information, for the visual sensors. This state vector is published by using the robot operating system (ROS), a framework for inter-process communication based on a TCP or UDP publisher/subscriber concept. The visual sensors and embedded PCs subscribe to different ROS messages, for example, the state-vector-message or information of other sensors.
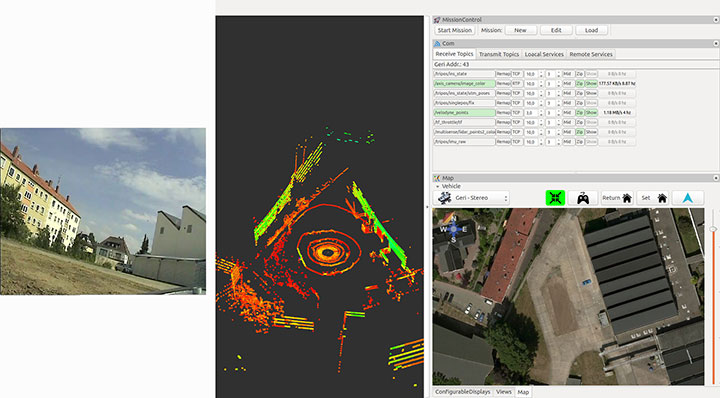
Figure 4 shows examples of the actual camera view from the UGV, and point cloulds and map generated by the UAV. The software layout can be customized by the user.
Figure 4. From left to right: the actual view by the PTZ camera onboard the UGV, the point cloud gathered by the UAV’s lidar, and the mission parameters and map of an aerial view.
POSITIONING OF UAV AND UGV
Automated operation of UGVs and UAVs requires valid position as well as attitude and heading information. In the case of using only one GNSS, signal quality and availability can be degraded by the environment (buildings) and can result in less precise or even a lack of position information.
GNSS Multi-Constellation. To overcome the risk of poor availability of GNSS-based position information, parallel usage of different GNSS can raise the number of received satellite signals: GPS, GLONASS, the evolving Galileo and BeiDou. When using a multi-constellation approach for positioning, one has to take care of several differing aspects between the GNSS. Each system uses a different geodetic reference frame and time basis. Measurements gathered from another GNSS system must be transformed into the reference frame of the desired system. The geometric distribution of the satellites is improved by using more than one GNSS constellation, indicated by a lower dilution-of-precision value.
The navigation software framework is designed for real-time computation and also for post-processing. In post-processing, the recorded sensor data is streamed to the software framework with the option of changing several parameters and settings for calculation. One option is to exclude satellites at low elevation from position calculation by changing the cut-off elevation for these satellites. This parameter will be changed to simulate environmental conditions that block receiving GNSS signals, like buildings within urban scenarios, to compare the availability of received GNSS signals for single- and multi-constellation-based position calculation.
Recorded data of a real-world test serves as the database for the post-processing with different cut-off elevation parameters. At the beginning of the field test, there was a short initialization period to boot the OS and to start basic processes for positioning. After that, a predefined mission was flown and the GNSS measurements have been saved for the described post-processing.
Post-processing has been performed with different cut-off elevation parameters of 5° up to 35°. In the case of 35°, the number of GPS satellites is reduced to the minimum for position calculation of four, in contrast to 5–7 available satellites for a multi-constellation based solution.
GNSS/IMU Fusion. Using the GNSS multi-constellation approach can increase availability of position information. For attitude and heading determination, an IMU is nevertheless indispensable. Additionally, the frequency of the pure GNSS-based positioning information is usually between 1 Hz to 5 Hz within the described hardware setup. Meaningful georeferencing of the environmental sensors requires much higher frequency position and attitude information.
The IMU provides high-frequency 3D measurements of accelerations and angular rates. Using common strapdown algorithm processing, high-frequency position, velocity, attitude and heading information is provided in real time. Due to the short time stability of pure inertial navigation, the GNSS positioning results are used for aiding purposes within the Kalman filter’s update step. To overcome the absence of GNSS aiding information even when using multi-constellations, there are mainly two options. First, a short coasting period is possible after the data fusion has reached a steady state.
Second, due to the highly modularly design of the navigation software framework, it is possible to use position or attitude increments from environmental sensor data processing for aiding the IMU.
The vehicle’s state vector is then distributed with high frequency within the system for georeferencing measurements of the environmental sensors, especially the RGB camera and the lidar for photogrammetry and simultaneous location and mapping (SLAM) applications.
PHOTOGRAMMETRY AND SLAM
In major fire scenarios, maps can be out of date. Therefore, techniques have been developed to gather a 2D overview based on several single RGB pictures taken and processed on board a UAV and transmitted to the ground station via data links. Additional processing of a 3D reconstruction of the scenario is an integrated feature within the ground station. Both approaches were implemented to get an automated rapid aerial mapping solution.
In the case of the 2D overview, SLAM algorithms, often used in robotic research, are adapted for this specific use case. These algorithms provide good results for a rapid aerial mapping solution to get an overview of the scenario, because the map is updated incrementally with every new image, but they are less precise, which can be compensated for by using the photogrammetric 3D reconstruction. The live mapping (SLAM) approach is based on the ORB-SLAM algorithm, and the photogrammetry-based approach uses commercially available photogrammetry software.
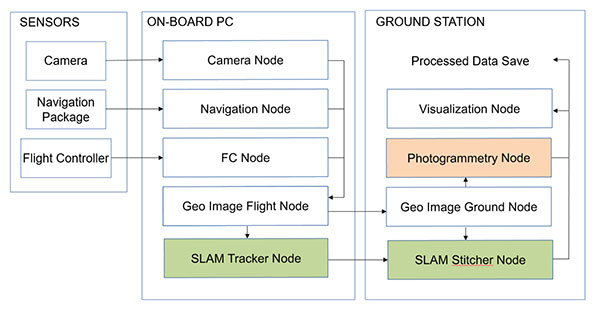
The systems, on the UAV for 2D and for 3D on the ground station, use the ROS framework for processing the visual sensor data and the described techniques for positioning, georeferencing and attitude determination. For data exchange between these frameworks, several software interfaces have been implemented. Figure 5 displays a flowchart of the implemented workflow.
The sensor/input data is received by corresponding nodes on the aerial vehicle. After adding the camera pose information to the image in the geo-image flight node, the image is sent to the geo-image ground node on the ground station. The SLAM process is separated into two parts. The SLAM tracker node calculates the transformation between images, and the SLAM stitcher node applies the transformations. The transformed images are displayed by the visualization node. The photogrammetry node receives the georeferenced images, stores the data, and initiates the photogrammetric processing once the survey is finished. The results can also be displayed by the visualization node and exported in a desired format.
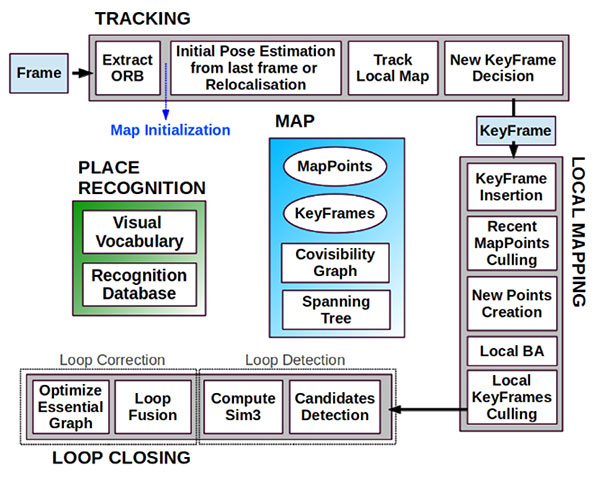
Visual SLAM. Computer vision-based algorithms have developed rapidly over the last few years. One method estimates a pose by using monocular image processing, known as parallel tracking and mapping (PTAM). This integrates a bundle adjustment and separates the tracking and the mapping procedure into different threads, leading to a real-time capable framework. These basic PTAM principles have been integrated into a robust loop-closing and another method of relocalization, known as Oriented FAST and Rotated BRIEF (ORB SLAM), shown in Figure 6. Here, tracking, local mapping and loop closing are separated into different threads (gray boxes), with the main map and place recognition in the middle.
Figure 6. ORB SLAM system overview [Mur-Artal, 2015].The tracking thread predicts the current pose from the last known position and movement by using a constant velocity model and performs a guided search of map points. If these points are found near the estimated position, the velocity model is valid and the tracking procedure continues. Otherwise, the tracking is lost and a relocalization in the global map starts by using a subset of features, which are increased after detection of corresponding features in other keyframes to optimize the camera pose and, finally, the tracking procedure continues. The last step of this procedure is to decide whether the current frame contains enough information to be inserted as a new keyframe for further calculations.
To mark a frame as a new keyframe, the frame must fulfill all of the following conditions:
More than minimum number of frames has passed.
Local mapping is on idle or condition 1 fulfilled.
A minimum number of 50 points is observed.
A maximum of 90% of the features is already observed by the other frames.
When a new keyframe is passed to the local mapping procedure and inserted as a node into a co-visibility graph structure, new correspondences are searched in the connected keyframes to triangulate new points. Based on the information accumulated during the tracking, a point culling keeps only high-quality points in the map as well as a culling of redundant keyframes.
Then a loop closing is performed. This is one of the main improvements compared to PTAM. If a loop is detected, the drift accumulated in the loop is computed, and both sides of the loop are aligned and visible points are fused. In a final step, a pose graph optimization is done to achieve global consistency.
This information of the 3D camera pose is used to generate a 2D orthophoto in real time while the vehicle is flying. To create a 2D orthophoto, a common reference frame is approximated, which is orthogonal to all camera measurements. The projection is performed by using a projection model based on a pinhole camera.
After the compensation and distortion, the whole image can be stitched to the current global map.
Photogrammetry. This approach uses off-the-shelf photogrammetric processing software. The processing is triggered automatically when the survey is completed and all images are transferred to the ground station via data link. For georeferencing of the images, the camera location and the inner camera geometry were written to the EXIF file of each image by the geo-image ground node (Figure 5). To ensure an acceptable compromise between orthophoto quality and the required processing time, an analysis regarding the impact of the most relevant processing parameters has been performed.
Figure 5. ROS node layout with SLAM (green) and photogrammetry workflow (red).
The photogrammetry process consists of four steps:
camera alignment (optimizing the homographic equation)
mesh creation by generated tie points
orthophoto creation (dense cloud or digital elevation model)
export.
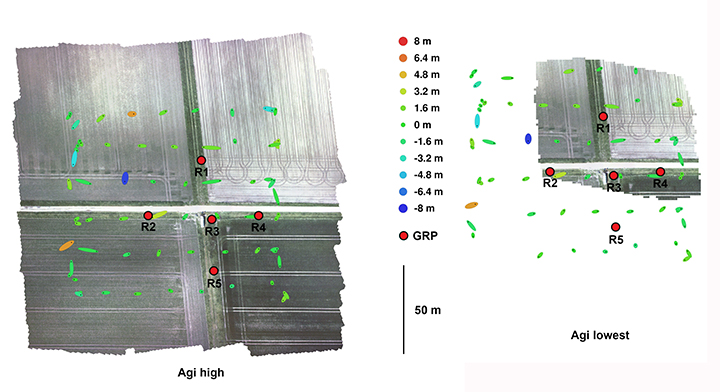
Analyses and Evaluation. To evaluate the correct workflow of both approaches of 2D live-stitching and the 3D photogrammetry, a real-world flight test above agricultural cropland has been performed. The results of both approaches are shown in Figure 7 and Figure 8. Generally, agricultural cropland and its mean textured surface pose a challenge for mapping processes because of the limited number of trackable features.
Figure 7. Orthophotos created with the profiles high and lowest (including ground reference points).Figure 8. Orthophotos created with 2D live stitching approach of cropland.
Four predefined profiles were used to cover the requirement of compromise between processing duration and quality of the generated orthophoto. Each profile level generates a corresponding level of alignment accuracy and mesh face count: lowest, low, medium and high.
To estimate the accuracy of the created maps by the different profiles, five ground reference points (GRPs) were distributed over the mission area. The location of the GRPs was determined using a RTK-GNSS system leading to a horizontal RMSE below 2 cm. To enable robust processing for this scenario, the overlap and the sidelap was chosen to be 70%. A ground-sampling distance (GSD) of 2 cm was needed to identify the GRPs. This resulted in a mission consisting of six times 100-meter (m) lines with a distance of 25 m in an altitude of 60 m over ground. During the flight time of 4.5 minutes, 271 images were taken.
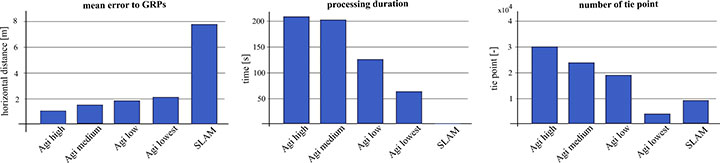
To compare the profiles, they were triggered one after another with the same set of images. The created results are shown in Figure 7. All profiles resulted in consistent solutions and were successfully georeferenced. The map based on the lowest profile could not recreate the complete area (Figure 7, right). The remaining profiles led to similar results without notable differences to visual inspection. The processing time varied between 1.2 and 3.6 minutes. A comparison of this and other criteria is given in Figure 9.
Figure 9. Evaluation and comparison of defined software profiles and visual SLAM.
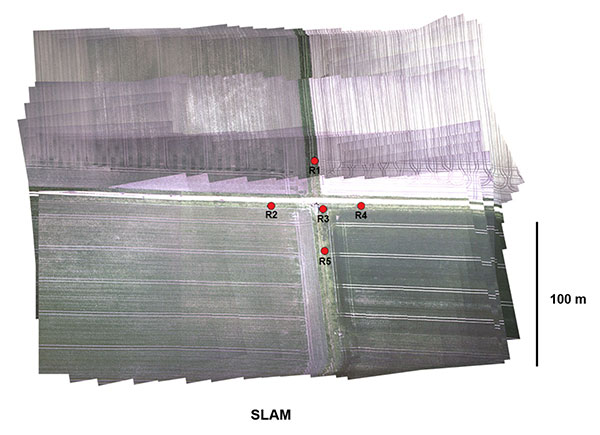
The created final image of the SLAM pipeline is shown in Figure 8. The image was updated with every new image and was therefore finished before the UAV landed. The mean location error measured using the reference points was about 8 m, significantly larger than the errors observed in the photogrammetry results. In Figure 9 the results are contrasted to the results of the photogrammetry approach.
While the mean error in the low profile is half as high as in the lowest profile, the calculated errors using the medium and high profiles are not enhanced significantly. The number of tie points created by the lowest profile is an order a magnitude lower compared to the other three profiles.
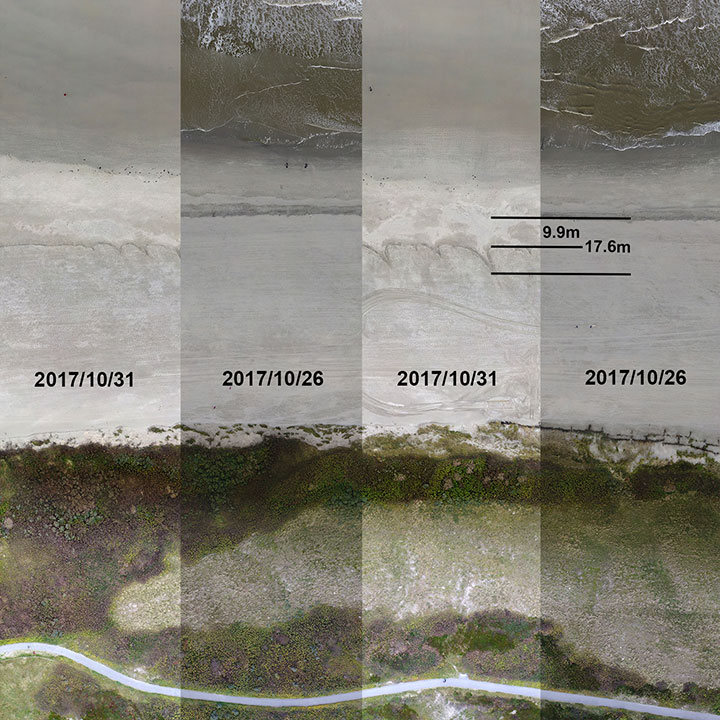
We conducted flight tests on Langeoog island in the North Sea, to gather information on efforts to protect the island’s coastline from water erosion. For this reason, sand was selectively washed up to the coastline by dredgers at the beginning of October 2017. Between Oct. 26 and 31, due to severe weather with a storm flood, a huge erosion of the washed up sand occurred, and the result is shown in Figure 10. The level of erosion was determined by comparison of the orthophoto of the same area. The dislocation averaged out to 9.9 m with some peaks up to 17.6 m.
Figure 10. Evaluation of erosion.
The 3D photogrammetry provides a more detailed image compared to the image of the 2D-live-stitching approach (Figure 11), but both approaches can provide the desired information of the area.
Figure 11. Result of the SLAM approach with camera poses and tracked features.
Both implemented approaches were successfully integrated to get the desired fully automated rapid aerial mapping solution. This also includes the basic tasks of the automated mission planning, camera control, image transport to ground station, automated processing and the visualization of the results.
CONCLUSION
The benefits of multi-constellation GNSS positioning have been demonstrated with a focus on UAVs and UGVs operating in catastrophic scenarios, especially where GNSS signal reception might be blocked. This position information is also used for georeferencing of images and visual reconstruction of the area. The overall system has demonstrated the capability of an automated orthophoto generation. Both implemented mapping methods — a 2D live stitching and a 3D photogrammetry — provided results that fulfill the requirements to get an instantaneous 2D overview and a contemporary 3D reconstruction of the area.
ACKNOWLEDGMENTS
This work was done within the joint research project ANKommEn, funded by the German Federal Ministry of Economic Affairs and Energy, administered by the Space Administration of the DLR (funding code: 50NA1518). Project partners are the Institute of Flight Guidance (IFF), the Institute of Mobile Machines and Commercial Vehicles (IMN) — both part of Technische Universität Braunschweig — and AirRobot GmbH & Co. KG, a German manufacturer of multirotor UAVs. The professional fire brigade of Braunschweig and the Lower Saxony Water Management, Coastal Defense and Nature Conservation Agency also participate as associated project partners.
SIMON BATZDORFER holds a Dipl.-Ing. in mechanical engineering and is a research engineer at the Technische Universitaet Braunschweig, Institute of Flight Guidance (IFF).
MARKUS BOBBE holds a M.Sc. in aerospace engineering and is a research engineer at the Braunschweig IFF.
MARTIN BECKER holds a Dipl.-Ing. in aerospace engineering and is a research engineer at the Braunschweig IFF.
ULF BESTMANN received his Dr.-Ing. in mechanical engineering from TU Braunschweig. He is head of the navigation department of the IFF. He co-founded the company messWERK GmbH, a service provider in flight testing and certification.