A new surveying and mapping textbook is now available on the OPEN Textbook network.
Written in English, the book provides an academic introduction to the field of surveying and mapping. It is based on handouts and readers written for the third-year course “Surveying and Mapping” in the civil engineering bachelor’s program at Delft University of Technology in The Netherlands.
The textbook covers a wide range of measurement techniques, from land surveying using GPS/GNSS and remote sensing to the associated data processing, the underlying coordinate reference systems, and the analysis and visualization of the acquired geospatial information.
Although a few parts of the book are specific to The Netherlands, for the most part the material is applicable globally.
Surveying and Mapping
Authors: Christian Tiberius, Hans van der Marel, René Reudink and Freek van Leijen / Delft University of Technology / The Netherlands
Hexagon AB, a global leader in digital-reality solutions, has announced the following organizational changes to meet the fast-growing demand for real-time digital worlds.
Juergen Dold, employed with Hexagon since 1995 and most recently serving in a strategic leadership role across Hexagon’s Geosystems, Geospatial and Safety & Infrastructure divisions, will assume the role of executive vice president to lead key enterprise-wide initiatives.
Dold will oversee Hexagon’s focus on the content and platforms necessary to power and operate Smart Digital Reality applications and experiences that empower growth within Hexagon’s existing markets and offer rapid expansion into new market segments.
“Bringing together data sets of all types and formats where you can build, store and share digitalized objects and environments is our sweet spot.”
“Driving company strategy and growth in the metaverse ecosystem — the new digital reality that is emerging in both the professional and consumer markets — is key to Hexagon’s future,” said Hexagon President and CEO Ola Rollén. “Bringing together data sets of all types and formats where you can build, store and share digitalized objects and environments is our sweet spot.”
Dold’s focus will include advancing and expanding the market penetration of Hexagon’s HxDR ecosystem, which includes the HxDR digital reality platform and related business models. The platform allows the convergence and visualization of almost any geospatial or reality-capture data or file format for improved collaboration and decision making.
Artificial-intelligence-driven photogrammetry and point-cloud meshing of terrestrial and aerial data enables a geo “supermesh,” essentially creating the visual foundation for any smart digital reality. Such realities can be put to industry use, analyzing and interpreting infinite data inputs from the real or digital world to solve business problems.
The data can also be leveraged in the metaverse, described by many as the “quasi successor state” of the internet that focuses on social interaction.
Image: Thinkhubstudio/iStock/Getty Images Plus
“The metaverse isn’t a single place, but many digital-reality spaces and experiences that companies like Hexagon are working to make more accessible and immersive,” Rollén said. “Through virtual, mixed or augmented reality functionalities, we can provide a higher sense of presence and engagement.
“Additionally, by providing a connected space built from crowdsourced or professionally captured data, we can improve collaboration and productivity, especially for remote users and teams.
“The digital worlds and objects can be used in everything from filmmaking, gaming and tourism applications to architecture, real estate, land or utilities management, city services and more.”
Dold will continue to report directly to Rollén as a member of Hexagon’s executive management team.
Thomas Harring, president of Hexagon’s Geosystems division, and Steven Cost, president of Hexagon’s Safety, Infrastructure and Geospatial division, will join the Hexagon executive management team, reporting directly to Rollén.
Harring will also assume responsibilities for Hexagon’s Architecture, Engineering and Construction (AEC) business. This includes the software AEC business, which comprises the HxGN Smart Build portfolio previously managed under the PPM division and reported under IES, as well as Hexagon’s complementary sensor-software reality-capture and visualization solutions, such as the award-winning BLK line, already managed by the Geosystems division and reported under GES.
Hexagon’s financial reporting structure consisting of IES and GES will remain the same.
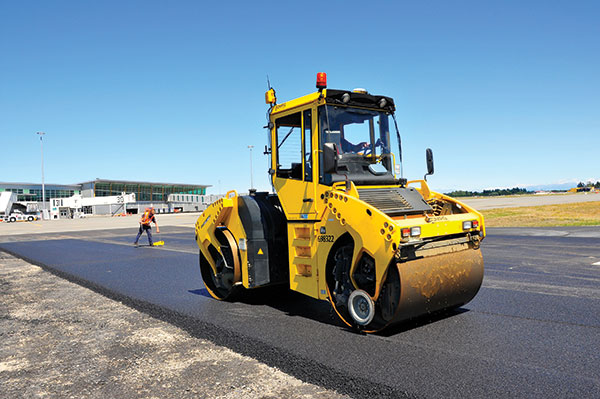
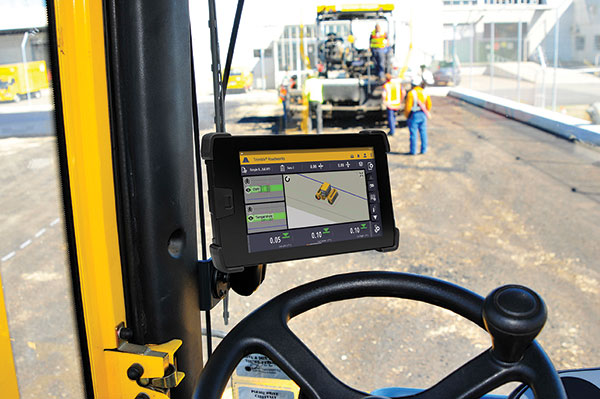
Trimble has introduced Trimble Roadworks Paving Control Platform for Asphalt Compactors. It enables operators to accurately control the compaction process, while reducing unnecessary passes that can result in over compaction. The highly accurate, 3D paving control system is designed to improve the speed, accuracy and ease of asphalt compaction.
The system leverages the highly intuitive Android-based Trimble Roadworks software to maximize ease of use, shorten training times and decrease downtime for operators already familiar with the Roadworks user interface. With the proper hardware and software configurations, the new system is flexible and can support a variety of jobsite needs and specifications.
Roadworks helps contractors save on fuel costs and reduce both machine wear and tear and operator hours. In addition, asphalt temperature mapping provides color-coded data to allow operators to compact at the correct temperature, reducing material waste and rework.
Photo: Trimble
In addition to helping operators achieve greater accuracy and efficiency, Roadworks is available at various pricing levels to help meet the needs of each contractor. New compactor licenses make it possible for contractors to pay for only the functionality they need, and office-only licenses provide increased functionality in the office. Users can also benefit from ongoing Roadworks platform development.
“We’re expecting there to be an influx of projects over the coming months and years as the result of increased infrastructure funding,” said Kevin Garcia, general manager, Trimble Civil Specialty Solutions. He said the release was important because more departments of transportation and private owners are building technology requirements into their requests for proposals (RFPs).
Connected Site Functionality. Roadworks is compatible with Trimble WorksOS and Trimble WorksManager software. This enables contractors to send construction-ready models from the office to the machine as well as to remotely monitor jobsite progress and activity. In addition, productivity data collected from the machine is automatically synced back to the office.
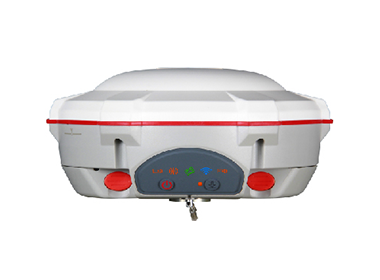
ComNav Technology has announced major upgrades to its T300 and T300 Plus GNSS receivers for the global market, including an upgrade to its GNSS K8 platform on both receivers and a tilt-sensor replacement for the inertial measurement unit (IMU) on the T300 Plus.
The upgraded T300 and T300 Plus provide reception of more GNSS channels and increased reliability, the company said.
More channels. The powerful full-constellation tracking ability on the K8 platform enables reception of all current and future GNSS signals, including GPS, BeiDou, GLONASS, Galileo, QZSS, NavIC and SBAS. Signal support and tracking for QZSS L1/L2/L5, Navic L5, Galileo E6 and Altboc as well as GLONASS L3 are also available. After the upgrade, T300 and T300 Plus each receive 965 GNSS channels, and offer robust GNSS tracking performance.
Improved reliability. The advanced GNSS real-time kinematic (RTK) technology on the K8 platform provides continuous centimeter-level positioning within a short period of time. To alleviate the influence on authentic satellite signals, the K8 platform enhances interference detection and mitigation. The interference, for example, between buildings or in the dense jungle, will not affect the positioning results.
With the upgrades, users can expand the reach of their GNSS rovers and obtain reliable positioning results even in complex environments.
Low power consumption. In static mode, power consumption is reduced to 1.92 W, extending working time to 16 hours and providing a smooth workflow without an external power supply.
T300 Plus tilt compensation. Combined with the inertial measurement unit (IMU), the T300 Plus can support tilt compensation up to 60° and keeps the accuracy within 2.5 centimeters, which significantly improves the fieldwork with increased efficiency, convenience and reliability without magnetometer and accelerometer calibration.
The upgraded T300 and T300 Plus GNSS receivers are available now.
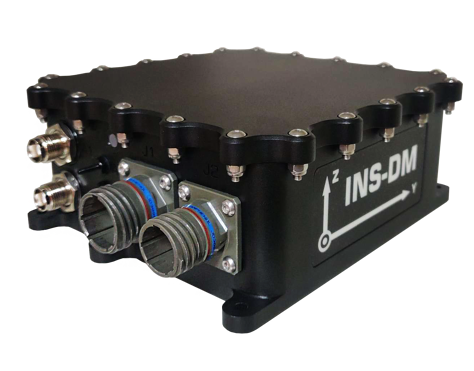
Inertial Labs has launched a new GNSS-aided inertial navigation system. INS-DM is an IP68-rated version of the company’s new generation of super ruggedized units, shielded from electromagnetic interference. The fully integrated device combines the inertial navigation system (INS) with an attitude and heading reference system (AHRS) and air data computer (ADC).
The high-performance strapdown system determines position, velocity and absolute orientation (heading, pitch and roll) for any device on which it is mounted. Horizontal and vertical position, velocity and orientation are determined with high accuracy for both motionless and dynamic applications.
The INS-DM can support multiple types of micro-electromechanical (MEMS) inertial measurement units (IMU) developed by Inertial Labs. The INS-DM also supports other IMUs like the Honeywell HG4930.
The INS-DM uses different multi-constellation (GPS, GLONASS, Galileo, BeiDou and QZSS) GNSS receivers such as the NovAtel OEM7 series or the u-blox F9 series.
The optional ADC is supported by two Honeywell barometric sensors and the ability to support an internal fluxgate or external stand-alone magnetic compass. The INS-DM contains Inertial Labs’ new onboard sensor-fusion filter, state-of-the-art navigation and guidance algorithms, and calibration software.
Key Features
Commercially exportable GNSS-aided INS
3-in-1 strapdown system: INS + AHRS + ADC
Embedded industrial, tactical or navigation-grade Honeywell or Inertial Labs MEMS IMU
Novatel OEM7 or u-blox ZED-F9P high-precision GNSS receiver
GPS, GLONASS, Galileo, BeiDou, QZSS and real-time kinematic signals supported
Total and static pressure sensors for calculating indicated airspeed
SBAS, DGPS, RTK and PPP corrections supported for precise real-time operation
GNSS measurements and IMU raw data for post processing
Advanced, extendable (based on application) embedded Kalman-filter-based sensor fusion algorithms
State-of-the-art algorithms for different dynamic motions of helicopters, UAVs, marine vessels and ground vehicles
Full temperature calibration of all sensing elements
EMC, EMI and ERD protection (MIL-STD-1275)
Environmentally sealed (IP68)
Aiding data: wind sensor, air-speed sensor, Doppler shift from locator (for long-term GPS-denied environments), external position and external heading.
The INS-DM is the result of more than 20 years of Inertial Labs’ experience developing and supplying INS solutions to land, marine and aerial platforms around the world.
NextNav participated in the European Commission’s Joint Research Centre (JRC) alternative positioning, navigation and timing (APNT) evaluation in Ispra, Italy. At the trial, NextNav showcased an alternative PNT backup to GNSS, TerraPoiNT.
According to the JRC, the trial is analyzing the technologies “which could deliver positioning, and/or timing information, independently from GNSS, to be effective backup in the event of GNSS disruption, and if possible to be able to provide PNT in the environments where GNSS cannot be delivered.”
The test furthers the European Union’s creation of a backup to GNSS and is intended to assess which technologies could strengthen and expand the European PNT capacity.
PNT services are critical for the global economy, with studies estimating a contribution to the European GDP of approximately 10%. Today, GNSS services are the backbone of PNT, with an increasing role in new services and technologies, including car-sharing, autonomous vehicles, ship and aircraft navigation, smart logistics and precision agriculture.
It’s About Time
The timing capabilities of PNT are heavily utilized today by critical infrastructure, which is strategic from a commercial and societal perspective, including telecom, energy, finance and transportation. Published studies estimated economic losses of around 1 billion EUR per day if GNSS were unavailable.
NextNav’s TerraPoiNT trial focused on measuring the precision of timing delivery across alternate timing sources to better understand performance in GNSS-free environments — including instances of outages, spoofing and jamming. As a part of the trial, NextNav also demonstrated its capabilities in providing both indoor and outdoor z-axis vertical location.
TerraPoiNT is a system for assured PNT that uses terrestrial transmitters deployed around a service area to triangulate the location of a device. Unlike national space-based systems, the proximity of NextNav’s transmitters makes the signal strength 100,000 times that of GPS.
“The trials are part of the global trend to develop a resilience layer to space-based GPS/GNSS systems that is more secure and available,” said Ganesh Pattabiraman, NextNav CEO. “We are redefining the capabilities of APNT technologies and look forward to working with the European Commission on furthering these initiatives to build a GNSS backup layer that can deliver highly precise PNT across use-cases.”
Trials for U.S., Europe
The U.S. and countries across Europe continue to invest in both understanding and taking steps towards creating a resilient PNT layer in each nation. Participation in the JRC trial builds upon the recent evaluation of APNT technologies in the United States, including a 2021 U.S. Department of Transportation report, where TerraPoiNT was found to be the best performing APNT solution across use cases.
Further, NextNav recently created an APNT testbed in the San Francisco Bay area that was developed as part of a U.S. Department of Homeland Security demonstration used to evaluate the precision and resilience of NextNav’s TerraPoiNT network.
The JRC is expected to report results from the evaluation this spring.
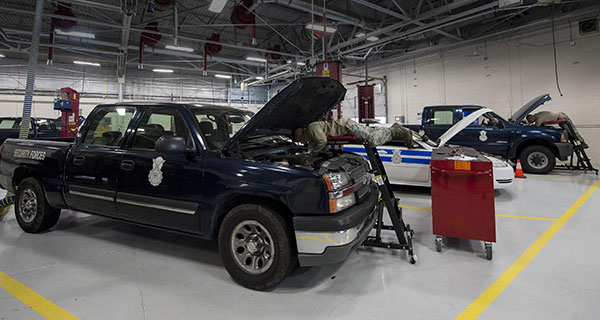
U.S. Air Force Airmen repair government-operated general-purpose vehicles at Moody Air Force Base, Georgia. (Photo: U.S. Air Force/Airman 1st Class Lauren M. Johnson)
The U.S. Air Force will equip its 21,000 general-purpose vehicles with Geotab fleet-management technology after the company was awarded a sole-source contract.
Geotab received FIPS 140-2 validation for its cryptographic library in February 2019 as well as FedRAMP authorization and ISO 27001 certification for its telematics platform. These compliance certifications and authorizations validate Geotab’s system and organizational processes, enabling the company to offer its fleet-management services to all levels of federal, state and local government agencies.
Geotab’s fleet-management technology for the Air Force is secure and customized. It includes the following features to help the service more effectively manage its vehicles:
automated odometer capturing
engine diagnostics
problem predictive analytics
fuel data
custom reporting
GHG reduction dashboards
fleet right-sizing reporting
Selected for its integration capacity and proven commitment to information security, the sole-source award from the Department of the Air Force yields an Authorization to Operate (ATO) within the Department of Defense (DoD). The authorization will allow other DoD agencies to leverage Geotab services by piggybacking off of this DAF ATO.
Geotab fleet-management products are used by more than 2,000 government agencies and departments at all levels to capture, measure and analyze crucial fleet data with deep granularity. “Winning this sole-source contract from the Department of the Air Force further solidifies Geotab’s ability to collaborate with agencies that operate at the highest levels of national data security and to provide a customized and highly secured telematics solution,” said Dan Zdarko, business development manager, federal government, Geotab.
“It is vitally important that the technology we deploy in our fleets meet the highest standards of data security put forth by the U.S. government,” said Tim Patterson, program management flight chief from the U.S. Air Force’s 441st Vehicle Support Chain Operations Squadron at Langley Air Force Base in Virginia. “Our objective is to enhance fleet-management strategies and reduce the total cost of ownership longer term across the Department of the Air Force.”
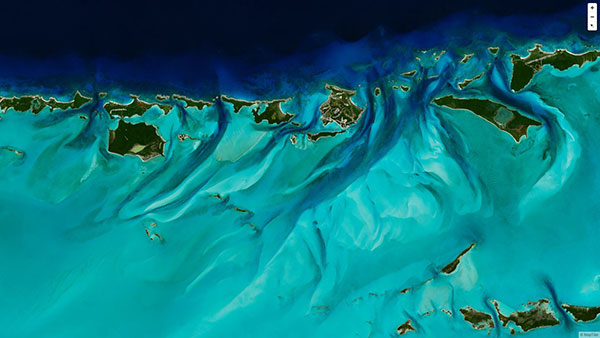
To create the world image, satellite imagery was processed to remove clouds and balance shades and tones, and then carefully stitched together to create a seamless map layer with beautiful colors. The input data is recent, from 2020 and 2021, and rendered as one tiled file with zoom levels 0-13 for use in web applications.
Crafted by a small Swiss/Czech team, it is a viable, up-to-date alternative to Google maps for software developers, without privacy issues. It is available including seamlessly merged, super-high resolution aerial images for selected countries. The imagery provides more detail when users zoom beyond the satellite data.
The map’s cloud-free satellite imagery is useful for real-estate websites, mobile apps, globes, games, virtual worlds, in airplane infotainment systems, and for TV news and weather. In addition, scientists and artists can download it for their own innovations and creations.
In all, 180 terabytes of imagery have been crunched to fit on a 512-gigabyte USB stick.
MapTiler has a history of collaborating with the European Space Agency (ESA) and its Copernicus Earth observation project, and has won two Copernicus Masters Awards. Working in ESA’s Business Incubation Center also boosted the company’s ability to adapt satellite imagery into useful data.
Syntony GNSS has joined TCCA, a global representative body for the critical communications ecosystem.
With offices in France, the United States and Canada, Syntony designs and manufactures GNSS products, including receivers and simulators dedicated to mission-critical applications, transportation, aerospace and defense.
According to an industry report, the global GNSS simulators market size is set to grow from USD 106 million in 2020 to USD 165 million by 2025, at a CAGR of 9.3% during the forecast period. Various factors such as rapid penetration of consumer IoT, the contribution of 5G in enabling ubiquitous connectivity, and increasing use of wearable devices utilizing location information are expected to drive the adoption of the GNSS simulators hardware, software and services.
Syntony GNSS manufactures SubWAVE, a solution that enables GPS to work underground and makes possible critical safety services. SubWAVE enables emergency call location in underground tunnels and stations from any smartphone. It also provides the location of any first responder using a compatible P25 or TETRA receiver.
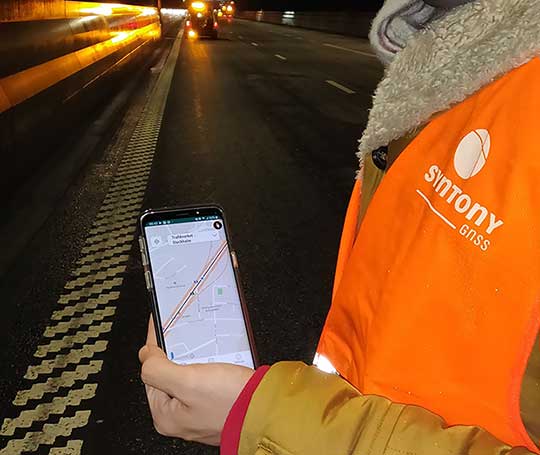
A Syntony team member in a Swedish road tunnel during SubWAVE testing shows the positioning in an underground environment on a smartphone. (Photo: Syntony GNSS)
SubWAVE is typically deployed in underground subway networks (stations and tunnels). It covers 100% of the underground stations of the Stockholm subway, for example. It is also suitable for underground road and rail tunnels, underground parking, and in the mining industry.
“We invented SubWAVE to save lives: to be able to precisely locate a firefighter inside a tunnel, for example, is critical to his or her safety, and this is what our system does,” said Joel Korsakissok, Syntony president and founder. “Also, being able to pinpoint the location of emergency calls made from road or rail tunnels will enhance first responders’ ability to provide assistance and rescue. We are very proud to become a member of TCCA, whose DNA is focused on life-saving through critical communications.”
“Reliable GPS/GNSS coverage in underground and denied locations such as subways, rail and road tunnels and mining is now an essential requirement for emergency services and asset operator personnel navigation and response as well as citizen safety,” said Kevin Graham, TCCA CEO. “General citizens and many businesses now rely on GPS/GNSS signals for their navigation and tracking use cases. We welcome the expertise of Syntony GNSS to enhance knowledge within TCCA of this critical area, and look forward to working with Joel and his team.”
Guangzhou Asensing Technology Co. Ltd, which specializes in high-precision positioning technology for intelligent transportation, demonstrated HD-MapBox at the Consumer Electronics Show (CES), which took place Jan. 5-8 in Las Vegas.
HD-MapBox integrates high-precision map data based on high-precision positioning.
The device can achieve lane-level positioning and 1+ mile (2 km) predictive cruise control (PCC), providing a decision basis for advanced assisted driving to better meet the demanding positioning requirements of autonomous vehicles.
“As the premise for autonomous driving safety, high-precision positioning is of great importance for integrating positioning technology based on inertial measurement units (IMU), GNSS signals, visual perception systems and high-definition (HD) maps,” said Situ Chunhui, Asensing Technology CTO. “High-precision positioning is becoming the preferred choice due to higher positioning accuracy and improved redundancy as well as an enhanced passing rate under all scenarios.”
Under any driving scenario, autonomous vehicles must accurately interpret their own lane-level location information to better predict and prevent risks and make safe driving decisions. As a result, positioning is not only part of the autonomous driving process, but also the premise of autonomous driving.
However, any single positioning technology has its own limitations, especially in certain scenarios such as in tunnels and underground garages where the perception system may be adversely affected by changes in the amount of light and low GPS signal, thereby affecting driving safety.
Fusing data from a GNSS receiver, IMU, ADAS camera, vehicle dynamics and HD maps, the HD-MapBox can achieve a lateral error of less than 8 inches (0.2 meters) and a longitudinal error of less than 6.5 feet (2 meters) with a 95 percent confidence interval, providing an accurate reference for highway pilot (HWP) and automated valet parking (AVP). Even if both GNSS and lane line detection are not available, the HD-MapBox can still enable vehicles to keep in lane for at least a quarter mile (400 meters).
Trimble has opened its Call for Speakers for the Trimble Dimensions+ 2022 User Conference to be held November 7-9 at the Venetian Resort in Las Vegas.
The Dimensions+ User Conference will promote a variety of sessions highlighting groundbreaking technology that can be used to transform work and push for a sustainable future. Speakers will have the opportunity to share their industry experiences and insights with peers from around the globe. The conference will also provide an Offsite Experience where attendees can learn how professionals are using the latest technologies to create a safer, greener and more productive work environment.
Session topics will include autonomy; building design, construction and operation; civil engineering and infrastructure; forensics; forestry; local, state and federal government; land administration; mapping and GIS; marine construction; mobile mapping; monitoring; photogrammetry and remote sensing; scanning; surveying; utilities; sustainability and more.
Proposals for speakers will be accepted through March 31, 2022 and notifications of acceptance will be made in the following months. Proposals can be submitted here.
To register for the conference or learn about sponsorship opportunities, visit Trimble’s website.
It’s the beginning of 2022 and the new, modernized NSRS is only about three years away. Hopefully, everyone has been reading NGS’s blueprint documents updated during 2021, and participating in NGS’s webinar series. Together, they provide the latest information about the changes from the existing NSRS to the new NSRS.
My previous columns highlighted many aspects of the new geometric reference frame and geopotential datum. In this month’s column, I will highlight the time-dependent aspect of the modernized NSRS and why it is necessary for the new system.
As I stated before, NOAA’s National Geodetic Survey (NGS) is developing models and tools for users to be able to transform coordinates between the four national terrestrial reference frames and the International Terrestrial Reference Frame, the Geopotential Datum and the North American Vertical Datum of 1988 (NAVD 88), as well as estimate coordinates at epochs different from the survey observation epoch by accounting for movement.
What does NGS mean by estimate coordinates at epochs different from the survey epoch, and why is it necessary to account for movement for the new, modernized NSRS? This column will address these issues.
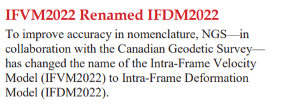
NGS’s January 2022 (Issue 27) edition of NSRS Modernization News announced a paper about the modernized NSRS and a change in name to the Intra-Frame Velocity Model (IFVM). See the box below. Users can sign up for these newsletters here, and can obtain access to previous newsletters here.
The Latest Issue of
NSRS Modernization News
Image from GovDelivery Communications Cloud on behalf of NOAA’s National Ocean Service.
The new paper was published in October 2021 and is titled “The Mathematical Relation between IFVM2022 as Expressed in ITRF2020 with IFVM2022 as Expressed in the Four Terrestrial Reference Frames of the Modernized NSRS with Dependence on EPP2022.” It can be downloaded here.
The paper describes the mathematical relationship between the Intra-Frame Velocity Model (IFVM2022) and the Euler Pole Parameters (EPP2022).
The NSRS Modernization News announcement states that the IFVM2022 name has been changed to the Intra-Frame Deformation Model (IFDM2022). The latest version of blueprint 1 and the October 2021 (NOS NGS 90) report were published before the name changes, so they refer to IFVM2022 instead of IFDM2022.
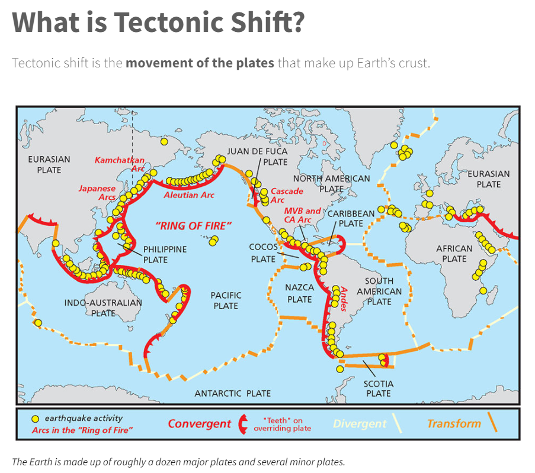
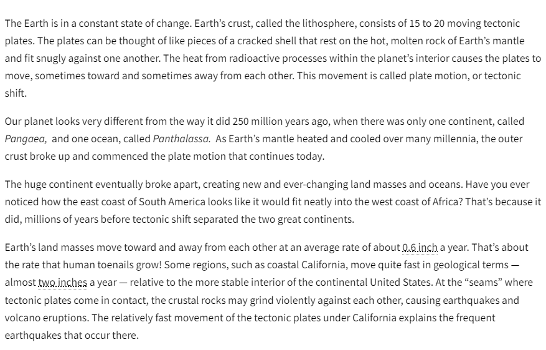
Why is it necessary to account for movement? Coordinates basically change because the Earth’s surface is moving due to the movement of major tectonic plates. See the box below for information about why it is called plate movement or tectonic shift. NGS understands this and is attempting to manage the changing coordinates by providing a time-dependent component.
Image: National Ocean Service websiteScreenshot: NOAA Website
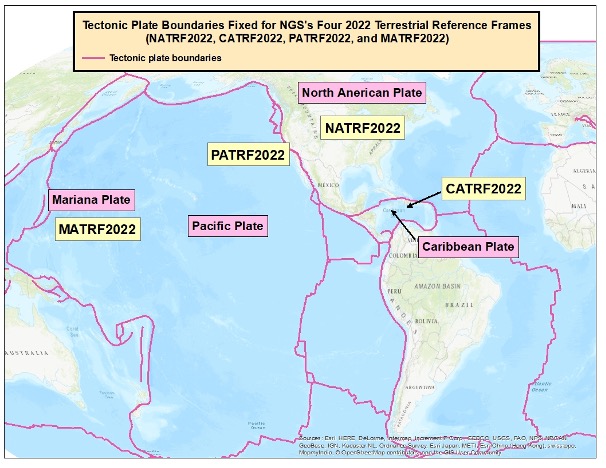
NGS will be defining the following four geometric terrestrial reference frames that are based on the tectonic plates (see map below):
North American Terrestrial Reference Frame of 2022 (NATRF2022)
Pacific Terrestrial Reference Frame of 2022 (PATRF2022)
Caribbean Terrestrial Reference Frame of 2022 (CATRF2022)
Mariana Terrestrial Reference Frame of 2022 (MATRF2022)
Four Tectonic Plates Part of NGS’s New NSRS
Image: Dave Zilkoski
As previously stated, NGS is developing models and tools for users to be able to transform coordinates between the four national frames and the International Terrestrial Reference Frame, as well as estimate coordinates at epochs different from the survey observation epoch by accounting for movement. These models are denoted as EPP2022 and IFDM2022.
So, what are EPP2022 and IFDM2022? And what does this mean to surveyors and mappers?
EPP stands for Euler pole parameters (a way of describing a plate’s rotation) and IFDM2022 is a way of computing the drift in coordinates.
Why Euler Pole? See the box titled “Who was Euler?”
Who was Euler?
Leonhard Euler was a Swiss who lived in the 1700s. He was one of the greatest mathematicians that ever lived and has been called the greatest mathematician of the 18th century. He founded the studies of graph theory and topology, and made pioneering and influential discoveries in many other branches of mathematics such as infinitesimal calculus. He introduced a lot of modern mathematical terminology and notation, including the notion of a mathematical function. He is also known for his work in mechanics, fluid dynamics, optics, astronomy and music theory.
The definition of Euler’s fixed point theorem states that any motion of a rigid body on the surface of a sphere may be represented as a rotation about an appropriately chosen rotation pole, called a Euler pole. This theorem has been used by geologists to understand and describe the motions of tectonic plates.
NGS’s 2021 revised Blueprint 1, NOAA Technical Report NOS NGS 62, Blueprint for the Modernized NSRS, Part 1: Geometric Coordinates and Terrestrial Reference Frames provides an explanation of Euler poles and “plate-fixed” frames. As stated in the “Who was Euler?” box, the definition of Euler’s fixed-point theorem states that any motion of a rigid body on the surface of a sphere may be represented as a rotation about an appropriately chosen rotation pole, called a Euler pole. The following is stated in the NOS NGS 62 report under “Plate-Fixed Frames and Euler Poles,” section 4:
When considering only the rigid (not deforming) part of a tectonic plate, the horizontal motion of the plate (relative to a global plate-independent reference frame, like the ITRF) can be modeled as a rotation about a geocentric axis passing through a fixed point on Earth’s surface. Although such models must make certain assumptions (such as the rigidity of the plate), the dominant motion of the majority of points on most tectonic plates is the rotation about a fixed point. That point is known as an “Euler pole.”
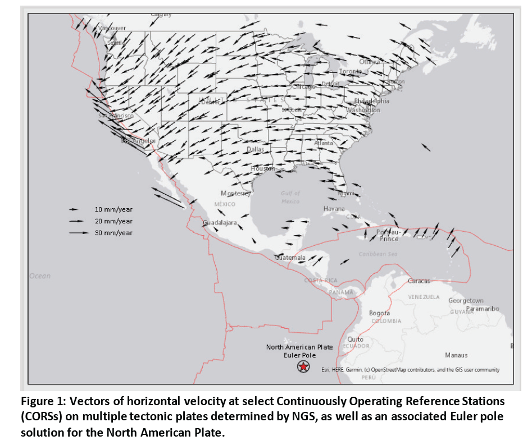
What is important to know is that the determination of a plate’s Euler pole location and the angular velocity with which the plate rotates can be empirically determined using GNSS observations from a CORS network distributed throughout the plate. Figure 1 from the NOS NGS 62 report provides a plot of the North American plate Euler pole and the vectors of the horizontal velocities at select CORS (see the box titled “Figure 1 from NOS NGS 62”).
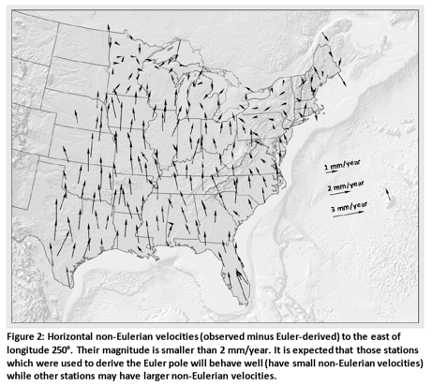
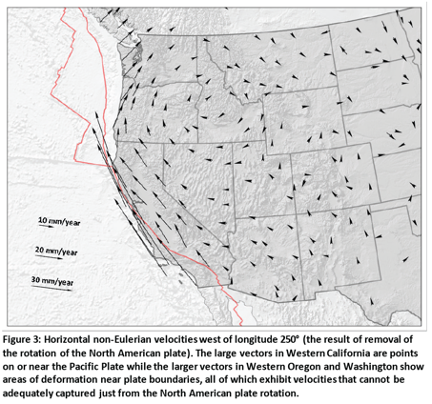
Every place on Earth is moving. That includes neighboring marks on the same tectonic plate. What this means is that after the Eulerian motions are removed, the remaining motions left over change the relative differences in coordinates of neighboring marks located on the same tectonic plate. Figures 2 and 3 from the NOS NGS 62 report provide plots of estimates of these remaining velocities (see the boxes titled “Figure 2 from NOS NGS 62” and “Figure 3 from NOS NGS 62.”)
Figure 2 is a plot of the non-Eulerian motions east of 110° west longitudes. As stated in the report, most of the velocities are less than 2 mm/year. The concept is that the EPP2022 and IVDM2022 models will remove the Eulerian and non-Eulerian movement of the marks.
Figure 2 from NOS NGS 62
Image: NGS website
Figure 3 is a plot of non-Eulerian vectors west of 110° west longitude. As indicated in the plot, the large vectors in Western California, Western Oregon and Western Washington show areas of deformation near plate boundaries that don’t appear to be adequately captured just from the North American plate rotation.
Figure 3 from NOS NGS 62
Image: NGS website
It should be noted that the size of the vectors on Figures 2 and 3 depict a different magnitude of movement. Figure 2 depicts vectors at 1-3 mm/year and Figure 3 depicts movement at 10-30 mm/year.
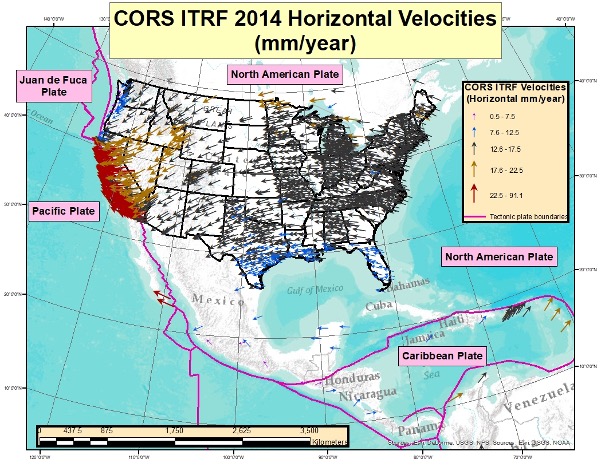
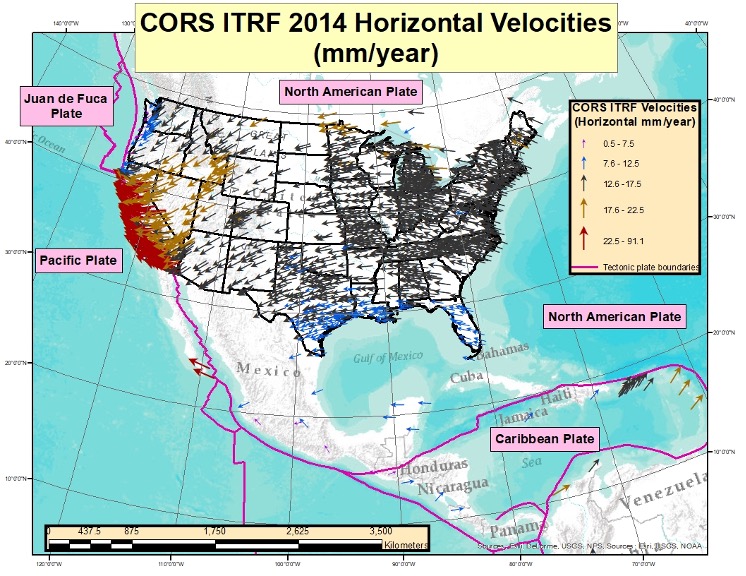
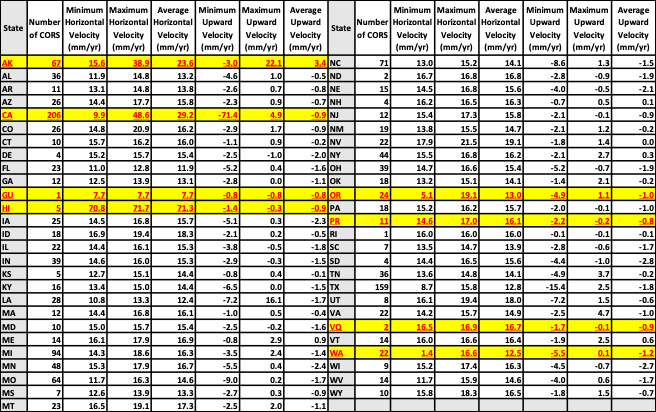
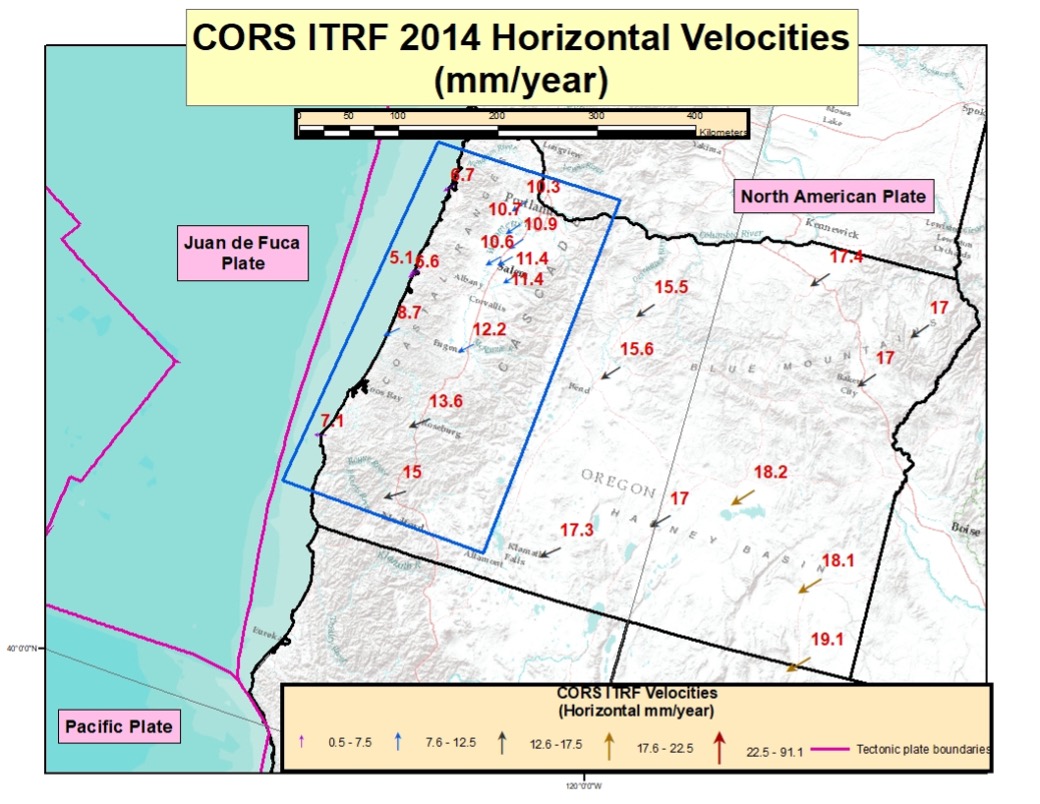
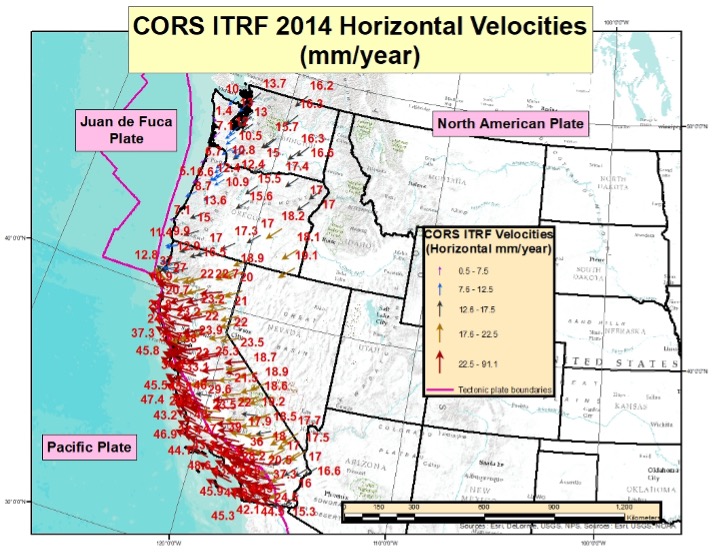
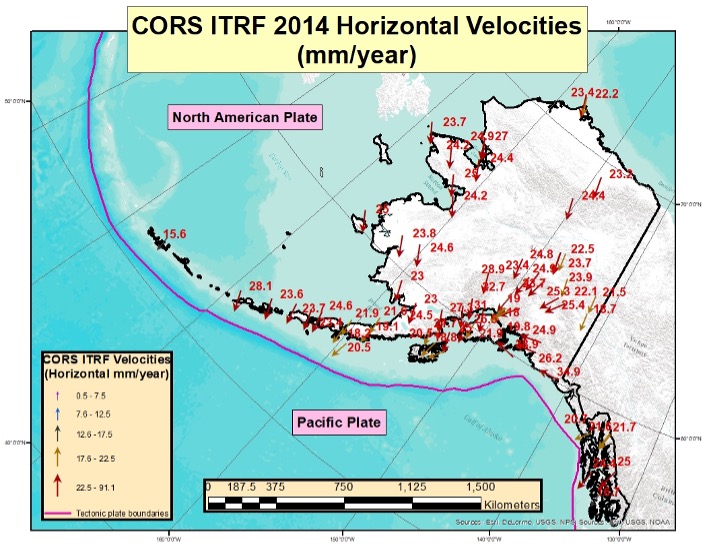
To better visualize the potential size of the movement, I downloaded the CORS ITRF2014 coordinates and velocities from NGS’s website and compiled the results. See the boxes titled “CORS ITRF 2014 Horizontal Velocities” and “Table of ITRF 2014 Horizontal and Upward Velocities of U.S. CORSs.”
Computed Velocities Only (Downloaded Jan. 13, 2022)
Image: Dave Zilkoski
The box titled “CORS ITRF 2014 Horizontal Velocities” provides the horizontal vectors based on NGS’s file downloaded on Jan.13. Only CORSs designated as operational and computed velocities were included in the plot.
I have also created a table that includes a summary of the ITRF rates for CORS labeled as part of the United States. The table includes the following information for each State and Territory of the United States:
Number of CORS
Minimum Horizontal Velocity (mm/year)
Maximum Horizontal Velocity (mm/year)
Average Horizontal Velocity (mm/year)
Minimum Upward Velocity (mm/year
Maximum Upward Velocity (mm/year),
Average Upward Velocity (mm/year).
See the table below.
Table of ITRF 2014 Horizontal and Upward Velocities of U.S. CORSs
Computed Velocities Only (Downloaded Jan. 13, 2022)
Highlighted territories are not on the North American plate (GU, HI, PR, and VQ), and highlighted states are partly inside or close to the boundary of the North American plate and another tectonic plate (AK, CA, OR, WA).
The highlighted territories in the table are not on the North American plate (GU, HI, PR and VQ), and the highlighted states are partly inside or close to the boundary of the North American plate (CA, OR, WA). This is one of the reasons why their minimum and maximum horizontal velocity values are different from most of the other states’ values.
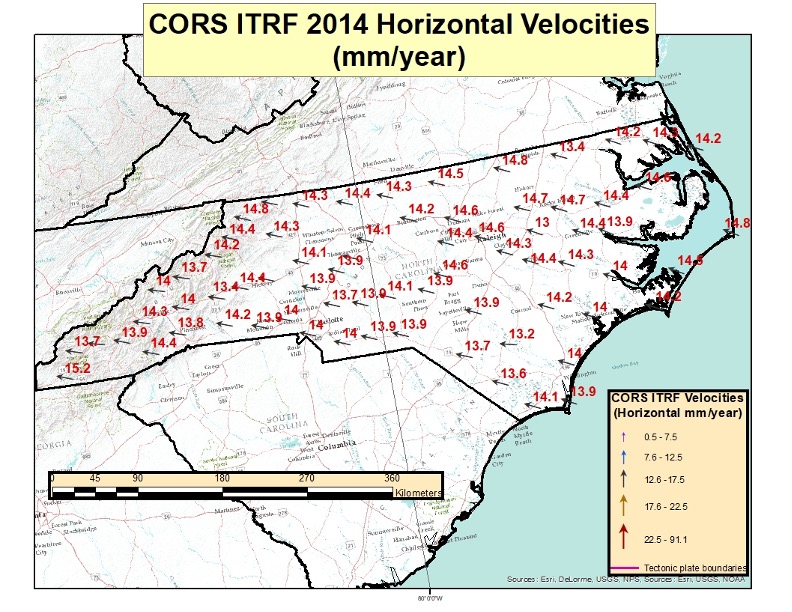
To visualize the relative differences in horizontal velocities between neighboring CORSs, I plotted the ITRF 2014 Horizontal Velocities for CORSs located in North Carolina (see the box titled “CORS ITRF 2014 Horizontal Velocities in North Carolina”). Looking at the figure, it’s obvious that all of the velocities are around 14 mm/year and moving in the same direction.
CORS ITRF 2014 Horizontal Velocities in North Carolina
Computed Velocities Only (Downloaded Jan. 13, 2022)
Screenshot: Dave Zilkoski
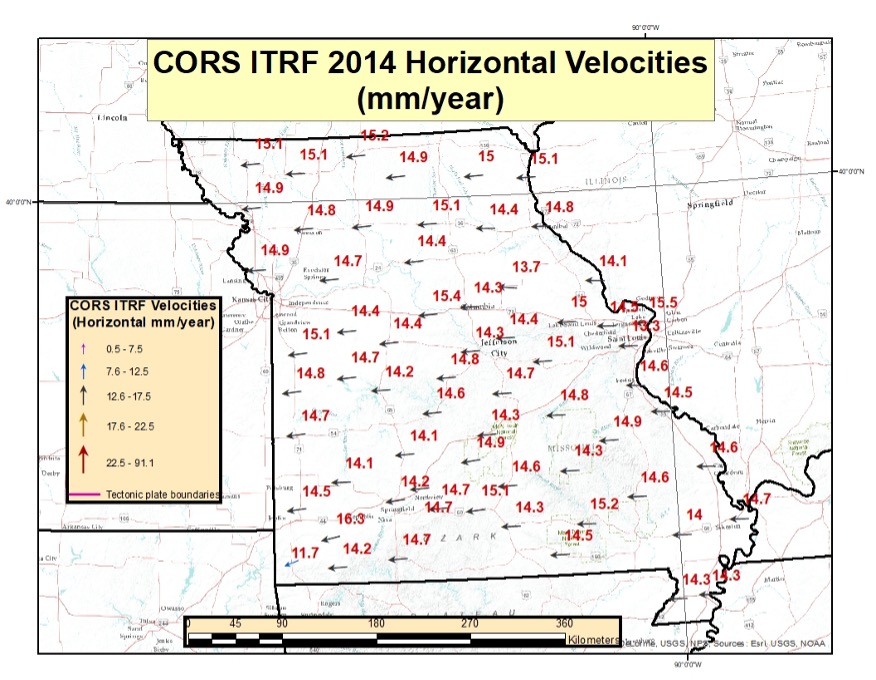
I plotted the horizontal velocities for Missouri to provide an example of the velocities in the central region of the conterminous United States. The magnitude of the velocities is similar to that for North Carolina, but the direction of the vector is slightly different. North Carolina’s average horizontal velocity is 14.1 mm/year and Missouri’s average horizontal velocity is 14.6 mm/year.
CORS ITRF 2014 Horizontal Velocities in Missouri
Computed Velocities Only (Downloaded Jan. 13, 2022)
Image: Dave Zilkoski
To emphasize the differences along the boundaries of the tectonic plates, I’ve included a plot of the CORS ITRF 2014 horizontal velocities for the State of Oregon and a plot of the states along the West Coast of the United States. See the boxes titled “CORS ITRF 2014 Horizontal Velocities in Oregon” and “CORS ITRF 2014 Horizontal Velocities Along West Coast of CONUS.” As indicated in the plot, there are significant changes in horizontal velocities near the Oregon coast. The values decreased by about 10 mm/year from the inland CORS to the CORS along the coast.
CORS ITRF 2014 Horizontal Velocities in Oregon
Computed Velocities Only (Downloaded Jan. 13, 2022)
Image: Dave Zilkoski
The plot of the CORS ITRF 2014 Horizontal Velocities Along West Coast of CONUS clearly indicates the change in magnitude the closer the CORS are to the Pacific and Juan de Fuca plates.
CORS ITRF 2014 Horizontal Velocities Along West Coast of CONUS
Computed Velocities Only (Downloaded Jan. 13, 2022)
Image: Dave Zilkoski
For completeness, I’ve also included a plot of the horizontal velocities for Alaska.
CORS ITRF 2014 Horizontal Velocities in Alaska
Computed Velocities Only (Downloaded Jan. 13, 2022)
Image: Dave Zilkoski
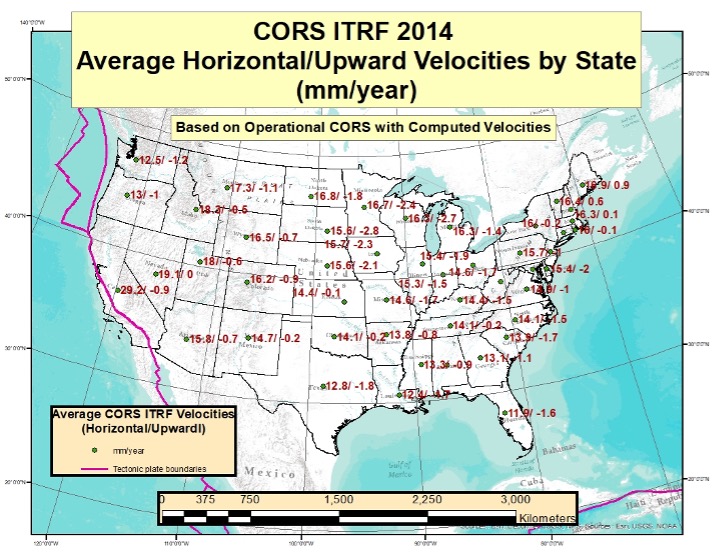
To better visualize the horizontal and upward velocities of CORS among states, I plotted the average horizontal and upward velocity value for each state based on that states’ CORS. See the box titled “Average Velocities by State.”
Average Velocities by State
Image: Dave Zilkoski
I also computed an average horizontal velocity value based on CONUS CORS east of 110° west longitude (denoted here as a regional horizontal velocity value). [I used the CORSs east of 110° west longitude to be consistent with NGS’s Figure 2 in NOS NGS 62.]
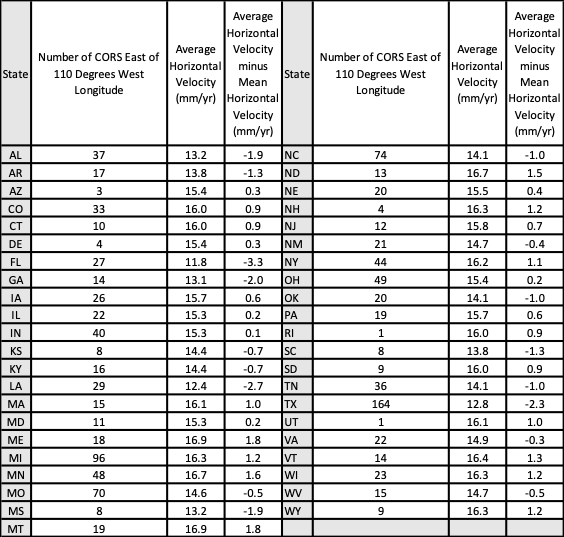
The box below summarizes the average horizontal motion for each state. The table provides:
The Number of CORS East of 110° West Longitude
Average Horizontal Velocity (mm/year)
Average Horizontal Velocity minus Regional Horizontal Velocity (mm/year).
This provides an estimate of the variation of the relative horizontal motion between States.
Table of ITRF 2014 Horizontal Velocities minus Regional Velocity of U.S. CORS East of 110° West Longitude
Table only includes CORS East of 110° West Longitude (Image: Dave Zilkoski)
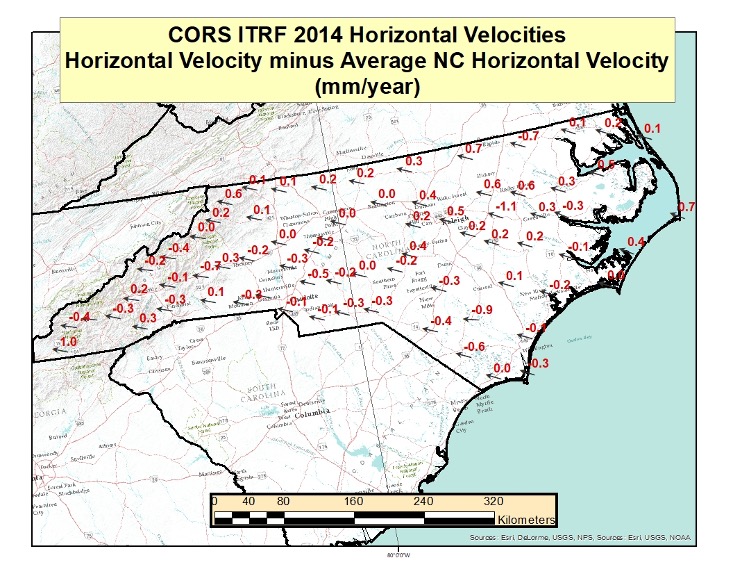
The box titled “Horizontal Velocities in NC Minus Average Velocity” depicts the resulting horizontal velocities with an average velocity removed (the average velocity was based on NC CORS only) for all CORS in North Carolina. As one can see from the plot, most of the resulting horizontal velocities are less than 1 mm/year, but they are still not zero. Once again, this is only meant to provide an idea of the size of the relative vectors between CORS in North Carolina.
As indicated in the NOS NGS 62 report, these horizontal velocities will be small, but they will not be zero. Hence the reason that NGS needs to provide models and tools for users to be able to transform coordinates between the four national frames (NATRF, PATRF, CATRF and MATRF) and the International Terrestrial Reference Frame (ITRF), as well as to estimate coordinates at epochs different from the survey observation epoch by accounting for movement within the reference frame. Surveyors in California have been dealing with these types of movements for many years now.
Horizontal Velocities in NC Minus Average Velocity
(Downloaded Jan. 13, 2022)
Image: Dave Zilkoski
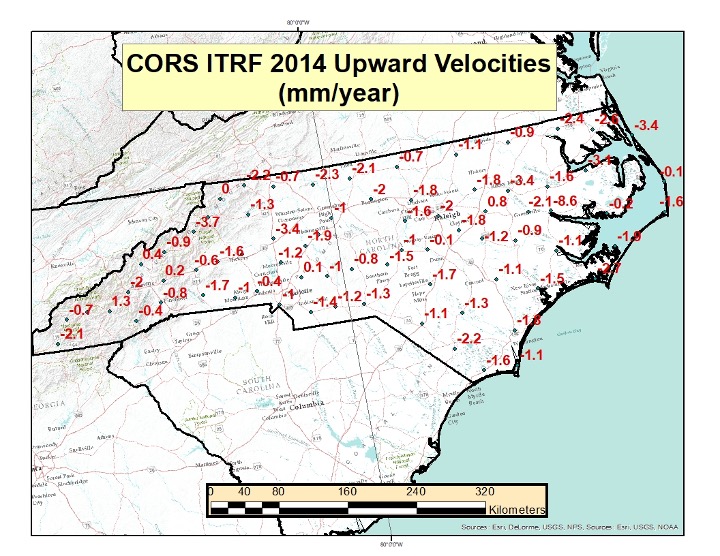
I plotted the ITRF 2014 upward velocity values of the CORS in North Carolina to depict an estimate of the vertical movement of the CORS in North Carolina. See the box below. The vertical velocities values are much less than the horizontal velocities, but they still are not zero. A future column will address the upward velocities based on the ITRF 2014 rates and crustal movement models.
CORS ITRF 2014 Upward Velocities in North Carolina
(Downloaded Jan. 13, 2022)
Image: Dave Zilkoski
This column explained why it is important to account for movement of marks everywhere and not just in areas influenced by active crustal movement due to earthquakes such as in Southern California. It provided information about the CORS rates of movement based on NGS’s ITRF2014 coordinates and velocity information. It highlighted NGS’s reports that describe models that will facilitate users transferring coordinates between reference frames and dealing with intra-frame movement between marks based on survey performed at different epochs. This is not just a horizontal positioning issue.
A future column will address estimates of vertical velocities in the new, modernized NSRS.
 Written in English, the book provides an academic introduction to the field of surveying and mapping. It is based on handouts and readers written for the third-year course “Surveying and Mapping” in the civil engineering bachelor’s program at Delft University of Technology in The Netherlands.