The 2014 State of the GNSS Industry Report reveals the results of our annual survey of GNSS professionals, covering the state of their business, the economic climate for GNSS products and services, driving market factors, the government’s role in funding and regulating, budgets devoted to R&D, the effects of jamming, and the “Issue of the Year.”Click here to download the 2014 State of the Industry Survey, sponsored by NovAtel, Trimble, and u-blox.
The Land Transport Authority (LTA) of Singapore is seeking to develop Singapore’s next-generation electronic road-pricing system, based on GNSS technology, reports AsiaOne News.
LTA has shortlisted three consortia to participate in a tender to develop the system: NCS Pte Ltd & MHI Engine System Asia Pte Ltd, ST Electronics (Info-Comm Systems) Pte Ltd, and Watchdata Technologies Pte Ltd & Beijing Watchdata System Co Ltd.
The contract to design and develop the system is expected to be awarded in the second half of 2015. The system is to be implemented in 2020.
Following an 18-month system evaluation test that concluded in December 2012, LTA said that it has found that it is technologically feasible to develop a GNSS-based road-pricing system in Singapore. The system will overcome the constraints of physical gantries, which are costly, difficult to maintain, and take up land space.
The GNSS-based system will implement distance-based pricing along certain congested roads, where motorists will be charged proportionate to the distance traveled. An interactive and intelligent on-board unit in motorists’ vehicles will support additional services such as real-time traffic information and electronic payment for parking fees.
LTA is considering new policies for off-peak travelers.
Invited guests at the annual GPS World Leadership Dinner, a special event held September 11 during ION GNSS+ in Tampa, Florida, heard perspectives from sponsors Lockheed Martin, Exelis, Raytheon, and Braxton Technologies, as well as visions of GNSS progress from our four award winners.
Leadership Awards were given to Javier Benedicto Ruiz, Galileo Project Manager, European Space Agency (Satellites category); Sherman Lo, senior research engineer and associate investigator (APNT), Stanford University (Signals category); Eric Gakstatter, contributing editor for survey and GIS, GPS World (Services category); and Oliver Montenbruck, head of GNSS Technology and Navigation Group, DLR, German Space Operations Center (Products category).
Over dessert, each table rose to the challenge of creating a phenomenal GNSS product or service and then competed in car races at the track.
More coverage of the awards will appear in the December issue.
The Dinner and Awards Ceremony was attended by 150 VIPs from industry, government, and research: top-level GNSS networking.
The 2014 leadership awards, determined by a poll of 40 industry professionals, await the start of the ceremony.
Eric Gakstatter (right) congratulates Todd Humphreys on a successful lap as Peter Grognard (center) looks on. At left are GPS World’s Kevin Stoltman and Tony Murfin. Photo: ION GNSS+
One lucky/skillful team with the highest combined product launch and race score took home trophies. Photo: ION GNSS+
Teams competed at the races, with a driver and pit crews to get cars quickly back on the track after spinouts. Photo: ION GNSS+
Victory at the finish line after a wild 20 seconds, as 14 teams competed in a double-elimination tourney — 23 races in all! Photo: ION GNSS+
The track pits two cars driven by two teams against each other in a double-elimination tourney. Photo: ION GNSS+
As in, “It’s not like you’re curing cancer,” a refrain I hear sometimes when I get a bit over-inflated on GPS/GNSS and the wonders they can do in many fields of human endeavor. The intent of that remark is to remind me that on the one hand, there is technology. On the other hand, there is life, and there is death. Despite the leaps and bounds and the many alterations to life and its circumstances that technological advances have created, life — and death — still have the upper hand. And they will for the forseeable future. What’s that bumper-sticker saying? “Nature bats last.”
At the crux of the mystery of life and its endings is the nature of cancer, one of the leading causes of the end of life. Cancer is so deadly because cancer cells are immortal. They multiply endlessly, unlike normal cells that have a limit of about 30 times multiplying-and-dividing. Cancer cells take over the host body until they have crowded out enough normal cells to kill it. The cause of death in this case is . . . immortal life.
Some believe that the key to immortality, if not to perpetual youth, lies hidden inside the coding of cancer cells, and that in unlocking one mystery, we may succeed in unlocking two. But I’m treading on thin metaphysical ice here, so I’ll withdraw to the solid shore of what we do know, of what we know we know.
The first successful forays have come in the field of geographic information systems (GIS); as yet, the insights furnished by GIS are not down to the level of accuracy furnished by GPS/GNSS, but they will surely get there. And GPS itself has been employed to study the recovery rates and health issues of cancer patients, indicating further usefulness.
It’s all part of the fabric. The solutions lie at the heart of the mystery.
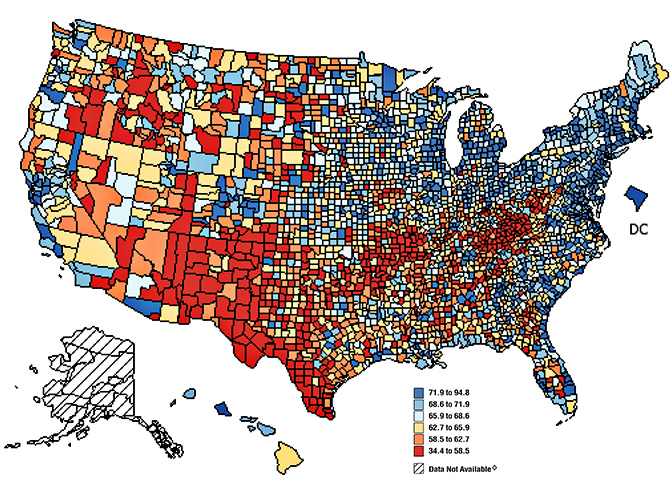
Figure 1. Mammograms in last two years; percent of respondents, by counties.
Trends Discerned in the National Cancer Institute’s Geospatial Databases Carry the Fight Forward
Location matters in cancer, as in many other things. The National Cancer Institute (NCI) recognized this fact more than 40 years ago, and its researchers have been investigating striking geographic differences in many cancers ever since. Most studies have found that these differences were due to lifestyle differences, such as levels of smoking and diet, although research into possible environmental causes are hampered by a lack of exposure data during the relevant period, 20–30 years prior to diagnosis.
Geospatial tools serve NCI in a variety of applications, including:
the identification and display of the geographic patterns of cancer incidence and mortality rates in the U.S. and their change over time,
the creation of complex databases for the study of cancer screening, diagnosis, and survival at the community level,
environmental exposure assessment through satellite imagery,
spatial statistical models to estimate cancer incidence, prevalence, and survival for every U.S. state,
communication of local cancer information to the public and public health professionals through interactive web-based tools,
the identification of health disparities at the local level through the comparison of cancer outcomes across demographic subgroups, and
development of new methods of displaying geospatial data for clear communication to the public and for examination of complex multivariate data by researchers.
Division of Cancer Control and Population Sciences
The Epidemiology and Genomics Research Program (EGRP) and the Surveillance Research Program (SRP) support grant research to use GIS in cancer research and the development of methodologies to accomplish this research. EGRP also funded the development and maintenance of a geographic information system for breast-cancer studies on Long Island (LI GIS). The LI GIS is available to researchers and can be used to study other types of cancer and conditions as well.
Surveillance Research Program
The Statistical Methodology and Applications Branch (SMAB) contributes to GIS research by developing statistical methods for the analysis, display, and web-based communication of geo-referenced cancer data.
The Surveillance Systems Branch (SSB) oversees the Surveillance, Epidemiology, and End Results (SEER) program, an integrated, comprehensive, multiple population-based reporting system of cancer registries covering 26% of the U.S. population. Cancer incidence information is provided at the state, county, and census-tract level. Investigators in SEER’s Rapid Response Surveillance Studies (RRSS) are exploring and applying GIS technology in several areas.
Division of Cancer Epidemiology and Genetics
The Epidemiology and Biostatistics Program (EBP) has a long history of publishing the NCI cancer atlases.
The Occupational and Environmental Epidemiology Branch (OEEB) has an active research program in using satellite imagery to estimate the potential exposure to cancer-causing environmental agents by individuals living in agricultural areas.
As to the finer granularity customarily seen in GIS databases by professionals using them in mapping, natural resource and asset management, utilities, and other sectors, researcher Linda Pickle of Pennsyslvania State University and StatNet Consulting comments:
“The SEER program at NCI does get the census-tract identification from the registries, but you have to get permission to use it. Mortality is only reported to NCHS at the county level. Therefore, all nationwide maps of cancer rates (incidence or mortality) must be at the geographic level available for all states, that is, county. Each state has the option to present its own data at smaller levels.
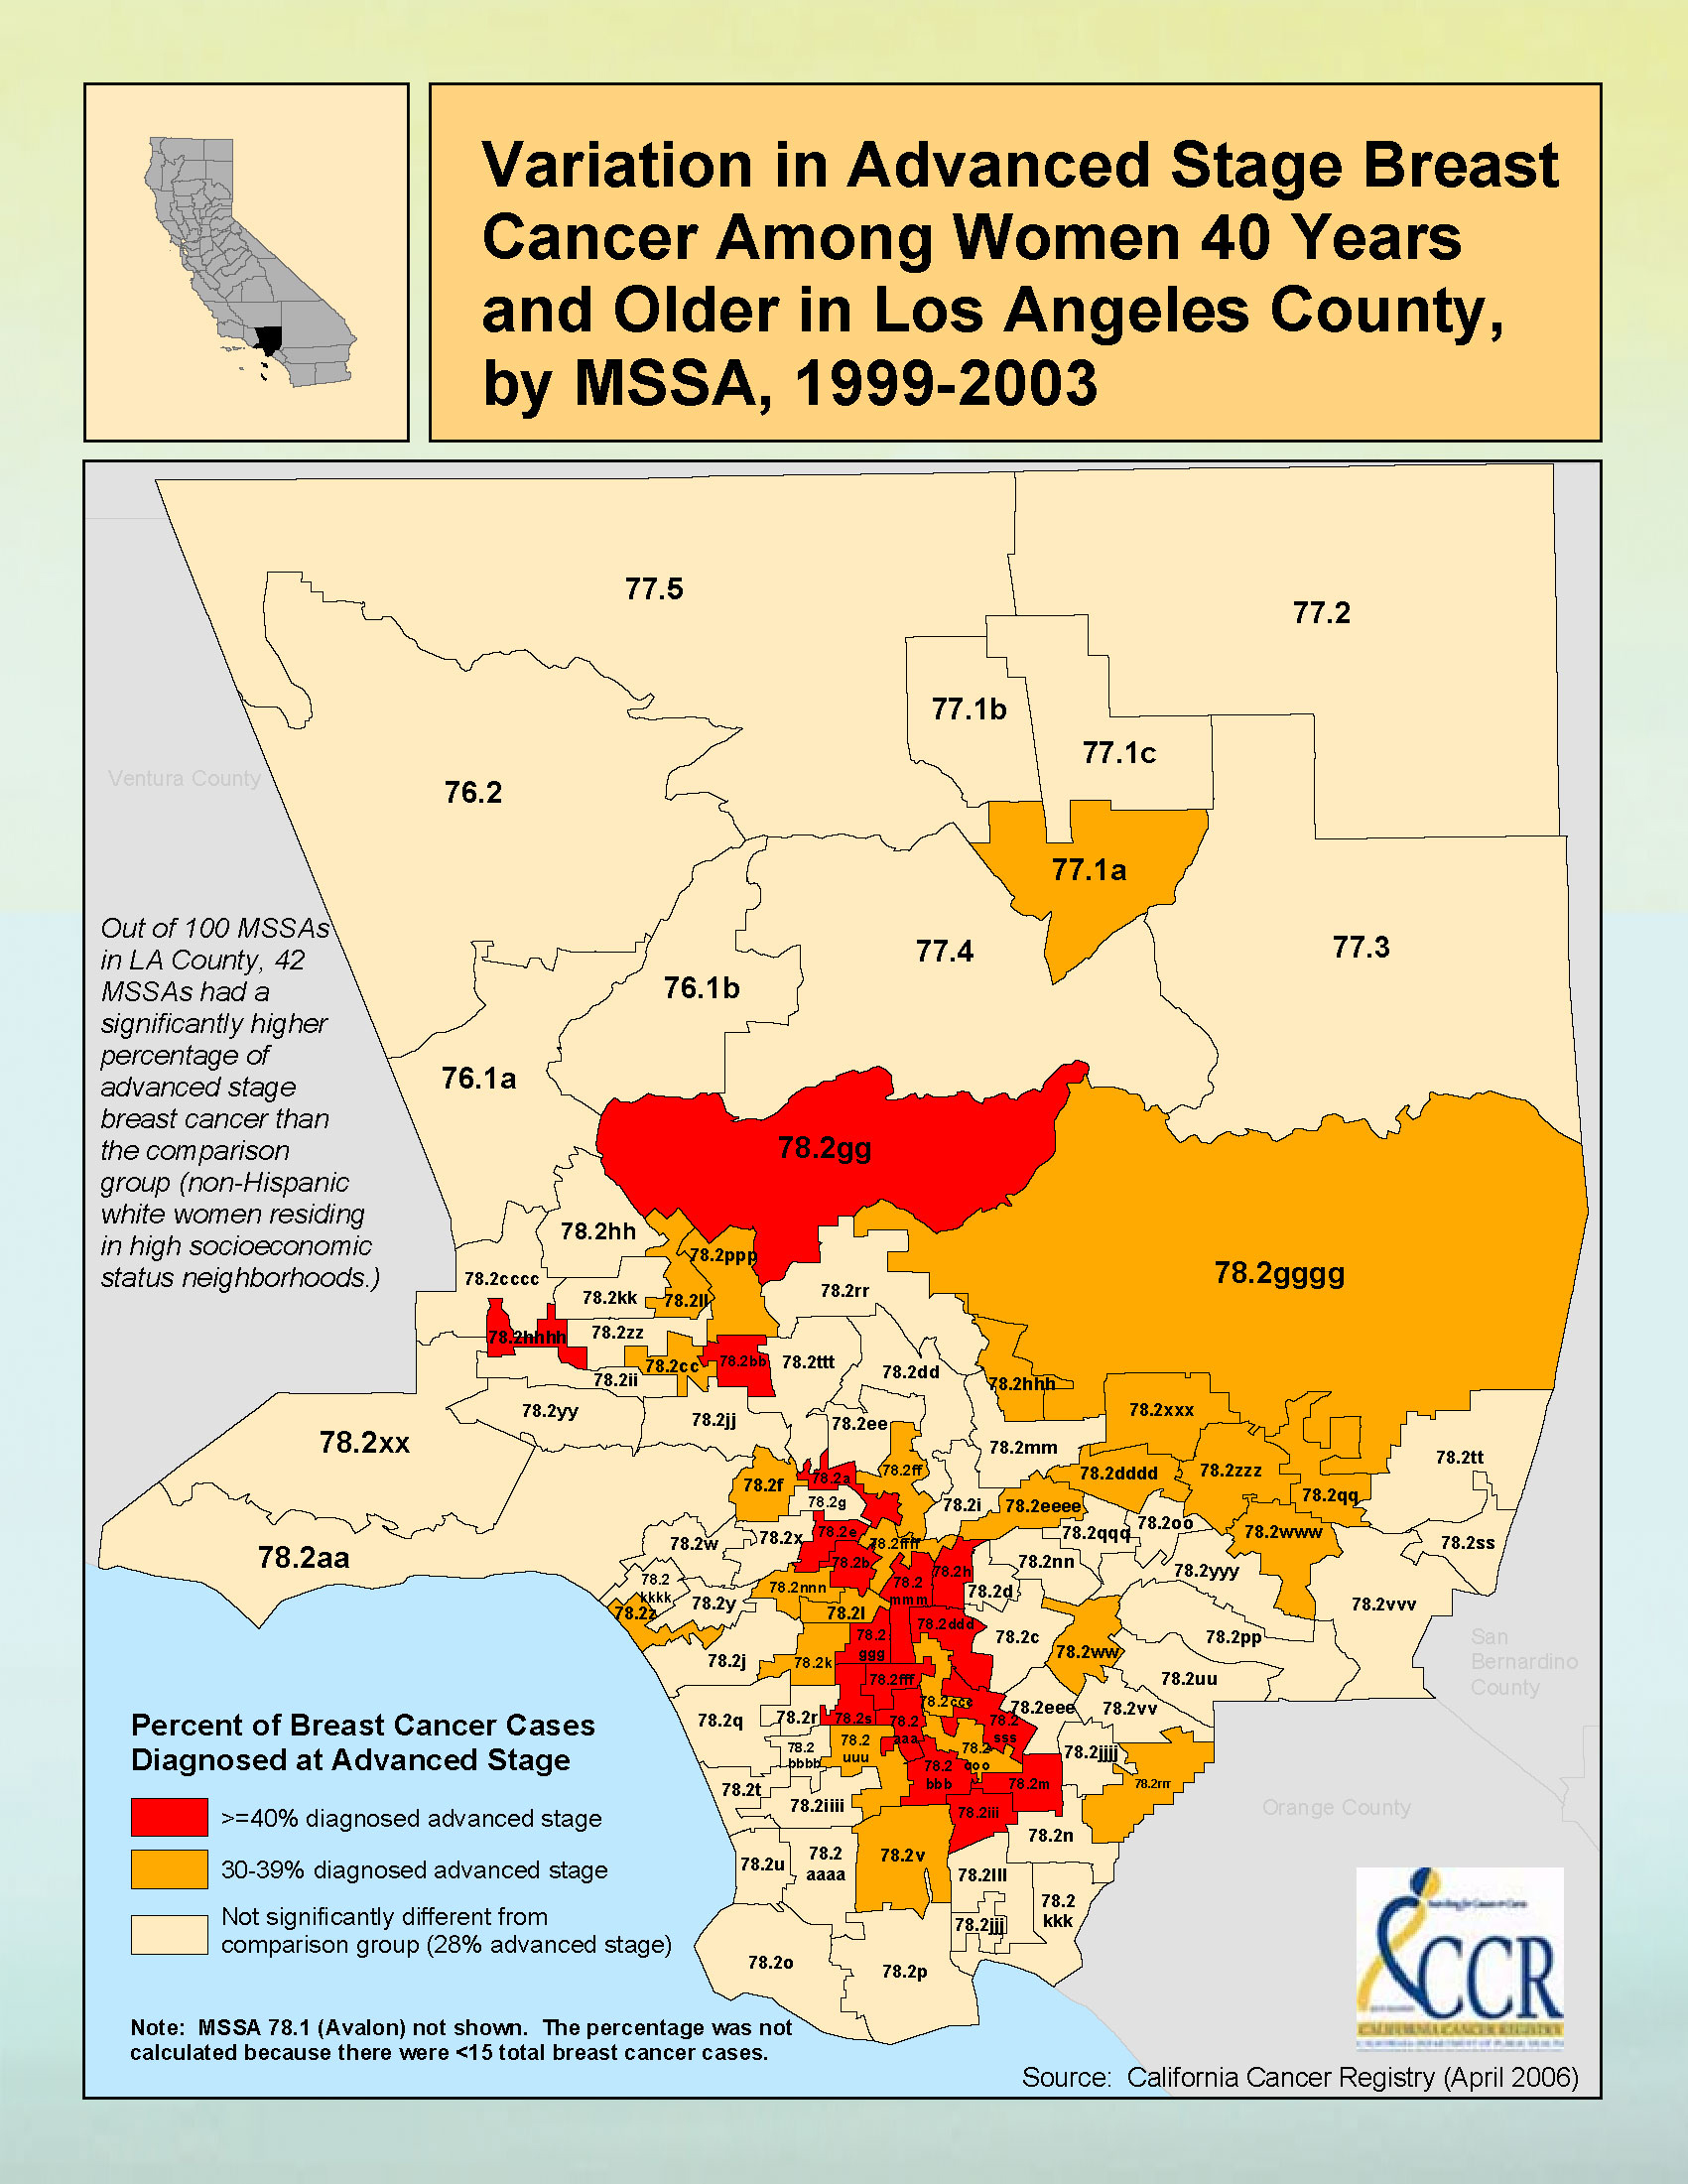
“Figure 2 gives an example of sub-county maps published by California Cancer registries. California is densely populated in many counties, and so the state has defined aggregations of census tracts for their maps. Some of California is in the SEER program; other parts have registries funded by the Centers for Disease Control (CDC).”
Figure 2. Breast cancer data for Los Angeles County.
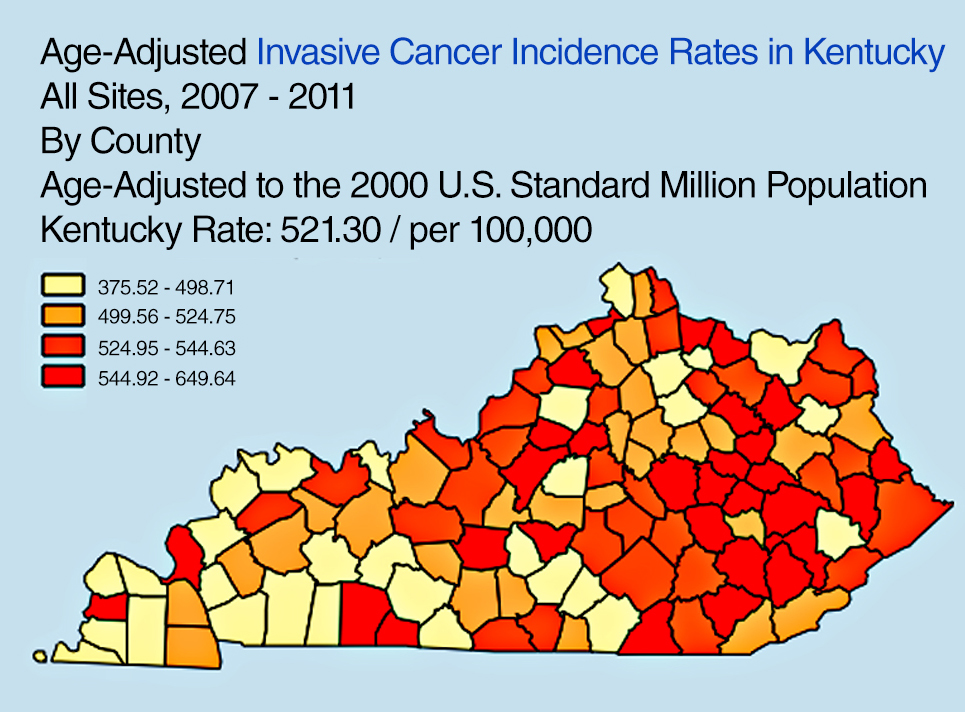
“Another state example: the Kentucky SEER registry has developed a useful online tool to explore Kentucky cancer patterns,” Pickle said. “See Figure 3. This design has been used by CDC for an online U.S. cancer atlas and by other states.”
Figure 3. Cancer incidence rates in Kentucky.
FURTHER READING
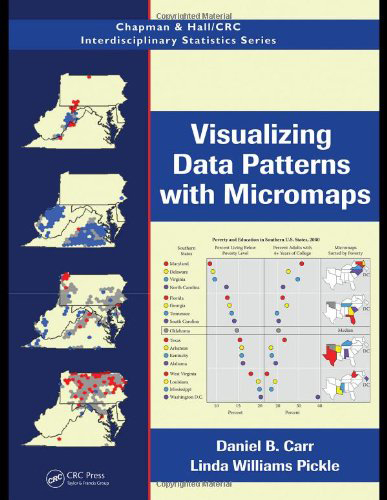
Visualizing Data Patterns with Micromaps By Daniel B. Carr and Lindia Williams Pickle
Cancer surveillance — an assessment of the number and type of cancer cases that occur in an area and in a specified population — provides critically important information needed for determining geographic variations in cancer rates and for planning cancer control intervention programs.
By Li Zhu, Linda W. Pickle, Zhaohui Zou, and James Cucinelli
This article is about projecting from the data that were available from surveillance/data-collection efforts to get estimates of the number of new cancer cases that would occur in the upcoming calendar year. That is, we used data from up to four years previous (because of the time it takes to find cases, process data, and so on) to get a current estimate of the number of cases.
We developed the statistical model to do this in 2006, then validated it, modifying the temporal projection method a few years ago. This method was then adopted by the American Cancer Society to produce the numbers of new cases published in their annual Cancer Facts & Figures reports, the most cited cancer reference in the world.
Since the models did not break out childhood cancers, we repeated the modeling process to do that, resulting in the paper cited here.
The method requires first a spatiotemporal prediction across the extensive years of data, since not all cancer registries have data for every year, and secondly a four-year temporal projection from the most current data point to the current calendar year. Here we use this same process applied only to childhood cancer data.
The generalized linear mixed effects model is applied to observed childhood cancer case counts reported to the North American Association of Central Cancer Registries over 1995– 2006 to predict case counts and incidence rates for every U.S. state and the U.S. total (for patients aged 0 to 19 and for major cancers among childhood). Covariates included in the model are measures of income, education, housing, urban/rural status, health insurance coverage, smoking, obesity, and cancer screening. Temporal trends and spatial distribution patterns are compared among childhood cancers for males and females.
Results. A total of 15,168 new cancer cases was projected for the 0–19 age group, with 10,032 childhood cancer cases younger than age 15, and 5,136 cases in the 15–19 age group, in the United States for 2010. There are more male cancer cases than female cases in all three age groups for most cancer sites. The order for the most common malignancies diagnosed in children differs by age group and sex. The study also identifies differences in the geograhic patterns at a small geographic area level by gender, and temporal trends by gender and subsites of childhood cancer incidence.
Conclusions. The resulting set of predictions provides annual estimates for states that did not provide data at all, and projections ahead in time to the current calendar year for every U.S. state and the United States in total. These projections fill in the data gaps for recent years of diagnosis and state registries to provide complete count and rate estimates for childhood cancers for all states, regions, and the U.S. in total for the current calendar year.
(The full article, “Trends and patterns of childhood cancer incidence in the United States, 1995–2010,” appears in Statistics and Its Interface, Volume 7 (2014), pp. 121-134.)
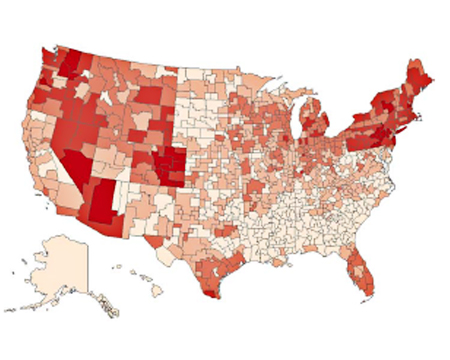
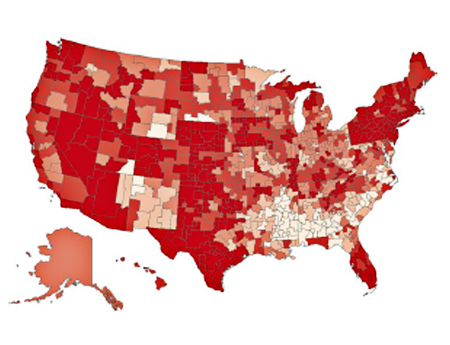
Figure 1. Rates, Ages 0–19 of All Childhood Cancers at HSA Level, 1995–2006, Female. From lightest to darkest: 10.0–14.5,14.6–15.5,15.6–16.5,16.6–17.5,17.6–22.2 per 100,00.Figure 2. Rates, Ages 0–19 of All Childhood Cancers at HSA Level, 1995–2006, Male;
Urban Sprawl, Obesity, and Cancer Mortality
Cross-Sectional Analysis and Methodological Challenges
By David Berrigan, Zaria Tatalovich, Linda W. Pickle, Reid Ewing, and Rachel Ballard-Barbash
Urban sprawl has the potential to influence cancer mortality via direct and indirect effects on obesity, access to health services, physical activity, transportation choices, and other correlates of sprawl and urbanization.
Methods. This paper presents a cross-sectional analysis of associations between urban sprawl and cancer mortality in urban and suburban counties of the United States.
A major focus of our analyses was to adequately account for spatial heterogeneity in mortality. Therefore, we fit a series of regression models, stratified by gender, successively testing for the presence of spatial heterogeneity. Our resulting models included county-level variables related to race, smoking, obesity, access to health services, insurance status, socioeconomic position, and broad geographic region, as well as a measure of urban sprawl and several interactions.
Results. Total cancer mortality rates were higher in less sprawling areas and contrary to our initial hypothesis; this was also true of obesity-related cancers in six of seven U.S. regions (census divisions) where there were statistically significant associations between the sprawl index and mortality. We also found significant interactions between region and urban sprawl for total and obesity-related cancer mortality in both sexes.
Conclusions. Despite higher levels of obesity in more sprawling counties in the U.S., mortality from obesity-related cancer was not greater in such counties. Identification of disparities in cancer mortality within and between geographic regions is an ongoing public health challenge and an opportunity for further analytical work identifying potential causes of these disparities. Future analyses of urban sprawl and health outcomes should consider exploring regional and international variation in associations between sprawl and health.
“Urban sprawl, obesity, and cancer mortality in the U.S.: cross-sectional analysis and methodological challenges,” in International Journal of Health Geographics, January 2014.)
GPS-Measured Physical Activity in Non-Small-Cell Lung Cancer
By C.L. Granger, L. Denehy, C.F. McDonald, L. Irving, R.A. Clark
Physical activity (PA) is increasingly recognized as an important outcome in non-small-cell lung cancer (NSCLC). We investigated PA using GPS, tracking individuals with NSCLC and similar-aged healthy individuals.
Methods. Fifty individuals with NSCLC and 35 similar-aged healthy individuals without cancer were included. Primary measures were triaxial accelerometery (steps/day) and GPS tracking (outdoor PA behavior). Secondary measures were questionnaires assessing depression, motivation to exercise, and environmental barriers to PA.
Results. Individuals with NSCLC engaged in significantly less PA than similar-aged healthy individuals and had higher levels of depression and lower motivation to exercise. Daily outdoor walking time and distance traveled away from home were not different between groups. Individuals with NSCLC spent less time outdoors in their local neighborhood area. A greater number of steps per day was seen in patients who were less depressed or had better access to nonresidential destinations such as shopping centers.
(The full article, “Physical Activity Measured Using Global Positioning System Tracking in Non-Small Cell Lung Cancer: An Observational Study,” appears in Integrative Cancer Therapies, July 2014.)
The U.S. Air Force’s fleet of GPS Block IIR and IIR-M satellites, manufactured by Lockheed Martin, have reached 200 collective years of operational life. Chip Eschenfelder of Lockheed Martin displays a model of one of the GPS IIR’s at the company’s booth at the ION GNSS+ Conference September 9-12 in Tampa, Florida.
Indoor location has become a hot topic, carrying the promise of ubiquitous location and user context. Set to take social networking, analytics, content targeting and enterprise efficiency applications to a new level, the technology hails from a high pedestal.
SiRFusion TM from CSR is a new, innovative and technically disruptive solution, combining multiple sources of information to create high quality and accurate indoor positioning, without the need for new infrastructure or site surveys. Join CSR’s experts in Indoor Location, Dave Huntingford and the CSR SiRFusion team, to learn how this innovative indoor location technology can create new revenue streams for you through accurate understanding of your customers’ location indoors. Webinar topics:
Commercial applications for indoor location
SiRFusion – solving the indoor challenge via fusion of multiple technologies, including WiFi, BT Smart, GNSS & MEMS
Challenges and solutions for Pedestrian Dead Reckoning & BT Smart beaconing
SiRFusion performance results in real world situations
Register now to learn how SiRFusion will enable new services, applications and social media for you.
Featured Speakers:
Dave Huntingford, Director of Product Management for Location, CSR
Dave Huntingford, Director of Product Management for Location, joined CSR in June 2009 via the acquisition of SiRF Technology, Inc. In his current position he is responsible for the indoor location product portfolio which includes managing the SiRFusion portfolio and the expansion of CSR location technology from GPS to GNSS, Hybrid and Sensor Fusion. Prior to joining CSR, Dave was Director of GPS Product Management at SiRF. Previous to that he was Global Product and Marketing Manager for Motorola GPS products where he introduced the world’s first single-die commercial GPS receiver.
Dimitri Rubin, Sr. Director of Emerging Technologies, CSR
Nicolas Graube, Fellow, Advanced Algorithms, CSR
Nicolas Graube is leading the advanced algorithms group in Technology Platform Engineering (TPE) at CSR. Directly reporting to the Chief Innovation Officer, this group is tasked to cover many aspects of algorithmic development, in particular, in-doors location technologies, present and future, contribution to the field of voice and music applied to the Automotive Market and IoT and their applications within the context of Smart Buildings. Expertise in the domain of system design and location specifically has been gained over a period of more than twenty years, starting at Cambridge EuroPARC in the early 90’s, using Olivetti’s Active Badges, then more recently providing Location Solutions in the Cellular domains (GSM,UMTS), and presently addressing in-doors challenges using both WiFi, Ble and Dead-Reckoning. Nicolas Graube has a Doctorate from Pierre et Marie Curie (Paris VI) University in Computer Sciences.
Degraded visibility — which encompasses diverse environmental conditions including severe weather, dust kicked up during takeoff and landing, and poor visual contrast among different parts of terrain — often puts both the safety and effectiveness of tactical helicopter operations at risk. Current sensor systems that can provide the necessary visualization through obscurants struggle with latency and are too large, heavy and power-intensive to comply with military rotary-wing operations.
The Defense Advanced Research Projects Agency‘s (DARPA’s) Multifunction RF (MFRF) program seeks to overcome these challenges and enhance the survivability and combat effectiveness of helicopters facing degraded visibility. The program aims to develop multifunction sensor technology that would enable sensor packages small, light and efficient enough for installation on existing and future helicopter designs. MFRF would enable pilots to:
Take off, fly and land safely in degraded and zero-visibility conditions
Avoid collisions with other aircraft, terrain and man-made obstacles (e.g. power lines)
Improve target detection, identification and engagement
MFRF completed successful flight demonstrations on a UH-60L Black Hawk combat helicopter (see video above) to demonstrate the Synthetic Vision Avionics Backbone (SVAB) technology portion of the program. The SVAB technology demonstration fused millimeter-wave radar with multiple terrain databases and onboard platform navigation to create high-resolution 2D and 3D visualizations of local environmental conditions.
Pilots referred to the visualizations in real time to distinguish terrain features (slope, roughness, landing suitability), detect objects in a landing zone, detect and avoid obstacles, and navigate in GPS-denied conditions. The software architecture of the SVAB also demonstrated plug-and-play sensor control and display.
“These successful tests take us closer to future cost-effective, ‘plug-and-play’ systems that would improve situational awareness and mission effectiveness for manned and unmanned platforms alike,” said Bruce Wallace, DARPA program manager.
Avenza Systems, producers of MAPublisher cartographic software for Adobe Illustrator and the PDF Maps mobile app, has released Geographic Imager 4.5 for Adobe Photoshop. The latest update is compatible with Adobe Photoshop Creative Cloud 2014 for both Windows and Mac. Also, the Geographic Imager panel has been refreshed to provide easier access to tools, image information and features.
“We’ve been working diligently on this release of Geographic Imager to allow users to work with their spatial imagery and data in Adobe Photoshop Creative Cloud 2014,” said Ted Florence, president of Avenza. “Geographic Imager is an excellent add-on to Photoshop and proves to be a competitive geospatial image editing platform for many GIS professionals in the industry. We’re looking forward to continuing to develop new tools for the Creative Cloud platform to improve productivity and to streamline workflows.”
Additional Geographic Imager 4.5 features
Compatible with Adobe Photoshop Creative Cloud 2014
Refreshed Geographic Imager panel for easier access to tools, image information and features
Various bug fixes and user experience enhancements
Geographic Imager is software for Adobe Photoshop that leverages its image editing capabilities and transforms it into a powerful geospatial production tool. Users can work with satellite imagery, aerial photography, orthophotos, and DEMs in GeoTIFF and other major GIS image formats using Adobe Photoshop features such as transparencies, filters, and image adjustments while maintaining georeferencing and support for hundreds of coordinate systems and projections.
Geographic Imager 4.5 is immediately available and free of charge to all Geographic Imager Maintenance Program members and at US$319 for non-maintenance upgrades. New fixed licenses start at US$699. Geographic Imager Basic licenses start at US$199. Academic, floating and volume license pricing are also available. Geographic Imager 4.5 is compatible with Adobe Photoshop CS5, CS5.1, CS6, CC and CC 2014.
MAPPS, the national association of private sector geospatial firms, has been selected as a member of a Federal Aviation Administration (FAA) working group on unmanned aircraft systems (UAS). MAPPS is the only representative of the geospatial, aerial survey, and remote-sensing community on the committee.
“As an association representing the many private sector businesses that are anxious to use unmanned aerial systems for commercial geospatial applications, we are honored to participate on this important committee,” said John Palatiello, MAPPS Executive Director, who will sit on the committee. “The geospatial community has been safely flying aircraft for decades and understands the safety implications of introducing a new technology in the national airspace. Our members see a great opportunity to utilize UAS to provide new geospatial data and applications benefiting the citizens of the United States.”
The Aviation Rulemaking Committee (ARC) Beyond Visual Line of Sight (BVLOS) user working group will hold its first meeting today. FAA has tasked the committee to provide input from users or potential users of UAS on immediate, near, and long-term issues for integrating UAS into the national airspace system.
The committee is co-chaired by Michael Toscano, Association for Unmanned Vehicle Systems International (AUVSI), Melissa Rudinger, Aircraft Owners and Pilots Association (AOPA), and Mark Reed, Air Line Pilots Association (ALPA). According to Jim Williams, Manager of the UAS Integration Office in FAA, the associations represent “a diverse group of potential UAS users in certain key industries, such as agriculture, mapping, photography, energy, public safety, cargo, communications, and others.
Palatiello has been MAPPS Executive Director since 1987. He was an original member of the federal government’s National Geospatial Advisory Committee (NGAC) and currently serves on the Virginia Geographic Information Network (VGIN) Advisory Board. He is president of John M. Palatiello & Associates, Inc., an association management and public affairs consulting firm, where he is a national government affairs consultant to the National Society of Professional Surveyors, Executive Director of the Maryland Society of Surveyors, and Administrator of the Council on Federal Procurement of Architectural & Engineering Services (COFPAES). Palatiello was named one of the ten most influential people in the geospatial community by Directions Magazine.
Bentley Systems, Inc., a company dedicated to providing comprehensive software solutions for sustaining infrastructure, has acquired Blueridge Analytics, provider of SITEOPS – a site design optimization “software at your service.” SITEOPS uses cloud-based computing techniques to empower site development professionals to move beyond engineering to “optioneering,” which enables the exploration of engineering alternatives and their costs. This substantially improves the choices considered for any site development, including commercial, industrial, institutional, campus, and residential projects.
Blueridge Analytics is based in Charlotte, North Carolina.
SITEOPS enables civil engineering professionals, real estate developers, and land planners to:
perform site configuration simulations that fully assess millions of layout, parking, grading, and drainage options for a site within hours instead of spending months evaluating a handful of options,
produce preliminary cost estimates and conceptual designs faster,
optimize site designs through advanced optioneering, and
minimize overall costs while ensuring engineering quality.
Users of SITEOPS include Stantec, Horrocks Engineers, Langan Engineering and Environmental Services, Timmons Group, and WSP.
“During the past few years we’ve been tracking SITEOPS technology and its performance in order to authoritatively validate its breakthrough capabilities,” Bentley Systems CEO Greg Bentley said. “Feedback we’ve received from engineering teams and owners has substantiated SITEOPS’ tremendous potential in enabling site development teams to deliver new value to owners. Through the power of site optioneering, owners can be confident that their engineers have considered the best choices and arrived at the most cost-effective solutions for the constraints of their respective sites. Hence, I’ve become convinced that site engineering should no longer be done any other way.”
“To date, the development of SITEOPS technology has focused on continuous improvement to conceptual designs,” said Mike Detwiler, formerly president and CEO of BLUERIDGE Analytics and now Bentley vice president of SITEOPS product development. “Now, within Bentley’s comprehensive portfolio, SITEOPS’ BIM advancement can contribute throughout project delivery. Accordingly, an initial priority will be to complete the end-to-end workflows that Bentley is uniquely able to offer — from site development through detailed design and construction modeling.”
Rugged handheld manufacturer Juniper Systems and Effigis, a geomatics solutions provider, have partnered to provide a powerful solution to capture and post-process GPS data to attain sub-meter accuracy.
Effigis’ OnPOZ Precision Positioning Software suite takes advantage of the superior GNSS performance of Juniper Systems’ Archer 2 rugged handheld to collect high-accuracy GPS data. First, EZTag CE software is used on the Archer 2 to capture GPS field data points. The data is then sent to a desktop computer, where EZSurvPost-Processing Software automatically post-processes the data to achieve results with sub-meter accuracy. EZSurv removes the hassle of post-processing, requiring the click of a button to run, the companies said.
Juniper Systems’ Archer 2 is ruggedized, enabling it to perform well as a data-collection tool in any environment, while the enhanced GNSS receiver provides a reliable signal, even in heavy tree canopy.
“Achieving sub-meter GPS accuracy typically has two barriers in people’s minds. One, the hardware and software are usually expensive. And two, the thought of post-processing makes a lot of people cringe. The OnPOZ suite, on the other hand, is powerful, yet comes at a price people are comfortable with, and it takes care of all the post-processing for you,” said Jim Benson, Utilities & Public Services Market Manager at Juniper Systems. “The Archer 2 handheld really finishes off the whole package. Its GNSS receiver is outstanding, performing reliably even under trees, and the handheld is so well designed, you can count on it to work well in any environment.”
To learn more about the Archer 2 and OnPOZ Precision Positioning Software suite, download the brochure.