Agency9, a provider of web-based 3D visualization solutions, announces support for 3D models and cities generated with Smart3DCapture from Acute3D. Municipalities, authorities, and private organizations can now use the photo-realistic 3D models in Agency9 CityPlanner to easily create web applications for planning, GIS, tourism and security, Agency9 said.
According to the announcement, Acute3D’s Smart3DCapture is a software solution enabling data providers and distributors to easily produce true-3D models of cities from aerial and terrestrial imagery, without any human intervention. Agency9 has streamlined a process to support large-scale 3D models from Acute3D Smart3DCapture for web deployment. CityPlanner users can easily edit the Smart3DCapture data, such as demolish buildings, modify terrain, export exerts of data, as well as upload vector data, images, 3D models in order to create stunning interactive illustrations for public consultation or exhibition phases in planning or tourist oriented applications.
“Agency9 has a vision to web enable any type of 3D terrain and city models in value adding applications. Agency9 is thrilled by the partnership with Acute3D and the potential it creates. Photorealistic 3D models are requested in many applications and Smart3DCapture is definitely one of the sharpest on the market. With CityPlannerOnline Agency9 uniquely offer data providers and users to publish Acute3D data online at a cost starting as low as 5,000 EUR per year without need to invest in IT infrastructure,” said Håkan Engman, CEO at Agency9.
“The interoperability of our Smart3DCapture solutions is a very important topic at Acute3D, and the partnership with Agency9 opens exciting perspectives in the diffusion of large 3D models through online applications,” said Jean-Philippe Pons, CEO at Acute3D.
Agency9 CityPlanner is a web-based service for 3D visualization of projects within urban development, infrastructure and energy. CityPlanner provides 3D web planning tools for widespread access and collaboration. It is created for urban planners, communicators, consultants and GIS technicians to easily create, share and publish project and spatial information from a normal web browser. CityPlanner is used by municipalities internationally in their daily work with master and local planning, also involving stakeholders and citizens in the planning process by enabling web publishing of 3D plan visualizations.
HERE, a Nokia business, has announced a complete Connected Driving offer, which will help car makers and in-vehicle technology suppliers connect the car and the driver to the cloud. The offering includes HERE Auto, HERE Auto Cloud, and HERE Auto Companion. In addition, HERE has radically improved its Traffic product, HERE Traffic, by building a new system to process data even faster and more accurately than before, Nokia said. The HERE Connected Driving offering will be demonstrated at the International Motor Show in Frankfurt, Germany, starting on September 10.
All major international car-makers are installing telematics units, sending a signal that wireless information and connectivity is here to stay in the vehicle, and location will be a big part of the growth. To learn more about the rapid changes in the connected vehicle field, tune in to our September 19 webinar, hosted by Wireless LBS editor Janice Partyka. Registration is free.
Technology is rapidly transforming driving, with connectivity bringing the outside world to the car and the sensor revolution creating new possibilities for the automobile industry, Nokia sai,d. People today demand that cars become integrated into their ecosystem of connected devices with the same level of innovation they see in their personal devices.
HERE Connected Driving offers a full range of automotive products and services that builds on our high-quality and fresh map to go beyond navigation. The customizable offering is a fully flexible framework that allows automakers to differentiate the driving experience. It will help them solve the problems that drivers face every day such as synching routes and other personal information across their car and devices and finding the right parking spot or closest gas station.
HERE Auto is the first embedded in-car navigation experience that delivers the right map at the right moment with and without a data connection. Drivers can get turn by turn voice guided navigation in 95 countries and 2D, 3D and satellite map views including street level imagery. In the future, car makers will be able to easily extend the HERE Auto experience using a software development kit (SDK) to create entertainment and other applications, such as in the areas of music and social networking. HERE Auto is already integrated in Continental’s next-generation Open Infotainment Platform. HERE is also working with partners such as Magneti Marelli and others to bring HERE Auto to the market in the coming months.
HERE Auto Cloud provides drivers with always-on access to several dynamic services such as real-time traffic updates, helping drivers avoid congested areas, road closures or blockages that occur en route. Drivers can also get recommendations on places to eat, parking spots, information on where to charge an electric vehicle or where to find the most inexpensive fuel.
HERE Auto Companion, a customizable mobile and web application, keeps drivers connected outside of the car allowing them to synchronize their favorite places and routes across their devices so that they won’t need to re-enter their route when they get in the driver’s seat. Car makers can tap assets from the existing HERE suite such as walking navigation, public transit routes and even indoor venue maps to build custom mobile applications. Drivers could use the app to remotely find their car with their device using LiveSight augmented reality technology and check the car’s vital stats such as fuel levels and tire pressure.
HERE Traffic has been radically improved by “Halo,” our new engine that processes data quickly and accurately. Every month we’re collecting ever greater numbers of high-quality data, such as probe points and sensor information to deliver real-time information such as weather, traffic congestion, road construction and other factors that affect a drive. With our new Traffic product drivers get improved travel time estimates, so they can better plan their routes and quickly re-route on the go.
“By 2016, the majority of consumers in mature markets will consider in-vehicle web-based data access a key criterion in their automotive purchase,” said Thilo Koslowski, VP of Automotive at Gartner. “Successful connected vehicle solutions will add value to the connected driver’s digital lifestyle and enable integrated cross-device experiences relevant for people everyday.”
GPSTrackit’s Fleet Manager Software now features an Analytics Dashboard that enables fleet managers to monitor and review fleet performance by reviewing historical data in a series of charts and graphs. Fleet Manager is a robust application providing fleet owners and managers with a comprehensive suite of integrated tools, GPSTrackIt said. The system delivers real-time GPS vehicle tracking, vehicle maintenance scheduling, and a wide range of alerts. The Analytics Dashboard brings to the system a new array of powerful and flexible capabilities.
“It puts the information fleet managers and owners need at their fingertips,” said Eddie Bermudez, GPSTrackIt’s product manager. “We already provide all the historical data via the reports system. This new feature brings that data to life with dynamic graphics.”
The dashboard displays up to six charts, which can be configured as bar charts or pie charts. Each chart can focus on particular issues important to fleet owners, managers and dispatchers: Idle Time, Drive Time, Stop Time, Speeding and Mileage.
“The charts can be configured to show data for all units or a single group,” explained Bermudez. “Or a chart can compare groups by displaying their data side-by-side using different colors.”
In addition, three composite charts are available; Engine Time, which monitors idle time and driving time; Driving Overview, which monitors idle time and driving time and stop time; Idle Stop, which monitors idle time and stop time. The time metric determines which historical data is used. Options available are week, month, quarter, and year.
“Charts can be rearranged on the dashboard by dragging and dropping,” added Bermudez. “And there are several additional options that can be configured. Chart labels of up to 25 characters can be added. The start of day can be set to any of the 24 hours. For bar charts, the average value can be shown superimposed on the graph.”
Bermudez continues, “The Analytics Dashboard can also display the highest or lowest values for a given graph. This can be configured to show values from one to 20. Selecting Highest and a numerical value of five on an Idle Time chart, for example, displays the five vehicles with the highest values for idle time.”
“This is important for fleet managers to know because of added fuel consumption, as well as vehicle wear,” according to Bermudez. ”Selecting Lowest and a numerical value of ten on a Speeding chart shows the ten vehicles with the lowest incidence of speeding.”
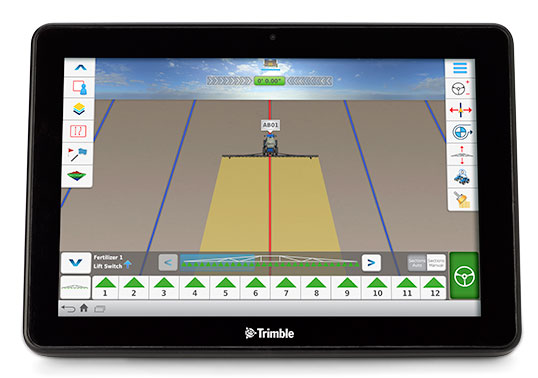
Trimble has launched the Connected Farm dashboard, which provides one centralized location for farmers to view key information impacting their operations. With this information, farmers will be able to make better daily decisions based on the latest data. The Connected Farm dashboard is customizable and accessible via Internet-enabled devices such as desktop and notebook personal computers, smartphones and tablets, and Trimble’s new TMX-2050 display.
Trimble TMX-2050 display.
The TMX-2050 display is a next-generation display built on the Android operating system. It offers an intuitive interface that enables farmers to easily implement precision agriculture solutions as their business grows. Its flexible software platform improves the ability for a customer to seamlessly add applications to their operations while the modular architecture allows for future expandability.
The TMX-2050 display is an addition to Trimble’s existing line of guidance displays, which include the EZ-Guide 250 lightbar guidance system, CFX-750 display, and FmX integrated display.
The Connected Farm dashboard will allow farmers to:
Check daily rainfall totals for each virtual rain gauge—without the use of physical rain gauges. (Made possible by Trimble’s acquisition of RainWave’s assets). This will allow a farmer to reprogram his irrigation system based on the previous evening’s rainfall, optimizing the use of water.
View the weather forecast weekly, daily, or hourly for a given location including temperature, humidity, chance of precipitation and wind speed. For example, wind speed will allow a farmer to plan when to spray a given field.
Set up a Doppler radar map to show upcoming weather patterns for their area. This will allow a farmer to assess in real time whether or not to continue with a current activity.
Check the latest commodity prices. Farmers will be able to select the commodities that matter to them and list them based on personal priority.
View farming operations data. For example, if the farmer is viewing yesterday’s planting activities, the dashboard may show population, singulation, skips and doubles.
Monitor a fleet by tracking the location and status of vehicles and receive geo-fence and curfew alerts. Farmers also can link through to Trimble’s new Connected Farm fleet app to add landmarks or for turn-by-turn directions to locate vehicles from their current position, and view historical positions.
View a boundaries map created with Trimble’s Connected Farm scout app.
Following the completion of the recently announced IQ Irrigation asset acquisition, irrigation pivot data is expected to be available on the Connected Farm dashboard in New Zealand in the fourth quarter of 2013 and the U.S. in the first half of 2014.
“With the Connected Farm dashboard, farmers can quickly see a snapshot view of their latest field operation as well as key information that may impact today’s activities such as rainfall, commodities, and the day’s weather forecast,” said Joe Denniston, vice president for Trimble’s Agriculture Division. “With this information available in one convenient central location through Connected Farm, farmers can access the information they need to make the best daily decisions about their farm. Since the dashboard can be accessed from Internet-enabled devices, farmers can make these decisions from potentially any location at any time.”
The Connected Farm dashboard is a free web portal and is currently available. To view rainfall totals, monitor pivot irrigators (when available), or for fleet management, customers will need to purchase these services.
On August 27, Trimble acquired the assets of privately-held RainWave, LLC and Hydro-Engineering Solutions, LLC of Auburn, Alabama. The acquisitions will help to extend the monitoring and reporting capabilities of Trimble’s Connected Farm solution and strengthen its water management expertise. Financial terms were not disclosed.
RainWave provides precipitation monitoring services for agribusiness, construction and engineering, government and consumer industries. RainWave will be part of the Connected Farm solution, which simplifies and integrates operations management by providing information exchange across the entire farm. This RainWave service will provide farmers across the U.S. with vital rainfall data they can use to better manage their crop production.
Using RainWave, farmers can set up a virtual rain gauge by entering GPS coordinates for identified locations to receive a rainfall report for those locations. Since on-site rain gauges are not needed, farmers no longer need to monitor dispersed gauges or manually track precipitation. The farmer will now be able to obtain this rainfall information through their Connected Farm dashboard. RainWave’s convenient, accurate rainfall information allows farmers to make better management decisions by optimizing irrigation plans and application timing, and comparing yield against rainfall to plan for next season’s crop. This results in savings of time and water usage.
Hydro-Engineering Solutions is a civil engineering company that specializes in hydrology and hydraulics. The company provides high-quality engineering services to federal, state and local governments as well as commercial entities, and has extensive experience with streams and rivers. Hydro-Engineering’s expertise in hydrology and hydraulics modeling is expected to strengthen Trimble’s water management solution in watershed analysis for both drainage and irrigation.
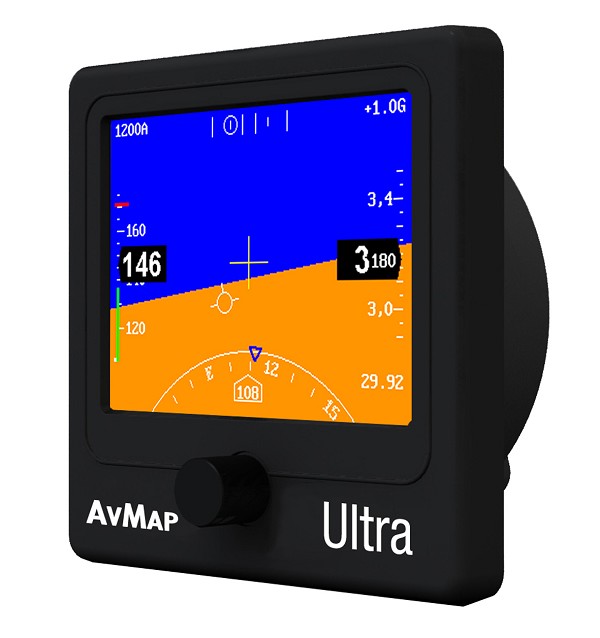
AvMap, the Italian manufacturer of GPS since 1994, presents the Ultra EFIS, a stand-alone unit providing air data, attitude, heading and altitude reference for flights.
The AvMap Ultra EFIS is a stand-alone device with a 3.5-inch ultra bright, sunlight readable LCD display. The unit is compact (1.95 inches / 49.5 millimeters installing depth) and ultra-light (5.1 oz / 145 g) compared to other products on the market (around 1 lb 9 oz / 700 g.).
Fitting in a standard 84 millimeters (3.3-inch) panel hole, the AvMap Ultra EFIS can be installed in a panel and be connected to the GPS receiver (included) and to the aircraft Pitot-static system to provide reliable and advanced ADAHRS.
Designed for light-sport, ultra light and experimental aircrafts, the AvMap Ultra EFIS contains solid-state gyros, accelerometers, magnetic field sensors, air data sensors and UAV Navigation motion processor, the outcome of more than eight years of motion and flight control experience at UAV Navigation.
“AvMap products range is extending beyond navigation to include more and more avionic tools with the objective to provide a complete AvMap Glass Cockpit system. To this purpose we are selecting the best partners in the market to work with, such as UAV Navigation,” said Simone Lazzarini, CEO at AvMap.
AvMap Ultra EFIS is the second product developed in collaboration with UAV Navigation, after the A2 ADAHRS module launched this April.
AvMap can stand alone or be integrated with EKP V. According to cockpit space availability and navigation needs, users can choose two displays or one device. The Ultra EFIS is the stand-alone solution for panel mounting; otherwise, for those who already own an EKP V, users may consider buying the A2 ADAHRS module to be used together with the cockpit docking station to complete the AvMap EFIS set. The A2 ADAHRS module extends the functionalities of the EKP V Aeronautical Navigator bringing attitude and airspeed to the moving map and converting it into a centralized Glass Cockpit System for both navigation and primary flight display.
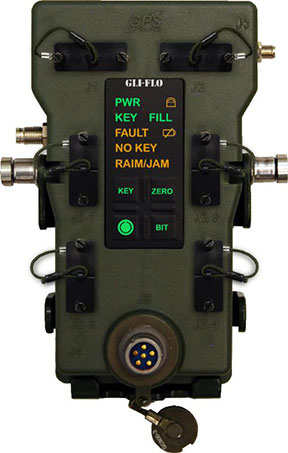
GPS Source has received an indefinite-delivery/indefinite-quantity, firm-fixed-price contract with a maximum value of $16,613,430 for the procurement of defense advanced global positioning system receiver distributed devices (D3). The Army Contracting Command, Aberdeen Proving Ground, Md., was the contracting activity (W15P7T-13-D-C116).
GLI-FLO was developed by the defense contract engineering firm, GPS Source. GLI-FLO is a DAGR Distributed Device (D3) that can replace the position, navigation and timing (PNT) role currently required of the DAGR or other GB-GRAM devices inside a fixed vehicle platform. Designed as a single, secure access point to multiple devices requiring PNT data on a fixed vehicle platform, it saves space, weight and power (SWaP).
“The GLI-FLO contract award is an important milestone in GPS Source’s initiative for the defense market,” said Robert Horton, CEO of GPS Source. “Getting this award was a complicated process, but it helps fulfill our vision of continual innovation in GNSS Signal Availability, especially for the warfighter. We look forward to continuing to provide manufacturing and engineering support services to the Department of Defense.”
Breaking Defense is reporting that DigitalGlobe has requested that the National Oceanic and Atmospheric Administration (NOAA) relax the 41-cm limit currently in place.
Walter Scott, DigitalGlobe’s founder and now executive VP and chief technical officer, tells Breaking Defense there is “significant demand” for quarter-meter resolution from the international market. And that’s why the company applied for a change to the resolution they can be licensed for from half a meter to a quarter meter.
NOAA is responsible for managing remote sensing satellite licenses in the U.S. View the Commercial Remote Sensing Regulatory Affairs website here.
Current NOAA license holders (per NOAA website) are listed below:
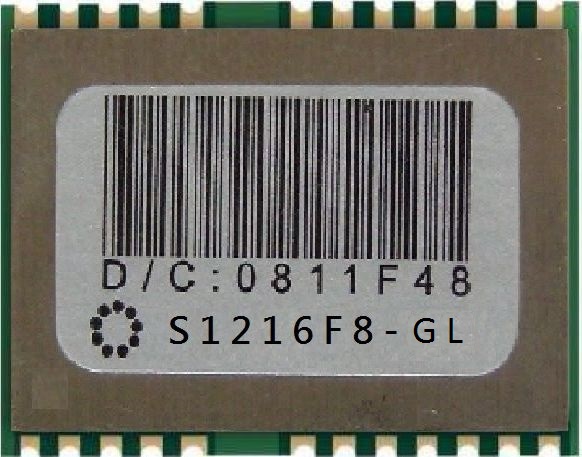
SkyTraq Technology, Inc., a fabless GNSS positioning technology company, has introduced its fast consumer-grade 50-Hz update rate S1216F8 GPS receiver module. The module supports GPS, QZSS, WAAS, EGNOS, MSAS, and GAGAN satellite signal reception. The S1216F8 receiver is based on SkyTraq’s newest 55-nm Venus 8 GPS/GNSS chipset.
The Venus 8 is a low-cost commercial GPS/GNSS chipset incorporating an IEEE-754 compliant FPU. With RISC/FPU running at 100 MHz, the S1216F8 GPS receiver module has industry leading 50-Hz update rate, very fast and accurate position/speed response, suitable for UAV, RC plane flight logging, and high-performance race car or speed boat data logging applications. When running at lower 1 Hz, 5 Hz, or 10 Hz update rate, the S1216F8 receiver can be used as a typical GPS receiver module currently available on the market.
The S1216F8 GPS receiver module measures 12mm x 16mm and consumes 26mA @ 3.3V during continuous navigation at 50-Hz update rate.
The S1216F8 is among SkyTraq’s S1216 family of form factor compatible, high-performance, low-cost GNSS modules. The S1216F8-GL GLONASS/GPS module and S1216F8-BD Beidou/GPS module both have a 20-Hz update rate.
The S1216 family of 50-Hz GPS, 20-Hz GLONASS/GPS, and 20-Hz Beidou/GPS receiver modules are in production. Datasheet, engineering sample, evaluation kit and reference design are available.
Swiss-based u-blox has been chosen by Leica Camera as provider of GPS technology for its premium M-System camera and accessory series.
Leica, which makes high-end and professional cameras, has integrated u-blox’ NEO GPS module into its new Multifunctional Handgrip M. The geotagging feature injects location data directly into each photo’s Exif header (Exchangeable image file format), allowing photos to be filed and retrieved according to where they were taken. The accessory is compatible with the new flagship Leica-M rangefinder digital camera series.
The Multifunction Handgrip M connects directly to a computer via an integrated USB socket, allowing full remote control of the camera and image access using the Leica Image Shuttle software package. The handgrip also facilitates the safe and steady handling of the camera, particularly when shooting with heavier telephoto lenses.
The handgrip’s features include a supplementary flash connector, a socket for an external power supply, and a sync socket for studio flash systems. An optional supplementary power source is also available.
“Leica focuses on providing the highest quality photographic equipment on the market,” said Stefan Daniel, director of product management at Leica Camera.“When a customer purchases a Leica, they realize they are making an investment in a robust, high-performance camera that delivers outstanding results. To meet these expectations, we design with only the best mechanics, optics and electronics. For global positioning, we chose u-blox.”
“We are proud to have been selected for our GPS technology by such a prestigious brand as Leica,” said Jochen Steinhauer, u-blox sales manager. “When you pick up a Leica camera, you immediately see and feel the high quality of every component. It is designed for perfection, a philosophy that u-blox also follows in our design of the world’s highest-quality global positioning modules.”
Watch EarthCam’s time-lapse movie of the construction progress for one of the largest ARRA (American Recovery and Restoration Act) funded projects in our nation’s history.
More than 42,000 hours of construction can be seen in just four minutes with the release of EarthCam’s official time-lapse movie for the San Francisco-Oakland Bay Bridge. After many years of construction to retrofit and transform the Bay Bridge, project teams and contractors will be celebrating all of their hard work at the opening of the updated bridge today, September 3.
The Metropolitan Transportation Commission (MTC) relied on 12 EarthCam construction cameras to document progress for the $6.4 billion bridge. In 2008, EarthCam installed a combination of live streaming video cameras and high definition time-lapse systems, all carefully documenting progress from several unique perspectives. Strategically located on the project site, each camera captured a specific view of the progress, archiving footage from 42 preset angles. During the life of the project, views of progress, as well as important information about construction-related lane closures, were made available on the Webby award-winning public web page.
EarthCam’s construction cameras captured nearly six years of progress, a powerful testament to the hard-working and dedicated bridge teams. The EarthCam Time-Lapse Production Team pored over the staggering number of images captured over the past 59 months and spent months hand-editing the archived imagery into a professional time-lapse movie.
Esri announced in a blog post that they have released an Android-based mapping app, based built entirely on the ArcGIS Runtime SDK for Android V 10.1.1, to the open source community.
Today we are proud to announce the app has been released to the open source community on Github. There have been some design changes and updates to the app since it’s debut including some of the following:
Portal API to populate a gridview with basemaps available to change in the map
And there is more to come. We encourage developers to collaborate with us as we use Github to continue developing this app together with our developer community. Anyone and everyone are welcome to contribute. We will review/accept pull requests, submit/fix issues, & use milestones for updates. Four things you can do now include:
GeoSpatial Innovations, Inc. (GSI) has released a cloud-based line design software tool for electric utility companies, GSI Designer, which it says will support seamless data collection and integration while limiting time and costs.
GSI Designer addresses the challenges of manual line design using GPS technologies on rugged mobile hardware to maintain and extend overhead and underground electric lines. It is altering traditional steps, such as tape measurements, fighting through difficult environments and dual entry of collected data.
“Implementing GSI Designer on the cloud cuts out many of the manual steps utility companies have to take in the line design process,” Carl Livingood, president of GSI, said. “The transition from paper to digital is important for our industry to embrace in order to remain profitable and efficiently improve services for our customers.”
This Software as a Service model is trending in the utility industry and offers scalable, affordable solutions for data collection and storage. “It alleviates back-end server maintenance and IT resources,” said Michael Hamsa, chief technology officer of GSI. “This allows smaller utilities to take advantage of high-end software solutions that will save them money in the long-run.”