Rohde & Schwarz and 7Layers have verified and validated the synchronized test approach to determine the Envelope Correlation Coefficient (ECC), a value characterizing the antenna subsystem of multiple-input and multiple-output (MIMO) LTE devices. The Synchronized ECC approach delivers significantly shorter test durations and repeatable results, ultimately resulting in reduced costs. Long term, this collaboration will also help product manufacturers develop devices that achieve greater data speeds over LTE by using highly optimized MIMO antenna configurations, the companies said.
The Synchronized ECC approach involves over-the-air transfer of measured data between the test platform and a mobile device in a synchronized fashion. This method, proposed by a leading U.S. wireless carrier, does not require any overhead or user interaction to calculate the ECC, making it easier and faster to execute test versus other approaches. 7Layers test engineers used the Rohde & Schwarz TS8991 OTA Performance Test System and software option R&S AMS32-K30 as a test platform for validation.
”7Layers is excited to help bring an ecosystem of vendors together to advance testing of LTE enabled devices utilizing MIMO,” commented Mahesh Kodukula, business development manager of 7Layers. ”As an accredited test laboratory, we provided a realistic test environment for our partners.”
”We are pleased to enable this type of testing on our R&S TS8991 OTA test platform and to offer this functionality to a variety of customers that have been waiting for this feature,” said Thorsten Hertel, OTA product specialist at Rohde & Schwarz. ”We strive to meet the industry needs of the leading edge development of LTE devices.”
Visit Rohde & Schwarz at CTIA 2013, May 21 23 at booth 4148 in the Sands Expo and Convention Center, Las Vegas, NV.
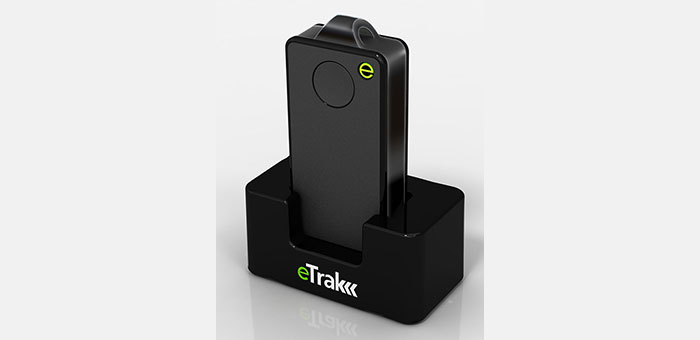
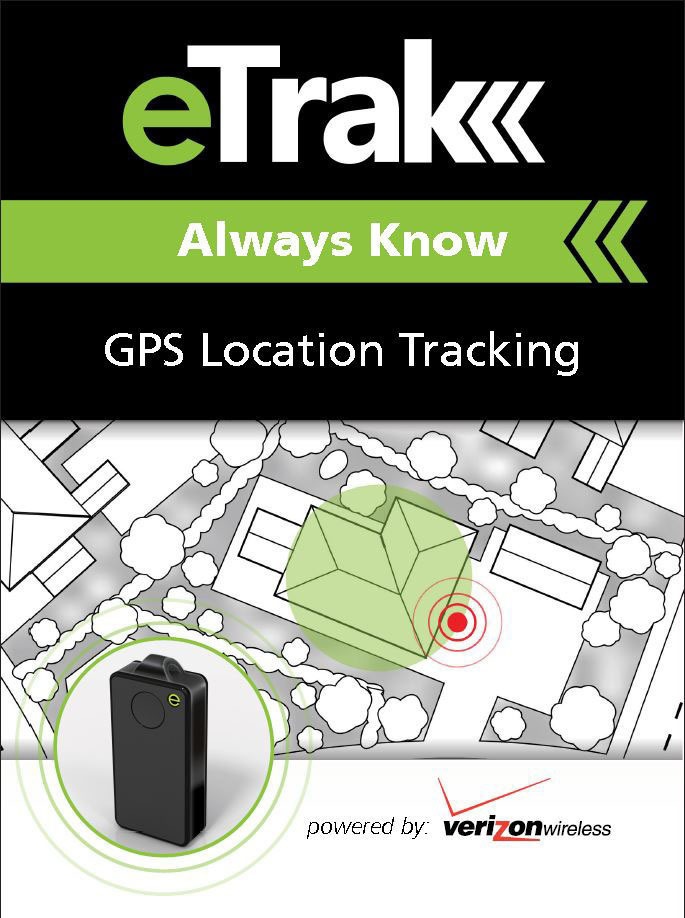
eTrak has released its GPS+ line of consumer and commercial tracking products. GPS+ is eTrak’s patent-pending technology that integrates Wi-Fi, cellular triangulation and GPS to achieve the most accurate positioning possible, both indoors and out, eTrak said.
GPS+ delivers accurate location in real time directly to a smartphone, tablet or computer. eTrak products also contain geofencing capability, which triggers notifications if the device goes beyond preset boundaries. Additionally, the notifications provide a map and address with the location of the device.
“Small and large businesses will benefit from tracking their assets with loss prevention and cost savings,” said eTrak CEO, John Harris. “They will also be able to keep their employees safe and know if they are in danger or need assistance.”
Set-up and the use of eTrak products is simple, the company said. Users can go to eTrak.com and start tracking from any smartphone, tablet or computer and instantly see the location of the eTrak device. The eTrak consumer device is also equipped with an emergency panic button that sends help requests to predetermined recipients in the event of an emergency.
“eTrak is the size of a domino and weighs less than an ounce,” Harris said. “eTrak provides the longest battery life available, and is a low cost personal emergency-response product. And with Verizon’s industry-leading coverage map, it works almost anywhere.”
The eTrak product line encompasses commercial applications, as well as consumer segments including health-impaired, special needs, teens and pets. eTrak also supplies custom design and development services.
GreenRoad, a driver performance management company, has announced new features including RFID-based driver identification; real-time email alerts; and an enhanced interface for GreenRoad Smartphone Edition.
GreenRoad’s new RFID feature automates driver association with trips by detecting when a driver boards a vehicle, eliminating the need for drivers to log on with a Dallas key.
One customer, Big Bus Tours, operator of open-top sightseeing tours, has starting using RFID in its fleet of open top tour buses in London, Washington, D.C., and San Francisco, with Dubai and Abu Dhabi soon to follow. Gerry Price, group commercial director, said, “GreenRoad has enhanced driver performance and cut risk in our bus fleet across the world, as well as improving the customer experience for thousands of sightseers. Now with RFID it is even easier for our drivers to use GreenRoad.”
GreenRoad Smartphone Edition has been enhanced with Facebook integration that allows drivers to share their achievements with friends. GreenRoad Smartphone Edition, code named “Asimov,” uses smartphone native functionality, including GPS and built-in accelerometers, to eliminate the need for a professionally installed telematics device in the vehicle.
A new version of GreenRoad Central, the software at the heart of the GreenRoad service, includes real-time alerts for exception events, including high-risk events in all driver behavior categories as well as speed violations. In addition to receiving email alerts in real-time, managers can view their alerts on a To Do list through GreenRoad Central.
F4Devices, a division of F4 Tech, is partnering with Laser Technology, Inc. (LTI). F4Devices will provide LTI with a custom version of its Flint handheld for use as a controller and data collector for its mobile GIS lasers as well as public safety divisions. This custom version of the Flint S-Series rugged handheld is available through the current LTI distribution channel. It will be branded under BAP Precision. BAP and F4Devices are strategic partners in rugged mobile computing development.
“We are excited and thankful for the opportunity to partner with LTI, a strong and respected leader in field laser data collection,” said Mark Milligan, president of F4 Tech. “The S-Series offers a cost effective solution that compliments the current product offerings.”
“Our product management team approached F4 Tech about a data collector solution, and they were quick to respond. The S-Series provides LTI with an ergonomic, rugged and reliable handheld unit for our Professional Measurement and Traffic Safety software solutions. We are excited to bring this solution to our customers,”said Derrick Reish, senior product manager of LTI.
Blue Marble Geographics announces the release of Global Mapper version 14.2. This update to the company’s desktop GIS software offers many new and improved features and functions. Some of the major improvements include several scripting updates, improved Volume Measurement tools, new right-click option to the vector data Search dialog, many LiDAR enhancements and of course many new formats. Blue Marble’s geospatial data manipulation, visualization and conversion solutions are used worldwide by thousands of GIS analysts at software, oil and gas, mining, civil engineering, surveying, and technology companies, as well as governmental and university organizations.
According to the announcement, the Global Mapper 14.2 release introduces many scripting updates and additions, including support for calculating attributes, splitting layers, interactively prompting users for files and folders, to name just a few. Global Mapper is a great tool for behind the scenes processing, whether it is simply batch data conversion or complex extract, transform and load processes such as attribute or geometry merging, clipping or editing. Users can find scripting samples with Global Mapper documentation, with the ability to edit and create them in any text editor. To make this work more easily, Global Mapper workspace files also can be saved as scripts.
The company reports that the 14.2 release also includes many LiDAR enhancements such as search by elevations and the ability to color by return value, which allows users to easily see when there are multiple return values. This feature is excellent for performing vegetation analysis. There are also new point loading slider bar and reporting tools for point cloud density. 14.2 also has improved import and export options as well as support for exporting point clouds to DXF and DWG format files. 14.2 also introduces support for the new MrSID format files and exporting XYZI (XYZ + Intensity) files, typically from LiDAR data.
“Certainly we are focused on continuing to expand our support for LiDAR and more geospatial formats,” stated Blue Marble President Patrick Cunningham. “But this release has some great new scripting capabilities and we like to remind our users that Global Mapper is a powerful extract, transform and load tool as well.”
In an ambitious geospatial project, San Jose State University and local non-profit Garden to Table joined forces to connect families in need with excess local produce. This urban-forestry-meets-agriculture project enabled the group to more than double its collection and distribution of fresh produce, feeding the hungry with fruits grown locally in private yards and gardens.
Food security is a growing social and economic challenge that knows no political boundaries. Even in the United States, an astonishing 18 million households were labeled “food insecure” in 2011 because they lacked the means at some point during the year to feed all of their members. The negative impacts of food insecurity can range from poor academic performance and rising healthcare costs to increased crime and social unrest.
San Jose State University (SJSU) in California has teamed with Trimble Navigation Ltd. to deploy a high-tech solution that enhances the local community’s ability to put fresh food on the tables of families in need. Leveraging a variety of web-based GIS, geospatial, and mobile GPS technologies, the solution makes it easier for local organizations to manage productive forestry and agriculture programs in the urban setting.
Garden to Table volunteer collects fruit tree data with the Trimble Juno handheld.
“Bringing food production back into our cities and suburbs has significant environmental, economic and social benefits,” said Hilary Nixon, associate professor in the SJSU Department of Urban and Regional Planning. “A healthier community is one of those benefits.”
SJSU and the City of San Jose have jointly formed an organization they call CommUniverCity that brings together students, faculty, city staff and members of the local community to assist nearby neighborhoods in a variety of initiatives. One of these is Garden to Table, which deployed the Trimble Urban Forestry solution to feed the hungry with fruits grown locally in private yards and gardens.
Because of the increased efficiencies achieved by superior data collection and organization, Garden to Table was able to halve the amount of time it took to catalog, organize, and map Central San Jose’s Fruit Trees, leading to more time in the field, and a projected increase of 100 percent more fruit in 2013, or roughly 25,000 pounds. Plans call for all of the fruit being delivered to families within a couple of miles of where it is grown.
Greater consumption of locally grown healthy foods isn’t the only advantage of improved urban forestry, explained Nixon. She believes the same technology used by SJSU and Garden to Table to feed the needy in San Jose can be used by local governments to better manage trees in public spaces along residential streets and in city parks, further contributing to a healthier community.
Gathering Leftover Fruit
The mild climate and generous rainfall in San Jose are ideal for fruit trees, many of which were planted decades ago on residential properties. Now mature, these trees typically yield more citrus and stone fruits than one household can possibly consume, the remainder often rotting on the branches or on the ground. Concerned by the fact that much of fruit went to waste, an informal group called Neighborhood Fruit Pickers sought permission of property owners to glean the excess for distribution to food banks.
Garden to Table offered to support the Pickers in 2011 seeing an opportunity to leverage the university’s GIS resources to make the urban harvesting process more productive, said Zach Lewis, Garden to Table’s project coordinator and a graduate student in SJSU’s Urban Planning Department.
“We started mapping the fruit trees with pen and paper, walking the streets and collecting data—address, tree type, productivity and size,” said Lewis. “Then I would geocode the data and drop it into the GIS…that was incredibly time and labor intensive.”
Although the City of San Jose shared up-to-date parcel layers from its GIS for the university to use in its own ArcGIS system, the field data collection proved to be a flaw in overall efficiency. Not only was field work time consuming, mistakes were being made both in inconsistent data collection and in the entry of field notes into the GIS back on campus. These notes included hand-written location coordinates for each tree captured in the field with a simple hand-held GPS unit.
Despite these issues, Lewis and fellow volunteers mapped 930 trees on private properties within a mile radius of campus in the first year. Personnel time in the field and at the keyboard totaled more than 300 hours. Although the mapping and subsequent GIS analysis helped improve efficiency of the harvests, Lewis and Nixon saw potential in further automating
the process.
With close ties to SJSU, Trimble developed a three-part solution with a mobile GIS for data collection, a back-office application for geospatial data analysis, and a tree canopy monitoring segment for long- term planning.
More Efficient Tree Mapping
To create an integrated solution, participants contacted Cengea, a Trimble company in Vancouver, Canada, which offers a data management and visualization package specifically for forestry. This solution, called Cengea Forest, needed only minor customization to provide both mobile field and back-office analysis functionality for Garden to Table. The solution was up and running in less than two weeks.
“The mobile client application ran on handheld Trimble Juno SB GPS data collectors,” said Patrick Lefebvre, Cengea Manager of Customer Solutions. “Field crews were guided by a simple menu system that helped them record and inventory trees in the study area that could be harvested…accurately recording GPS location and key attributes such as species, size and productivity.”
Cengea Urban Forest displays Garden to Table fruit tree locations on a parcel base map layer.
Training the volunteers to use the mobile data collectors took just a few minutes because the attribute menus were mostly point-and-click. These sessions focused on educating the crews to correctly identify San Jose’s nearly two dozen species of fruit trees, each named in the pull-down menu. Jotting down location coordinates for each tree was eradicated because the mobile GIS application on the Juno automatically recorded those points as feature attributes. Collected data was uploaded by Wi-Fi into the back-office piece of the application.
According to Garden to Table’s Lewis, efficiency and accuracy saw immediate improvements in the tree mapping portion of the project. Compared to pen-and-paper, the crews gathered tree data much faster in the field, and errors in transcription
were eliminated by digital upload to the database.
“With the mobile solution, we mapped 1,400 trees and did that in roughly 160 hours,” said Lewis, noting this represented almost 50 percent more trees mapped in half the number of hours, and in only four weeks compared with 18 months the previous time. The process of collecting data in the field and then integrating it into the GIS manually was condensed into a single step thanks to digital data collection making it easy to pick-up and go.
Participants believe the most significant advantage of the automated solution will come this year with a boost in harvest productivity.
Running the Cengea data analysis and visualization application on the GIS, Garden to Table will query the tree inventory to show the most productive trees of a specific type on the digital parcel map layer. This will help them concentrate the volunteers in neighborhoods where the most fruit can be picked.
Community food bank recipients helped out with the harvest.
Further, the Cengea application contains background information on fruit tree species including peak production times which could be correlated with specific tree locations by street address on the parcel layer. Each week of traditional harvest times, Lewis will generate custom maps of the project area along with address lists showing his teams exactly where to go and glean fruits ready to pick.
“The application revolutionizes the way we are able to look at our tree data,” said Lewis.
Among the attributes collected during field work were condition and health of the trees. As a favor to participating citizens with fruit trees on their properties, Garden to Table will also create customized pruning schedules by species. Volunteers may use this information to notify the owners when their trees should be tended. The charitable organization hopes that better maintenance will improve yields in the future.
“Garden to table will use Cengea management tools to improve harvest and prune yields in the future because in the past Lewis printed maps and manually created routes,” said Trimble’s Rick Gosalvez. “With Cengea, he can query by fruit, by season, condition, and by productivity of inventory to make more informed decisions.”
Analyzing tree canopy for Future Growth The City of San Jose and Garden to Table share a common long-term goal of increasing the total number of trees in the San Jose area. While both organizations understand that more fruit trees will ultimately yield larger harvests, the university is eying a classic win-win situation for the community at large.
“Trees really make the city livable,” said Ralph Mize, San Jose’s City Arborist who serves as an advisor to the project. “They provide many positive benefits.” The concept of urban forestry dovetails perfectly with a green initiative started by the San Jose mayor in 2009. One of its goals is to plant 100,000 new trees across the city. SJSU’s Nixon explained that a rich and lustrous tree canopy in the urban and suburban setting has a positive impact on the local economy, environment and society. Trees boost property values, reduce air pollution, improve storm water drainage, and even encourage people to exercise more outdoors.
With fruit tree canopy inventory and monitoring in mind, the project team turned to Equinox Analytics Inc. of Bismarck, N.D., to add another component to the solution. Working with the Trimble eCognition software, the firm created a script that calculates fruit tree canopy coverage by analyzing high-resolution aerial orthoimagery and airborne LiDAR elevation data that had been acquired over San Jose and provided by the City to Trimble for the project.
“The Trimble eCognition software is ideal for performing complex analysis of large, high-resolution spatial data sets,” said Aaron Smith, Equinox Analytics President. First, the eCognition script identified areas of vegetation in the digital orthoimagery using information from the visible green spectrum. But this spectral information included all green vegetation – tree canopies, grass, and bushes. To separate out the trees, the script then correlated the visible green spectral class with the elevation points in the LiDAR data, eliminating vegetation shorter than five feet in height.
“This allowed us to calculate total tree canopy coverage in the [Garden to Table] project area,” said Smith. “We refined the analysis to focus on trees [with fruit] accessible by ladder, so the script eliminated trees taller than 25 feet.”
Trimble eCognition canopy and building footprint extraction in Five-Wounds Brookwood Terrace study area.
Smith output the tree data as a geo-referenced profile across the project area and provided this file to SJSU and Garden to Table. Nixon and Lewis hope to input the data into the GIS and cross- referenced known fruit tree locations with the canopy profile. From this information, they expect to more accurately measure the size of specific tree canopies, greatly enhancing their estimates of potential fruit production.
“The profile also showed where the tree canopy was particularly dense in other parts of the city, giving them an idea of where to focus their efforts to find fruit trees that hadn’t been mapped,” said Smith.
Lewis said that Garden to Table will use the fruit tree canopy map in the future as it moves into the next phase of its project — encouraging the planting of new fruit trees. Just as the canopy map shows where the trees are concentrated, it also reveals gaps where new ones would thrive. Nixon and Lewis plan to work with both city officials and private landowners to encourage planting trees where they can provide the most benefit.
Trimble’s Gosalvez sees the tree canopy monitoring piece of the solution as having significant long-term benefits for overall urban forestry/agriculture efforts in any city. The application provides a baseline of canopy coverage and then enables the end users to make rapid change detection measurements in the future to assess the success of policy initiatives designed to foster tree growth.
“This integrated solution provides all the tools needed for communities to beautify their environments, battle food insecurity and support healthier living in the face of a changing climate,” said Gosalvez.
(This feature originally appeared in Informed Infrastructure.)
The United States Geological Survey announced that US Topo maps now have a crisper, cleaner design – enhancing readability of maps for online and printed use. Map symbols are easier to read over the digital aerial photograph layer whether the imagery is turned on or off. Improvements to symbol definitions (color, line thickness, line symbols, area fills), layer order, and annotation fonts are additional features of this supplemental release. Users can now adjust the transparency for some features and layers to increase visibility of multiple competing layers.
According to the announcement, the new design is launched on new US Topo quadrangles for Kentucky (671 maps) and Tennessee (694 maps), which replace the first edition US Topo maps for those states. The replaced maps will be added to the USGS Historical Topographic Map Collection and are also available for free download from The National Map and the USGS Map Store website.
“The new Kentucky and Tennessee US Topo maps demonstrate our commitment to improving the product design to meet our users’ needs”, said Mark DeMulder, Director of the USGS National Geospatial Program. “I encourage you to download these maps, compare them against the previous US Topo map and drop us your comments on the US Topo map product. Your input is important to us.”
US Topo maps are updated every three years, with the initial round completed last September. Maps for Hawaii are currently in production with Alaska production starting later this year.
Re-design enhancements and new features:
Crisper, cleaner design improves online and printed readability while retaining the look and feel of traditional USGS topographic maps
New functional road classification schema has been applied
A slight screening (transparency) has been applied to some features to enhance visibility of multiple competing layers
Updated free fonts that support diacritics
New PDF Legend attachment
Metadata formatted to support multiple browsers
New shaded relief layer for enhanced view of the terrain
Military installation boundaries, post offices and cemeteries
US Topo maps are created from geographic datasets in The National Map, and deliver visible content such as high-resolution aerial photography, which was not available on older paper-based topographic maps. The new US Topo maps provide modern technical advantages that support wider and faster public distribution and on-screen geographic analysis tools for users.
The new digital electronic topographic maps are delivered in GeoPDF image software format and may be viewed using Adobe Reader, available as a no cost download.
Editor’s Note: The following is a blog post from a Humboldt State University Geography Lecturer Monica Stephens describing her students’ (Amelia Egle, Miles Ross, Matthew Eiben) tweet mapping project. While mapping Twitter content for disaster response is becoming commonplace, mapping cultural values is not. It’s a fascinating example of using GIS to map specific Twitter content.
UPDATE (5/13/13 @ 10:45pm): We have written and published a FAQ to respond to some of the questions and concerns raised in the comments here and elsewhere. Please review our comments there before commenting or emailing.Following the 2012 US Presidential election, we created a map of tweets that referred to President Obama using a variety of racist slurs. In the wake of that map, we received a number of criticisms – some constructive, others not – about how we were measuring what we determined to be racist sentiments. In that work, we showed that the states with the highest relative amount of racist content referencing President Obama – Mississippi and Alabama – were notable not only for being starkly anti-Obama in their voting patterns, but also for their problematic histories of racism. That is, even a fairly crude and cursory analysis can show how contemporary expressions of racism on social media can be tied to any number of contextual factors which explain their persistence.The prominence of debates around online bullying and the censorship of hate speech prompted us to examine how social media has become an important conduit for hate speech, and how particular terminology used to degrade a given minority group is expressed geographically. As we’ve documented in a variety of cases, the virtual spaces of social media are intensely tied to particular socio-spatial contexts in the offline world, and as this work shows, the geography of online hate speech is no different.
Rather than focusing just on hate directed towards a single individual at a single point in time, we wanted to analyze a broader swath of discriminatory speech in social media, including the usage of racist, homophobic and ableist slurs.
Using DOLLY to search for all geotagged tweets in North America between June 2012 and April 2013, we discovered 41,306 tweets containing the word ‘nigger’, 95,123 referenced ‘homo’, among other terms. In order to address one of the earlier criticisms of our map of racism directed at Obama, students at Humboldt State manually read and coded the sentiment of each tweet to determine if the given word was used in a positive, negative or neutral manner. This allowed us to avoid using any algorithmic sentiment analysis or natural language processing, as many algorithms would have simply classified a tweet as ‘negative’ when the word was used in a neutral or positive way. For example the phrase ‘dyke’, while often negative when referring to an individual person, was also used in positive ways (e.g. “dykes on bikes #SFPride”). The students were able to discern which were negative, neutral, or positive. Only those tweets used in an explicitly negative way are included in the map.
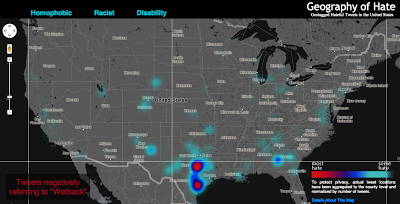
All together, the students determined over 150,000 geotagged tweets with a hateful slur to be negative. Hateful tweets were aggregated to the county level and then normalized by the total number of tweets in each county. This then shows a comparison of places with disproportionately high amounts of a particular hate word relative to all tweeting activity. For example, Orange County, California has the highest absolute number of tweets mentioning many of the slurs, but because of its significant overall Twitter activity, such hateful tweets are less prominent and therefore do not appear as prominently on our map. So when viewing the map at a broad scale, it’s best not to be covered with the blue smog of hate, as even the lower end of the scale includes the presence of hateful tweeting activity.
Even when normalized, many of the slurs included in our analysis display little meaningful spatial distribution. For example, tweets referencing ‘nigger’ are not concentrated in any single place or region in the United States; instead, quite depressingly, there are a number of pockets of concentration that demonstrate heavy usage of the word. In addition to looking at the density of hateful words, we also examined how many unique users were tweeting these words. For example in the Quad Cities (East Iowa) 31 unique Twitter users tweeted the word “nigger” in a hateful way 41 times. There are two likely reasons for higher proportion of such slurs in rural areas: demographic differences and differing social practices with regard to the use of Twitter. We will be testing the clusters of hate speech against the demographic composition of an area in a later phase of this project.
Perhaps the most interesting concentration comes for references to ‘wetback’, a slur meant to degrade Latino immigrants to the US by tying them to ‘illegal’ immigration. Ultimately, this term is used most in different areas of Texas, showing the state’s centrality to debates about immigration in the US. But the areas with significant concentrations aren’t necessarily that close to the border, and neither do other border states who feature prominently in debates about immigration contain significant concentrations.
Ultimately, some of the slurs included in our analysis might not have particularly revealing spatial distributions. But, unfortunately, they show the significant persistence of hatred in the United States and the ways that the open platforms of social media have been adopted and appropriated to allow for these ideas to be propagated.
Funding for this map was provided by the University Research and Creative Activities Fellowship at HSU. Geography students Amelia Egle, Miles Ross and Matthew Eiben at Humboldt State University coded tweets and created this map.
RTKLIB, a developer of open source software for standard and precise GNSS positioning, has released its latest RTKLIB software (version 2.4.2), which fully supports NVS Technologies’ BINR proprietary binary protocol and the NV08C GNSS receiver series.
The use of RTKLIB, in conjunction with NVS Technologies’ NV08C GNSS receiver series, including the highly integrated NV08C-CSM surface mount module with geodetic grade raw data output, enables GNSS system designers and OEMs to develop highly accurate, low cost and compact precision-grade positioning and navigation equipment.
RTKLIB features include:
Full compatibility with NVS Technologies’ NV08C Series GNSS Receivers.
A portable program library and several APs.
Standard and precise positioning algorithms using GPS, GLONASS, Galileo, QZSS, BeiDou and SBAS.
Supports various GNSS based positioning modes, both for real-time and post-processing, including: Single, DGPS/DGNSS, Kinematic, Static, Moving-Baseline, Fixed, PPP-Kinematic, PPP-Static and PPP-Fixed.
Positioning mode for real‐time and post‐processing, including Single, SBAS, DGPS, RTK, Static, Moving‐base and PPP.
Supports many standard formats and protocols for GNSS, including RINEX 2 & 3, RTCM 2 & 3, BINEX, NTRIP 1.0, RTCA/DO-229C, NMEA 0183, SP3-c, ANTEX 1.4, IONEX 1.0, NGS PCV and EMS 2.0.
External communication via Serial, TCP/IP, NTRIP, local log file (record and playback) and FTP/HTTP (auto download).
Contact NVS Technologies for specific features compatibility. Visit www.rtklib.com for RTKLIB’s latest (ver. 2.4.2) software package download, release note, information, tutorial, manual and support.
Autodesk has signed a definitive agreement to acquire Tinkercad, an easy-to-use browser-based 3D design tool. The addition of Tinkercad to Autodesk will help broaden the popular Autodesk 123D family of apps and supports Autodesk’s vision to help anybody imagine, design and create anything. The acquisition will also revive the Tinkercad service and community, despite a previously announced shutdown by its founders and creators.
“Tinkercad is a natural extension of the Autodesk 123D family as well as our other apps and services for consumers, as it is already used alongside Autodesk products”
“We are excited to have reached an agreement with Autodesk that will provide a solid home and bright future for Tinkercad,” said Kai Backman, founder of Tinkercad. “We found in Autodesk a shared vision for empowering students, makers and designers with accessible and easy to use software, and with their global reach and expertise in democratizing design, we’re confident in their ability to introduce Tinkercad to new audiences around the world.”
According to the announcement, Autodesk intends for the Tinkercad service to remain available as part of its consumer portfolio. The company also intends to incorporate elements of the Tinkercad technology and user experience into the Autodesk 123D family of products as part of its ongoing effort to make 3D design easier and more accessible to everyone. The transaction is expected to close within the next 30 days.
“Tinkercad is a natural extension of the Autodesk 123D family as well as our other apps and services for consumers, as it is already used alongside Autodesk products,” said Samir Hanna, Autodesk vice president, consumer products. “We look forward to welcoming the Tinkercad community to Autodesk and to continuing their mission of accessible 3D design for all.”
An ITT Exelis product that detects and locates GPS interference sources in 3-D by using longitude, latitude and altitude has successfully completed a significant integration milestone.
Signal Sentry 1000, formerly known as GPS Interference, Detection and Geolocation, may now be deployed to collect actionable intelligence for law enforcement, such as tracking high-value targets and protecting critical infrastructure.
Signal Sentry 1000 is a proprietary product that leverages GNSS signal domain knowledge; it is based upon patented technology developed by Exelis through many years of designing and fielding electronic intelligence systems, ITT Exelis said.
“Exelis developed Signal Sentry 1000 to help protect critical infrastructure and to deliver intelligence to law enforcement operations that depend upon GPS availability,” said Kevin Farrell, positioning, navigation and timing general manager for Exelis Geospatial Systems. “Jamming devices can transmit signals capable of disrupting the synchronization of critical infrastructure, such as utility power grids, and timing information of financial transactions. This is why we are continually making improvements in our technology, and the latest milestone achievement is a testament to our goal to deliver actionable interference intelligence to agencies that rely upon GPS operational availability.”
Signal Sentry 1000 technology is a network of threat-detection sensors, which are part of a centralized server executing Exelis‐developed proprietary location algorithms. These sensors can be strategically located around areas of critical infrastructure, such as shipping ports, utilities and government facilities to automatically sense and locate any intentional or unintentional GPS jamming source. Should a threat be detected, users would receive accurate location information and actionable intelligence in order to determine an interference-mitigation plan.
“Signal Sentry 1000 builds upon Exelis expertise in the field of GPS and positioning, navigation and timing. Exelis payloads and payload components have been on board every GPS satellite for nearly 40 years,” said Farrell. “Today, Exelis is involved in GPS modernization initiatives, building tomorrow’s GPS III satellite constellation by developing and integrating the navigation payloads. Exelis is also providing navigation processing components, precision monitor station receivers, and key components of the system security design for the GPS Operational Control System, also known as OCX.”
u-blox and Intel collaborate on a 3G-only module to lower design, test and certification costs.
Swiss-based u-blox, a provider of wireless and positioning semiconductors, software and solutions, announced that the company is collaborating with Intel Corporation to bring a small, cost-effective 3G-only HSPA module to the market.
Based on Intel’s XMM 6255 HSPA modem platform, the chipset will be packaged in a compact, low- cost module that maintains layout compatibility with u-blox’ SARA 2G and LISA 3G module series, the company said. u-blox’ 2G-3G-4G nested design philosophy allows product designers to offer tailored solutions to their target markets based on a single PCB design. This facilitates product diversity and easy migration while keeping price at a minimum through reduced design, test, logistics and certification costs, u-blox said.
“As operators start to sunset their GSM/GPRS services, we have partnered with Intel to bring the cost of 3G connectivity down,” said Nikolaos Papadopoulos, president of u-blox America. “For 3G-only M2M devices, our compact HSPA-only module, which is about the size of a quarter, is layout compatible with our popular SARA GSM/GPRS wireless module series. This is the perfect combination for the North American market.” The modem supports full HSPA connectivity and low power consumption in an ultra-small form factor.
“The XMM 6255 platform is latest innovation by Intel and specifically designed for M2M,” said Horst Pratsch, head of product line modules and M2M at Intel Corporation. “Integrating the 3G power amplifier in the transceiver delivers the smallest possible size and lowest number of components enabling new applications of 3G in machine-to-machine applications. Intel is pleased to work with u-blox in bringing this solution to the market.”
Based on Intel X-GOLD 625 digital- and analog- baseband with integrated Power Management Unit and the Intel SMARTi UE2p transceiver for 3G, the Intel XMM 6255 platform is the smallest available HSPA modem chipset. Its compact size and powerful HSPA performance enables u-blox to create the world’s smallest dedicated 3G modem module dedicated to operation over 3G networks worldwide.