Golden Software’s Surfer package now includes a 3D exporting capability. (Photo: Golden Software)
Golden Software has streamlined many workflows in the latest version of its Surfer grinding, contouring and 3D surface mapping product. According to the company, these enhancements will save time for end users in oil and gas exploration, environmental consulting, mining, engineering and geospatial projects.
“We have simplified workflows by making many of the most popular Surfer mapping processes more intuitive,” said Kari Dickenson, Surfer product manager. “By deleting steps and reducing mouse clicks, we have shaved valuable minutes off the time it takes to complete many functions.”
The updates include easier base map editing, a convertible scale bar, the ability to make colors transparent, 3D exporting, simple image cropping, adding multiple files, the ability to apply actions on multiple layers and easier cross section profiles.
Here’s an overview of each update:
Easier base map editing. Users will no longer have to click “Start/Stop Editing” to make changes to base maps. Users now can click on an item on the base map, and the program will automatically enter “Edit” mode so changes can be made to the feature.
Convertible scale bar. Surfer now has a pulldown menu on the scale bar that allows users to convert the scale bar from one type of linear unit to another.
Make colors transparent. Users are able to select any color in an image or air photo and make it transparent.
3D exporting. Users can now export 3D views to a variety of high-resolution image formats including TIF, PNG, JPG and BMP.
Simple image cropping. Surfer users can now draw a polygon around their area of interest in an image or photo to crop out unneeded data, resulting in a smaller file size and faster map editing.
Add multiple files. Users can select multiple map or layer files at once for importing into a Surfer project or applying certain functions.
Apply actions on multiple layers. Users can select multiple map items or layers and then apply functions to all of them.
Easer cross section profiles. Users now have the option of generating a cross section profile by drawing a line across their map or simply selecting a polyline in an existing base layer.
Golden Software also has released a Beta version of Surfer simultaneously with the new version to give customers a chance to try out new features while they are still in development. Users can find the Beta version by clicking “File | Online” from within Surfer.
The Beta features, which will be released in late summer 2020, include a redesigned “Open File” menu, pie charts, automatic scale change and the ability to create 3D PDFs.
Founded in 1983, Golden Software develops scientific graphics software. The company offers six producers, Surfer for gridding, contouring and 3D surface mapping; Grapher for 2D and 3D graphing; Voxler for 3D data visualization; Strater for well log, borehole and cross section plotting; MapViewer for thematic mapping and spatial analysis; and Didger for digitizing and coordinate conversion.
On Oct. 24, 2019, representatives from 11 nations met in Moscow and agreed to a “Radio Navigation Development Plan for Participating Commonwealth of Independent States for 2019 to 2024.” The Russian version is here; a version in English produced by Google Translate can be found here.
Most government documents like this, regardless of the country, tend to be more overviews of current systems vice real plans for a way forward. In this case, though, this seems to be much more of a plan. It documents existing systems, recent accomplishments, user needs, and the upgrades and changes required to meet those needs.
The plan makes clear Russia’s significant concern with GNSS signal disruption (one might opine this is justified as they disrupt the signals so much themselves). As a result, the plan dedicates significant space to combatting disruption and making users more resilient by integrating space and terrestrial systems into a more robust and resilient PNT architecture.
It also seems to confirm a mobile terrestrial PNT capability, likely for military use, that has received little public attention.
Note on Translation and Terminology: The copy of the plan we found was in Russian. We used Google Translate to create an English version. One translation issue that we noticed was several variations of the way the Russian terrestrial Loran PNT system is described. The Russian Loran system is named “Chayka,” literally “Seagull” in English. References in the translated version to “Chaika,” “Loran,” “Laurent,” “Seagull” and “Tropic” are all some version of “Loran.”
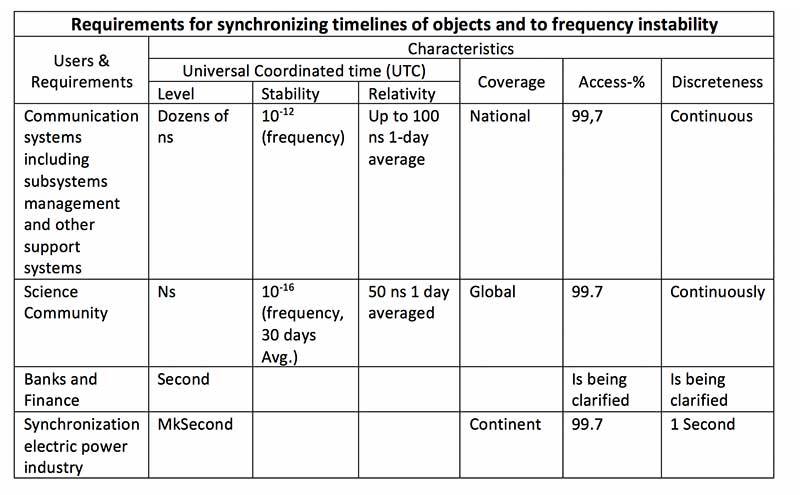
User requirements
Early on the plan provides a detailed discussion of user requirements for each mode of transportation and for timing users. This user focus continues throughout the document. The table for timing users did not transition well during conversion of the document to English and is reproduced below:
Click to enlarge. (Source: “Radio Navigation Development Plan for Participating Commonwealth of Independent States for 2019 to 2024”)
Strategic approach
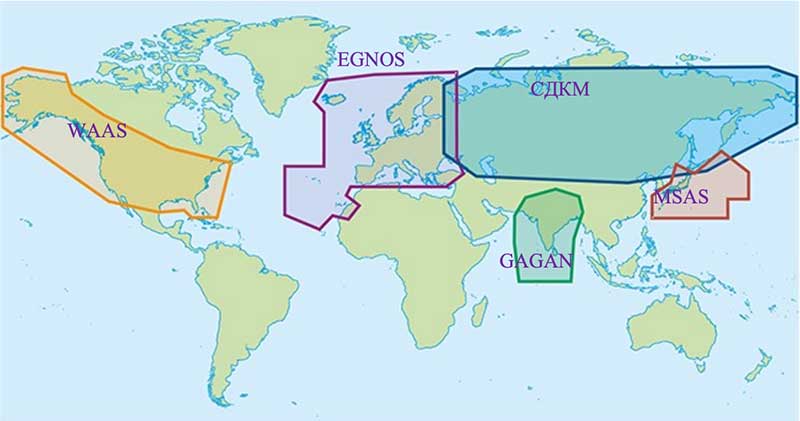
While not overtly stated, one can see that Russia and its Commonwealth of Independent States (CIS) partners have a very strategic view of PNT and how they can leverage it.
Click to enlarge. (Map: “Radio Navigation Development Plan for Participating Commonwealth of Independent States for 2019 to 2024”)
This graphic from the plan speaks volumes. Russian/CIS domestic PNT covers 14% of the earth’s land mass (compared to 6.6% for the U.S.). A good portion of China’s belt and road passes through. Resilient and robust navigation is going to be especially important for a wide variety of reasons.
Concerns about i nterference
The plan discusses GNSS interference at length, listing 13 operational electronic systems (radars, TV channels, etc.) with emissions that could impact reception.
Among the recommendations to counter interference, the plan suggests creation of a system to monitor GNSS frequencies and identify disruptions, use of multiple GLONASS frequencies, and integrating GLONASS, GPS and terrestrial systems within users’ receivers.
“Integration of terrestrial and space RNS will allow creating separate navigation areas superior in technical the characteristics of each of its constituent systems…One of the ways to integrate ground and space RNS is integration of systems like “Seagull” [Loran] and GLONASS. Integrated systems “Seagull” / GLONASS may in the future used as the main systems for route stages navigation.”
Integration of inertial and Loran sensors with GNSS has already been done for some “consumer equipment.” The plan also says that at least one version of Seagull/Loran is being modernized.
Loran and GNSS
Russia’s version of Differential GNSS and Eurofix is done using Loran towers and signals.
In the Russian Federation and the Republic of Belarus there is a ground navigation base that supports control technology transmission corrective information from regional differential GNSS satellite subsystems using Eurofix technology. In Russian Federation, this base is presented in the form of pulse-phase RNS types “The Seagull,” “Tropic-2V” and “Tropic-2C.” Modernization in progress a similar station located in the city of Slonim of the Republic of Belarus.
Some of the advantages of this are listed as coverage of a large area (600- 2,200 km) at relatively low cost, improved channel uptime and availability, data transmission in urban and mountainous areas, and that Loran and GLONASS/GPS are complementary and provide backups for each other.
It also points out that Loran and GNSS are mutually supportive in other ways:
GNSS location determinations can be used to calibration of readings RSDN and compensate for errors due to the propagation of radio wave. In turn the data Laurent-C/Seagull can be used to monitor the integrity of satellite RNS.
Mobile Loran/Scorpio
One system that we have heard very little about in the last five years is Russia’s “Scorpio” or “Skorpion.” It was initially assessed by a US Army journal as a mobile, military PNT system, for space-denied battle.
This document shows it as an on-going Ministry of Defense research and development modernization program. Also, as a mobile form of the Tropic-2P variant of Seagull/Loran.
In the period until 2020, a planned replacement of mobile long-range radio navigation systems “Tropic-2P” to the information system coordinate-temporal support “Scorpio”. As part of the complex equipment there are local control and correction stations, which can significantly improve the accuracy of determining coordinates consumers.
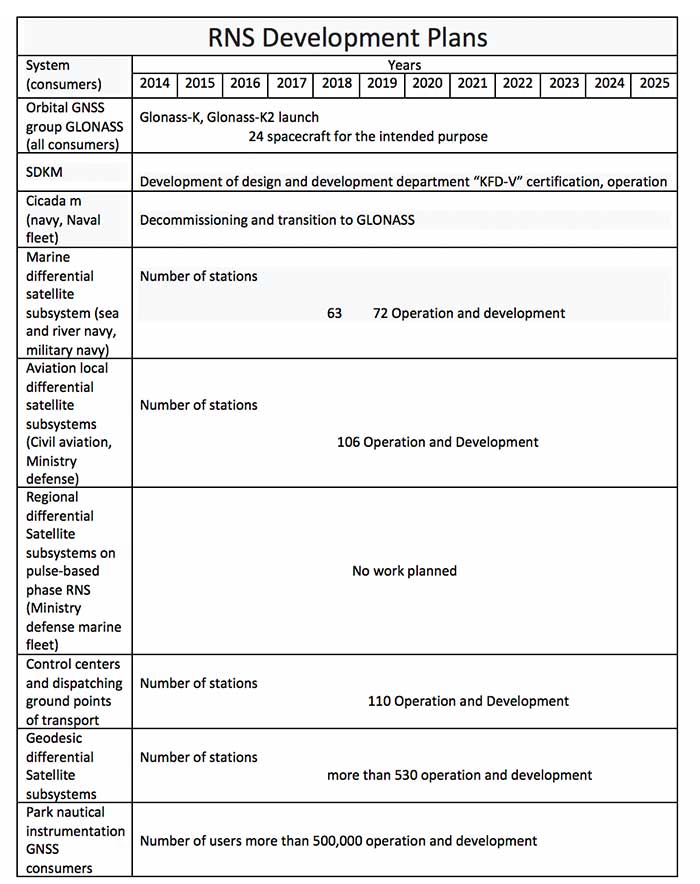
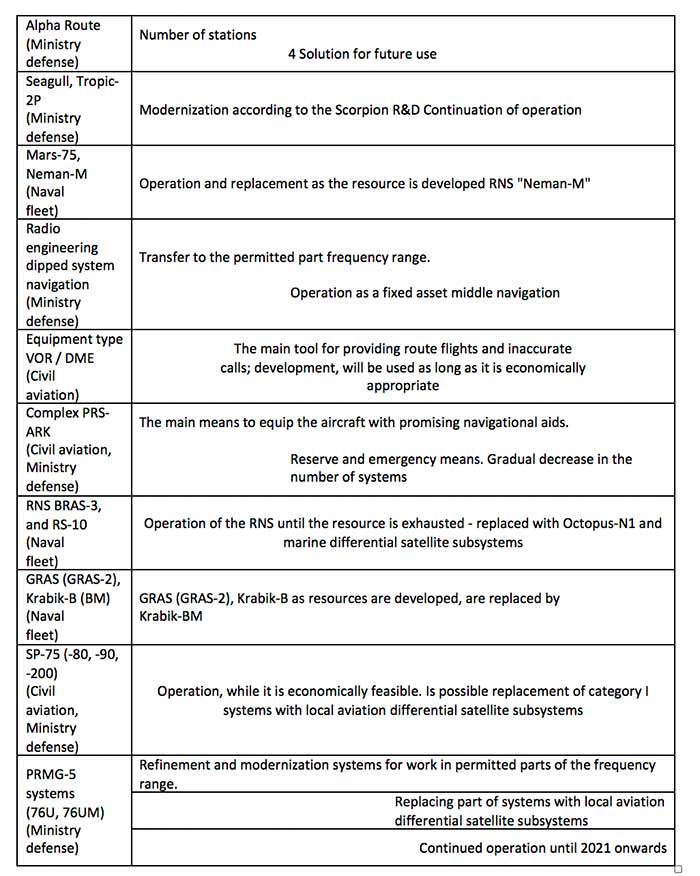
The way forward
At over a hundred pages, this plan has a lot of information. It includes a table of 19 different navigation systems maintained by the government and the plan for each. This table also suffered when the document was transformed into the English version. The manual re-recreation is below:
Click to enlarge. (Source: “Radio Navigation Development Plan for Participating Commonwealth of Independent States for 2019 to 2024”)Click to enlarge. (Source: “Radio Navigation Development Plan for Participating Commonwealth of Independent States for 2019 to 2024”)
The U.S.-only For Official Use Only sessions will be hosted at the Northern Kentucky Convention Center in Covington, Kentucky, and the U.S.-only secret sessions will be hosted at the Air Force Institute of Technology in Dayton, Ohio.
According to ION, the rescheduled conference will host the original program, which was scheduled to take place in June.
“We are aware of the importance of this community of dedicated public servants meeting in an environment where they can effectively collaborate, exchange research, and demonstrate technology,” said Lisa Beaty, executive director for ION. “The current global climate made our ability to hold this conference in June unlikely, and we needed to provide an alternative opportunity for all our stakeholders.”
Those scheduled to present at JNC 2020 will receive emails from ION asking them to respond electronically to confirm the rescheduled dates and times of their presentations. Those who have registered to attend will receive an email from ION letting them know what their options are.
The Space Foundation has decided to reschedule the 36th Space Symposium for Oct. 31 to Nov. 2. It will still take place at The Broadmoor in Colorado Springs.
According to the Space Foundation, the 36th Space Symposium will gather leaders, innovators and entrepreneurs from the civil, commercial, military, research and international sectors to share, explore and partner on efforts that will impact our lives beyond Earth and upon it.
“Working with our partners, The Broadmoor, the City of Colorado Springs, our corporate members and other key stakeholders, we look forward to welcoming everyone back to Colorado Springs to celebrate one of the world’s most inventive and impactful communities,” said Rear Admiral Tom Zelibor, CEO of the Space Foundation. “We will continue to monitor all of the public health reports and adhere to all of the federal, state and local orders regarding public assemblies but we have confidence in planning ahead for a future that brings our community safely back together in Colorado Springs.”
As a result of the date and timing changes for this year’s symposium, attendees will find a revamped agenda from what was originally scheduled for this spring, the Space Foundation said. Scheduled changes can be found here.
In addition, registration fees paid to attend the 36th Space Symposium will be automatically transferred to the rescheduled program. Those choosing to not attend the rescheduled Symposium are requested to notify [email protected] to receive a full refund of registration fees paid.
Iris Automation released Casia 360, an onboard detect-and-avoid solution with a 360-degree radial field of view to enable commercial beyond visual line-of-sight (BVLOS) operations for unmanned aircraft systems (UAS).
According to the company, Casia 360 system has the ability to detect other aircraft in all directions. It then uses computer-vision algorithms to classify them, makes intelligent decisions about the threat they may pose to the drone, then triggers an alert to the pilot in command and automated maneuvers to safely avoid collisions.
Casia 360, a low size, weight and power system, is composed of two onboard controllers and five long-range optical cameras that provide a 360-degree field of view. The software is packaged in a self-contained embedded supercomputer that works with the machine vision cameras onboard, the company said.
“Casia 360 allows a drone to have a complete sense of its surroundings so it can avoid potential collisions from any direction,” said Alexander Harmsen, CEO of Iris Automation. “We developed this technology based on feedback from our customers and regulatory bodies around the world. It enables drones to be used for an even greater range of long-distance use cases and saves money, increases safety and unlocks applications across multiple industries: railway, energy sector, utility powerline inspections, package delivery, and life-saving search and rescue operations.”
Iris Automation, based in San Francisco, is an artificial intelligence and safety avionics company building collision-avoidance systems for autonomous vehicles.
Dutch company NEO B.V. is using SimActive’s Correlator3D software to assess solar potential in multiple cities. (Image: SimActive)
SimActive’s Correlator3D software is being used by by Dutch company NEO B.V. to assess solar potential in multiple cities. Digital surface models (DSMs) are generated from WorldView and GeoEye satellite stereo images and serve to calculate solar panel capacity.
According to SimActive, DSMs covering hundreds of square kilometres are quickly generated by the software. Key metrics to estimate solar potential are then derived, including roof orientation, pitch and shaded areas.
“We have been impressed by the quality of SimActive’s DSMs, especially considering the limited spatial resolution of the imagery”, said Rob Beck, managing director at NEO B.V. “Another definite advantage of Correlator3D is the simplicity of the workflow, making it easy to use by our team.”
SimActive’s Correlator3D software is a patented, end-to-end photogrammetry solution for the generation of high-quality geospatial data from satellite and aerial imagery, including UAVs. Correlator3D performs aerial triangulation and produces dense digital surface models, digital terrain models, point clouds, orthomosaics, 3D models and vectorized 3D features.
Esri has created and released a suite of resources to help businesses like commercial organizations, government agencies and utilities maintain operational continuity during the COVID-19 pandemic.
According to Esri, these resources are designed to help organizations understand the current status of their operations and employees, analyze relative community risk to COVID-19 and create business strategies for moving forward.
The four released resources include the Coronavirus Business Continuity solution, impact planning for COVID-19, the Health and Medical Lifeline: COVID-19 Risk Model and county-level COVID-19 case data.
The Coronavirus Business Continuity solution includes configurable apps and surveys to enable organizations to track the status and location of their employees and facilities throughout the supply chain and communicate that information with internal and external stakeholders.
Impact planning for COVID-19 provides a snapshot of every U.S. county, including daily updates on each county’s COVID-19 cases and data on population vulnerability, hospital beds and more.
The Health and Medical Lifeline: COVID-19 Risk Model from the Federal Emergency Management Agency ranks counties by high, medium and low risk for COVID-19 vulnerability and risk.
PCTEL has terminated its previously announced share repurchase program. The board of directors does not intend to modify the company’s dividend policy, PCTEL said.
“Given the uncertainty surrounding the COVID-19 virus and its impact on economic and market conditions, the board determined that it is prudent to terminate the share repurchase program,” said David Neumann, CEO of PCTEL. “Maintaining our strong balance sheet will allow PCTEL flexibility to address the unique and evolving challenges presented by the COVID-19 situation.”
In addition, PCTEL also terminated a plan pursuant to Rule 10b5-1 under the Securities Exchange Act of 1934, as amended, that was in place to facilitate market repurchases.
According to PCTEL, under the now-terminated repurchase program, it repurchased approximately 375,000 shares of common stock for an aggregate purchase price of approximately $2 million. Following these repurchases, it had approximately 18.5 million shares of common stock outstanding, the company said.
PCTEL is a provider of wireless technology, including industrial IoT devices, antenna systems, and test and measurement solutions.
The contract is expected to include data acquisition, data processing, quality control and data analytics. Quantum Spatial has bee providing topobathymetric lidar services to NOAA’s National Geodetic Survey Remote Sensing Division since 2013, the company said.
“This is the fourth consecutive contract awarded by NOAA’s National Geodetic Survey to Quantum Spatial covering more than 20 years in support of its mission,” said Kurt Allen, vice president for federal programs at Quantum Spatial. “A joint dedication by NOAA and Quantum Spatial for research and development and applying significant advancements in technology has allowed numerous stakeholders to utilize the near-shore bathymetric foundational data generated by the program.”
Quantum Spatial, an NV5 Global company, is a full-service geospatial solutions provider in North America.
The Open Geospatial Consortium (OGC) published the outcomes of its biggest research and development initiative of 2019, Testbed-15. Key outcomes, including engineering reports, presentations and videos, are available on the Testbed-15 website.
According to OGC, Testbed-15 research was conducted across several fields, including Earth observation data models, applications, catalogues and process delivery; data security in geospatial environments using encrypted containers; federated cloud environments incorporating OGC Open Web Services; secure delta updates to geospatial data in denied, disrupted, intermittent and limited situations; an open portrayal framework and APIs for sharing portrayals of geospatial content; and machine learning models and outputs integrating with OGC Open Web Services.
OGC Testbeds, an annual activity of OGC’s Innovation Program, are multi-vendor, collaborative efforts where participants follow a rapid prototyping approach to design, develop and test solutions to sponsors’ location-related problems. OGC Testbed results, documented in engineering reports, are provided to OGC’s Standards Program, where they are reviewed, revised, and potentially advanced as new international open standards.
Alongside the sixteen engineering reports, Testbed-15 resulted in advancements to the suite of draft OGC APIs, including APIs related to styles, maps, tiles, records and the OGC API-Common building block, OGC said.
OGC Testbed-15 was sponsored by the Defence Science and Technology Laboratory, the European Space Agency, Natural Resources Canada, the U.S. Geological Survey and NASA.
The Open Geospatial Consortium is an international consortium of more than 530 businesses, government agencies, research organizations and universities driven to make geospatial information and services findable, accessible, nteroperable and reusable.
StreetDrone published a report titled “Putting Safety First in Autonomous Vehicles.” The report is designed for anyone interested in the development of autonomous vehicle technologies, especially public transport and delivery companies, civic authorities and universities.
According to StreetDrone, the report contributes to the connected and autonomous (CAV) industry safety debate, as well as adds perspective to conventional CAV safety wisdom.
The purpose of the 30-page report is to make an experience-based contribution to the safety debate to enable the CAV industry to accelerate corporate, institutional and public confidence in self-driving technology, so the benefits of new autonomous services can be realized more quickly, StreetDrone said.
The report is based on the company’s experience in operating autonomous vehicle trials in urban environments, including those with high population densities and complex infrastructures. It also covers other areas for the safe operation of autonomous vehicles, including the definition of a safe operating environment, minimum operating standards for safety drivers, and a set of open data protocols for effective error tracking and rectification.
“While we’ve had to make some changes to our operations due to COVID-19, we’ve also had the opportunity to write our Safety Report based on the experience of building and running autonomous vehicles over the past three years of StreetDrone’s operations,” said Mike Potts, CEO of StreetDrone. “This experience spans the full stack of AV disciplines, from hardware and mechanical design through to AI and software, as well as a deep insight into city centre public highway trials. For an organization focused on ‘zone 1’ urban trials, we have necessarily been safety-led, so our report encapsulates much of this knowledge. We believe that industry collaboration and knowledge-sharing are essential prerequisites for CAV technology to achieve wide-scale adoption, and we’re therefore delighted to make our own contribution to this growing body of knowledge.”
StreetDrone’s own hardware platforms range from the L7e class Renault Twizy heavy quadricycle to the flexible Nissan eNV200, which comes in taxi, delivery van or 7-seater passenger variants.
My February 2020 column provided an analysis of the differences between the latest published hybrid Geoid18 values provided on NGS’ Datasheet and the computed geoid height value using the published NAD 83 (2011) ellipsoid height and NAVD 88 orthometric height. The column highlighted issues on differences due to published heights that have changed since the database pull for Geoid18. It mentioned that future columns will address differences in other portions of CONUS. This column will focus on differences between published Geoid18 values and Geoid12B values in Southern Louisiana. Why are users seeing large differences between the two models?
My last column mentioned that the technical report on Geoid18 provided a good explanation on the stations used in the United States Gulf Coast region. See box titled “GPS on Bench Marks for GEOID18 in the Gulf Coast Region.”
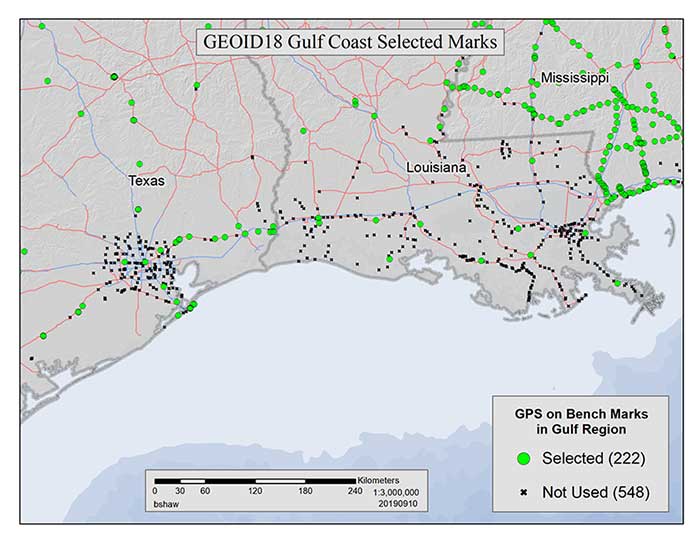
GPS on Bench Marks for GEOID18 in the Gulf Coast Region
Figure 1: GEOID18 Gulf Coast selected marks: There are areas of complex vertical crustal motion in the Texas/Louisiana Gulf Coast region of the United States which render many control station elevations in the region invalid. The selection of GPS on Bench Marks in this region was limited to the small number of marks where the leveling and GPS data agreed to minimize the influence of crustal motion in the hybrid geoid model. Figure 1 depicts the selection of stations used in the hybrid geoid model along the Texas/Louisiana Gulf Coast. (Image: National Geodetic Survey)
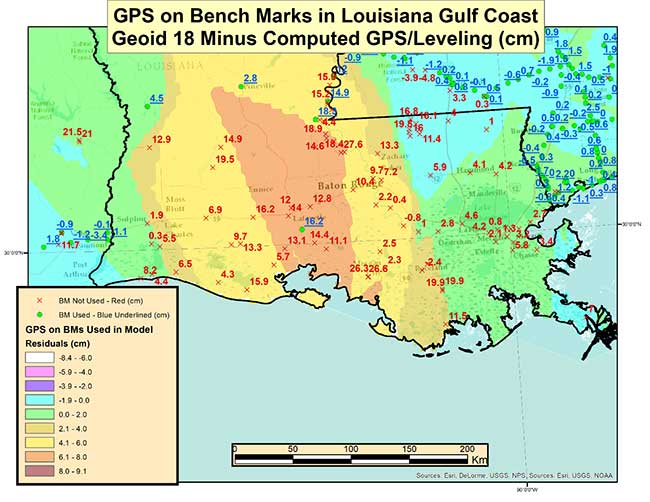
As highlighted in the last column, very few stations in Southern Louisiana were used in the creation of the Geoid18 hybrid geoid model. As provided in my last column the box titled “Differences on GPS on Bench Marks in the Gulf Coast Region” depicts the differences between the published Geoid18 value and the computed geoid value using the latest NAD 83 (2011) ellipsoid and NAVD 88 orthometric height.
Differences on GPS on Bench Marks in the Gulf Coast Region
Image: National Geodetic Survey
The plot indicates that there are many large differences. Many of these differences are to be expected because the Southern Louisiana is an area of known crustal movement. NGS recognizes this and includes the statement below on datasheets for stations published in Southern Louisiana (see box titled “Statement on NGS Datasheet for Stations in Southern Louisiana”).
Statement on NGS Datasheet for Stations in Southern Louisiana
This station is in an area of known vertical motion. Due to the variability of land subsidence, uplift, and crustal motion, NGS has, determined the orthometric heights for marks in these suspect subsidence areas should be considered valid only at the epoch date associated with the orthometric height. These heights must always be validated when used as control. All previously superseded orthometric heights are now considered suspect and are available in the superseded section. NGS does not recommend using suspect or superseded heights as control.
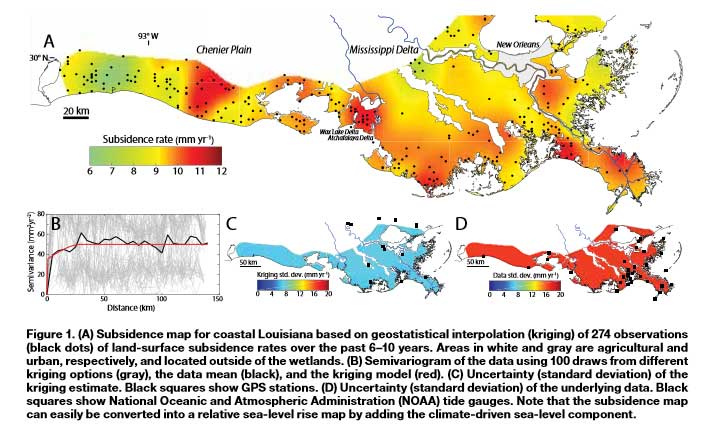
Looking at the figure indicates that there is a significant variation of subsidence occurring in coastal Louisiana. The legend indicates that the subsidence rates range between 0.6 to 1.2 cm/year.
Figure 1 from A New Subsidence Map for Coastal Louisiana
The box titled “Excerpt from Anthropogenic and Geologic Influences on Subsidence in the Vicinity of New Orleans, Louisiana” depicts estimates of crustal movement between 2009 and 2012 in the vicinity of New Orleans. Several of the areas in the plot indicate subsidence rates exceeding -1 cm/year. Once again, the figure shows the local variability of subsidence rates.
Excerpt from Anthropogenic and Geologic Influences on Subsidence in the Vicinity of New Orleans, Louisiana
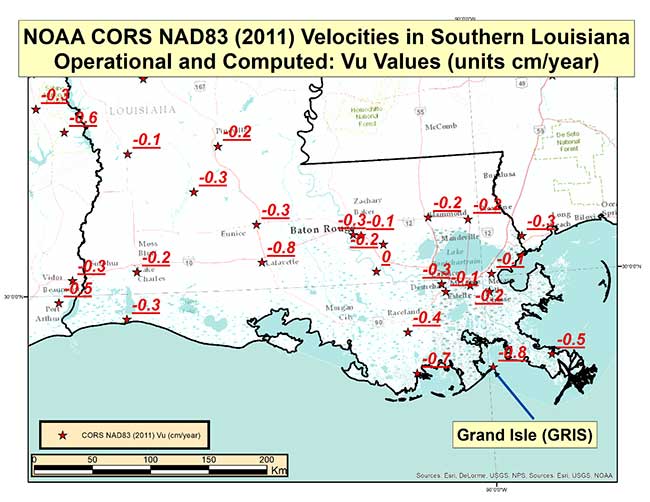
Last year, NGS performed the Multi-Year CORS Solution 2 (MYCS2). This was described in previous columns, which can be viewed here and here. The MYCS2 process generated computed and modeled velocities for CORSs. The box titled “CORS NAD83 (2011) Vu Velocities” is a plot that depicts the velocities in the “upward” component in cm/year for NOAA CORS that are operational and have a computed velocity in Southern Louisiana. So, what does this mean to estimating a hybrid geoid model in Southern Louisiana?
CORS NAD83 (2011) Vu Velocities
Image: National Geodetic Survey
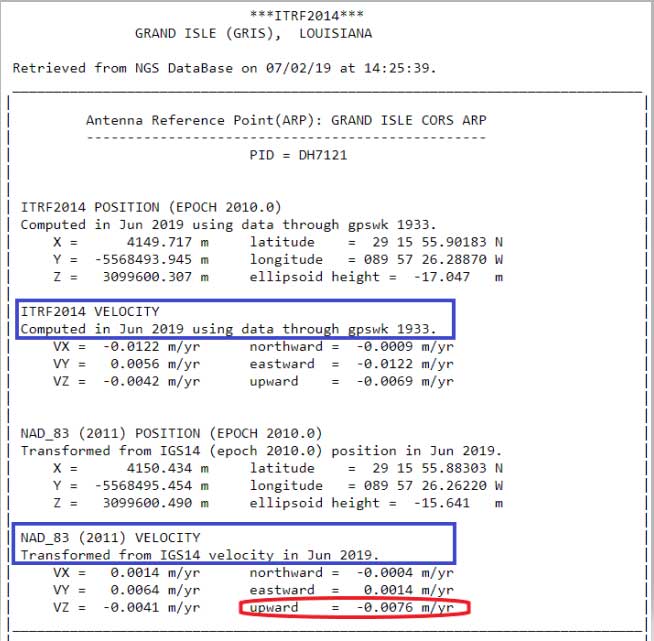
The plot indicates that the rates vary from -0.1 cm to -0.8 cm. It should be noted that these stations are CORS and they are typically installed on structures that may not capture the entire amount of subsidence at the land surface. The box titled “CORS Position and Velocity for Station GRIS” provides an example of a CORS sheet from NGS CORS website.
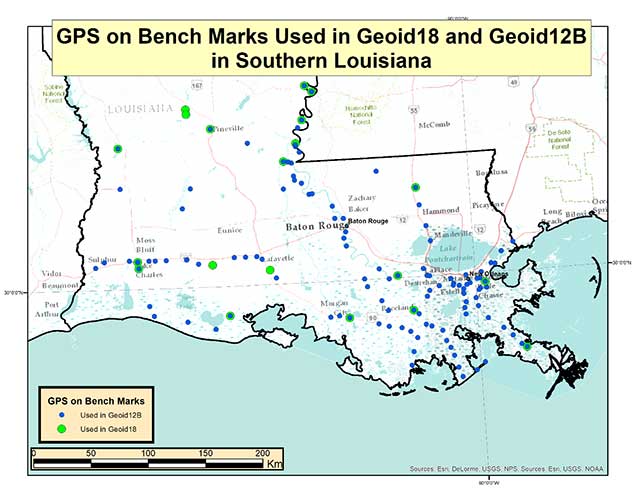
Now, let’s look at differences between Geoid12B and Geoid18 in Southern Louisiana. The box titled “GPS on Bench Marks Used in Geoid18 and Geoid12B” depicts the stations used in Geoid12 and those used in Geoid 18. As indicated in the plots, there were a lot more stations used in the generation of the Geoid12B model than those used to create the Geoid18 model.
GPS on Bench Marks Used in Geoid18 and Geoid12B
Photo: National Geodetic Survey
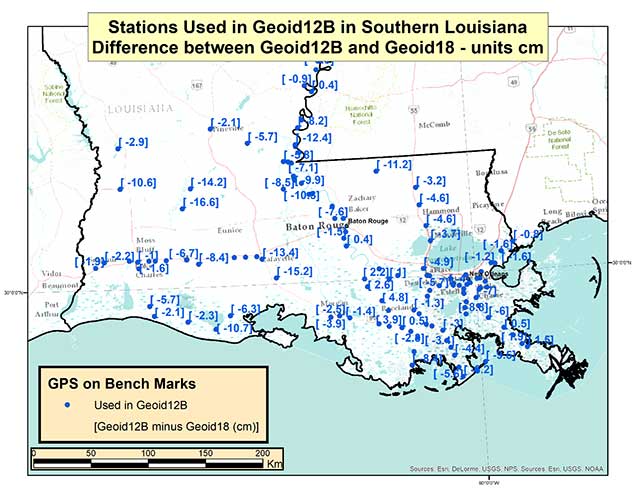
The box titled “Differences between Geoid12B and Geoid18 in Southern Louisiana” provides the values of Geoid12B minus Geoid18 in centimeters on the GPS in Bench Mark stations used in Geoid12B.
Differences between Geoid12B and Geoid18 in Southern Louisiana
Photo: National Geodetic Survey
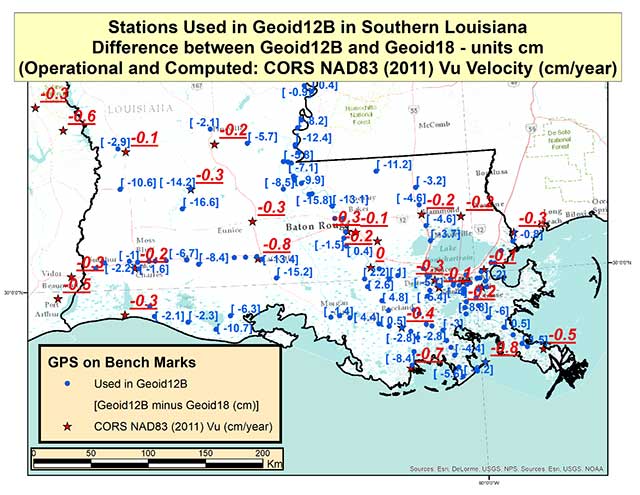
As indicated in the plot, there are some large differences between Geoid12B and Geoid18 values; a few differences exceed 15 centimeters. Based on the previous discussion of crustal movement in Southern Louisiana, this probably shouldn’t come as a surprise. The box titled “Differences between Geoid12B and Geoid18 with Vu Velocity Values” depicts the differences in the hybrid geoid models and the NAD83 (2011) CORS Vu rate.
Differences between Geoid12B and Geoid18 with Vu Velocity Values
Photo: National Geodetic Survey
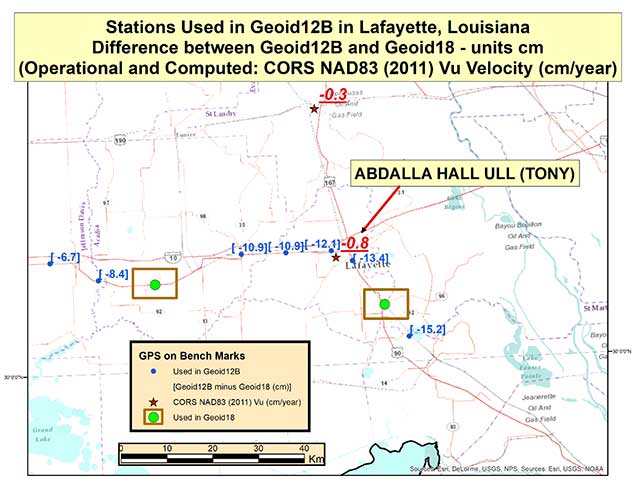
The box titled “Differences between Geoid12B and Geoid18 in Lafayette, Louisiana” depicts the differences in the two hybrid geoid models and the NAD83 (2011) CORS Vu rate values in the Lafayette, Louisiana, region. This region has some of the largest differences between Geoid12B and Geoid18 values in Southern Louisiana. As indicated in the plot, CORS station TONY has a Vu rate of -0.8 cm/year which is fairly large, and the differences between Geoid12B and Geoid18 values are fairly large at the -10 to -15 cm level. Once again, users should expect differences between the two hybrid geoid models because there has been movement in the area and because different GPS on Bench Mark stations were used in the generation of the hybrid geoid models. In the Lafayette region the two stations used in the generation of Geoid18 were not used in Geoid12B (see stations highlighted in a box).
Differences between Geoid12B and Geoid18 in Lafayette, Louisiana
Photo: National Geodetic Survey
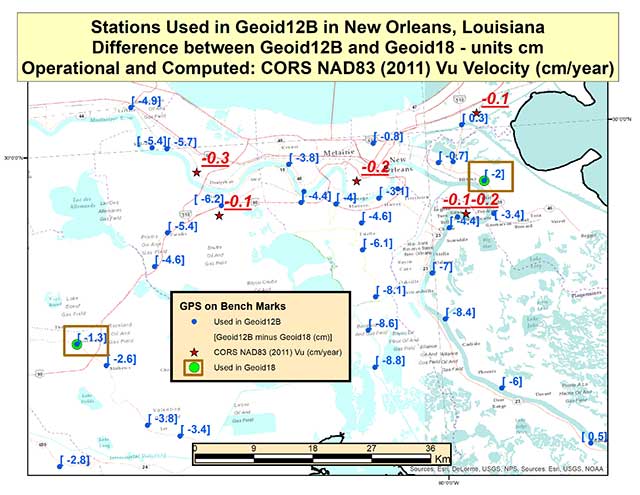
The box titled “Differences between Geoid12B and Geoid18 in New Orleans, Louisiana” depicts the differences in the hybrid geoid models and the NAD83 (2011) CORS Vu rate values in the New Orleans, Louisiana, region. Two of the same stations that were used in the development of Geoid12B and Geoid18 are highlighted with a box. The difference between the two geoid model values are much less in this region compared with the Lafayette region. The CORS Vu velocities are also less than the CORS station (TONY) value in Lafayette. Saying that, the differences on stations not used in Geoid18 have differences ranging from -4 to -8 cm going southward toward the Gulf of Mexico. Once again, Southern Louisiana is subsiding so these differences are not surprising.
Differences between Geoid12B and Geoid18 in New Orleans, Louisiana
Photo: National Geodetic Survey
This means if someone uses NGS’ OPUS web tool to compute a GNSS-derived orthometric height, the NAVD 88 GNSS-derived orthometric height could be significantly different than the published stations in this region. Some of the difference could be due to the difference between the Geoid12B and Geoid18 published values, and some could be due to crustal movement in Southern Louisiana. Saying that, I mentioned in my last column that NGS performed a large GNSS network project in Southern Louisiana in 2016. The GNSS-derived ellipsoid heights were loaded in NGS’ database in March 2019, but the GNSS-derived orthometric height from the 2016 project are not yet finalized so they have not been loaded into NGS’ database. Once finalized and loaded into the database, the 2016 GNSS-derived orthometric heights should be more consistent with GNSS-derived orthometric heights estimated using the NGS’ OPUS web tool. This column focused on differences between published Geoid18 values and Geoid12B values in Southern Louisiana. It provided reasons why users may see large differences between the two models.