Apple has applied for a license from the Federal Communications Commission (FCC) to install GPS testing equipment within Apple Park.
For the purposes of licensing, GPS transmitters are included in radio broadcasting legislation, and enforced jointly by the FCC and the U.S. National Telecommunications and Information Administration, which is part of the Department of Commerce.
In its application, Apple named two objectives. The first objective is the “illumination of the part of the the facility, located at 1 Apple Parkway, Cupertino, California, with a GPS signal to allow for the testing and experimentation indoors for continued exploration of utilizing GPS technologies within their devices to provide innovation applications and continue to provide safe products.” Its second objective is the “further design, development and enhancement of existing GPS applications to provide greater efficiency and more effective means of utilizing GPS derived information.”
According to Apple Insider, this would mean Apple would install a GPS transmitter or repeater within Apple Park in order to better control and test its own GPS devices. Apple plans to use a GPS repeater called Metro GNSS, Apple Insider added.
The application has not yet been granted, but Apple previously applied three times for licenses to conduct tests regarding cellular and consumer radios, with each application being approved, reported Apple Insider.
Mobile World Congress (MWC) Barcelona will still take place Feb. 24-27, despite exhibitors dropping out because of the coronavirus. According to a statement by GSMA, some large exhibitors have decided not to come to the show this year because of the coronavirus, while others are still contemplating next steps. Despite this, the show is expected to boast more than 2,800 exhibitors.
According to Reuters, as of Feb. 9, there are two confirmed cases of coronavirus in Spain.
GSMA and its partners have implemented several safety measures for attendees, the organization said, including:
Increased cleaning and disinfection across all high-volume touch points, such as catering areas, surfaces, handrails, restrooms, entrances/exits and public touchscreens, along with the use of correct cleaning/sanitizing materials and products
Increased onsite medical support
Awareness campaign via online and onsite info-share and signage
Availability of sanitizing and disinfection materials for public use
Awareness and training to all staff on standard personal preventative measures, such as personal hygiene, frequent use of sanitizing/disinfection products, etc.
Advice to exhibitors on implementing effective cleaning and disinfection of stands and offices, along with guidance on personal hygiene measures and common preventive behavior
Public health guidelines and communication with Barcelona hotels, public and private transport, restaurants and catering outlets, retail, etc.
Installing new signage onsite reminding attendees of hygiene recommendations
Implementing a microphone disinfecting and change protocol for all speakers
Communicating advice to all attendees to adopt a “no-handshake policy”
A 24-hour telephone security and medical service for all attendees, available Feb. 12 to Feb. 29. This number will appear on the back of badge holders, in the event app and on signage around the venue.
Companies Back Out
Because of the coronavirus, several companies have backed out of attending MWC Barcelona. Several of these companies include Sony, Ericsson, LG, Nvidia and Amazon.
“Due to the outbreak and continued concerns about novel coronavirus, Amazon will withdraw from exhibiting and participating in Mobile World Congress 2020,” Amazon said in a statement. According to CNN Business, the company was due to host a dozen sessions covering topics such as 5G connectivity and artificial intelligence.
Other companies have expressed similar concerns.
“Sony has been closely monitoring the evolving situation following the novel coronavirus outbreak, which was declared a global emergency by the World Health Organization on January 30,” the company said in a statement. “As we place the utmost importance on the safety and wellbeing of our customers, partners, media and employees, we have taken the difficult decision to withdraw from exhibiting and participating at MWC 2020 in Barcelona, Spain.”
As an alternative, Sony’s press release will take place on Feb. 24 via a video through its official Xperia YouTube channel.
“We’ve informed GSMA, the organizers of MWC Barcelona, that we won’t be sending our employees to this year’s event,” Nvidia said in a statement. “Given public health risks around the coronavirus, ensuring the safety of our colleagues, partners and customers is our highest concern. We’ve been looking forward to sharing our work in AI, 5G and vRAN with the industry. We regret not attending, but believe this is the right decision.”
My last column, December 2019, highlighted the National Geodetic Survey’s (NGS) new Geoid Monitoring Service (GeMS); and, that NGS’ will be publishing a gridded geoid model GEOID2022 that will contain two components: (1) Static Geoid model of 2022 (SGEOID2022) and (2) Dynamic Geoid model of 2022 (DGEOID2022). That’s what going to happen in 2022, but what about today? Since GEOID18 has been officially released for public use, it’s time to look at differences between the Geoid18 published value and estimated geoid values computed using information from NGS’ datasheet. This column will provide an analysis of the differences between the latest published hybrid Geoid18 values provided on NGS’ Datasheet and the computed geoid height value using the published NAD 83 (2011) ellipsoid height and NAVD 88 orthometric height. This is what a user will see if they computed differences using NGS’ datasheets published values. The question will always be asked, why is there a difference between the published Geoid18 value and the computed geoid value. This column will explain some reasons for the differences.
It’s mostly good news but there are some issues that should be highlighted. This column will highlight issues on differences due to published heights that have changed since the database pull for Geoid18.
First, it should be noted that NGS’ hybrid geoid models are different than NGS’ experimental gravimetric geoid models. My December 2018 column explains these differences.
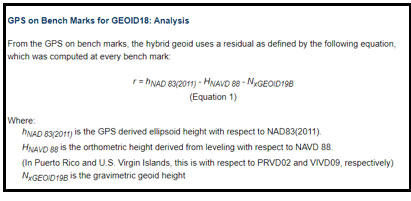
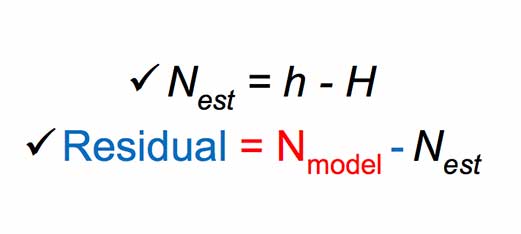
I would like to emphasize that, in my opinion, hybrid geoid models should be denoted as transformation models. Saying that, hybrid geoid models are related to “real” geoid models. Hybrid geoid model GEOID18 was computed based on NGS’ gravimetric geoid model xGeoid19b; therefore, GEOID18 is related to a gravimetric geoid model but its function is to estimate GNSS-derived orthometric heights consistent with NAVD 88 heights. As described in my previous columns, the GPS on Bench Marks (GPSBMs) data provide an estimate of the geoid height ‘N’ by differencing the ellipsoidal height ‘h’ from the orthometric height ‘H’: (N = h – H). These differences are then compared to the gravimetrically-derived geoid model. The box titled “Excerpt from Geoid18 Website Technical Details” provides a summary of the process from NGS Geoid18 web page technical details document.
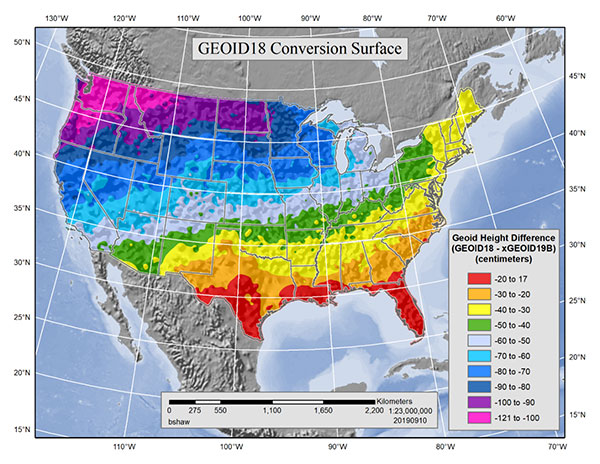
The figure in the box titled “GEOID18 Conversion Surface in cm” is the surface that represents the difference between NAVD 88 as a datum and the geopotential (geoid) surface used in the gravimetric geoid. This is the difference between the hybrid geoid and the gravimetric geoid with respect to NAD83 (GEOID18 – xGEOID19B). This surface has three essential components: a bias, a continental tilt, and local warping from the bench marks.
Hybrid Geoid Model Construction
The residuals obtained in equation 1 are contaminated with a continential tilt and bias that is estimated and removed with a simple two-dimensional planar surface. The bias-free and tilt-free residuals are ultimately used to determine a mathematical model using least squares collocation (LSC) and multiple Gaussian functions to describe the behavior seen at the bench marks. Once the relationship between the points is modeled, the model is used to generate a 1 arcminute regular grid for interpolation purposes. Figure 2 shows the final conversion surface. This surface represents the difference between NAVD 88 as a datum and the geopotential (geoid) surface used in the gravimetric geoid. This is the difference between the hybrid geoid and the gravimetric geoid with respect to NAD83 (GEOID18 – xGEOID19B). This surface has three essential components: a bias, a continental tilt, and local warping from the bench marks.
GEOID18 Conversion Surface in cm
Image: National Geodetic Survey
Looking at the figure in the box, the bias and tilt between the hybrid geoid model (Geoid18) and the experimental gravimetric geoid model (xGeoid19b) are fairly obvious. It’s the local warping from the bench mark data that may cause some issues to surveyors or, at least at a minimum, raise some concerned by surveyors. The box titled “Plot of the GPS on Bench Marks Involved in Geoid18” provides a plot of the GPS on Bench Marks (GPSBMs) used in the generation of Geoid18. Users can download the list of GPSBMs stations from the NGS Geoid18 website. There were 32,357 stations used to generate the model. This was an increase of approximately 6,800 stations (26%) over the hybrid geoid model Geoid12B.
Plot of the GPS on Bench Marks Involved in Geoid18
Image: National Geodetic Survey
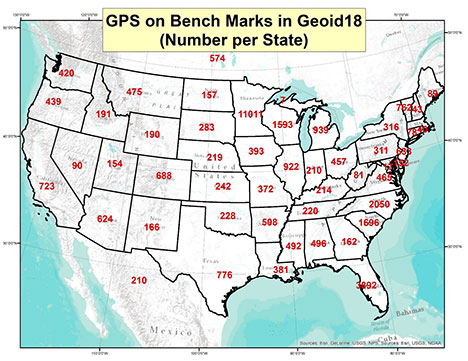
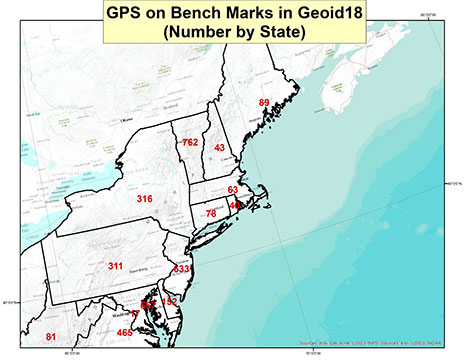
The boxes titled “Number of GPS on Bench Mark Stations by State” and “Number of GPS on Bench Mark Stations by State in Northeast U.S.” provide the number of data points per state.
Number of GPS on Bench Mark Stations by State
Image: National Geodetic Survey
Number of GPS on Bench Mark Stations by State in Northeast U.S.
Image: National Geodetic Survey
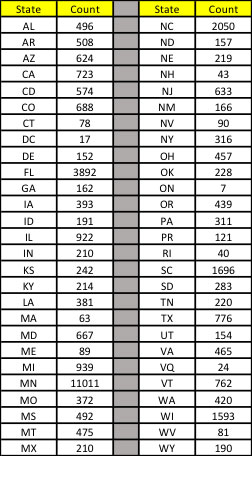
The box titled “Table of Number of Data Points per State” provides the number of stations per State in tabular form.
Table of Number of Data Points per State
Data: National Geodetic Survey
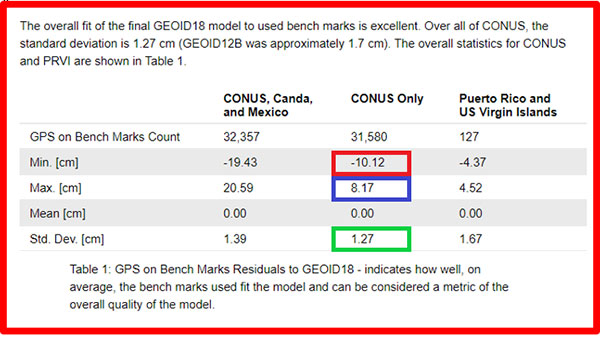
The box titled “Summary of Overall fit of Geoid18” provides a summary of the fit of residuals of Geoid18 from the NGS GEOID18 technical details document. Looking at the CONUS overall values, the standard deviation is very low 1.27 cm which is a little better than Geoid12B (1.7 cm). It should be noted that there are some large outliers (minimum value of -10.12 cm and maximum value of 8.17 cm).
For this column, the file of bench marks provided on the NGS Geoid18 web page were combined with the published ellipsoid, orthometric, and Geoid18 heights from NGS’ datasheet. The difference between the published geoid height (Geoid18) and the estimated geoid height [published NAD 83 (2011) ellipsoid height minus NAVD 88 orthometric height] was computed using the following formula:
Data: National Geodetic Survey
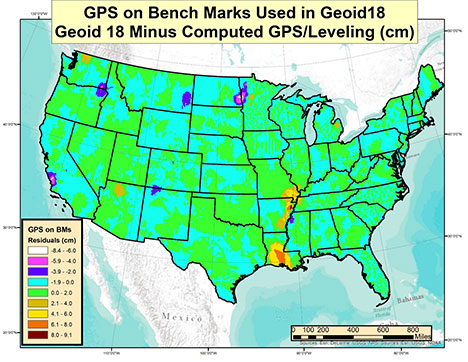
The box titled “Plot of Differences Based on GPS on Bench Marks Used in Geoid18” depicts these differences based on the stations used to generate Geoid18.
Plot of Differences Based on GPS on Bench Marks Used in Geoid18
Image: National Geodetic Survey
Most of the values depicted on the plot are within the +/- 2 cm which is what you’d expect because the standard deviation of the overall fit is 1.4 cm. One to two centimeters is a very reasonable difference between the modeled and computed values. The question someone may ask is, I thought the model should be good to 1.4 cm so why are there large residual values on the map? There are several reasons why some of these differences are large but each case needs to be investigated to determine why they are large. This column will address one region as an example and provide a method for others to investigate differences in their area of interest.
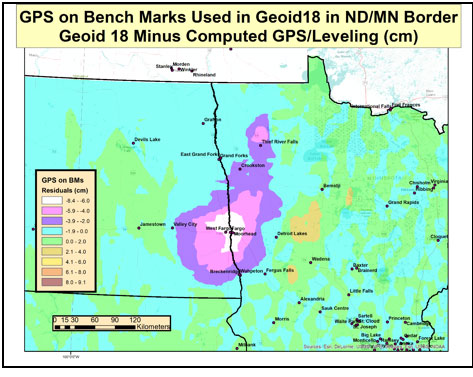
The box titled “Plot of GPS on Bench Mark Differences at the ND/MN Border” depicts a very large difference between the modeled geoid model and the estimated geoid height along the ND/MN border. As indicated in the box, the difference exceeds 6 cm.
Plot of GPS on Bench Mark Differences at the ND/MN Border
Image: National Geodetic Survey
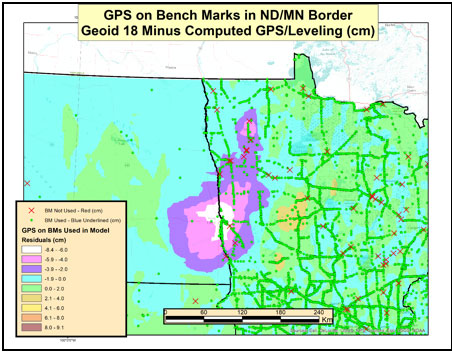
The box titled “Plot of GPS on Bench Mark Stations in the ND/MN Border Region” depict the bench marks involved in the development of Geoid18. The green circles represent the GPSBMs stations used in the creation of Geoid18 and the red “x” denote the stations that were not used in the creation of the model. As indicated in the plot, there were a lot of GPSBMs stations in the State of Minnesota (11,011).
Plot of GPS on Bench Mark Stations in the ND/MN Border Region
Image: National Geodetic Survey
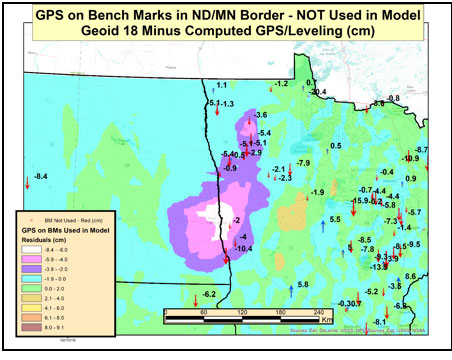
The box titled “Differences on GPS on Bench Marks in ND/MN Border — NOT Used in Model” depict the values of the rejected GPS on BMs stations. These stations were not used to create the hybrid geoid model Geoid18. As the plot indicates there are several large differences. This is not really surprising since these stations were not used in the model.
Differences on GPS on Bench Marks in ND/MN Border — NOT Used in Model
Image: National Geodetic Survey
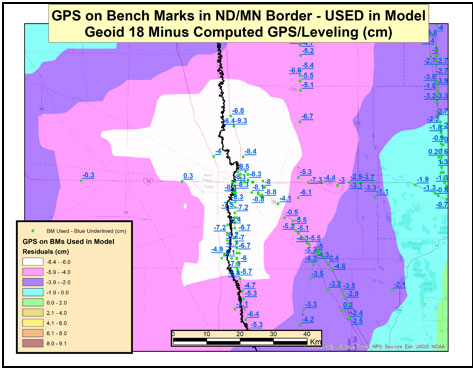
The box titled “Differences on GPS on Bench Marks in ND/MN Border — USED in Model” depict the values of the GPS on BMs stations used to create the Geoid18 model. Some of these differences exceed 8 cm. You would expect these differences to be small since these stations were used to create the model. So, why are there large post-modeled residuals in the Fargo, ND, region of the United States?
Differences on GPS on Bench Marks in ND/MN Border – USED in Model
Image: National Geodetic Survey
In August 2019, NGS performed a large leveling network adjustment in the Minnesota. The adjustment was performed after the Geoid18 database pull. The adjustment resulted in a 7- to 9-cm bias between the published height values and the superseded values. The August 2019 Minnesota leveling network adjustment heights were not used in the creation of Geoid18. The post-modeled differences presented in this column were generated using the published NAD 83 (2011) ellipsoid heights and current NAVD 88 orthometric heights from the NGSIDB. It was determined by NGS that the differences in the Fargo region were mostly due to crustal movement. Therefore, since the differences were due to movement, secondary adjustments will need to be performed to feather the 7- to 9-cm differences to maintain consistency between published NAVD 88 heights in the region. The secondary adjustments have not been completed as of the publication of this column so the residuals west of Fargo in North Dakota are small. These values will change after the secondary adjustment is completed and loaded into NGS’ database.
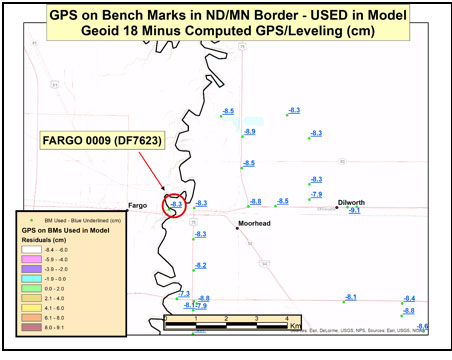
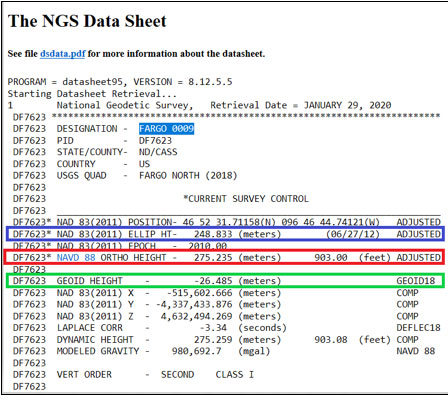
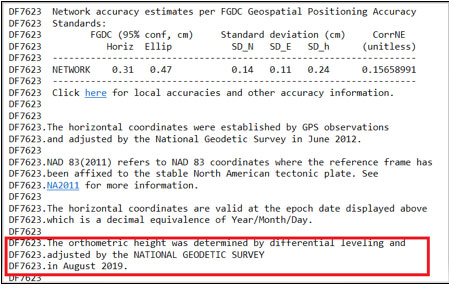
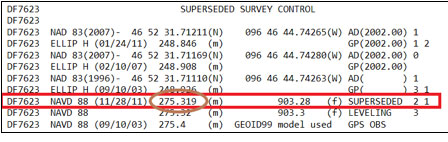
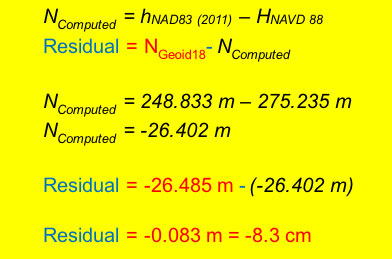
As an example, I’ve highlighted the station Fargo 0009 (PID DF7623) in the area of Fargo, North Dakota (see box titled “Differences on GPS on Bench Marks Near Fargo, ND”). The difference (-8.3 cm) is between the published Geoid18 value and the computed geoid value using the published ellipsoid height and orthometric height from the NGS’ datasheet. The box titled “Excerpt from Datasheet for Station Fargo 0009 (DF7623)” provides the information from NGS datasheet for station Fargo 0009; the information used in the computations are highlighted in the box. The box titled “Computation of the Difference between the Modeled Geoid Value (Geoid18) and the Computed Geoid Value for Fargo 0009” provides the process used to compute all differences for this column.
Differences on GPS on Bench Marks Near Fargo, North Dakota
Image: National Geodetic Survey
Excerpt from Datasheet for Station Fargo 0009 (DF7623)
Data: National Geodetic SurveyData: National Geodetic SurveyData: National Geodetic Survey
Computation of the Difference between the Modeled Geoid Value (Geoid18) and the Computed Geoid Value for Fargo 0009
(Information from NGS Published Datasheet)
Data: National Geodetic Survey
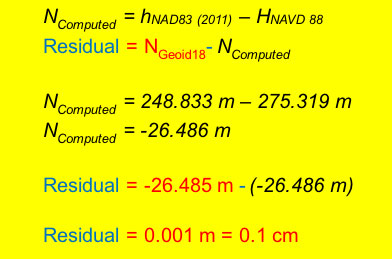
So, why is this difference so large in this region? A stated above, NGS performed a readjustment in this region and superseded the heights that were used in the creation of the Geoid18 hybrid model. The Geoid18 hybrid model used the previously published orthometric heights, now provided in the superseded section of the NGS datasheet, because that was the current published height at the time of the data pull for the Geoid18 process. Therefore, if we substitute the superseded height from the datasheet into the equation the difference is reduced to 0.1 cm (1 mm). [See the box titled “Computation of the Difference between the modeled geoid value (Geoid18) and the computed geoid value for Fargo 0009 Using the Superseded NAVD 88 Value.”]
Computation of the Difference between the modeled geoid value (Geoid18) and the computed geoid value for Fargo 0009 Using the Superseded NAVD 88 Value
(Information from NGS Published Datasheet)
Data: National Geodetic Survey
This means if someone uses NGS’ OPUS web tool to compute a GNSS-derived orthometric height, the NAVD 88 GNSS-derived orthometric height will be about 8 cm different than the published stations in this region. This should not be an issue if the users follow published NGS Guidelines to estimate the NAVD 88 GNSS-derived orthometric height, and/or uses NGS Beta OPUS-Projects and NGS procedures to estimate the NAVD 88 GNSS-derived orthometric height. These processes will ensure that the height will be consistent with the current published NAVD 88 orthometric heights in the NGS database.
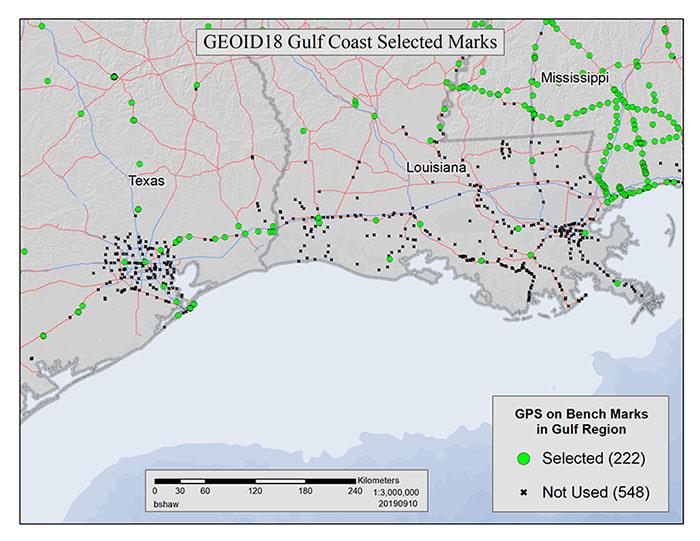
The technical report on Geoid18 provides a good explanation on the stations used in the United States Gulf Coast region. See box titled “GPS on Bench Marks for GEOID18 in the Gulf Coast Region.”
GPS on Bench Marks for GEOID18 in the Gulf Coast Region
There are areas of complex vertical crustal motion in the Texas/Louisiana Gulf Coast region of the United States which render many control station elevations in the region invalid. The selection of GPS on Bench Marks in this region was limited to the small number of marks where the leveling and GPS data agreed to minimize the influence of crustal motion in the hybrid geoid model. Figure 1 depicts the selection of stations used in the hybrid geoid model along the Texas/Louisiana Gulf Coast.
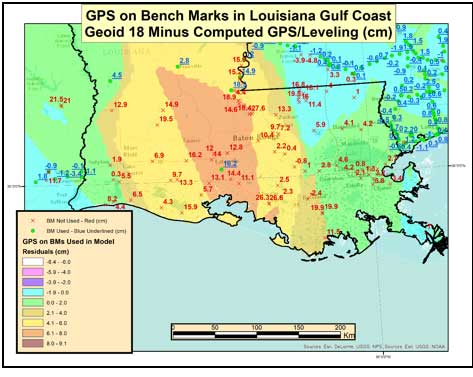
As indicated in the box titled “GPS on Bench Marks for GEOID18 in the Gulf Coast Region” very few stations in Southern Louisiana were used in the creation of the hybrid geoid model. The box titled “Differences on GPS on Bench Marks in the Gulf Coast Region” depict the differences between the published Geoid18 value and the computed geoid value using the latest NAD 83 (2011) ellipsoid and NAVD 88 orthometric height. The plot indicates that there are many large differences. This is to be expected because the orthometric heights used in the creation of the hybrid geoid model are all superseded heights. This is because the only published heights in Southern Louisiana are GNSS-derived orthometric heights and leveling-derived orthometric heights were used in the creation of GEOID18.
Differences on GPS on Bench Marks
in the Gulf Coast Region
Image: National Geodetic Survey
Saying that, NGS performed a large GNSS network project in Southern Louisiana in 2016. At the time of the writing of this column, the GNSS-derived orthometric height from the 2016 project were not yet finalized.
This column provided an analysis of the differences between the latest published hybrid Geoid18 values provided on NGS’ Datasheet and the computed geoid height value using the published NAD 83 (2011) ellipsoid height and NAVD 88 orthometric height. The column highlighted issues on differences due to published heights that have changed since the database pull for Geoid18. Future columns will address differences in other portions of CONUS.
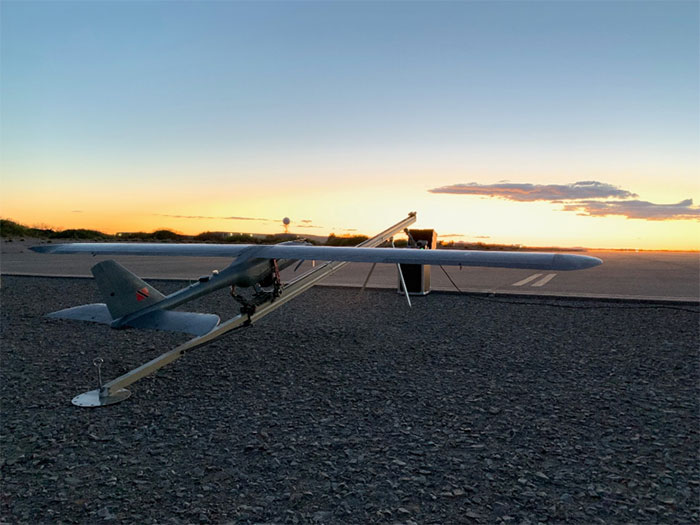
According to the company, the E1 is a solar electric, fixed wing unmanned aircraft system. It has a 20-pound payload capacity and a ceiling of 20,000 feet above ground level. It’s ideal for consumers who do not have the expertise to operate their own UAS, as SFUAS provides full service as well as sales, the company said.
The Silent Falcon E1 features 12 different sensor types, is vibration free and is beyond visual line of sight capable with a live feed. It also boasts four- to 12-hour duration configurations.
In addition, Silent Falcon has an application pending before the Federal Aviation Administration for type certification of the E1.
“Successfully passing 500 hours of flight is a significant milestone for the E1, confirming for federal regulators that it is a safe and durable aircraft model,” Silent Falcon said in a press release.
The full line of SFUAS products, services and support is now available via GSA Contract No. GS07F248BA, the company added.
The International Wireless Communications Expo (IWCE), set to take place March 30 to April 3, will key in a number of industry topics, including 5G, FirstNet, drones, artificial intelligence, augmented reality, wearables and push-to-talk communications.
IWCE will also feature a drone demonstration area and safe cities section. The event is designed for those in the critical communications industry, including first responders, police enforcement, fire departments and government.
According to show organizers, more than 7,000 people are expected to attend the five-day event. IWCE will also include educational workshops, short courses, power sessions, keynote addresses, town hall meetings and networking events. The event tracks will include 5G, safe cities, in-building wireless, connectivity and public safety broadband, among several others.
Chief Jeffrey Johnson, CEO of the Western Fire Chiefs Association, will present the keynote speech, titled “The innovations that are actually changing street performance for responders.” Other speakers will include Bryan Wiens, senior product manager, Cloud Services, InterTalk Critical Information Systems; Michelle Geddes, public safety communications director, city and county of San Francisco’s Department of Emergency Management; Robert Zanger, wireless engineering and operations unit at the Department of Justice; and more.
“Since its inception, IWCE has provided an opportunity for all those who work within the sector to stay ahead of all the latest developments,” said Stacey Orlick, IWCE conference director. “Attendees can learn about the latest developments in safe cities, new infrastructure that affects utilities and transportation, in-building wireless systems, technology advancements and the latest regulatory insights that they should be aware of.”
The U.S. Department of Transportation’s Federal Aviation Administration issued a proposed rule that would require unmanned aircraft systems (UAS) to be identifiable remotely.
The rule, deemed the “Notice of Proposed Rulemaking for Remote Identification,” would apply to all drones that are required to register with the FAA (recreational drones weighing under 0.55 pounds are not required to register), as well as to persons operating foreign civil UAS in the U.S.
“Remote ID technologies will enhance safety and security by allowing the FAA, law enforcement and federal security agencies to identify drones flying in their jurisdiction,” said U.S. Transportation Secretary Elaine Chao.
According to the FAA, nearly 1.5 million drones and 160,000 remote pilots are registered with the administration. Equipping drones with remote identification technologies would build on previous steps taken by the FAA and the UAS industry to safely integrate operations, including the small UAS rule, which covers drones weighing less than 55 pounds, and the Low Altitude Authorization and Notification Capability, which automates the application and approval process for most UAS operators to obtain airspace authorizations, the FAA added.
“As a pilot, my eye is always on safety first,” said FAA Administrator Steve Dickson. “Safety is a joint responsibility between government, pilots, the drone community, the general public and many others who make our nation so creative and innovative.”
The proposed rule will be accompanied by a 60-day comment period to receive public feedback and help the FAA develop a final rule to enhance safety in the skies over the U.S.
A study by Future Market Insights (FMI) said the global geospatial solution market will witness growth at a compound annual growth rate of nearly 15% from 2019 to 2029.
According to the study, this strong growth outlook of the global geospatial solution market has been attributed to the advancements in computing capacity for geospatial solution-based research and applications.
The study highlighted geomedicine as a solution to potentially boost the growth of the geospatial solution market during the following years. Blockchain technology is estimated to witness massive adoption in the foreseeable future, FMI added. This technology can be geospatially enriched when combined with geospatial solution-based technologies such as Geographic Information Systems.
In addition, FMI reported that drones are estimated to witness a considerable adoption rate from 2019 to 2029, especially as new standards and legislations introduced by national governments are likely to motivate drone manufacturers and end users to operate more freely.
The study also determined that GPS is estimated to retain a substantial revenue share in geospatial solution market, and that remote sensing technology will register a significant compound annual growth rate over the projection period, as well.
The demand for geospatial solutions is rising from almost every end-use industry, FMI added, with one of the most noteworthy growth areas in the broad data processing arena being data visualization.
The National Geodetic Survey (NGS) has published a technical report that describes options for how NGS can implement a time-dependent geopotential datum and thus a time-dependent geoid model. My last column described the latest version of NGS’ VERTCON model. As mentioned in the column, NGS is developing these models and tools to support the implementation of the North American-Pacific Geopotential Datum of 2022 (NAPGD2022).
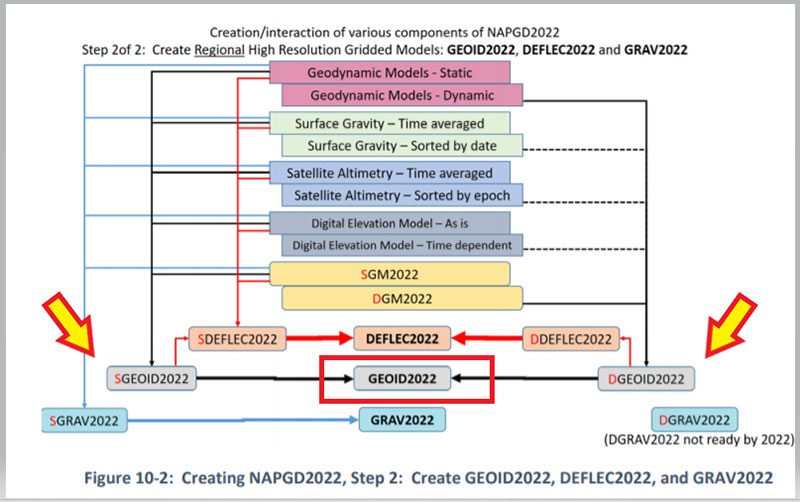
NAPGD2022 is going to be a time-dependent geopotential datum. In other words, the reference geopotential will change over time and therefore the geoid height value will change over time. NAPGD2022 was described in detail in NGS’ publication “Blueprint for 2022, Part 2: Geopotential Coordinates,” and my December 2017 column. Blueprint for 2022, Part 2 states that a gridded geoid model GEOID2022 will be created and it will contain two components:
The first component will be time independent, denoted as the Static Geoid model of 2022 (SGEOID2022).
The second component will be a time-dependent geoid undulation model, encompassing permanent geoid changes greater than or equal to 1 millimeter per year, denoted as Dynamic Geoid model of 2022 (DGEOID2022).
NGS will publish a GEOID2022 value that will be based on both SGEOID2022 and DGEOID2022. As stated in the document, GEOID2022 will be the official zero-height surface for orthometric heights within NAPGD2022, and thus within the NSRS. The box titled “Excerpt from Blueprint for 2022, Part 2, Figure 10-2” is a diagram that describes the process of creating the regional high resolution gridded GEOID2022 model. I have highlighted the GEOID2022 model and its two components, SGEOID2022 and DGEOID2022.
Excerpt from Blueprint for 2022, Part 2, Figure 10-2
Image: National Geodetic Survey
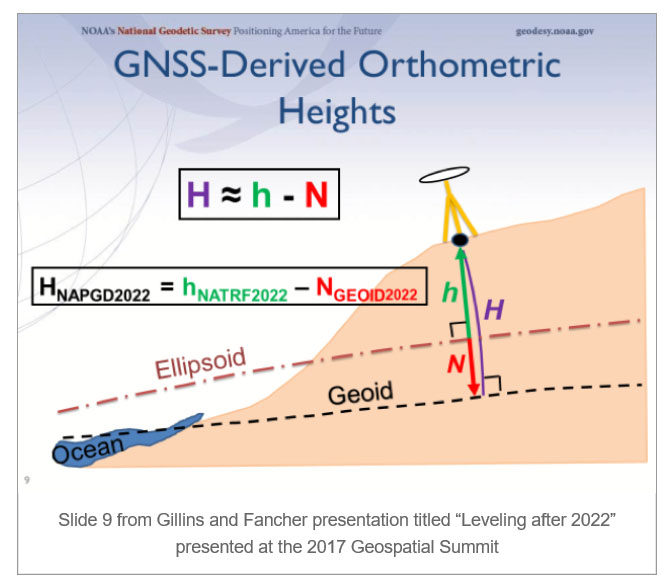
First, it’s important to note the role of the geoid in estimating GNSS-derived orthometric heights. As described in a previous column, GNSS-derived Orthometric Heights are computed using the following formula: orthometric height (H) = ellipsoid height (h) minus geoid height (N). See the box titled “NAPGD2022 GNSS-Derived Orthometric Height.”
NAPGD2022 GNSS-Derived Orthometric Height
Source: Slide 9 from Gillins and Fancher presentation titled “Leveling after 2022” presented at the 2017 Geospatial Summit
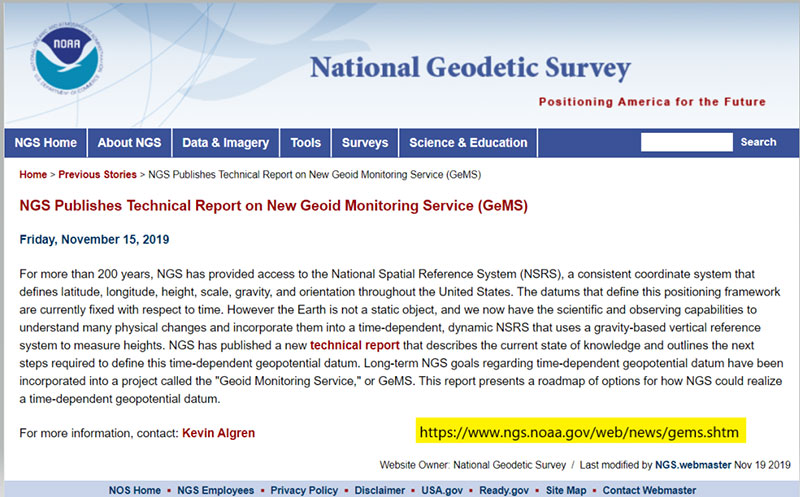
So, what does it take to compute a time-dependent geoid model and what is NGS’ plan to accomplish this project The technical report titled “ A Preliminary Investigation of the NGS’s Geoid Monitoring Service (GeMS)” describes options for how NGS can implement a time-dependent geopotential datum and thus a time-dependent geoid model (See box titled “NGS Publishes Report on GeMS”). The report contains too much information for a single column. This column will highlight some of the sections of the report. The document does contain a lot of technical information and I would encourage everyone to download the document.
The technical report describes the current state of knowledge and outlines next steps required to define a time-dependent geopotential datum for the Nation. NGS created a project called “The Geoid Monitoring Service,” or simply GeMS, to accomplish their long-term goal of establishing a time-dependent geopotential model.
The report addressed the following five topics:
A foundational introduction to the various types of geophysical phenomena that are causing both size and shape change to the geoid,
Geodetic observing techniques that are presently available to monitor geoid change,
An objective evaluation of NGS’s current ability to incorporate these techniques into a long-term monitoring service like GeMS,
Known barriers to accomplishing such a project, and
Potential observing techniques that might become available in the next 10-20 years, but are not currently mature enough for operational use.
The document presents a roadmap of options for how NGS could realize a time-dependent geopotential datum, and how NGS can support the dynamic datum into the future with independent validation surveys and datasets.
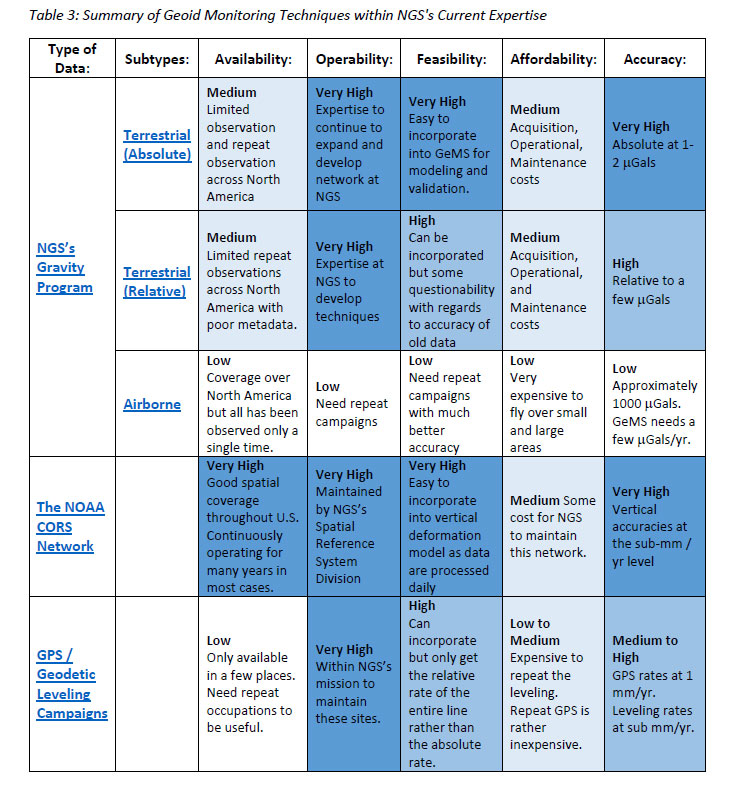
The report discusses the available geoid monitoring techniques that NGS has to support modeling the changes in the geoid. There are three existing NGS program areas and associated technical expertise that could be utilized in an operational GeMS:
NGS’s Gravity Program,
the NOAA CORS Network, and
GPS/geodetic leveling campaigns.
It is noted that individuals these techniques cannot provide 100% of what GeMS requires but combining various programs would be sufficient. The report does a great job of describing these three program areas. The box titled “Summary of Geoid Monitoring Techniques within NGS’ Current Expertise” is Table 3 from the Technical Report. The table list the affordability and accuracy attributes for each of the program areas. NGS’ Gravity Program provides high quality gravity data to internal and external stakeholders. The program provides gravity data required for NGS’s geoid modeling.
Summary of Geoid Monitoring Techniques within NGS’ Current Expertise
Source: National Geodetic Survey
The report provides a good overview of the expertise and instrumentation of NGS’ Gravity Program. The table titled “Summary of NGS’ Terrestrial Gravity Instruments” is a compilation of information on historical methods and instrumentation from the technical report.
Summary of NGS’ Terrestrial Gravity Instruments
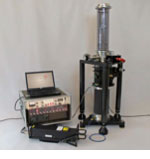
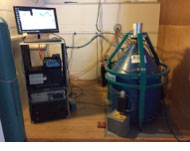
FG5 Absolute Gravimeter. The FG5(X) absolute gravimeter is manufactured by Micro-g LaCoste Inc. in Lafayette, Colorado. It is currently the highest-accuracy, commercially-available absolute gravity meter, with an accuracy of about ±2 μGals. NGS owns and operates instrument number FG5X-102. (Source: National Geodetic Survey)
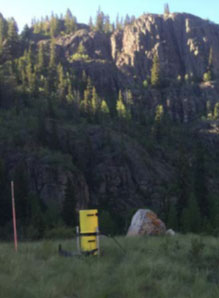
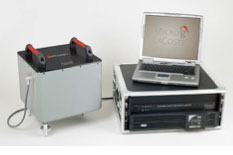
A10 Absolute Gravimeter. A field deployable version of the laboratory FG5 absolute gravimeter, was developed by Micro-g LaCoste in the early 2000’s. This instrument, now known as the A10, operates on principals nearly identical to the FG5 free fall gravimeter. However, the laser used in the A10 system is not a primary standard due to the low power and fragile nature of the Iodine based laser, and does need to be calibrated routinely. (Source: National Geodetic Survey)
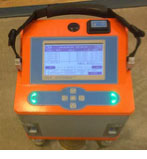
Scintrex CG-6 Relative Gravimeter. The Scintrex CG-6 relative gravimeter is the newest generation of the CG line of quartz sensor relative gravity meters. The CG-6 (like its predecessors the CG-3 and CG-5) operates on the same fundamental theory as the LaCoste and Romberg G and D relative gravimeters, but uses a quartz sensor spring instead of a metal sensor. The primary advantage of a quartz sensor is its insensitivity to instrument shock or vibration that can cause offsets in the gravity measurements. (Source: National Geodetic Survey)
LaCoste and Romberg Relative Gravimeter. LaCoste and Romberg (L&R) relative land, air/sea, borehole, and tidal gravimeters have been manufactured by LaCoste and Romberg Gravity Meters, Inc. since 1959. The company later merged into Micro-g LaCoste, Inc., and the LaCoste land gravimeters were discontinued. Unlike the Scintrex gravimeters, these rely on metal zero-length-springs. (Source: National Geodetic Survey)
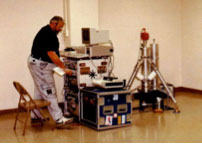
Superconducting Cryogenic Gravimeter. A superconducting cryogenic gravimeter is designed to be continuously monitor relative changes in the local gravity over time. It main applications include precise tidal analysis, ground water monitoring, and geodynamics. The precision of an SG is still unmatched by any other instrument at better than 0.1 μGals at short time scales. (Source: National Geodetic Survey)
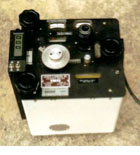
gPhoneX Gravity Meter. The gPhoneX, manufactured by Micro-g LaCoste, is a low (linear) drift, metal spring-based gravimeter. Like the SG, it is designed to measure relative changes in gravity over time, at a fixed location. While not as precise as the SG at short time scales; at periods of longer than a few hours, the noise characteristics of the two instruments are quite similar. The advantages of a gPhoneX compared to a SG for long term monitoring include lower cost, lower power consumption, increased portability, and lack of a requirement for maintaining superconducting temperatures. (Source: National Geodetic Survey)
JILAg Absolute Gravimeter. The AFGL, JILA/IGPP and JILAg series of absolute gravimeters are the out-of-production predecessors to the FG5 gravity meter. These instruments were developed by James Faller and colleagues beginning in the mid-1970s, and were crucial for defining and providing the basis for the IGSN71, NGSGN, and other scientific projects. Agency (now NGA), the University of California at San Diego (IGPP), and NGS. (Source: National Geodetic Survey)
The document highlights something about the United States gravity data that most users don’t think about. That is, gravity values are referenced to a gravity network just like NGS’ published orthometric heights are referenced to the NAVD 88. In the mid-1950s, a coordinated effort was initiated by the International Association of Geodesy (IAG) to make gravimeter ties throughout collaborating parts of the world to support establishment of an International gravity datum.
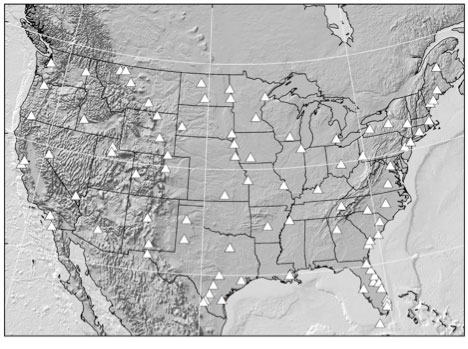
It incorporated intercontinental, north-south, calibration lines and long-distance ties established by airplane. The majority of USA relative gravimeter work was done from 1965 – 1967, resulting in the network shown in the box titled “International Gravity Station Net of 1971 (IGSN71) in CONUS.” The report states that the calculations were completed by Urho A. Uotila of The Ohio State University around 1970.
The gravity network was constrained by a network of ballistic absolute gravimeters. Five of the eight absolute gravimeter sites were in CONUS. It was a world-wide, simultaneous adjustment and published as The International Gravity Standardization Net 1971 (I.G.S.N. 71). A
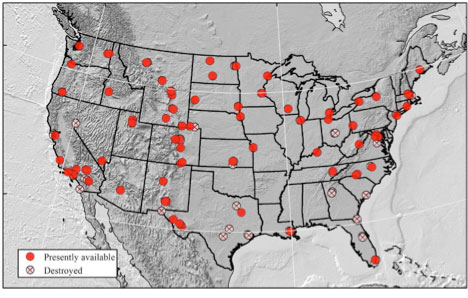
s of December 2019, the IGSN71 remains the official international gravity datum. Many of these stations have been destroyed over the decades, in particular those at passenger airport terminals.
International Gravity Station Net of 1971 (IGSN71) in CONUS
Figure 14: IGSN71 Gravity Stations. (Source: National Geodetic Survey)
In the mid-1970s, NGS was involved in two major readjustment projects, replacement of NAD27 with NAD 83 and the replacement of NGVD 29 with NAVD 88. At the same time, the NGS gravity group were evaluating the gravity data in NGS database and the gravity stations involved in the IGSN71. During the period 1975 and 1979, NGS and NGA (formally DMA) performed relative gravity surveys around CONUS to evaluate the stations.
A report by Robert Moose titled “The National Geodetic Survey Gravity Network” published by NGS in 1986 documents the results of the surveys. This network is denoted as the National Geodetic Survey Gravity Network (NGSGN) and depicted in the box titled “National Geodetic Survey Gravity Network (NGSGN) in CONUS.” The NGSGN was constrained by 8 absolute gravimeter stations and consisted of 232 stations. Differences between NGSGN values and IGSN71 values were computed to evaluate or detect change in gravity values.
The box titled “Gravity Differences between NGSGN and IGSN71 Common Stations” depict these differences. The report states “In summary, the gravity differences between NGSGN and IGSN are generally small and many of the larger differences may be due to vertical motion.
National Geodetic Survey Gravity Network (NGSGN) in CONUS
Figure 16: Difference between NGSGN and IGSN71 AG values [mgal] (Source: National Geodetic Survey)The basic rule of thumb for estimating land movement using gravity changes is: 1 meter of change equals 0.3086 mgals (1 cm of change equals 0.003086 mgals). It should be noted that a positive difference in gravity in the figure indicated apparent subsidence. As stated by the 1986 report by Moose, the large difference in Houston-Galveston region is most likely due to subsidence.
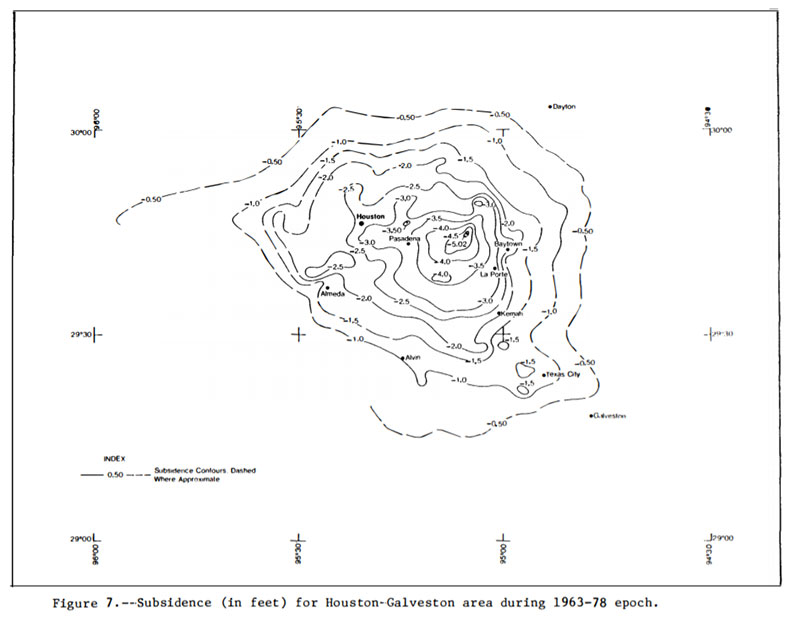
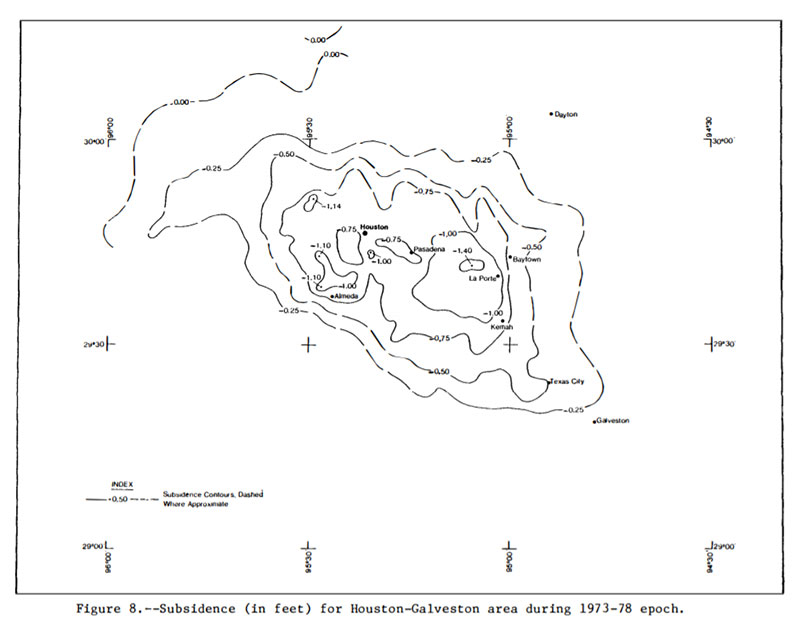
A report documenting the apparent movement in the Houston-Galveston region was published by NGS in 1980. The boxes titled “ Estimate of Subsidence in Houston-Galveston Area During 1963-78 Epoch” and “Estimate of Subsidence in Houston-Galveston Area During 1973-78 Epoch” provide estimates of the movement in the region that include the same epoch of the two gravity networks. These two plots agree with the summary statement in the 1986 report.
Estimate of Subsidence in Houston-Galveston Area During 1963-78 Epoch
NOTE: 30 cm approximately equals to 1 foot (Source: National Geodetic Survey)
What does all this mean to the geoid? Accurate and current gravity data are critical to the development of an accurate geoid model that includes estimating changes in the geoid model over time.
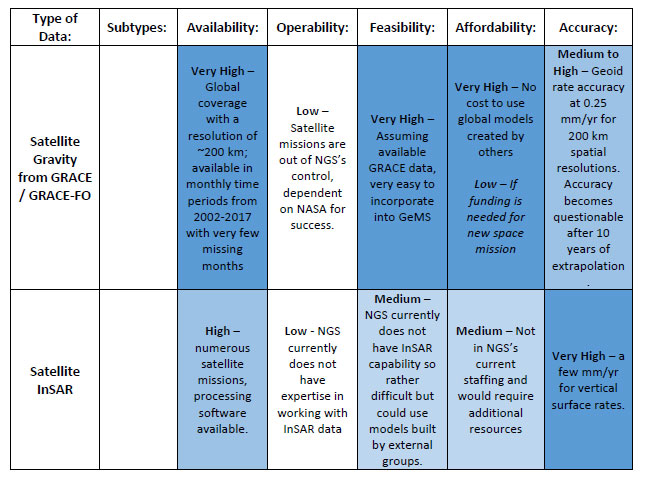
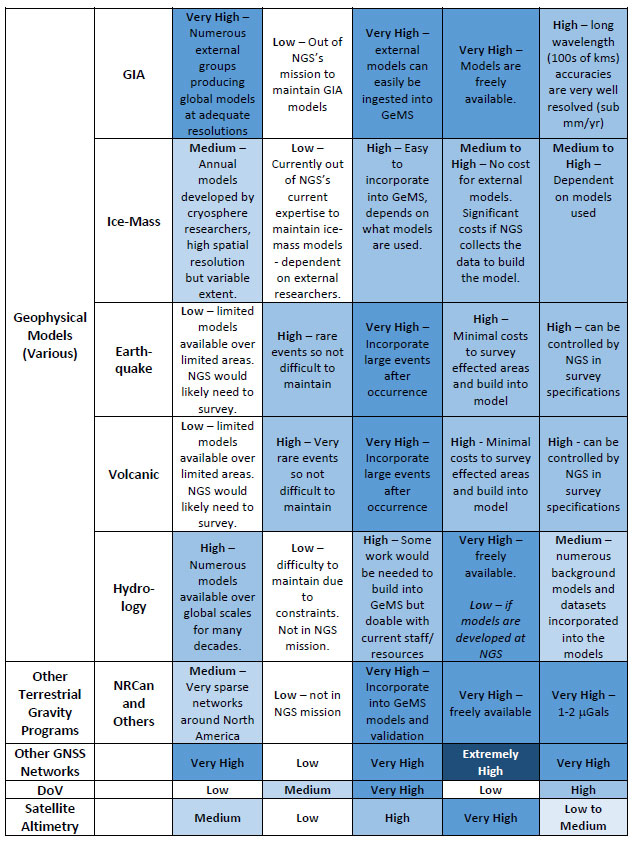
The technical report on NGS’ Geoid Monitoring Service (GeMS) describes geodetic and geophysical techniques that are currently known to NGS and show promise for GeMS (see the box titled “Summary of Known Geoid Monitoring Techniques that are currently outside of NGS’s Expertise). It should be noted that all of these techniques rely on a non-NGS entity to create a product (such as a model or dataset) that NGS can utilize in their products and services. This is nothing new; NGS leverages partnerships for other products such as the GOCO05S satellite gravity model produced by an ESA consortium led by the Technical University of Munich. This model is used by the NGS geoid team in static geoid modeling.
Summary of Known Geoid Monitoring Techniques that are currently outside of NGS’s Expertise
(Source: Table 7 from Technical Report NOS NGS 69)
Continuation of Summary of Known Geoid Monitoring Techniques that are currently outside of NGS’s Expertise
(Source: Table 7 from Technical Report NOS NGS 69)
As apparent by all of the types of data required to monitor the geoid, NGS has a challenging task to establish a Geoid Monitoring Service. Why is it important to invest resources to monitor the geoid? Analyzes of temporal satellite gravity missions provide changes in gravity values that can be use to create changes in the geoid. The GRACE (Gravity and Climate Experiment) satellite mission was designed to provide the temporal gravity field variations throughout its mission (duration 2002 – 2017). There are analysis centers that produce models using the GRACE data – University of Texas at Austin Center for Space Research (UTCSR), NASA Jet Propulsion Laboratory (JPLEM), and GFZ German Research Center for Geosciences (GFZOP). Release 6 denoted as RL06 is the most current GRACE data from these groups.
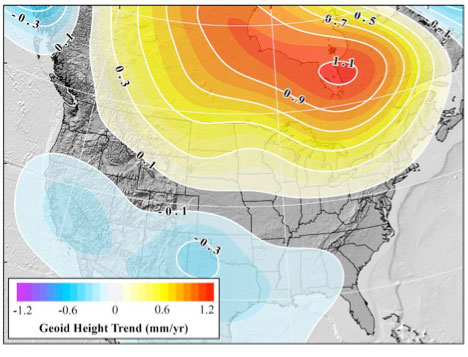
The data can be used to illustrate the magnitudes and resolutions that GRACE models provide to the seculargeoid rates for CONUS and Alaska. The boxes titled “GRACE Trend over CONUS from UTCSR RL06” and “GRACE Trend over Alaska from UTCSR RL06” are plots from Technical Report NOS NGS 69 that show these secular geoid trends from UTCSR-RL06. The plots indicate very small changes in the geoid but they are significant if the goal is to monitor the geoid model to the mm/year level.
GRACE Trend over CONUS from UTCSR RL06
Figure 27: GRACE Trend over CONUS from UTCSR RL06 Model [mm/yr] (Source: Figure 27 from Technical Report NOS NGS 69)
GRACE Trend over Alaska from UTCSR RL06
Figure 28: GRACE Trend over Alaska from UTCSR RL06 GRACE Model [mm/yr] (Source: Figure 28 from Technical Report NOS NGS 69)Another product available from various processing centers are surface mass concentrations (mascons) as observed by the GRACE satellites. Once again, these mascons can be used to generate a secular geoid rate. The boxes titled “Geoid rate over CONUS based on the GSFC mascon model” and “Geoid rate over Alaska from GSFC mascon model” are plots from Technical Report NOS NGS 69 that provide the secular geoid rate based on the NASA GSFC mascon model. Once again, the plots indicate very small changes in the geoid but there is a systematic change to the geoid based on the analysis of the data from the GRACE mission.
Geoid rate over CONUS based on the GSFC mascon model
Figure 32 From Technical Report NOS NGS 69: Geoid rate over CONUS based on the GSFC mascon model [mm/yr] (Source: Figure 32 From Technical Report NOS NGS 69)
Geoid rate over Alaska from GSFC mascon model
Figure 33 From Technical Report NOS NGS 69: Geoid rate over Alaska from GSFC mascon model [mm/yr] (Source: Figure 33 From Technical Report NOS NGS 69)The report stated that when considering monitoring the geoid, the greatest change to the geoid from glacial isostatic adjustment (GIA) processes is centered in northern Canada, but there is “still a significant geoid height trend in the Northern Plains, Great Lakes, and Northeast regions of CONUS.”
It was noted that if GIA processes are not considered, a 1 cm error in the geoid undulation would occur within 18 years. NADGPD2022 orthometric heights are going to be established using a NATRF2022 ellipsoid height and a GEOID2022 geoid height. This is why the geoid needs a time-dependent component.
This column highlighted NGS new Geoid Monitoring Service (GeMS); and, that NGS’ will be publishing a gridded geoid model GEOID2022 that will contain two components:
The first component will be time independent, denoted as the Static Geoid model of 2022 (SGEOID2022) and
The second component will be a time-dependent geoid undulation model, denoted as Dynamic Geoid model of 2022 (DGEOID2022).
NGS will publish a GEOID2022 value that will be based on both SGEOID2022 and DGEOID2022. The column provided examples of how GRACE data can be used to illustrate the magnitudes of secular geoid rates for CONUS and Alaska.
SBG Systems‘ Raphaël Siryani discusses the company’s product line at Intergeo 2019, which took place Sept. 17-19 in Stuttgart, Germany. Siryani also explains the features of SBG Systems’ Horizon, a FOG-based high performance inertial measurement unit (IMU) designed for large hydrographic vessels surveying harsh environments.
Trimble Clarity features cloud integration and support for 3D point cloud, imagery and mesh model formats. (Photo: Trimble)
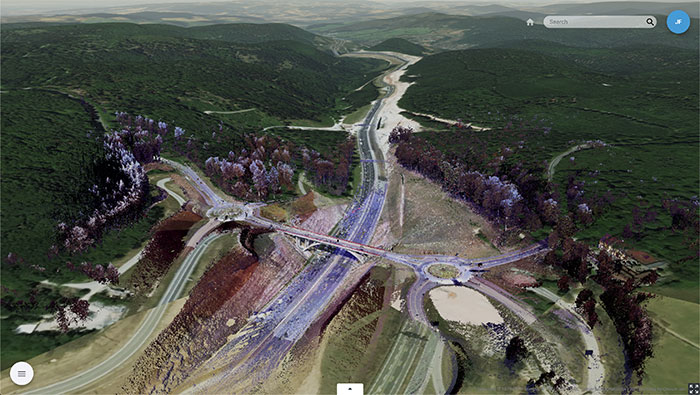
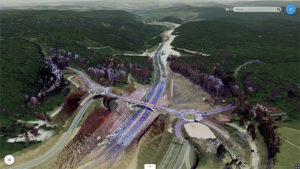
Trimble’s browser-based viewer Trimble Clarity is now offered as a stand-alone web application, designed to simplify the visualization and navigation of 3D data.
According to the company, Trimble Clarity enables geospatial professionals to view, use and share 3D point cloud data, models and meshes with engineers, architects, city planners and other project stakeholders via a web browser, which can be viewed on desktop and mobile devices.
The Trimble Clarity web application allows users to generate private or public web links to share project information and 3D data. It also supports data from Trimble products, such as the Trimble SX10 scanning total station, Trimble TX Series 3D scanners and Trimble MX9 mobile mapping system, as well as data from non-Trimble sources.
In addition, with the upcoming version of Trimble Business Center office software 5.20, users can publish their 3D data directly into Trimble Clarity, creating a seamless integration and workflow between both platforms. Trimble Clarity provides a visual directory, which allows users to view 3D data as location-based projects.
Trimble Clarity also features cloud integration and support for 3D point cloud, imagery and mesh model formats.
“Trimble Clarity enables users to easily share and view rich 3D point clouds without having to transfer, copy or mail large data sets,” said Tim Lemmon, marketing director of Trimble Geospatial. “By leveraging an intuitive, browser-based experience, stakeholders can easily visualize and understand project data, enabling greater collaboration and informed decision making.”


 The International Wireless Communications Expo (IWCE), set to take place March 30 to April 3, will key in a number of industry topics, including 5G, FirstNet, drones, artificial intelligence, augmented reality, wearables and push-to-talk communications.

![Figure 16: Difference between NGSGN and IGSN71 AG values [mgal] (Source: National Geodetic Survey)](https://stage.globalpositioningnews.com/wp-content/uploads/zilkoski-december-2019-column-image-14.jpg)
![Figure 28: GRACE Trend over Alaska from UTCSR RL06 GRACE Model [mm/yr] (Source: Figure 28 from Technical Report NOS NGS 69)](https://stage.globalpositioningnews.com/wp-content/uploads/zilkoski-december-2019-column-image-20.jpg)
![Figure 32 From Technical Report NOS NGS 69: Geoid rate over CONUS based on the GSFC mascon model [mm/yr] (Source: Figure 32 From Technical Report NOS NGS 69)](https://stage.globalpositioningnews.com/wp-content/uploads/zilkoski-december-2019-column-image-21.jpg)
![Figure 33 From Technical Report NOS NGS 69: Geoid rate over Alaska from GSFC mascon model [mm/yr] (Source: Figure 33 From Technical Report NOS NGS 69)](https://stage.globalpositioningnews.com/wp-content/uploads/zilkoski-december-2019-column-image-22.jpg)