Category: Applications

  • Safety testing in indoor and challenged environments

    Safety testing in indoor and challenged environments

    A GPS-like ground-based technology teamed with inertial measurement and driving robots to deliver the necessary accuracy when obstructions knocked out GPS as a reliable sole sensor.

    By David Aylor, Insurance Institute for Highway Safety
    Andrew Pick, Anthony Best Dynamics Ltd.
    Paris Austin and Martin Parry, Oxford Technical Solutions Ltd.

    Consumer information organizations like the Insurance Institute for Highway Safety (IIHS) design test procedures to compare different automobile manufacturers’ safety systems. The test equipment must be repeatable and as independent as possible of time of day, weather conditions or test-driver behavior.

    In 2015 IIHS completed a $30 million expansion of the Vehicle Research Center (VRC), its centerpiece a 5-acre fabric-covered track, to allow testing to continue rain or shine. It is complemented by an outdoor track for a total area of 15 acres.

    IIHS rates crash prevention systems such as Forward Collision Warning (FCW) and Automatic Emergency Braking (AEB), and looks at how well those systems can identify road users like pedestrians and bicyclists.

    To simulate real-life potential crashes for safe, accurate and repeatable testing, the Institute has been researching robotic equipment to automate some of the driving tasks.

    While the covered track offered much needed all-weather testing capability, it introduced a challenge for the standard high-accuracy GPS/GNSS equipment used for testing. IIHS operates a multi-frequency GNSS base station with real-time corrections. High-accuracy position, velocity and time (PVT) and other relevant parameters from these GPS units are required for testing and are essential for operating robotic test equipment.

    However, tests on the covered track clearly showed the equipment was not delivering the required accuracy, reliability and repeatability: the steel trusses of the covered track roof were a sufficient obstruction to GNSS signals.

    Locata. Locata provides an RTK GPS-like positioning capability utilizing ground-based transmitters which precisely time-synchronize to one another using their proprietary ranging signals without the need for cables or atomic clocks. This delivers centimeter-level accuracy with very high reliability, in networks of strategically placed, static LocataLites (LLs).

    The IIHS Locata network was deployed with 16 LLs covering both open and covered test tracks (Figure 1). The network meets two key requirements: accuracy of 10 cm or better at 95% confidence and a very high degree of repeatability with a service availability (defined as meeting the above requirement) of better than 95% of the time.
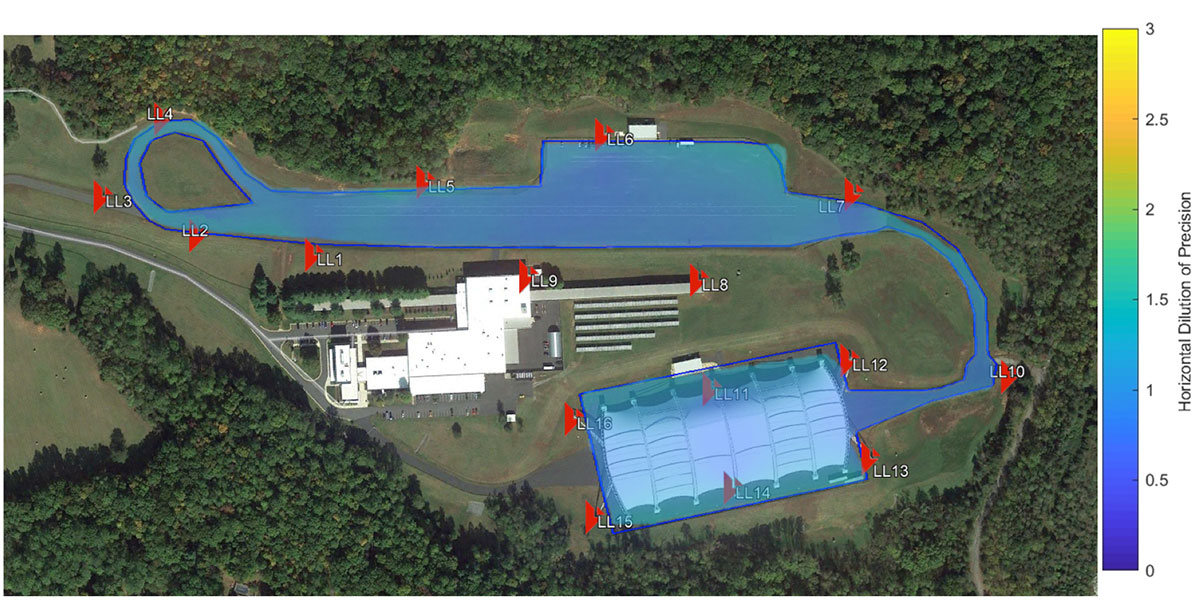
    FIGURE 1. VRC Locata Network and HDOP Quality in Locata Service Area. (Figure: D. Aylor, A. Pick, P. Austin and M. Parry)
    FIGURE 1. VRC Locata Network and HDOP Quality in Locata Service Area. (Figure: D. Aylor, A. Pick, P. Austin and M. Parry)

    AB Dynamics. Anthony Best Dynamics supplies driving robots for the design, development and testing of automotive technology. Driving robots precisely and accurately control the vehicle steering wheel, brake and throttle pedals with a level of repeatability that vastly exceeds that achieved by human test drivers. When coupled with an accurate position measurement sensor the possibility of centimeter accurate path-following control becomes reality.

    In ABD path-following control software, motion data is collected from a Locata/INS integration unit at 100 Hz and fed back to the robot’s path-following controller. The path-following controller employs a speed-dependent look-ahead algorithm that not only maintains the vehicle heading but allows centimeter-accurate path control.

    OxTS. Oxford Technical Solutions specializes in the design and manufacture of GNSS-aided inertial navigation systems (GNSS/INS) for automotive testing.As well as one-centimeter position accuracy, OxTS systems measure movement in all vehicle-axes at up to 250 Hz.

    Systems that only rely on inertial measurements are also prone to drift with time, so OxTS products are GNSS-aided; several other inputs can be used alongside the inertial measurement platform to create a hybrid system where each technology mitigates weaknesses in others.

    The Locata network and associated receivers are configured to use the same time and coordinate frame as GPS so the measurements are identical to that of a GPS receiver. The OxTS system then uses this information as it would normally and is able to output accurate and reliable vehicle measurements while maintaining excellent position accuracy.

    Measurements can be utilized by other equipment such as driving robots or logged for post-processing. Raw measurements are also logged internally so the data can be downloaded and reprocessed post-test, to test different scenarios or make other changes.

    The driving robots have steering and pedal actuators that can be quickly installed without the need to make modifications to the vehicle as shown in Figure 2. Even with the robots installed, the steering wheel, throttle and brakes remain accessible to a human driver. At the heart of the robot is a dedicated real-time controller, which coordinates the steering and pedal robots and captures data at 1000 Hz.
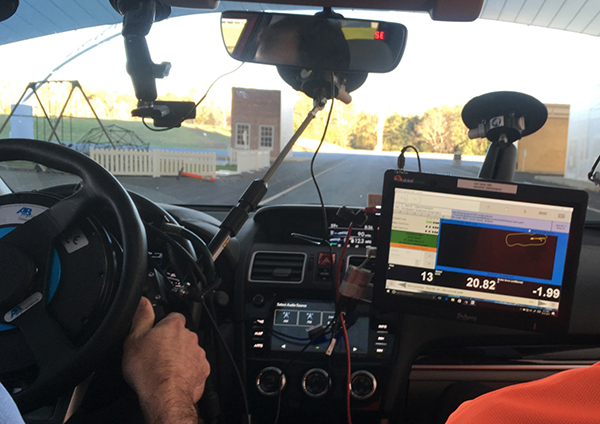
    FIGURE 2. Driving robot. (Figure: D. Aylor, A. Pick, P. Austin and M. Parry)
    FIGURE 2. Driving robot. (Figure: D. Aylor, A. Pick, P. Austin and M. Parry)

    Locata and OxTS units were installed in a rear passenger seat. The Locata antenna was roof-rack-mounted on a ground plane, approximately aligned with the centerline of the vehicle. The roof rack contained a second Locata antenna connected to a second Locata receiver. This was used for post-processing accuracy analysis of the fixed baseline (distance) between the two Locata antennas.

    Test procedure

    The automation kit enables the vehicle to be driven in manual mode and record scenarios for later replay. Drive scenarios can also be created in the user interface using basic geometric shapes and designate start, end or special maneuvering points within drives.

    A local two-dimensional coordinate frame can be created with or without alignment to a global coordinate system. Each scenario may be replayed at various speed settings. For instance, most scenarios described later were replayed multiple times at different speed settings, often incrementing in fixed steps from a low speed such as 10 Km/hr.

    The demonstration platform was driven in various driving patterns on both test tracks. Figure 3 shows these patterns as a map derived from reported vehicle positions during the repeats of each scenario.
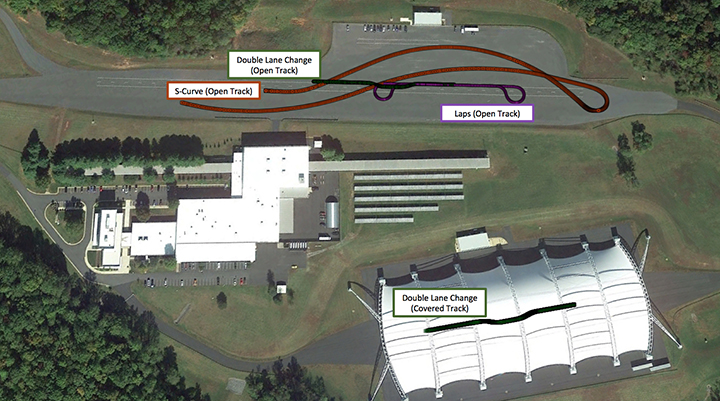
    FIGURE 3. Test Scenarios.(Figure: D. Aylor, A. Pick, P. Austin and M. Parry)
    FIGURE 3. Test Scenarios.(Figure: D. Aylor, A. Pick, P. Austin and M. Parry)

    The Double Lane Changes (DLCs) conducted on both tracks resemble the driving pattern needed for testing most collision-avoidance and lane-change features. The S-curve is a driving pattern used for the IIHS headlight evaluations.

    Analysis and results

    Data analysis was focused on characterizing the accuracy and repeatability of the automated test setup as a complete system first and then Locata alone as the core positioning system. As the first step, data from two full days of testing were reduced to repetitions of the various driving patterns shown in Figure 3. Start and end times of each repetition were extracted from AB Dynamics systems and corresponding Locata system data was further processed to generate the results shown here.

    The foundation for highly repeatable control system and positioning accuracy is to have a highly reliable network that delivers repeatable DOPs and number of ranging signals at any given track location. Repeatability of the numbers of LLs seen and the HDOPs were investigated for this purpose. Shown in Figure 4 is the actual number of LLs observed and the resulting HDOP during the five repeats of the DLCs done at 45 km/h in the covered track.
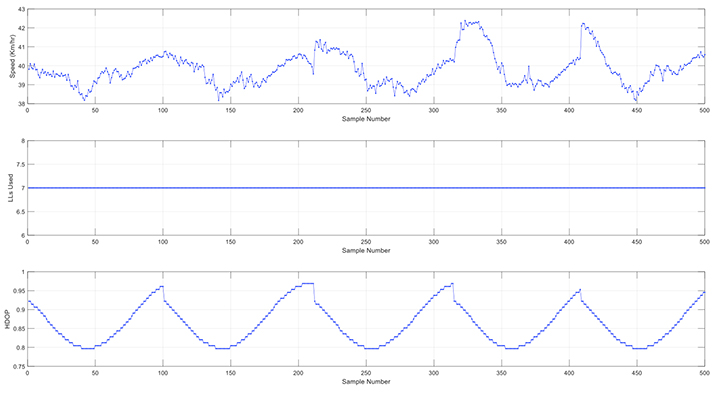
    FIGURE 4. HDOP & LL Count in Double Lane Change at 45 km/h (Covered Track). (Figure: D. Aylor, A. Pick, P. Austin and M. Parry)
    FIGURE 4. HDOP & LL Count in Double Lane Change at 45 km/h (Covered Track). (Figure: D. Aylor, A. Pick, P. Austin and M. Parry)

    The number of LLs used remain constant at seven as expected and the HDOP change resulting from the motion repeats for each of the repetitions. Shown in Figure 5 are similar plots for the seven repetitions of the Lap scenario done at 20 km/h in the open track. In these, the LLs used vary between 8 and 9, with the drop happening at one end of the lap. Although slight variations can be seen in the times of the drops due to the varying speed of the vehicle during the turns, the HDOP pattern repeats consistently for all seven repetitions.
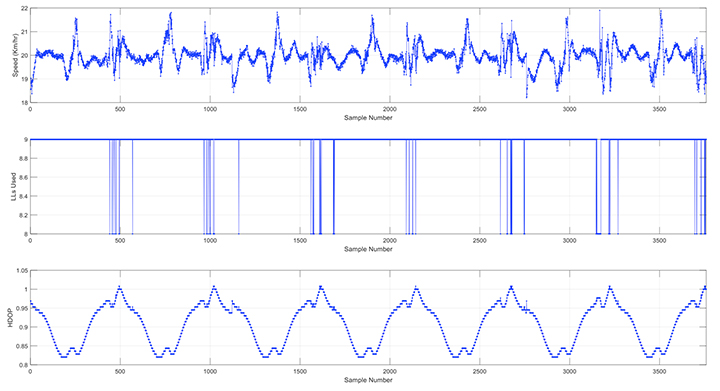
    FIGURE 5. HDOP & LL Count in Lap at 20 km/h (Open Track). (Figure: D. Aylor, A. Pick, P. Austin and M. Parry)
    FIGURE 5. HDOP & LL Count in Lap at 20 km/h (Open Track). (Figure: D. Aylor, A. Pick, P. Austin and M. Parry)

    Analysis of the 48 DLC repetitions from the covered track is presented in Figure 6. Locata position data from all repetitions were averaged along the drive path to estimate a best fit path and the deviation from this was estimated (top subplot). The best fit path allows the estimation of the run-to-run deviation of the vehicle path. The middle subplot shows the mean and standard deviation of cross track error (or spread) of all the repetitions compared to the best fit path.
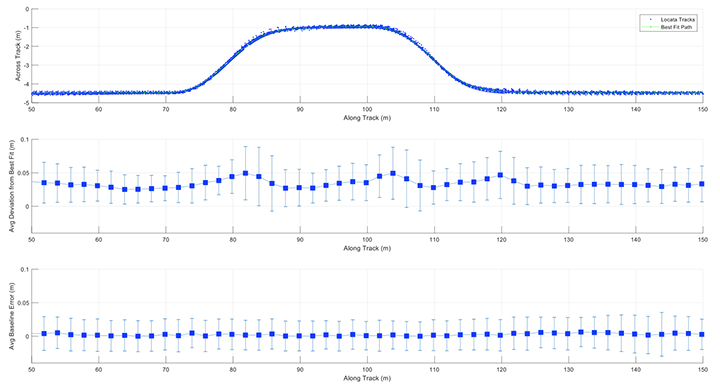
    FIGURE 6. Covered Track Double Lane Change Performance Statistics. (Figure: D. Aylor, A. Pick, P. Austin and M. Parry)
    FIGURE 6. Covered Track Double Lane Change Performance Statistics. (Figure: D. Aylor, A. Pick, P. Austin and M. Parry)

    Despite the 48 DLC repetitions being carried out across a range of speeds (10-45 km/h) a high level of repeatability was measured. In straight segments the control system was able to repeat all the runs with below 4 cm of mean deviation from each other. This increases to 5 cm during turns due to the increasing lateral acceleration at higher speeds. The standard deviation also follows the same pattern, remaining below 3 cm during the straight-line segments and increasing up to 5 cm during the turns. The bottom plot shows the mean and standard deviation of the baseline error measured between the two Locata antennas on the vehicle.

    Locata baseline error from repetitions of all scenarios were then used to estimate a probability distribution function (PDF) to assess the Locata positioning system performance alone. This included close to 180,000 data points from around 5 hours of automated driving in various parts of the IIHS tracks. Resulting PDF is shown in Figure 7.

    FIGURE 7. [Brown] Locata position accuracy ±3 cm (95%) using the fixed baseline between two independently operating antenna-receiver pairs in the vehicle (5 hrs of automated driving on both tracks). [Blue] ABD system repeatability ±6 cm (95%) using across track error from 48 repetitions of the Double Lane Change maneuver on the Covered Track. (Figure: D. Aylor, A. Pick, P. Austin and M. Parry)
    FIGURE 7. [Brown] Locata position accuracy ±3 cm (95%) using the fixed baseline between two independently operating antenna-receiver pairs in the vehicle (5 hrs of automated driving on both tracks). [Blue] ABD system repeatability ±6 cm (95%) using across track error from 48 repetitions of the Double Lane Change maneuver on the Covered Track. (Figure: D. Aylor, A. Pick, P. Austin and M. Parry)
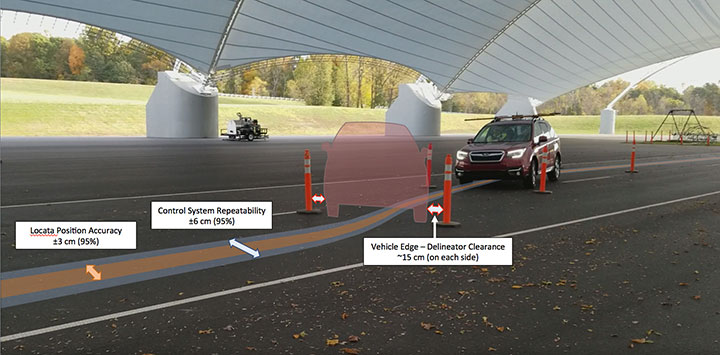
    This baseline error PDF gives a positioning accuracy of ±3 cm at 95% for the Locata position system, exceeding the IIHS requirement for positioning of 10 cm at 95% (Figure 8). The control system repeatability itself shows ±6 cm at 95%, better than IIHS expectation for positioning system alone.

    FIGURE 8. Covered track automated double-lane change (DLC) test. Fully automated path following with two back-to-back lane changes through traffic delineators set 15 cm from the sides of the vehicle. Drop-in control system repeatability of ±6 cm (95%) achieved using Locata positioning accuracy of ±3 cm (95%) through 48 repetitions at speeds ranging from 10 to 45 km/hr. (Figure: D. Aylor, A. Pick, P. Austin and M. Parry)
    FIGURE 8. Covered track automated double-lane change (DLC) test. Fully automated path following with two back-to-back lane changes through traffic delineators set 15 cm from the sides of the vehicle. Drop-in control system repeatability of ±6 cm (95%) achieved using Locata positioning accuracy of ±3 cm (95%) through 48 repetitions at speeds ranging from 10 to 45 km/hr. (Figure: D. Aylor, A. Pick, P. Austin and M. Parry)

    Conclusion

    The IIHS, one of two organizations in the United States that issue public crash safety ratings, is using Locata, a GPS-like local positioning system, under a canopy-covered test track that doesn’t have RTK-capable GNSS signal visibility.

    Precise positioning from Locata integrated with INS by OxTS demonstrates automated path following with centimeter-level repeatability using driving robots from AB Dynamics. The authors thank and acknowledge the Locata team for the excellent support provided throughout the project.
  • US wildfires mapped and placed in context

    US wildfires mapped and placed in context

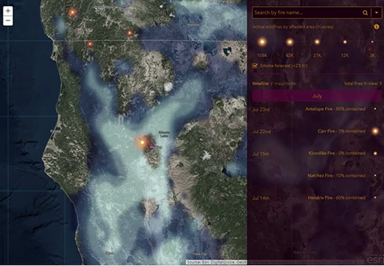
    An Esri Storymap provides a quick snapshot of the raging fires across the United States and provides context to the severity of the California fires.

    The interactive map can be explored by panning and zooming. Click on a fire and information about that particular fire is displayed including the start date, containment and links to the latest news and social information.

    Esri Story Maps let users combine authoritative maps with text, images and multimedia content. It harnesses the power of maps and geography to tell a story in an easy and understandable format, the company said.

    The Story Map uses the ArcGIS Javascript API and is linked to interactive timelines and magnitude displays. The cartography uses AGOL Firefly symbology — radial gradients — and a dark basemap.

    The fires and perimeters are a service of the GeoMAC community that uses the Geospatial Multi-Agency Coordination, an internet-based mapping application that is designed for fire managers to access online maps of current fire locations and perimeters in the United States.

    Members of GeoMAC include:

    • U.S. Geological Survey
    • National Interagency Fire Center
    • National Weather Service
    • Bureau of Land Management
    • Remote Sensing Application Center
    • National Geophysical Data Center.

    The data is updated manually based on information from a host of sources including those on the ground. Typically, the data is fresh to about 24 hours, but there is variability because it is a carefully curated process.

    Diving deeper for information

    Esri has updated the app based on feedback from many different groups including firefighting professionals, those directly affected by fires, and those concerned about loved ones affected by fires. Some of the updates include the addition of the National Weather Service (NWS) animated smoke risk forecast, visualized to more directly represent smoke (see below).

    The NWS animated smoke risk forecast is now integrated into Esri's Story Map app. (Screenshot: Esri)
    The NWS animated smoke risk forecast is now integrated into Esri’s Story Map app. (Screenshot: Esri)

    Another is the addition at finer scales of satellite-detected hot spots to indicate fire direction — sensors. Many Earth-observing satellites contain sensors capable of detecting the infrared energy released by fires. Not only can the hotspots be located, but areas of burned land can also be identified based both on their thermal characteristics and visible appearance. In Esri’s ArcGIS Living Atlas of the World, the MODIS Thermal Activity layer provides daily updated global hotspot locations.

    In the U.S., the USA Wildfire Activity layer in the Living Atlas provides a more quality controlled version of the data. It shows only wildfires submitted to the USGS by fire agencies, as opposed to all of the other events that can cause an automated satellite-based hotspot detection. However, since this layer relies on human analysis, sometimes it doesn’t update as frequently as the MODIS hotspots. The layer also contains the perimeter of the fire area. Both current (active) and older (inactive) fires are included.

    While the weather-focused satellites from NOAA and NASA provide high temporal resolution fire data, really detailed analysis of the fire impact is often left to moderate resolution multispectral imaging satellites such as Landsat 8 and Sentinel-2, or commercial high-resolution satellites. That is the benefit of the multispectral capabilities of the Sentinel-2 satellite, now available in the Living Atlas. Sentinel-2’s infrared sensitivity (Channel 12; 2.19 micron band) provides the ability to identify areas of active fires, much like NOAA-20 or Aqua/Terra, but at 20m resolution.

    In addition to visualizing active fire areas, multispectral imagery is also effective at assessing burn scars. Besides the ecosystem impact, denuded vegetation along sloped areas can lead to landslides, especially when combined with heavy rains.

  • Launchpad: Cyber attack prevention, autonomous vans

    A roundup of recent products in the GNSS and inertial positioning industry from the August 2018 issue of  GPS World magazine.

    OEM

    IP Solution

    With multi-constellation GNSS for internet of things (IOT) devices

    The Dragonfly NB2 is a highly integrated and modular IP (internet protocol) solution optimized for Cat-NB2 (3GPP Release 14 eNB-IoT) that can seamlessly be incorporated into chips and modules by the multitude of companies looking to address the large and fast-growing cellular IoT space. GNSS hardware package. For customers developing NB-IoT products that also require GNSS capabilities, Ceva-Dragonfly NB2 includes a new power-optimized GNSS hardware package, with GNSS RF receiver and multi-constellation digital front-end. The GNSS package speeds up both acquisition and tracking tasks by up to 8 times compared to Ceva-Dragonfly NB1, enabling a host of popular NB-IoT use cases, including people, livestock and asset tracking and geofencing.

    CEVA, ceva-dsp.com

    Time clock system

    Provides timing accuracy and stability when GNSS signal is lost

    Photo: Oscilloquartz
    Photo: Oscilloquartz

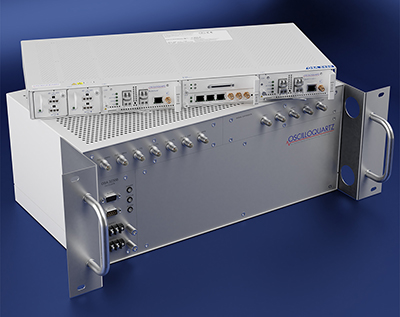
    Oscilloquartz has launched its enhanced primary reference time clock (ePRTC) system to enable a high level of timing accuracy and stability, even when the GNSS signal is lost. The system provides a timing source for mission-critical transport systems, such as utility networks, government infrastructure and radio access networks, and provides the strict synchronization needed for LTE-A and 5G applications. Featuring the OSA 3230B ePRC atomic cesium clock connected to an Oscilloquartz clock combiner and grandmaster, the new solution offers the extremely stable frequency of a cesium clock with the UTC-traceable signal provided by GNSS. When combined with the OSA 5430, the OSA ePRTC system provides full hardware redundancy and multiple fan-out options including PTP over 10 Gbit/s.

    Oscilloquartz, oscilloquartz.com

    Antenna receiver modules

    compatible with GPS, GLONASS, Beidou and Galileo

    Photo: Telit
    Photo: Telit

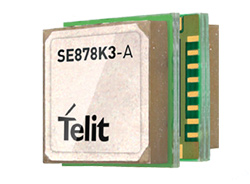
    The SE878Kx-A series of GPS and GNSS integrated antenna receiver modules offer high performance, maximum reliability and low power consumption for consumer and business applications. The SE878K3-A and SE878K7-A are compatible with GPS, GLONASS, Beidou and Galileo and also enable device vendors to develop quickly and cost-effectively location-based IoT solutions for use in virtually any country worldwide. The SE878Kx-A series supports dual internal-external antennas to ensure connectivity when one is broken or compromised, along with a SAW filter to maximize jamming immunity. The modules are designed for mission-critical applications and other use cases where reliability is key, such as alarms, stolen cars or high-end asset tracking. The series also provides seamless integration with Telit’s cellular modules, including eCall/ERA-GLONASS compliant solutions.

    Telit, telit.com

    IoT Board

    Has Built-in GNSS Receiver

    The Spresence main board by Sony. (Image: Sony)
    The Spresence main board by Sony. (Image: Sony)

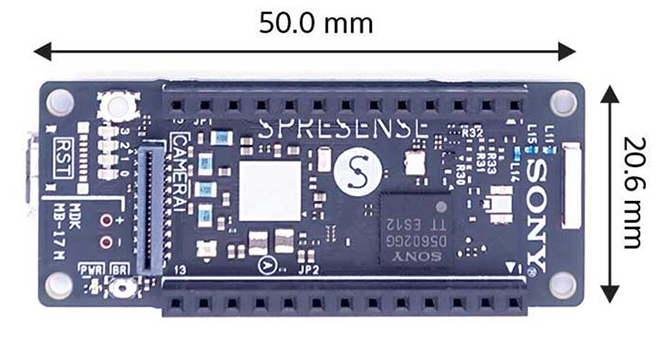
    The Spresence main and extension boards are designed for internet of things (IoT) applications. The main board uses a multi-CPU structure equipped with Sony’s GNSS receiver (GPS+GLONASS) and high-resolution audio codec. A variety of systems for applications such as drones and other IoT devices can be built by combining the boards and developing the relevant applications. The boards’ software and hardware is available via open platform, allowing for a wide range of developmental possibilities. The main board can be used to control a drone using GPS positioning and a high-performance processor, voice-controlled smart speakers and low-power consumption sensing cameras. It also can be combined with sensors for use in systems that detect errors in production lines on the factory floor.

    Sony Corporation, sony.net

    SURVEY & MAPPING

    Field controller

    Designed for geopositioning, construction and mapping

    Photo: Topcon
    Photo: Topcon

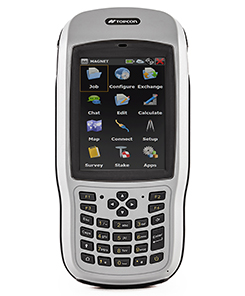
    The T-18 handheld controller has a 3.7-inch sunlight-readable display, a 1-GHz processor and 1 GB of internal storage. For field data collection using Topcon’s MAGNET software, the T-18 offers a durable ergonomic solution with fast processing, excellent connectivity and a long (10-hour) battery life. It has a 3.5G cellular modem for connectivity with Topcon MAGNET solutions for sending and receiving data to the cloud company account. The modem also can be used for real-time kinematic (RTK) correction services. Other features include Bluetooth and an IP65 rating for dust and water protection in demanding job-site conditions.

    Topcon Positioning Group, global.topcon.com

    Android application

    Created for SXblue receivers

    Image: SXblue
    Image: SXblue

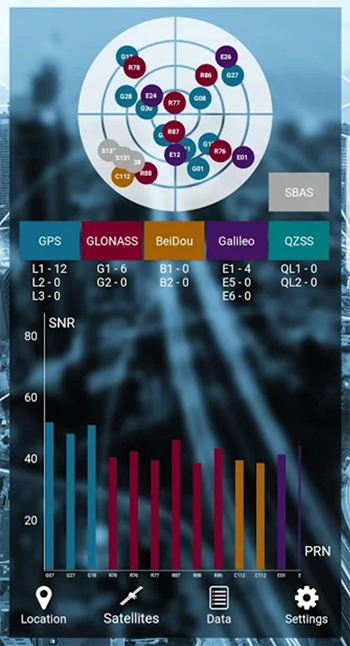
    The SXblue ToolBox is an Android application for SXblue GNSS receivers, enabling users to view and analyze the position data and metadata related to its location. The user can send commands that enable or disable some features, including systems in use, mask angle or differential angle, and constellation in use, including GPS, GLONASS, Galileo, BeiDou and SBAS. The SXblue ToolBox is also an NTRIP client capable of connecting to a NTRIP server for real-time kinematic (RTK) corrections, allowing the receiver to issue very accurate location information. The application can record, save and transfer raw data from the GNSS receiver, allowing post-processing on computers for surveying and geomatics professionals.The toolbox has been developed with special consideration for modern mobile devices and attention to user and dealer feedback. It includes a series of configurable audible and visual alarms for determining the thresholds of the information provided by the SXblue GNSS receiver.

    SXblue, sxbluegps.com

    Laser scanner

    Creates 3D models in the field

    Leica RTC360 laser scanner. (Photo: Hexagon)
    Leica RTC360 laser scanner. (Photo: Hexagon)

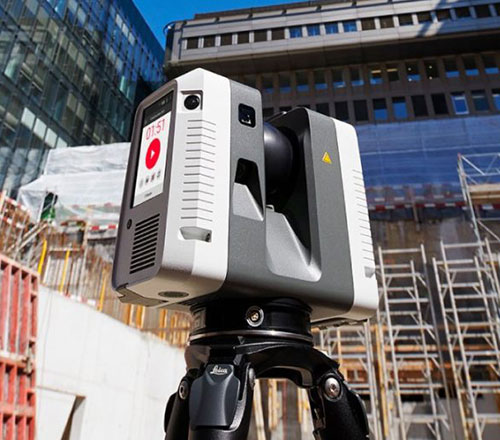
    The Leica RTC360 laser scanner is equipped with edge computing technology to enable fast and accurate creation of 3D models in the field. It combines high-performance laser scanning, edge computing and mobile app technologies to preregister captured scans quickly and accurately. With the push of a button, two million points per second of high dynamic range imagery can be captured to create a full-dome scan in under two minutes. It features a visual inertial system that automatically tracks movements between setup positions. The scans captured can be combined and preregistered on a mobile device, where they can be viewed and augmented with information tags.

    Hexagon, hexagon.com

    Indoor software

    Location technology allows users to see rooms, gates and offices

    Screenshot: Esri
    Screenshot: Esri

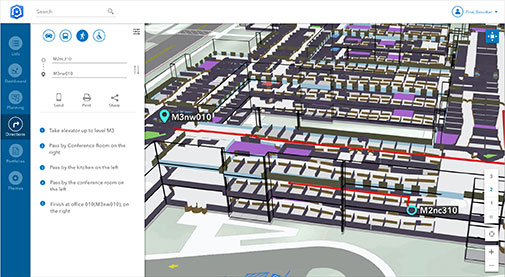
    ArcGIS Indoors is designed to enable interactive indoor mapping of corporate facilities, retail and commercial locations, airports, hospitals, event venues, universities and more. The solution applies the latest location technology to allow users to see and share where assets, rooms, departure gates and offices are located. It uses data streams, real-time processing and location intelligence tools to help businesses and other organizations understand how to better coordinate space and other resources with their facilities and campuses. Insights from sensor networks deliver real-time information to managers and executives through interactive dashboards, while visitors and employees can find useful information about the buildings they occupy. The solution also allows users to quickly access and explore critical business information, such as the location and status of fire extinguishers and their last inspection dates.

    Esri, esri.com

    TRANSPORTATION

    Automotive-grade inertial sensor

    Meets demands for continuous, accurate vehicle location

    The ASM330LHH module. (Photo: STMicroelectronics)
    The ASM330LHH module. (Photo: STMicroelectronics)

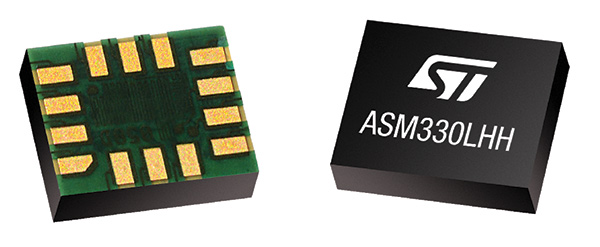
    The automotive-grade ASM330LHH six-axis inertial sensor is designed for super-high-resolution motion tracking in advanced vehicle navigation and telematics applications. It lets advanced dead-reckoning algorithms calculate precise position from sensor data if satellite signals are blocked, such as in urban canyons, tunnels, covered roadways, parking garages or dense forests. Its advanced, low-noise, temperature-stable design enables dependable telematics services such as e-tolling, tele-diagnostics and e-Call assistance. Precision inertial data in six axes also meets the needs of advanced automated-driving systems. Automotive component manufacturer Magneti Marelli has selected the ASM330LHH for advanced telematics systems, to be fitted as original equipment by global automotive groups in upcoming vehicle ranges.

    STMicroelectronics, st.com

    Traffic alerts app

    Near real-time data for smarter cities

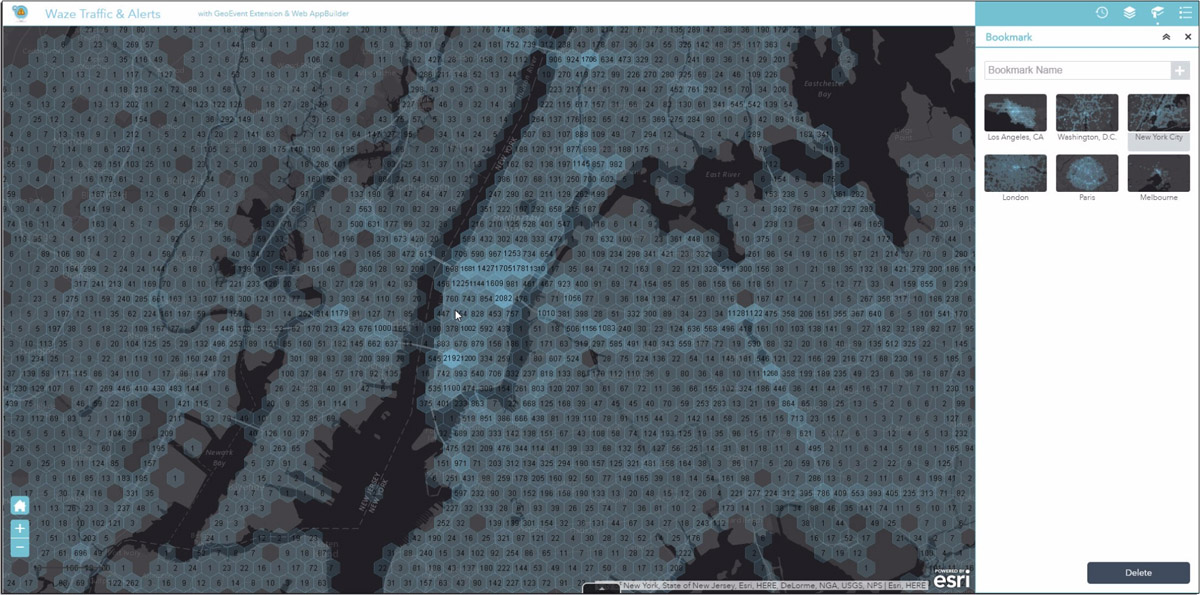
    Esri and Waze smart cities partnership grows. (Image: Esri)
    Esri and Waze smart cities partnership grows. (Image: Esri)

    The free crowdsourced traffic and navigation app Waze is now fully supported by ArcGIS Online, where its live feed of mapped traffic alerts and other information, such as accidents, congestion and street damage, can be used in applications in minutes. Waze Live Alerts, available in ArcGIS Marketplace, is free to members of the Waze Connected Citizens Program. The program, a two-way sharing of publicly available traffic and road condition information, offers governments a stream of data, constantly updated in real time. This enables personnel to make data-driven infrastructure decisions and improves the efficiency of incident response.
    Traffic engineers can use the data to analyze problems on the road and create targeted solutions.

    Waze, waze.com; Esri, esri.com

    Connected car software

    Open-source platform for autonomous delivery and other iot

    The AGL platform provides Mercedes-Benz Vans with the ability to create autonomous delivery robots. (Image: Daimler)
    The AGL platform provides Mercedes-Benz Vans with the ability to create autonomous delivery robots. (Image: Daimler)

    Automotive Grade Linux (AGL) is a collaborative cross-industry effort to develop an open platform for the connected car. Mercedes-Benz vans are using AGL as a foundation for a new onboard operating system for its commercial vehicles. The Mercedes-Benz “adVANce” initiative focuses on connectivity and internet of things (IoT) applications, innovative hardware solutions, new on-demand mobility and rental concepts, and fleet management solutions. The AGL platform provides Mercedes-Benz Vans with the flexibility to rapidly create tailored solutions for customers, including adding and connecting any kind of IoT component to the vehicle, such as sensors, automation controls and actuators. The new AGL-based operating system will debut on various Mercedes-Benz Vans prototype projects later this year.

    Linux Foundation, linuxfoundation.org; Mercedes-Benz, daimler.com

    Vehicle security

    Protects against ransomware

    Image: iStock/hanibaram
    Image: iStock/hanibaram

    eCyber is an integrated hardware-software product that protects vehicles against ransomware and other cyber-attacks. It can be installed in a vehicle by authorized parties, such as vehicle importers and fleet managers, in the aftermarket stage after the vehicle has left the factory, as well as by the OEM itself during manufacture. eCyber, a combined hardware and software solution in a compact box, is installed between the vehicle’s external communications device and the vehicle’s CAN (Controller Area Network) bus. It provides a secure gateway for outside communications to the CAN bus, allowing only communications with predefined parameters and values to go through. It blocks any unrecognized communications to and from the CAN bus, so no malicious digital communications can disrupt vehicle function.

    ERM Advanced Telematics, ermtelematics.com

    UAV

    Aerial camera

    With fast medium-format imaging sensor

    Photo: GPS World
    Photo: GPS World

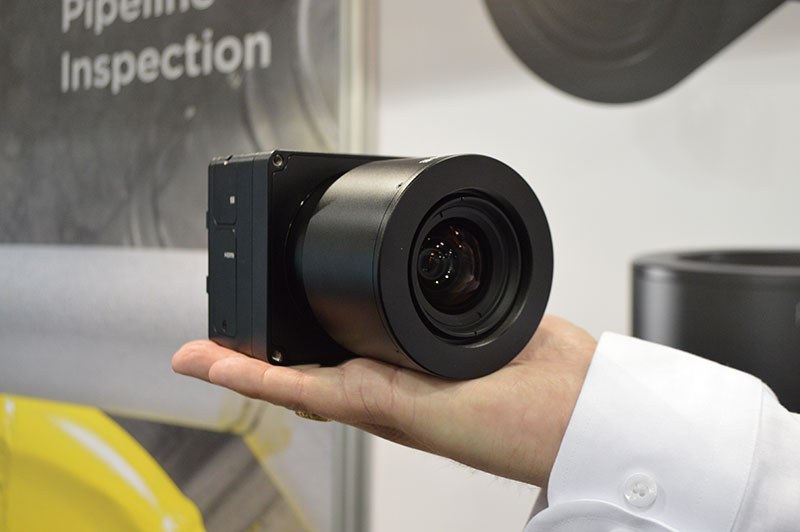
    Engineered for UAV-imaging missions, the iXM 100MP is a high-productivity metric camera with a range of high-resolution lenses. It is ready for integration with various UAV platforms, including Phase One’s DJI Matrice 600 Pro. The camera incorporates a medium-format sensor with backside-illumination technology, enabling high light sensitivity and extended dynamic range. Phase One also offers four new RSM lenses — with focal lengths ranging from 35mm to 150mm — to fit the new sensor’s 3.76 μm pixel size and 33 x 44 mm frame size. The lenses are available with either fixed-focus or motorized-focus functionality. The fixed-focus 35mm and 80mm lenses are especially suitable for surveying applications.

    Phase One Industrial, industrial.phaseone.com

    Authorization platform

    For quick approval of flights over controlled airspace

    Screenshot: Skyward
    Screenshot: Skyward

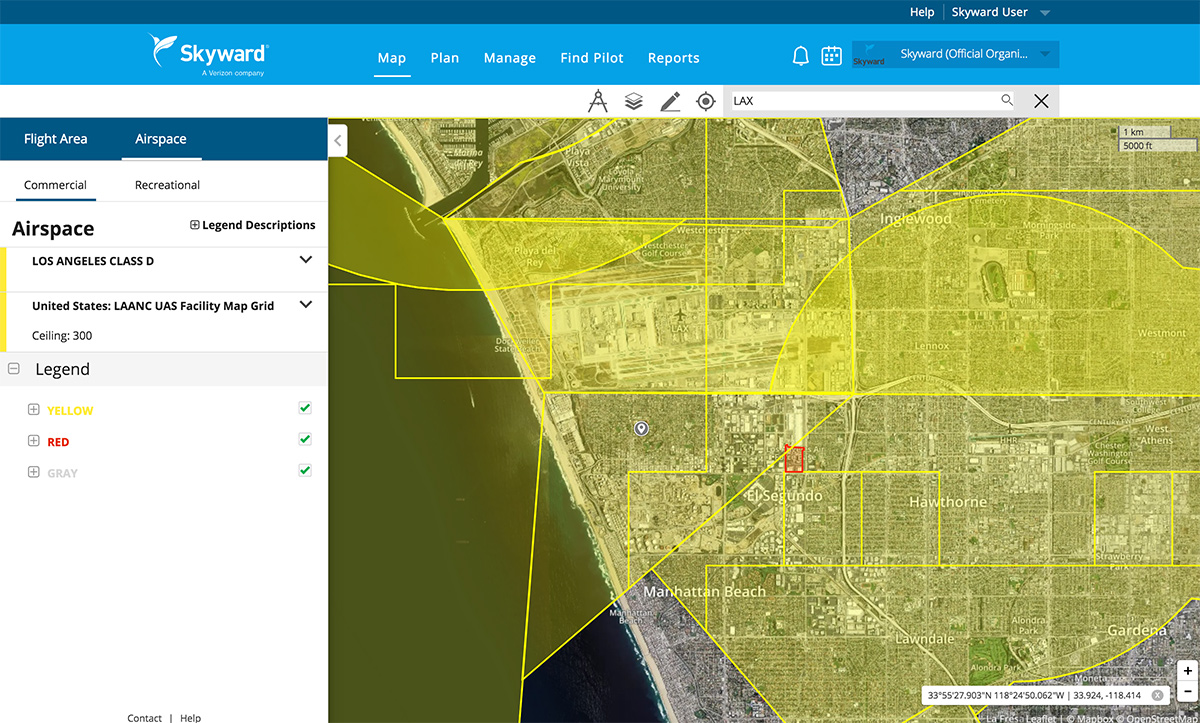
    Commercial drone operators in California and Hawaii — as well as a few areas in Nevada, Utah and Arizona — can get quickly authorized to fly in controlled airspace using the LAANC (Low Altitude Airspace Notification Capability) platform. Skyward is an FAA-approved airspace vendor. With Skyward, pilots with a Part 107 license can get permission to fly in regulated airspace in seconds compared to manual authorizations that can take months. This makes it significantly easier for businesses of all sizes, particularly in the construction and warehousing industries, to manage a fleet of drones to access valuable, cost-saving data. Skyward’s LAANC expansion includes airspace in the busy metro areas of Los Angeles, the Bay Area, San Diego, Las Vegas and more than 50 smaller air markets.

    Skyward, skyward.io

  • Komatsu partners with Propeller on drone analytics for construction

    Komatsu America Corp. and Propeller Aero Inc. are partnering to boost the efficiency of construction job sites using drone-powered mapping and analytics software.

    With drones becoming an increasingly common worksite tool, Komatsu has identified aerial mapping and analytics as a key component of its Smart Construction initiative — a range of integrated hardware and software products designed to offer an end-to-end workflow for each phase of construction.

    Komatsu America Corp. spent several years testing various commercial drone mapping and analytics products in North America. In Propeller, Komatsu found a robust product suited to meet the needs of modern construction operations. Propeller expertly balances ease-of-use with survey accuracy and reliability, Komatsu said.

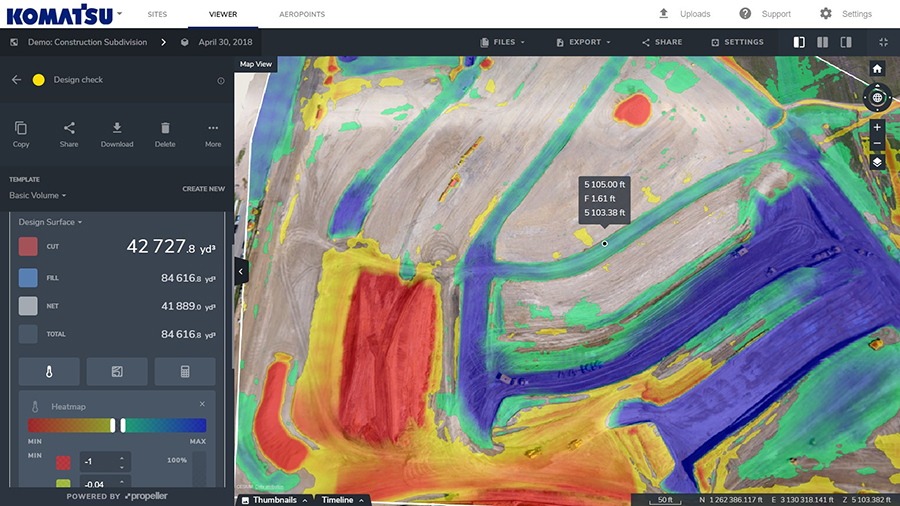
    Propeller’s processing machinery crunches thousands of drone images in hours, and delivers the results as a cloud-based 3D model to the user’s desktop or tablet. From there, powerful collaboration and analysis tools let users perform height, volume and slope calculations, and measure change over time to confirm that a project is on track, the companies said.

    (PRNewsfoto/Propeller Aero)
    (Image: PRNewsfoto/Propeller Aero)

    Propeller’s technology platform supports multiple coordinate systems, including local site calibrations. This allows personnel to capture up-to-date survey data expressed in the specific geospatial coordinates they already use on that job site. Local grid support is crucial for ensuring drone-captured maps and models match up with plans and previous surveys.

    “A Komatsu Smart Construction jobsite by definition is technology enhanced and production optimized,” said Jason Anetsberger, senior product manager at Komatsu America Corp. “Adding Propeller Aero as one of our key partners gives our North American distributors and customers exceptional capabilities to achieve this standard in the aerial mapping space. Propeller combines simple, yet powerful analysis tools with accurate and fast site visualization.”

    “Worksites are starting to see the real business value of accurate, up-to-date drone data,” said John Frost, vice president of business development at Propeller. “We drive that value through workflows that enable everyone to understand who’s moved what material, how much, and where. It’s all about empowering worksites with the information they need to make data-driven decisions to reduce costs, ensure quality, and use resources efficiently. Now more than ever, stakeholders on site, or in the head office miles away, can stay up-to-date with exactly what’s happening on the ground.”

    “Anyone can fly a drone — it’s what you do with the data that makes an impression,” said Chris Faulhaber, smart construction business manager at Komatsu Equipment Co. “Propeller provides fast, accurate data processing via a web platform that is unparalleled. The platform is easy to use, facilitates healthy collaboration and delivers vital information quickly — so everyone can work together better and faster than anticipated.”

  • Precise positioning drives lane-level accuracy in automotive industry

    Precise positioning drives lane-level accuracy in automotive industry

    GNSS positioning algorithms combined with automotive-grade GNSS chipsets, inertial measurements and GNSS corrections services from a ground network of reference stations can deliver instant lane-level accuracy.

    By Tasha Wong Ken and Sara Masterson, Hexagon Positioning Intelligence

    Autonomous technology is reshaping the future of the automotive industry and Hexagon’s Positioning Intelligence Division (Hexagon PI) is developing cutting-edge positioning solutions to support the growth of this rapidly changing industry.

    Hexagon PI is working with GNSS chipset manufacturers like STMicroelectronics to deliver automotive-grade, multi-frequency GNSS chipsets that combine our positioning algorithms with automotive-grade GNSS hardware to deliver solutions for connected cars, advanced driver-assistance systems (ADAS) and autonomous driving applications.

    In June, Hexagon PI introduced TerraStar X GNSS correction technology, which enables lane-level vehicle positioning in under a minute, using automotive-grade chipsets and the Hexagon PI positioning engine. Built on the company’s latest precise point positioning (PPP) algorithms, TerraStar X leverages existing Hexagon capabilities in ground network infrastructure, correction data generation, and data packaging for delivery.

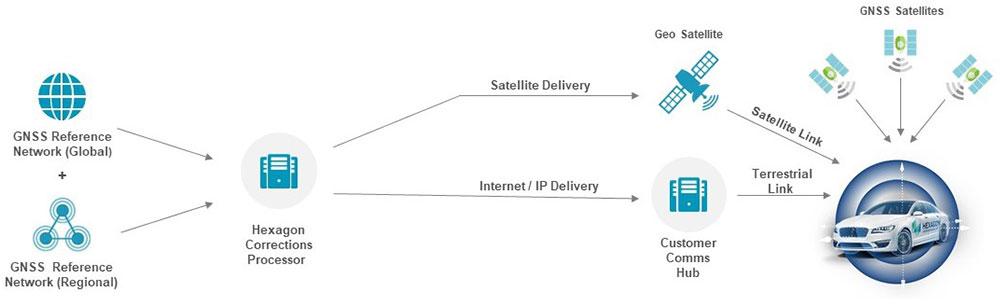
    FIGURE 1. TerraStar X correction data generation and delivery to the vehicle. (Image: Hexagon PI)
    FIGURE 1. TerraStar X correction data generation and delivery to the vehicle. (Image: Hexagon PI)

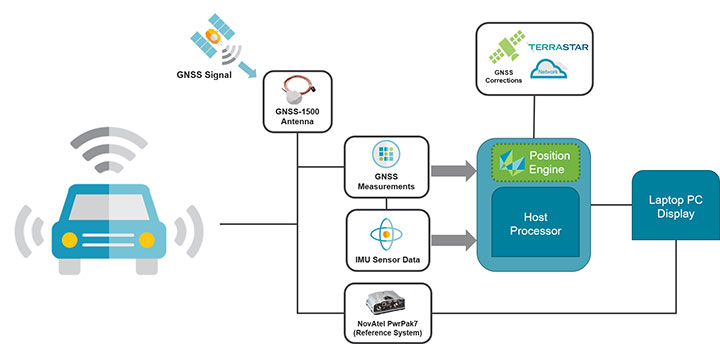
    By combining Hexagon PI’s software positioning engine with GNSS measurements from automotive-grade chipsets and inertial measurement unit (IMU) data, TerraStar X GNSS correction services can deliver instant lane-level accuracy positioning.

    TerraStar X combines existing TerraStar global clock and orbit data with regional ionospheric correction data from Hexagon’s vast network of SmartNet reference stations. This forms the technology foundation for future correction services on connected cars, ADAS and autonomous driving markets, including integrity and authentication for safety-critical applications.

    FIGURE 2. The Hexagon PI positioning engine achieves seamless position accuracy by taking GNSS measurements from the Teseo V GNSS receiver, combining it with their positioning algorithms, GNSS+INS coupling, and TerraStar X correction technology. (Image: Hexagon PI)
    FIGURE 2. The Hexagon PI positioning engine achieves seamless position accuracy by taking GNSS measurements from the Teseo V GNSS receiver, combining it with their positioning algorithms, GNSS+INS coupling, and TerraStar X correction technology. (Image: Hexagon PI)
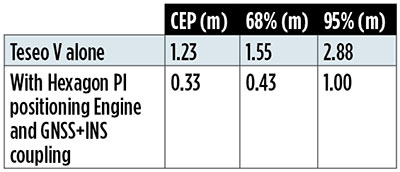
    TABLE 1. Cumulative distribution of horizontal errors from testing on German roads. (Table: T. W. Ken and S. Masterson)
    TABLE 1. Cumulative distribution of horizontal errors from testing on German roads. (Table: T. W. Ken and S. Masterson)

    HxGN SmartNet consists of a large operational reference station network, consisting of more than 4,500 stations with continuous quality monitoring and support. Correction data generation takes place at Hexagon processing centers where service reliability, redundancy and 99.999% guaranteed service uptime ensure corrections are available for users 24/7/365.

    While TerraStar X utilizes the stations already available, the algorithms are flexible and will accommodate the rollout of new service areas with increased station separation, enabling continental-scale coverage.

    TerraStar X technology will deliver correction data to vehicles and end users through hybrid delivery channels, including both cellular network and satellite. Combining TerraStar X technology with multiple delivery channels ensures that vehicles, UAVs, industrial vehicles, trains, and more will operate safely, securely, reliably, and efficiently.

    TerraStar X testbeds are being utilized for several advanced automotive development programs in North America and Europe, TerraStar X commercial services will be available in 2019. Interested customers can request access to any of the testbeds through Hexagon PI.

    Positioning Engine. Hexagon PI’s positioning engine architecture enables a flexible integration with different GNSS receiver chipsets, augmentation sensors and processor environments, providing automotive manufacturers with additional flexibility when it comes to sourcing components and subsystems of ADAS and autonomous driving solutions.

    The positioning engine is being developed to Automotive Safety Integrity Level (ASIL)-B standards and will include a proprietary GNSS integrity solution to ensure safe positioning within defined protection limits tailored to the customer’s application requirements.

    Recent test results

    Hexagon PI conducted demonstrations in Michigan and Germany using an automotive platform that combined automotive-grade GNSS hardware with TerraStar X technology and the software positioning engine to demonstrate instant lane-level accuracy with correction data delivered over the cellular network to test vehicles.

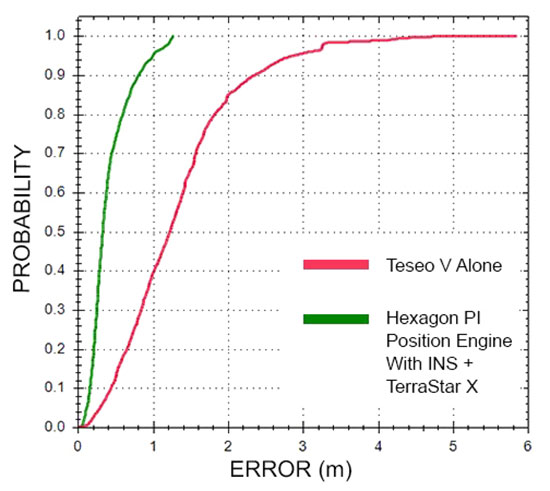
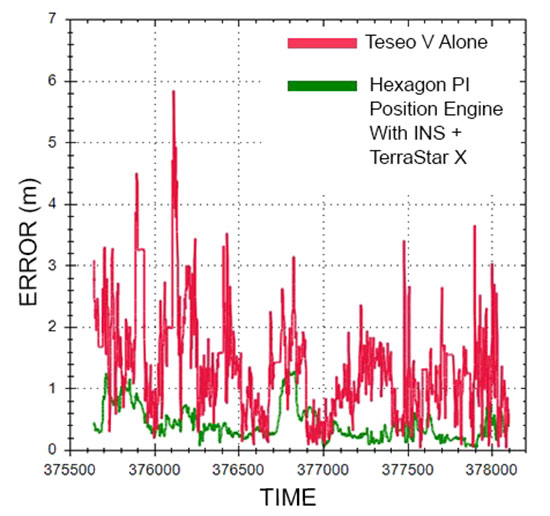
    The results are from the most recent demonstration performed in urban conditions in Germany. The route consisted of a mix of controlled-access highway and light urban roads in the city. In this case, the positioning engine using TerraStar X and GNSS+INS coupling deliver 1-meter accuracy through 95% of the dataset.

    FIGURE 3. Cumulative distribution of horizontal errors from tests on German roads. (Figure: T. W. Ken and S. Masterson)
    FIGURE 3. Cumulative distribution of horizontal errors from tests on German roads. (Figure: T. W. Ken and S. Masterson)

    Throughout the data collection, position accuracy improves by almost 70% when TerraStar X and the positioning engine is used. In some areas, it was found that the position solution can improve up to 95% with the Hexagon PI positioning solution over the standalone Teseo V, an automotive-grade GNSS receiver from STMicroelectronics.

    FIGURE 4. Horizontal position errors from testing on German roads. (Figure: T. W. Ken and S. Masterson)
    FIGURE 4. Horizontal position errors from testing on German roads. (Figure: T. W. Ken and S. Masterson)

    Looking ahead in automotive

    Hexagon PI continues to demonstrate the benefits of precise positioning on automotive-grade chipsets using augmentation sensors, our positioning engine, and TerraStar X technology in a variety of environments worldwide. Our goal is to develop a solution for mass-production that provides accurate and functionally safe positioning to enable the advancement of autonomy in the automotive industry.

  • The role of GNSS in driverless cars

    The role of GNSS in driverless cars

    Authenticated localization in driverless cars

    Growing awareness of the vulnerabilities of GNSS signals — weak, unencrypted and easily jammed or spoofed — have made GNSS less important to steering the driverless vehicle. What’s up with that?

    Extensive visual map databases are being created that, when coupled with cameras, radars and lidars on the vehicle and processed by artificial intelligence (AI) algorithms, enable the driverless car to be steered much the way humans drive. Pattern recognition processing in the vehicle allows it to “read” street signs and recognize landmarks, registering its position on the map.

    This is the way a person drives in his or her home town, where they always know their orientation and don’t need GNSS. The AI processing “brain,” with access to huge map databases, either through local storage or a network connection, will always be in its familiar home environment: continuously knowing its own position and properly oriented for navigation.

    So, will GNSS become unnecessary in the car of the future? Probably not.

    First, no one method of navigation is foolproof, and today, GNSS is our primary method of navigating our cars. It is a cost-effective, accurate way of determining position in real time, and with the integration of inertial navigation sensors to handle cases when GNSS is intermittently unavailable, it is improving.

    Second, it is not just the car itself that needs to know its location for navigation, but also others outside the car. Ride-sharing apps like Uber and Lyft, car-sharing, usage-based insurance apps, dynamic toll charging, and parking apps all depend on knowing where the car is at all times. GNSS offers sufficient accuracy for all these apps by providing location coordinates. Therefore, a GNSS receiver will most likely remain in the car.

    The case for jamming and spoofing

    Recall, however, that one of the weaknesses of GNSS is its open, unencrypted format. It is becoming increasingly easier to spoof these signals. Car-sharing, usage-based insurance and dynamic toll charging apps all create a monetary incentive for fraud that can be implemented with a spoofer. For example, a car in a car-sharing network can report a fake position indicating that it is safely parked in a secure area — while in reality, a thief is busy driving it away.

    (Image: Orolia)
    (Image: Orolia)

    Let’s assume that all wireless connections to and from the car are secure. This is a reasonable assumption, although recently there have been demonstrations of carjacking via unsecure remote links. Standard SSL encryption, similar to what is used to enter credit card information on the internet, works well here. We have both the awareness and the technology now to prevent such carjackings from ever reoccurring.

    However, even if communication links are secure, a GNSS spoofer in the car can fool the GNSS receiver into reporting a fake “safe” position right as it is being stolen. The same is true for insurance or toll apps. And the fraud does not have to be sophisticated. A simple, low-cost jammer can deny proper position just long enough to skirt payment. A secure location method is needed.

    Other signals for localization

    What would an ideal signal for localizing a driverless car look like?

    • It needs to be much stronger than GNSS so it is not easily jammed.
    • It needs to be encrypted so it cannot be spoofed.
    • It must be ubiquitous, available worldwide.
    • It must be reliable and robust — with 99.999% availability or better.
    • It must be practical and priced for the mass-market automotive application.

    Though accuracy is always important, the signal used for localization does not have to be as accurate as GNSS is today. Accuracy to 10s of meters is sufficient for all these applications needing fraud protection since it would not be used for steering the car, but rather, only localization. It can also be used in tandem with GNSS to authenticate a reported position when a GNSS signal is available.

    Such a signal is available today, worldwide: STL (Satellite Time and Location). Carried on the Iridium satellites, it is a special purpose signal that is more than 30 dB stronger than GNSS and encrypted for anti-spoof protection. Decoding of this signal is available via a subscription model to users.

    Here’s how it would work using a car-sharing example. A group of people subscribe to a car-sharing service that provides X number of cars to serve Y number of people, where X is less than Y. The service optimally schedules people when and where a car will be available. The service provider needs to know the whereabouts of the cars at all times to maximize utilization of the fleet, so every car has a GNSS receiver in it.

    But to ensure the authenticity of these reports, they also have a secure localization receiver. This receiver is assigned a unique ID that is authorized to decode the encrypted signal. (Eventually, we expect this receiver and GNSS to converge into one device much the way multi-GNSS receivers operate today).

    If a position report does not agree with the authentic localization report, the fleet manager can act to recover the car immediately. Insurance providers who cover secure localization-equipped cars would also give preferential rates as an anti-theft device.

    (Image: Pavel Vinnik/Shutterstock.com)
    (Image: Pavel Vinnik/Shutterstock.com)

    Could PRS do it?

    The new Public Regulated Service (PRS) from Galileo is encrypted and could provide a similar level of authentication protection, if made available. However, it is still a weak GNSS signal that can easily be jammed. Of course, any signal can be jammed, even one that is a thousand times stronger than GNSS.

    However, given the robust nature of a very strong signal, the managing system that is monitoring the cars — the insurance, toll or car-sharing system, for example — can alarm upon the loss of positioning information. Such alarms on a GNSS-only car would be frequent and often erroneous due to simple fades, yielding so many false alarms that it would render the monitoring system useless. But a loss of both the strong localization signal and GNSS would likely be considered suspicious and result in a valid alarm.

    GNSS navigation is truly one of the great advances of the modern era, giving us precise time and location for any place in the world. Its two major weaknesses — that it is easy to jam and spoof — can be overcome by augmenting it with other stronger encrypted signals, such as STL, providing robust jam-resistance and positive authentication.

  • Laser rangefinder speeds up faltering survey project

    Photo: Laser Technology
    Photo: Laser Technology

    A survey consulting firm accustomed to using drones to capture data in the field recently found that data gathering was taking too long, and after just one day, the field manager knew the project wasn’t going to meet budget.

    “Some of the areas were more congested than we originally planned, and we had to consider other tools to do it better and faster,” said Mike George of Downtown Design Services Inc. (DDSI).

    The company turned to an laser rangefinder and got the job back on track.

    To learn more about the exact processes involved in Integrating a professional measurement and mapping laser to your GIS toolbox, both saving time and enabling collection of additional attribute data attend GPS World’s free webinar on Thursday, Aug. 16: LaserGIS: Your Gateway to Collect More GIS Data in Less Time.

    George used the Laser Technology TruPulse 360 rangefinder as a first walk-around to obtain site data for the company’s drone, identifying the peak above ground level, establishing ground control points, and setting the pre-programmed grid for the flight. The laser rangefinder significantly sped up the process without sacrificing any measurement accuracy.

    “As the project went along and we started processing data,” George added, “we realized that the drone didn’t capture everything, and that some data wasn’t as high-quality as we had hoped.” Many of the smaller trees in the area were difficult for the drone camera to pick up. “We needed to know they were there. We could shoot them using the LTI laser, mark them in the field notes, and have the drafters add them in later when creating the plats for review.”

    After the drone mission, the field team used the laser to quickly survey the remaining landscape. With the appropriate heights and widths, DDSI could use the missing line routine with the built-in compass as well as the height routine to get the additional measurements they needed.

    “The laser rangefinder was a huge time-saver because some of these sites had up to 100 trees, and trying to identify some of these smaller ones from the drone imagery proved very tough.”

    The company also saved time from not having to make a second trip to each site. “You don’t know what you’re going to get until you get back to the office. It often takes four to six hours to process the drone imagery. But after processing and analyzing data for this project, we didn’t have to go back and fill in the gaps, because we knew we had what we needed.”

    After surveying only 1.5 sites on the first day, switching to a laser rangefinder brought the team up to four sites a day, and the project was completed on time and on budget. DDSI also delivered comprehensive, high-quality documentation to its client, an architectural and engineering firm.

    “When we turned our imagery over to the A&E team, they had high-resolution ortho-imagery instead of only the typical black-and-white deliverables,” George said. “The team found that invaluable.”

    Register for GPS World’s free Aug. 16 webinar, titled “LaserGIS®: Your Gateway to Collect More GIS Data in Less Time,” here.

  • NGS 2018 GPS on BMs program in support of NAPGD2022 — Part 8

    NGS 2018 GPS on BMs program in support of NAPGD2022 — Part 8

    My last two columns (NGS 2018 GPS on BMs program in support of NAPGD2022 — Part 6 and NGS 2018 GPS on BMs program in support of NAPGD2022 — Part 7) described the National Geodetic Survey’s (NGS) GPS on BMs 2018 interactive web map, and provided an update and status report on stations observed in support of the 2018 GPS on BMs Program. This column will provide another update and status report on stations observed in support of the 2018 GPS on BMs program and provide an example of how the OPUS-shared results filled in a void area in West Virginia that will benefit the development of the hybrid geoid model GEOID18. The column will also provide an example of how OPUS Shared results identified a reset station that has an invalid NAVD 88 height, and the importance of having a least two OPUS Shared results to ensure the reliability of the OPUS solutions.

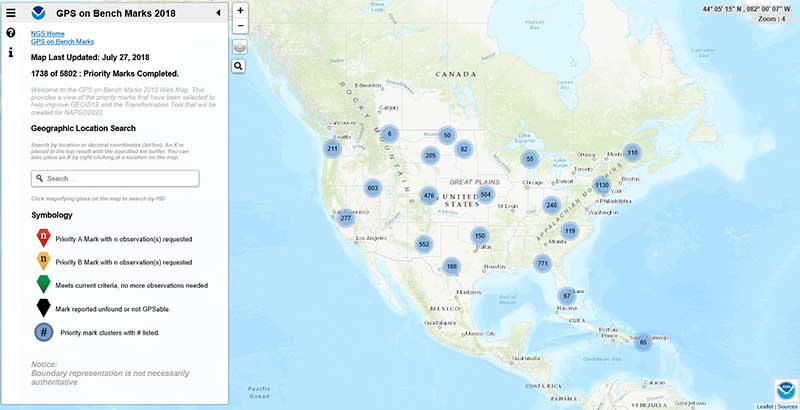
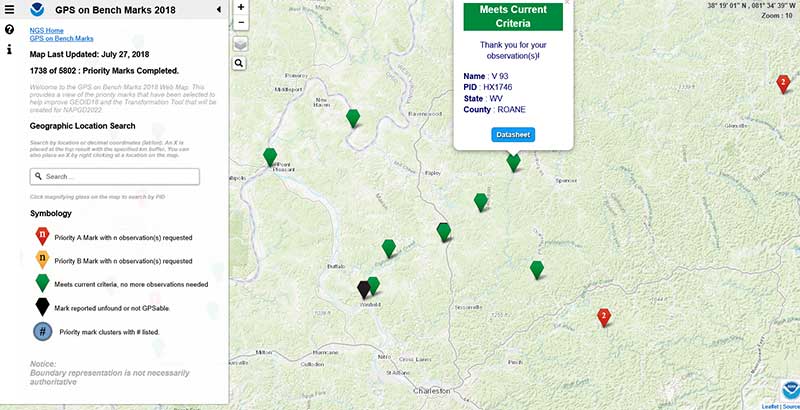
    As mentioned in the last column, the GPS on BMs 2018 web page contains a link to a web map where users can determine which bench marks NGS would like users to occupy before the August 31, 2018, deadline. The box titled “2018 Web Map” depicts the map update as of July 27, 2018 (1738 priority marks completed). My last column reported that as of May 29, 2018, there were 1067 priority marks considered completed. During the past two months, 671 more priority stations have been reported completed. This is progress but this still only represents about 30 percent of the priority marks. Hopefully, this will increase dramatically during the month of August. Remember, the cut-off date for data to be included in the creation of the hybrid geoid model GEOID18 is August 31, 2018.

    2018 Web Map

    (Source: NGS website)

    Image: National Geodetic Survey Image: National Geodetic Survey

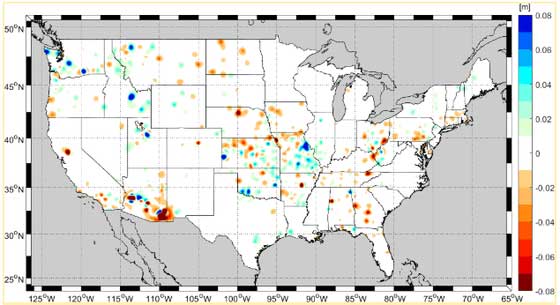
    NGS periodically provides an update on the GPS on Bench Marks Program. On July 3, 2018, NGS sent an email to everyone that shared GPS data on NGS bench marks via OPUS or registered for NGS’ February 2018 webinar about GPS on Bench Marks. The email provided an update on the GPS on Bench Marks Program (see box titled “July 3, 2018, NGS Email on GPS on BMs Update”). The map provided in the update indicated that some of the new observations may generate changes between +/- 8 cm.

    July 3, 2018, NGS Email on GPS on BMs Update

    (Source: Email from National Ocean Service, NOAA; [email protected] to Dave Zilkoski)

    Update: GPS on Bench Marks

    Over 1,420 marks completed, and two months left to improve GEOID18 accuracy in your area!

    Image: National Geodetic Survey Image: National Geodetic SurveyYour observations are making a difference! The color ramp in the map above reflects accuracy improvements in a hybrid geoid model from your recently submitted GPS observations. The improvements will be realized when NGS releases GEOID18.


    In case you missed it

    In early 2018, NGS released a list of priority bench marks where GPS data is needed to improve GEOID18, NGS’ last planned hybrid geoid model before The North American Vertical Datum of 1988 (NAVD 88) is replaced by the North American-Pacific Datum of 2022 (NAPGD2022). Data to support GEOID18 will be accepted until the end of August 2018. After that, GPS on Bench Marks (GPS on BM) efforts will expand to include other regions and will focus on data to improve future transformation tools.

    How can I help?

    Following the guidance provided on the NGS GPS on BM website, you can help by collecting static GPS data on adjusted NAVD 88 bench marks and submitting the data to NGS via OPUS Share. To improve efficiency and reduce unnecessary redundancy, we have created a GPS on Bench Marks 2018 web map to help contributors know where we have the data we need and where we still need GPS observations.

    Thank you to our contributors

    Over 1,700 observations have been submitted to date, completing the required observations for over 1,420 marks from our prioritized list. Each observation requires at least 4 hours of data collection with a survey grade GPS receiver, plus additional time for planning, travel, and data submission, so each one is a significant contribution. Visit the GPS on BM website for updates on our biggest data contributors and each state’s progress toward the goals.


    Why are you receiving this email?

    • You shared GPS data on NGS bench marks via OPUS, or
    • You registered for our February 2018 webinar about GPS on Bench Marks.

    We anticipate sending quarterly updates about these and related efforts. If you’d like to opt-out, click the “Manage Subscriptions” at the bottom of this email.

    NOAA’s National Geodetic Survey
    geodesy.noaa.gov

    NGS is tentatively planning another webinar on the GPS on Bench Marks program for August 9, 2018 (2 pm to 3 pm eastern time). NGS will provide an update on the GPS on Bench Mark program and probably will highlight potential improvements between the current hybrid geoid model GEOID12B and the latest prototype version of the future hybrid geoid model GEOID18. I would encourage everyone to sign up for the NGS webinar series.

    Source: Plot Generated Using ArcGIS

    Users can subscribe to any or all of NGS four public subscription lists — news, webinar, training, and GPS on Bench Marks — by visiting the NGS subscription services web page and submitting their email address for the type(s) of notices they want to receive. (https://www.ngs.noaa.gov/INFO/subscribe.shtml)

    As indicated in the figure provided in NGS’ July 3rd update on the GPS on Bench Marks program email, there are many areas of the country that have already benefitted from users participating in NGS’ GPS on BMs program. This column will highlight an area near Charleston, West Virginia, were users have been very active in providing OPUS Shared results. The box titled “GPS on Bench Marks near Charleston, West Virginia” depicts the marks that meet NGS’ criteria and will be involved in the development of the hybrid geoid model GEOID18. As you can see from the plot, there are several new stations that will be used in the development of the model which will help to improve the reliability of the product.

    GPS on Bench Marks near Charleston, West Virginia

    (Source: NGS Website)

    Image: National Geodetic Survey Image: National Geodetic Survey

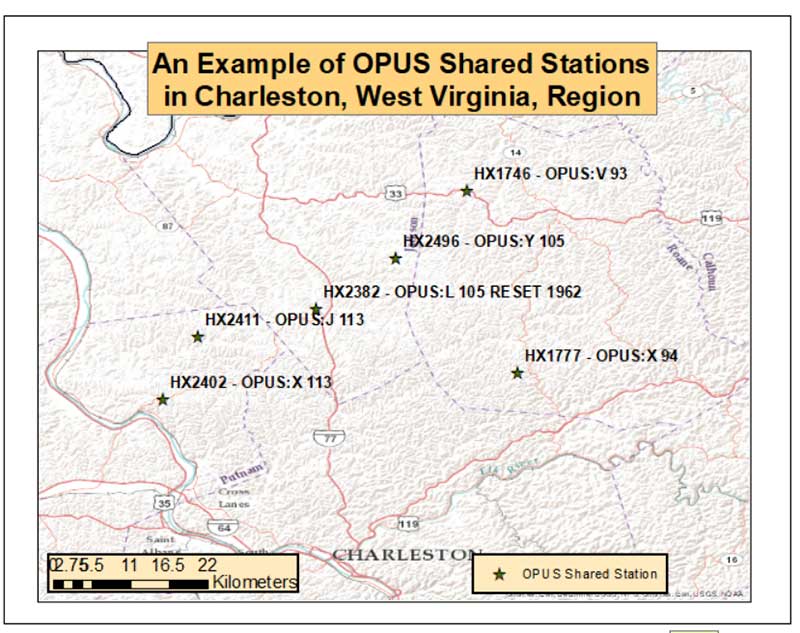
    The box titled “An Example of OPUS Shared Stations in Charleston, West Virginia, Region” provides the stations’ PID and OPUS designation. The six OPUS Shared stations cover approximately a 50 km square area. Most of the stations are only 10 km apart. These stations will definitely help to improve the reliability of the hybrid GEOID18 model.

    An Example of OPUS Shared Stations in Charleston, West Virginia, region

    (Source: Plot Generated Using ArcGIS)

    Image: National Geodetic Survey Source: Plot Generated Using ArcGIS

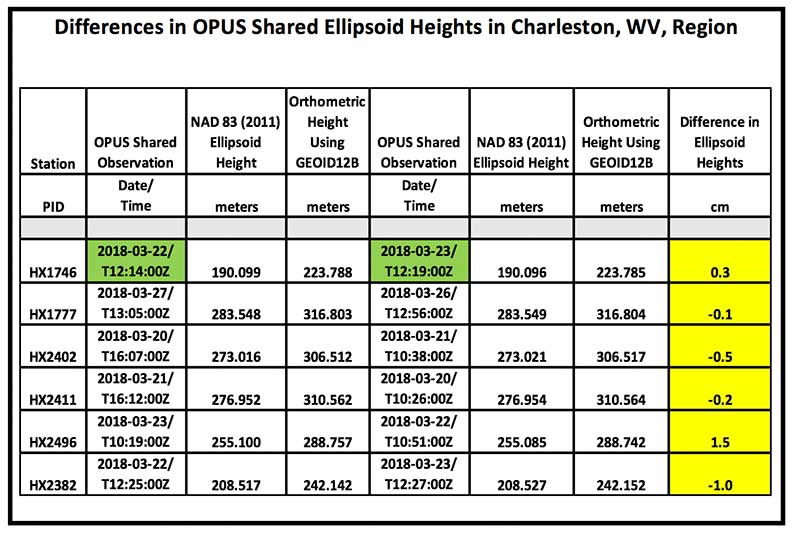
    When using OPUS Shared results, users should always check to see if a station has been observed more than once. The box tilted “Differences in OPUS Shared Ellipsoid Heights in Charleston, WV, Region” lists the pairs of OPUS observations for the stations depicted in the previous plot. The column labeled “Difference in Ellipsoid Heights” provides the differences in ellipsoid heights based on the two different OPUS Shared results. All differences are less than 1.5 cm and most are less than 1.0 cm. This is indicating good repeatability to the cm level but this may not be indicating accuracy. These stations were observed one day apart but observed at about the same time of the day. They could have the same systematic errors effecting the results such as multipathing and satellite geometry. When performing the second OPUS Shared observation, users should select a different time of day to improve the chances of detecting, reducing, and/or eliminating the effects of remaining systematic errors.

    Differences in OPUS Shared Ellipsoid Heights in Charleston, West Virginia, region

    Source: National Geodetic Survey Source: National Geodetic Survey

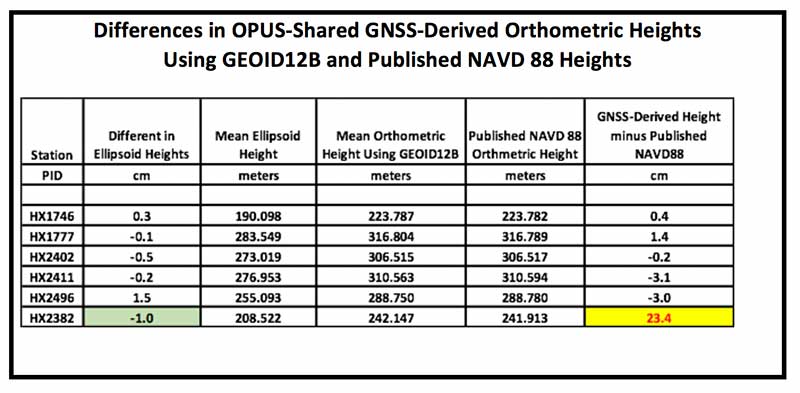
    The box titled “Differences in OPUS-Shared GNSS-Derived Orthometric Heights Using GEOID12B and Published NAVD 88 Heights” provides the differences between the GNSS-derived orthometric heights using GEOID12B and the published NAVD 88 values. This table indicates that there is a large difference (23.4 cm) for station HX2382 (L105 Reset 1962). Since the two ellipsoid heights only differ by 1.0 cm, this is an indication that the station probably moved since it was Reset or the reset observations were performed incorrectly. Either way, this station should not be used in the development of the hybrid model or used by anyone for geodetic control.

    Differences in OPUS-Shared GNSS-Derived Orthometric Heights using GEOID12B and Published NAVD 88 Heights

    Source: National Geodetic Survey Source: National Geodetic Survey

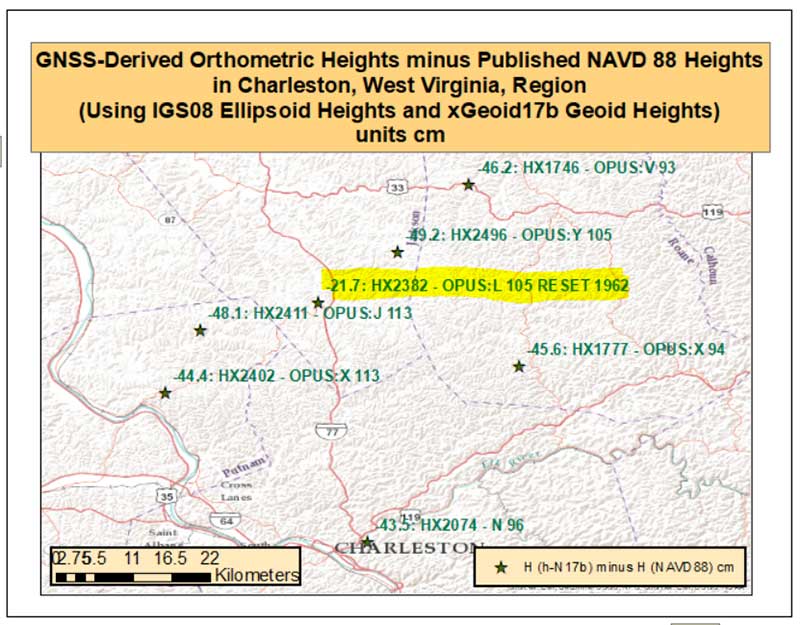
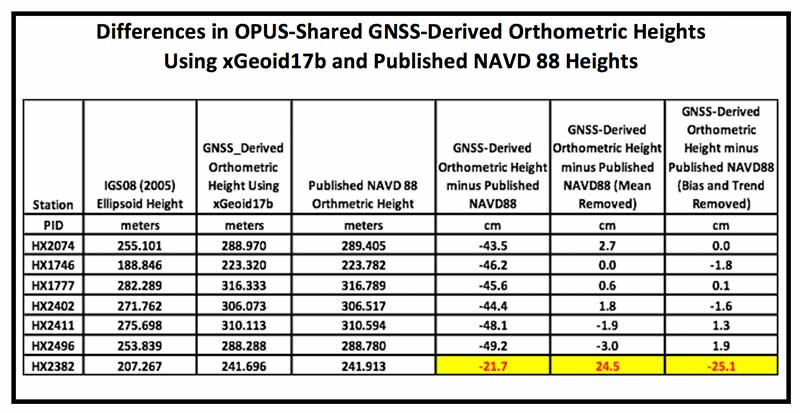
    Since GEOID12B is a hybrid geoid model that was designed to be consistent with NAVD 88 values, I always compute differences between GNSS-derived orthometric heights using the experimental geoid model and published NAVD 88 height values. I described this process in my October 2015 column (http://stage.globalpositioningnews.com/establishing-orthometric-heights-using-gnss-part-3/). The box titled “Differences in OPUS-Shared GNSS-Derived Orthometric Heights Using xGeoid17b and Published NAVD 88 Heights” provides the differences between the GNSS-derived orthometric heights estimated using IGS08 (2005) ellipsoid heights with the xGeoid17b geoid model and published NAVD 88 heights. The values in the column labeled “GNSS-Derived Orthometric Height minus Published NAVD 88” represent an approximate difference between NAPGD2022 and NAVD 88. The box titled “OPUS-Shared GNSS-Derived Orthometric Heights Using xGeoid17b minus Published NAVD 88 Heights” provides a plot that depicts these differences.

    Differences in OPUS-Shared GNSS-Derived Orthometric Heights Using xGeoid17b and Published NAVD 88 Heights

    Source: National Geodetic Survey Source: National Geodetic Survey


    OPUS-Shared GNSS-Derived Orthometric Heights Using xGeoid17b minus Published NAVD 88 Heights

    (Source: Plot Generated Using ArcGIS)

    Image: National Geodetic Survey Source: Plot Generated Using ArcGIS

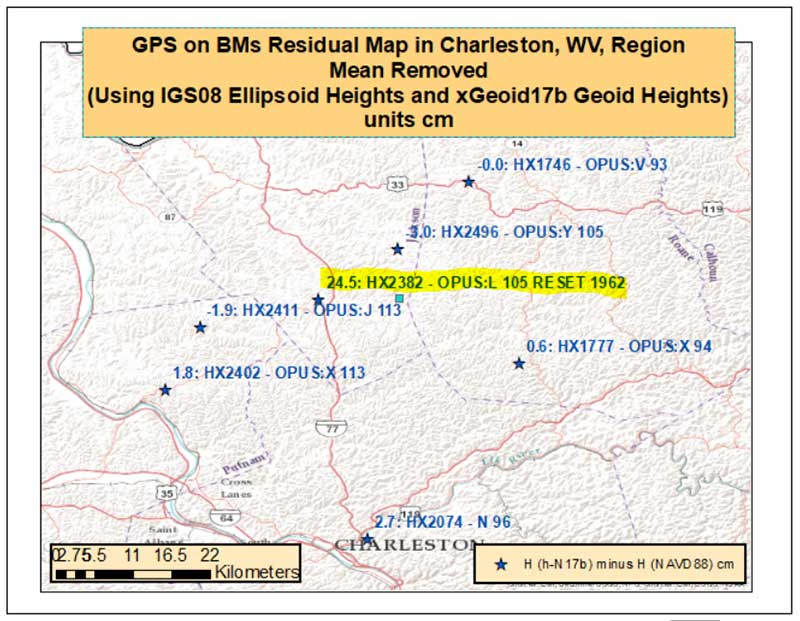
    Once again, it should be noted that PID HX2382 value is much different from the other values. To look for outliers, a mean difference was removed from the results. The box titled “OPUS-Shared GNSS-Derived Orthometric Heights Using xGeoid17b minus Published NAVD 88 Heights with a Mean Value Removed” makes it easier to see that station HX2382 is an outlier. The station is approximately 25 cm different from its neighboring stations that are only 10 km away. As previously mentioned, this station apparently moved since being Reset in 1962 or the reset observations were performed incorrectly. Identifying stations that have moved since the last time they have been leveled is one of the benefits of participating in the GPS on BMS program.

    OPUS-Shared GNSS-Derived Orthometric Heights Using xGeoid17b minus Published NAVD 88 Heights with a Mean Value Removed

    (Source: Plot Generated Using ArcGIS)

    Image: National Geodetic Survey Source: Plot Generated Using ArcGIS

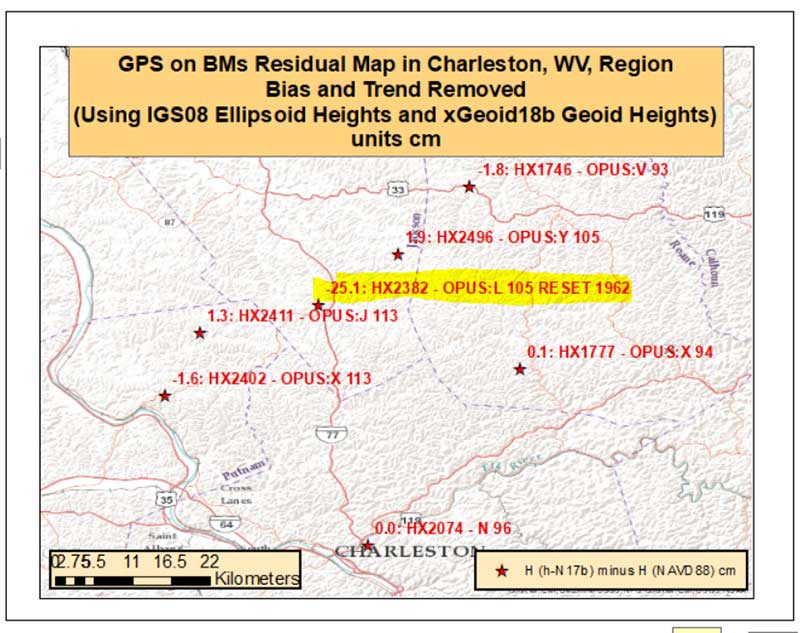
    For completeness, both a bias and trend were removed from the differences since IGS08 (2005) GNSS-derived orthometric heights and NAVD 88 heights indicate that there’s an apparent long-wavelength trend between the two sets of values. The box titled “OPUS-Shared GNSS-Derived Orthometric Heights Using xGeoid17b minus Published NAVD 88 Heights with Bias and Trend Removed” depict the differences with a bias and trend removed. As in the other figures, PID HX2382 clearly indicates that it is an outlier relative to its neighbors. This station would be rejected by the geoid team when creating the next hybrid geoid model.

    It should be noted that except for the Reset station, all of the differences are less than 2 cm. Although, some relative differences between closely-spaced stations approach 4 cm. For example, the differences between stations HX1746 and HX2496 is -3.7 cm (-1.8 cm – 1.9 cm). The differences in ellipsoid heights from the OPUS Shared solutions are all less than 1.5 cm, even the differences between ellipsoid heights for station HX2382 is only 1 cm. This is an indication that the reset station, HX2382, does not have a valid NAVD 88 published height and should not be used as control. Surveyors that adhere to the FGCS specifications and procedures would realize that this station did not have a valid NAVD 88 height and would not use the published NAVD 88 as control in their project. For example, surveyors performing a leveling project would perform a 2- or 3- mark leveling tie and the results would indicate that the station had moved since it was last leveled.
    OPUS-Shared GNSS-Derived Orthometric Heights Using xGeoid17b minus Published NAVD 88 Heights with Bias and Trend Removed

    (Source: Plot Generated Using ArcGIS)

    Image: National Geodetic Survey Source: Plot Generated Using ArcGIS

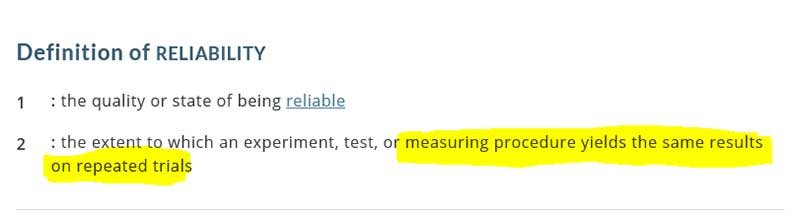
    This type of validation procedure should also apply for OPUS users. If a user obtains one OPUS solution and proceeds to perform a survey from that station, the user does not know whether the OPUS height value is reliable or accurate. One solution does not provide any indication of reliability.


    (Source: Merriam-Webster dictionary)

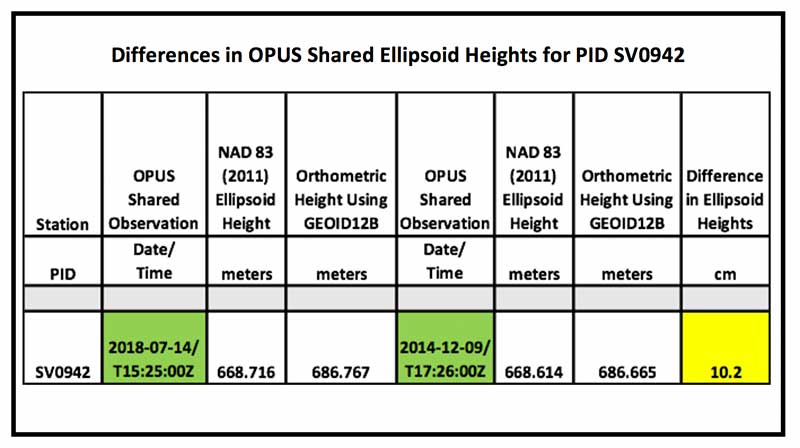
    The OPUS Shared station PID SV0942 (A 25) is an example of two OPUS Shared results generating ellipsoid height values that differ by 10 cm. (See yellow highlighted section in the box titled “Differences in OPUS Shared Ellipsoid Heights for PID SV0942.”) This large difference is significant when you performing a survey where you need heights to better than 3 cm (0.1 foot). This is one reason that NGS requires two OPUS Shared solution for every mark used in the development of the hybrid geoid model.

    Differences in OPUS Shared Ellipsoid Heights for PID SV0942

    Source: National Geodetic Survey Source: National Geodetic Survey

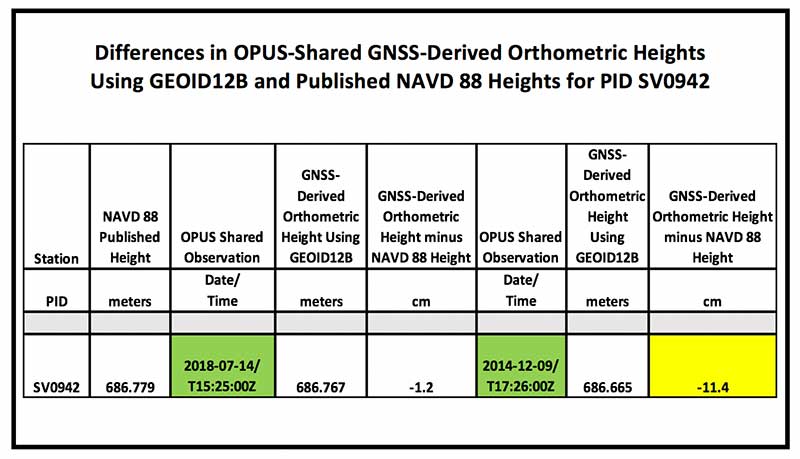
    In the OPUS Shared solutions of PID SV0942, the latest OPUS Shared GNSS-derived orthometric heights (2018-07-14) agrees to about a cm with the published NAVD 88 height, while the 2014 Opus Shared GNSS-derived orthometric height is -11.4 cm different from the published NAVD 88 value. (See yellow highlighted section in box titled “Differences in OPUS-Shared GNSS-Derived Orthometric Heights Using GEOID12B and Published NAVD 88 Heights for PID SV0942.”)

    Differences in OPUS-Shared GNSS-Derived Orthometric Heights Using GEOID12B and Published NAVD 88 Heights for PID SV0942

    Source: National Geodetic Survey Source: National Geodetic Survey

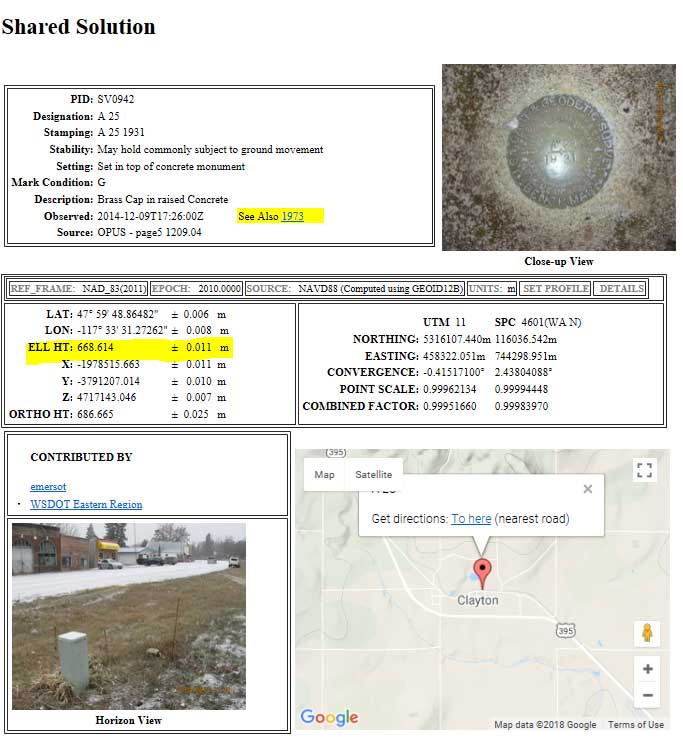
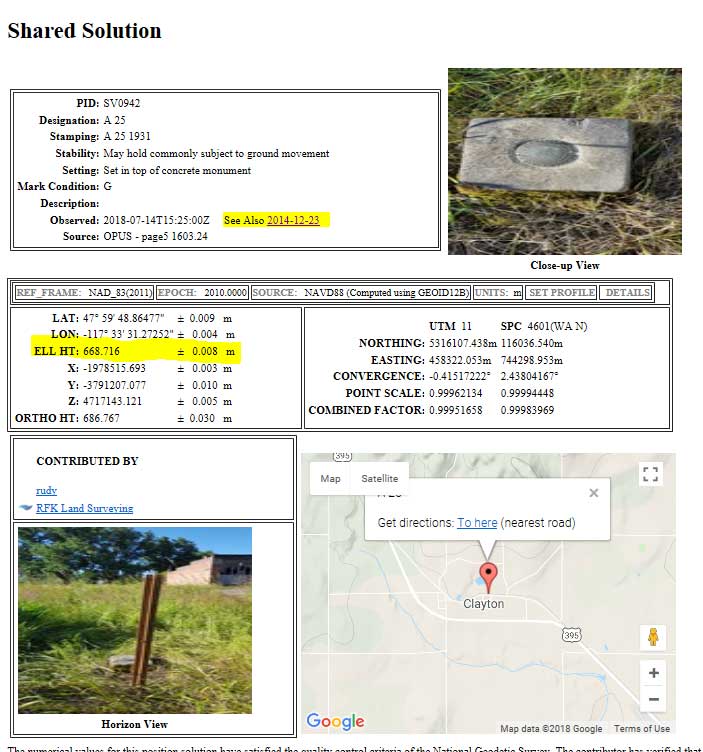
    It should be noted that the error estimates provided in the Opus Shared output indicate the ellipsoid heights are good to about +/- 1 cm. (See highlighted section in box titled “Two OPUS Shared Solution for PID SV0942.”) Saying that, the two NAD 83 (2011) ellipsoid heights disagree with each other by 10.2 cm. I like a quote that is attributed to Mark Twain – “It ain’t what you don’t know that gets you into trouble. It’s what you know for sure that just ain’t so.” (Obtained from http://lukefostvedt.com/famous-quotes-about-statistics/). I’m not suggesting that Opus Shared solutions results are incorrect. I’m attempting to provide an example of why users need to repeat all observations and to demonstrate how error estimates can be misleading.
    “It ain’t what you don’t know that gets you into trouble.It’s what you know for sure that just ain’t so.”

    Mark Twain

    (Source: http://lukefostvedt.com/famous-quotes-about-statistics/).


    Two OPUS Shared Solution for PID SV0942

    (Source: NGS website)

    07/14/2018 OPUS Solution

    Image: National Geodetic Survey

    12/09/2014 OPUS Solution

    Image: National Geodetic Survey

    The number of GPS on Bench Mark stations completed as of July 27, 2018, represents about 30 percent of the total number of stations that need to be observed. As I have explained in previous columns, there are many invalid GPS on BMs stations that may be used in the next hybrid geoid model unless more bench marks with valid NAVD 88 heights are observed with GNSS. NGS will accept data for inclusion in the next hybrid geoid model, GEOID18, until the end of August 2018. After that, NGS’ GPS-on-Bench-Mark Program will expand to include other regions and will focus on data to improve NGS datum transformation tools. This column provided an update and status report on stations observed in support of the 2018 GPS on BMs program, provided an example of how the OPUS Shared results can be used to identify a station that may have moved since it was last leveled, and the importance of repeating OPUS observations. I would encourage users to register for NGS’ next webinar on the GPS on Bench Mark Program scheduled for Thursday, Aug. 9th to hear the latest status of the program.

  • Autonomous security vehicle to patrol airport perimeter

    The airport's new autonomous ATV begins testing in August. (Photo: Edmonton International Airport)
    The airport’s new autonomous ATV begins testing in August. (Photo: Edmonton International Airport)

    An autonomous all-terrain vehicle (ATV) equipped with NovAtel Inc. technology will soon join the security fleet at the Edmonton International Airport in Alberta, Canada.

    The ATV will be used to detect people and animals that breach the airport perimeter, as well as locate holes in the fence to alert the security team.

    This is the only known autonomous ATV to be used for airport security and it will be used to monitor its 20-kilometer fence line on a narrow perimeter road, according to Hexagon, NovAtel’s parent company.

    The unarmed vehicle is controlled remotely by humans and can also drive autonomously, incorporating machine-learning to perform its tasks.

    The vehicle system includes navigation, path planning, obstacle avoidance, animal and human recognition, communication systems to airport security, geo-fencing, and situational awareness and analysis.

    The autonomous ATV patrols will focus on the following:

    • Identifying damage to the chain-link fence and fence posts, verifying barbed wire is taut and undamaged, and detecting holes or gaps under the fence
    • Detecting human or animal activity
    • Searching for obstacles using lidar

    “We would not have been able to navigate the vehicle on such a narrow road if we had not used NovAtel gear,” said Ken Brizel, CEO, ACAMP.

    The autonomous security ATV was developed by the Alberta Centre for Advanced MNT (microprocessor and nanotechnology) Products (ACAMP).

    The airport is a member of the Advanced Systems for Transportation Consortium established by ACAMP and supported by the Government of Alberta. ACAMP is a member of the Alberta Aerospace and Technology Centre at EIA. ACAMP and EIA were able to harness technologies developed by consortium members to construct and test the autonomous ATV security vehicle, readying it for regular use at EIA.

  • 58th CGSIC meeting agenda features address by Brig. Gen. Shaw

    58th CGSIC meeting agenda features address by Brig. Gen. Shaw

    Brig. Gen. John E. Shaw is Director of Strategic Plans, Programs, Requirements and Analysis, Headquarters Air Force Space Command, Peterson Air Force Base, Colorado. (Photo: USAF)
    Brig. Gen. John E. Shaw is Director of Strategic Plans, Programs, Requirements and Analysis, Headquarters Air Force Space Command, Peterson Air Force Base, Colorado. (Photo: USAF)

    The U.S. Department of Transportation and the Coast Guard Navigation Center are preparing for the 58th annual Civil GPS Service Interface Committee (CGSIC) meeting.

    The meeting will be conducted Sept. 24-25 at the Hyatt Regency Miami in Miami, Florida, in conjunction with the Institute of Navigation’s ION GNSS+ 2018 conference.

    CGSIC meetings are free and open to the public.

    Subcommittees of the CGSIC for Timing, International Information, and Survey, Mapping, and Geosciences will hold meetings Sept. 24, and a summary of these meetings will be presented to the CGSIC plenary session Sept. 25.

    The meeting includes important briefings on the status of ongoing GPS programs and a keynote address by Brig. Gen. John Shaw, director of strategic plans, programs, requirements and analysis for the Air Force Space Command.

    The CGSIC agenda in development can be found at gps.gov.

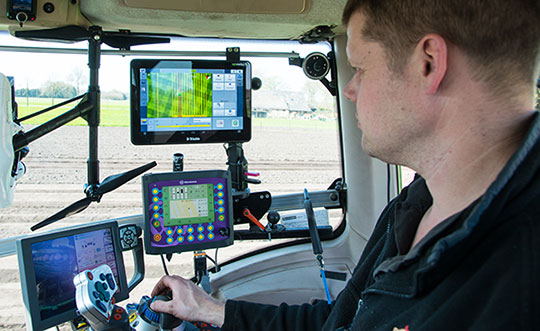
  • Boosting EGNOS for better precision farming

    Boosting EGNOS for better precision farming

    Precision agriculture depends on the precise positioning of augmented GNSS. In Europe, this augmentation is provided by the European Geostationary Navigation Overlay Service (EGNOS).

    Although EGNOS is widely available in Europe, coverage is lacking in remote and rural areas.

    To help fill the needs of farms in these areas, the Horizon 2020 AUDITOR project, funded by the European GNSS Agency (GSA), is developing a ground-based GNSS augmentation system that will deliver high-performance and cost-efficient services and applications for the agriculture industry.

    “The purpose of this project is to develop an improved GNSS ground-based augmentation system using modern and proven algorithms in highly configurable, cost-effect receivers,” said Project Coordinator Esther Lopez. “As a result, AUDITOR will enable cost-effective precision agriculture services for farmers, especially those with small and mid-sized farms in areas where EGNOS availability is limited.”

    The AUDITOR system is based on a radio frequency (RF) dual-band multi-constellation GNSS front-end and an embedded digital processing platform. The front-end receiver acquires the GNSS signals and embeds all analog and digital hardware required to convert the RF signal to digital samples.

    The digital processing platform then converts and customizes the signals for the AUDITOR systems. The system serves as the basis for providing higher level services for the end user via cloud-based web and mobile applications.

    Autonomous Future. With AUDITOR applications, farmers will be able to accurately measure spatial variability in soils and crops. Yield maps will allow farmers to precisely apply fertilizer, water and pesticides, reducing production costs and environmental impact.
    AUDITOR’s high-accuracy positioning will also enable the use of autonomous mobile robotic units for identifying weeds, pests and diseases, GSA said.

    “Producing precise maps of the soil and crops, as well as the spatially varying application of fertilizer that these maps enable, is completely dependent on the availability of an augmented GNSS signal,” Lopez said. “Thanks to AUDITOR, even areas in Eastern and Southern Europe that once were unable to get the required precise GNSS signal can reap the benefits of precision agriculture.”

    With the ever-increasing requirement for augmented yield and profitability and energy and cost savings, the future of farming is precision agriculture. By focusing on providing the augmentation needed to enable existing precision agriculture applications in Europe alone, Lopez is confident that AUDITOR will be well-positioned to compete on the market.

    This article is reprinted with permission of the European GNSS Agency (GSA).
  • Swarming USVs ready for range of missions

    Swarming USVs ready for range of missions

    Photo: Aquabotix
    Photo: Aquabotix

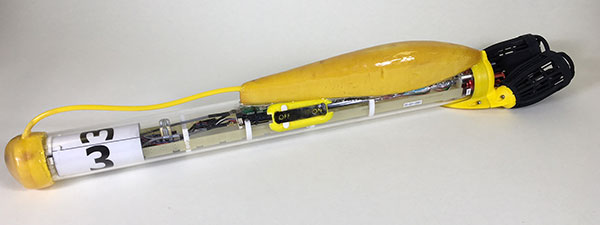
    SwarmDivers by Aquabotix are micro swarming unmanned surface vehicles (USVs) capable of diving to 50 meters and swarming in groups of 40 or more.

    Multiple SwarmDivers can function simultaneously as a single coordinated entity, be easily controlled via one operator on the surface and perform dives on command to collect valuable intelligence.

    Their design delivers rugged reliability and accuracy for applications requiring specialized sensor payloads in defense, oceanography, aquaculture, research and hydrographic survey, the company said. The units also operate collectively to quickly gather data and report back in near real time.

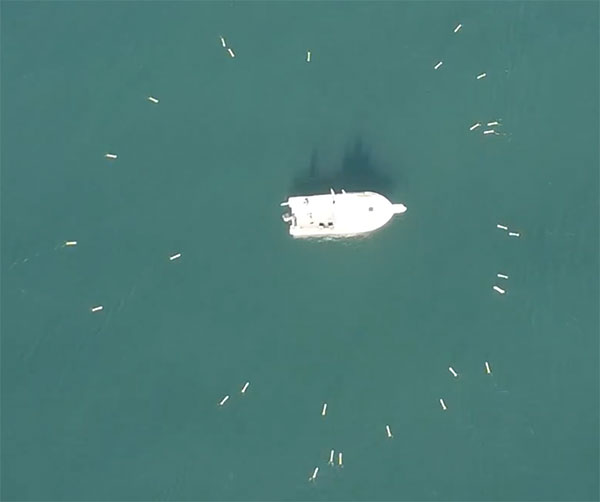
    This screenshot from an Aquabotix video shows the swarm returning to base. (Image: Aquabotix)
    This screenshot from an Aquabotix video shows the swarm returning to base. (Image: Aquabotix)

    The swarming algorithm allows vehicles to communicate with each other to make decisions as a group. This allows SwarmDiver to quickly and accurately self-arrange in various swarm formations as well as dive simultaneously to collect synoptic data sets.

    With the ability to be outfitted with customized payloads and sensors, SwarmDiver can meet a wide range of mission profiles, Aquabotix said.

    For the defense community, SwarmDiver could provide surf-break-zone operations support, enhanced navigational capabilities, explosive ordnance disposal and mine countermeasures.