Category: Applications

  • Teaming ground and air vehicles for an autonomous multi-sensor survey

    Teaming ground and air vehicles for an autonomous multi-sensor survey

    By Simon Batzdorfer, Markus Bobbe, Martin Becker and Ulf Bestmann, Technische Universitaet Braunschweig
    All images courtesy of the authors.

    Autonomous vehicles equipped with different environmental sensors, such as optical or thermal camera or a lidar, performed a team survey controlled by a central ground station. The ground station serves as a user interface to define missions and tasks and also to visualize exploration task results online. 2D stitched orthophoto or lidar point clouds are transmitted for display and processing into 3D photogrammetry. Georeferencing data is gathered by an integrated GNSS/IMU positioning system.

    In disaster scenarios such as fires, floods or search-and-rescue tasks, good situational awareness is indispensable for responders coping with a complex and often chaotic environment. In most cases, a prior known map data are outdated, and an efficient situational proceeding such as path planning or creation of a search pattern cannot be performed. This information can often only be gathered by manned exploration using ground or airborne systems, with limits on availability.

    The research project Automated Navigation and Communication for Exploration (ANKommEn) seeks to create an automated unmanned system to close this gap by providing up-to-date scenario information while increasing the safety of human resources, using unmanned aerial (UAV) and ground-based (UGV) vehicles.

    To provide up-to-date information of the desired destination area, all vehicles are equipped with identical positioning and communication hardware complemented by diverse sensors (RGB camera, infrared [IR] camera, lidar) for visual exploration. The visual sensor information is transmitted to a central ground station for visualization and/or analysis. To increase the advantages of the system, the unmanned systems should have a high grade of automation to reduce the workload of the operator so that only basic inputs have to be done by the operator. For example, just by marking a destination area and choosing a predefined task, the mission will be planned automatically, and after the corresponding waypoint-list has been transmitted to the vehicles, the mission will start.

    Automated procedures of a UAV in particular require valid position information related to accuracy, availability and continuity. In exploration areas where the UAV operates in low altitude or using a UGV, the reception of the GNSS signal can be degraded by the topology (buildings and such). Using more than one GNSS can increase the availability of position information. Vehicle control, georeferencing environmental sensor data and exploration results all require high-frequency absolute position and attitude and heading information. This data is gathered by fusing GNSS and inertial measurment unit (IMU) data.

    OVERALL SYSTEM DESIGN

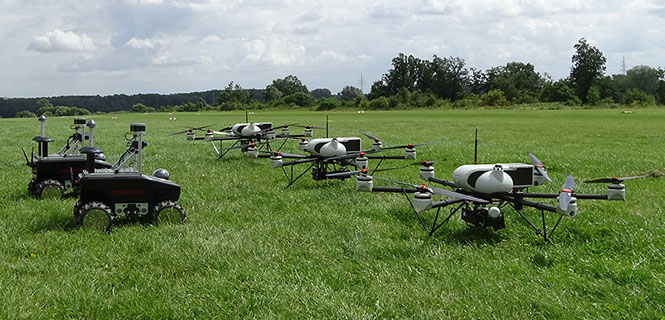
    The overall system consists of three UAVs, two UGVs (Opening photo) and a central ground control station. The latter serves as a central human-machine interface to monitor and manage cooperative operation of the UAVs/UGVs by an operator. Based on a priori known map data, exploration areas and tasks are defined and assigned to the UAVs/UGVs and will be updated with actual information of the visual sensors while performing a mission.

    Figure 1 shows the interaction and information exchange between the different vehicles and sensors.
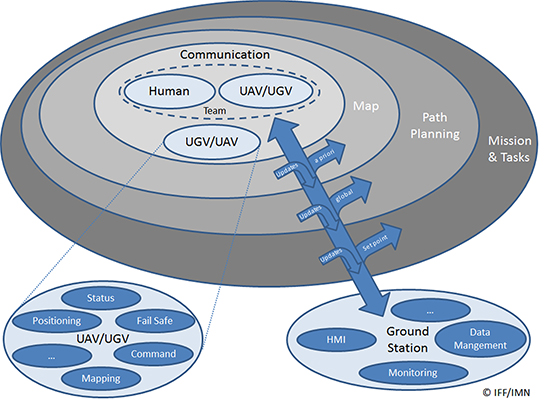
    Figure 1. Diagram of interaction and information exchange.

    All UAVs/UGVs are equipped with a navigation and communication unit (NAV/COM) and an environmental sensor payload (ENV) unit, including an RGB camera, thermal camera or a lidar respectively.

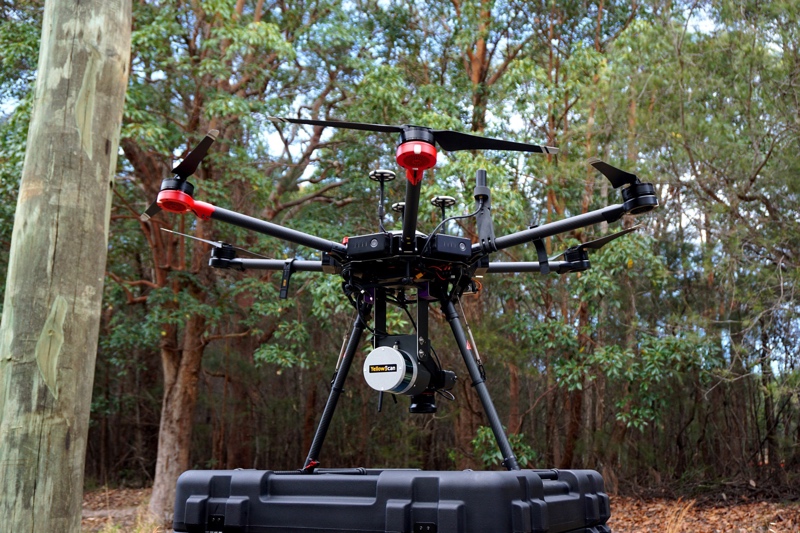
    UAV/UGV and Sensor Hardware. The UAVs carry a payload of 2.7 kg (NAV/COM unit, mounted in the upper compartment, and ENV unit mounted under the UAV) and a flight time of up to 30 minutes (Figure 2, left). The payload sensors are carried and stabilized by a two-axis-gimbal. The environmental sensor payload unit is based on three different types of sensors, which are interchangeable between the different UAVs: RGB camera, lidar and IR camera.

    For ground-based exploration, two four-wheel-drive UGVs carry a pan-tilt-zoom (PTZ) camera at the top of front chassis (Figure 2, right), and are equipped with a lidar and a thermal camera, or a stereo RGB camera, respectively.
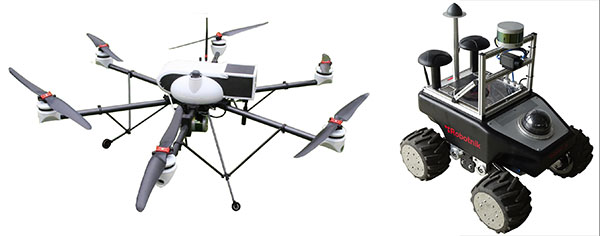
    Figure 2. UAV carrying a lidar (left) and UGV carrying lidar and IR camera (right).

    The navigation and communication unit mounted as a stack includes a network processor board for communication and data exchange between the UAV/UGV and the central ground and control station. An embedded processing board provides position calculation and GNSS-NTP-based time server. Data for the position calculation is provided by a custom-designed break-out-board (Figure 3).
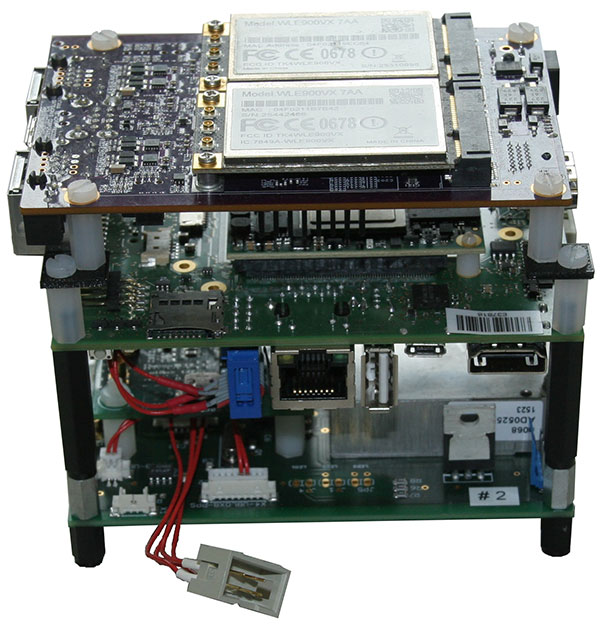
    Figure 3. Navigation and communication unit.

    Data traced by these sensors cannot be sent directly to the ground station because of the huge data amount and the limited bandwidth of the communication link. Therefore, data from the sensors are preprocessed or compressed on a small form-factor personal computer and then transmitted to the ground station.

    Ground Station. The ground station is the central device for command, control and visualization of the total system. It provides several options to display the data from the sensors and vehicles and a combination of them, and also provides automated path planning and calculation of the 3D reconstruction (photogrammetry) and online 2D stitched orthophoto.

    Software Frameworks. The basic software for determining the vehicle’s state in 3D position, velocity, attitude and heading is established within a modular navigation software framework, with the option to process data of different sensors in real time as well as post-processing for data evaluation and development purposes. Several algorithms for sensor data fusion are implemented. The algorithm for IMU/GNSS fusion is based on an extended Kalman filter and also provides an IMU data-based state vector, stabilized by GNSS information, for the visual sensors. This state vector is published by using the robot operating system (ROS), a framework for inter-process communication based on a TCP or UDP publisher/subscriber concept. The visual sensors and embedded PCs subscribe to different ROS messages, for example, the state-vector-message or information of other sensors.

    Figure 4 shows examples of the actual camera view from the UGV, and point cloulds and map generated by the UAV. The software layout can be customized by the user.
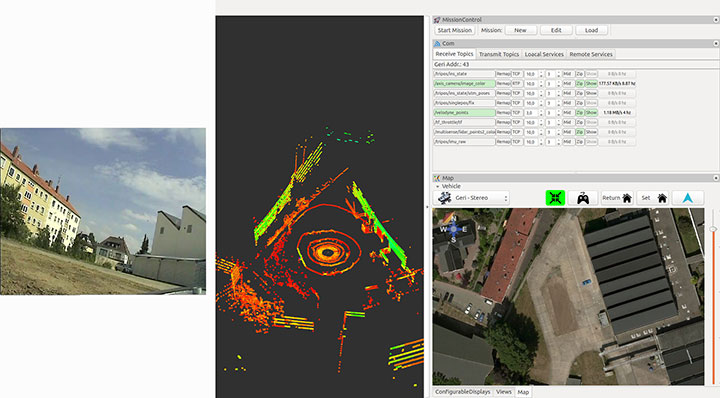
    Figure 4. From left to right: the actual view by the PTZ camera onboard the UGV, the point cloud gathered by the UAV’s lidar, and the mission parameters and map of an aerial view.

    POSITIONING OF UAV AND UGV

    Automated operation of UGVs and UAVs requires valid position as well as attitude and heading information. In the case of using only one GNSS, signal quality and availability can be degraded by the environment (buildings) and can result in less precise or even a lack of position information.

    GNSS Multi-Constellation. To overcome the risk of poor availability of GNSS-based position information, parallel usage of different GNSS can raise the number of received satellite signals: GPS, GLONASS, the evolving Galileo and BeiDou. When using a multi-constellation approach for positioning, one has to take care of several differing aspects between the GNSS. Each system uses a different geodetic reference frame and time basis. Measurements gathered from another GNSS system must be transformed into the reference frame of the desired system. The geometric distribution of the satellites is improved by using more than one GNSS constellation, indicated by a lower dilution-of-precision value.

    The navigation software framework is designed for real-time computation and also for post-processing. In post-processing, the recorded sensor data is streamed to the software framework with the option of changing several parameters and settings for calculation. One option is to exclude satellites at low elevation from position calculation by changing the cut-off elevation for these satellites. This parameter will be changed to simulate environmental conditions that block receiving GNSS signals, like buildings within urban scenarios, to compare the availability of received GNSS signals for single- and multi-constellation-based position calculation.

    Recorded data of a real-world test serves as the database for the post-processing with different cut-off elevation parameters. At the beginning of the field test, there was a short initialization period to boot the OS and to start basic processes for positioning. After that, a predefined mission was flown and the GNSS measurements have been saved for the described post-processing.

    Post-processing has been performed with different cut-off elevation parameters of 5° up to 35°. In the case of 35°, the number of GPS satellites is reduced to the minimum for position calculation of four, in contrast to 5–7 available satellites for a multi-constellation based solution.

    GNSS/IMU Fusion. Using the GNSS multi-constellation approach can increase availability of position information. For attitude and heading determination, an IMU is nevertheless indispensable. Additionally, the frequency of the pure GNSS-based positioning information is usually between 1 Hz to 5 Hz within the described hardware setup. Meaningful georeferencing of the environmental sensors requires much higher frequency position and attitude information.

    The IMU provides high-frequency 3D measurements of accelerations and angular rates. Using common strapdown algorithm processing, high-frequency position, velocity, attitude and heading information is provided in real time. Due to the short time stability of pure inertial navigation, the GNSS positioning results are used for aiding purposes within the Kalman filter’s update step. To overcome the absence of GNSS aiding information even when using multi-constellations, there are mainly two options. First, a short coasting period is possible after the data fusion has reached a steady state.

    Second, due to the highly modularly design of the navigation software framework, it is possible to use position or attitude increments from environmental sensor data processing for aiding the IMU.

    The vehicle’s state vector is then distributed with high frequency within the system for georeferencing measurements of the environmental sensors, especially the RGB camera and the lidar for photogrammetry and simultaneous location and mapping (SLAM) applications.

    PHOTOGRAMMETRY AND SLAM

    In major fire scenarios, maps can be out of date. Therefore, techniques have been developed to gather a 2D overview based on several single RGB pictures taken and processed on board a UAV and transmitted to the ground station via data links. Additional processing of a 3D reconstruction of the scenario is an integrated feature within the ground station. Both approaches were implemented to get an automated rapid aerial mapping solution.

    In the case of the 2D overview, SLAM algorithms, often used in robotic research, are adapted for this specific use case. These algorithms provide good results for a rapid aerial mapping solution to get an overview of the scenario, because the map is updated incrementally with every new image, but they are less precise, which can be compensated for by using the photogrammetric 3D reconstruction. The live mapping (SLAM) approach is based on the ORB-SLAM algorithm, and the photogrammetry-based approach uses commercially available photogrammetry software.

    The systems, on the UAV for 2D and for 3D on the ground station, use the ROS framework for processing the visual sensor data and the described techniques for positioning, georeferencing and attitude determination. For data exchange between these frameworks, several software interfaces have been implemented. Figure 5 displays a flowchart of the implemented workflow.

    The sensor/input data is received by corresponding nodes on the aerial vehicle. After adding the camera pose information to the image in the geo-image flight node, the image is sent to the geo-image ground node on the ground station. The SLAM process is separated into two parts. The SLAM tracker node calculates the transformation between images, and the SLAM stitcher node applies the transformations. The transformed images are displayed by the visualization node. The photogrammetry node receives the georeferenced images, stores the data, and initiates the photogrammetric processing once the survey is finished. The results can also be displayed by the visualization node and exported in a desired format.

    Visual SLAM. Computer vision-based algorithms have developed rapidly over the last few years. One method estimates a pose by using monocular image processing, known as parallel tracking and mapping (PTAM). This integrates a bundle adjustment and separates the tracking and the mapping procedure into different threads, leading to a real-time capable framework. These basic PTAM principles have been integrated into a robust loop-closing and another method of relocalization, known as Oriented FAST and Rotated BRIEF (ORB SLAM), shown in Figure 6. Here, tracking, local mapping and loop closing are separated into different threads (gray boxes), with the main map and place recognition in the middle.
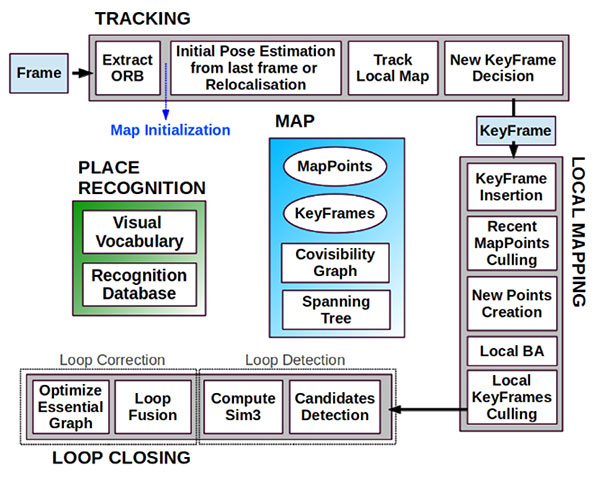
    Figure 6. ORB SLAM system overview [Mur-Artal, 2015].
    The tracking thread predicts the current pose from the last known position and movement by using a constant velocity model and performs a guided search of map points. If these points are found near the estimated position, the velocity model is valid and the tracking procedure continues. Otherwise, the tracking is lost and a relocalization in the global map starts by using a subset of features, which are increased after detection of corresponding features in other keyframes to optimize the camera pose and, finally, the tracking procedure continues. The last step of this procedure is to decide whether the current frame contains enough information to be inserted as a new keyframe for further calculations.

    To mark a frame as a new keyframe, the frame must fulfill all of the following conditions:

    • More than minimum number of frames has passed.
    • Local mapping is on idle or condition 1 fulfilled.
    • A minimum number of 50 points is observed.
    • A maximum of 90% of the features is already observed by the other frames.

    When a new keyframe is passed to the local mapping procedure and inserted as a node into a co-visibility graph structure, new correspondences are searched in the connected keyframes to triangulate new points. Based on the information accumulated during the tracking, a point culling keeps only high-quality points in the map as well as a culling of redundant keyframes.

    Then a loop closing is performed. This is one of the main improvements compared to PTAM. If a loop is detected, the drift accumulated in the loop is computed, and both sides of the loop are aligned and visible points are fused. In a final step, a pose graph optimization is done to achieve global consistency.

    This information of the 3D camera pose is used to generate a 2D orthophoto in real time while the vehicle is flying. To create a 2D orthophoto, a common reference frame is approximated, which is orthogonal to all camera measurements. The projection is performed by using a projection model based on a pinhole camera.

    After the compensation and distortion, the whole image can be stitched to the current global map.

    Photogrammetry. This approach uses off-the-shelf photogrammetric processing software. The processing is triggered automatically when the survey is completed and all images are transferred to the ground station via data link. For georeferencing of the images, the camera location and the inner camera geometry were written to the EXIF file of each image by the geo-image ground node (Figure 5). To ensure an acceptable compromise between orthophoto quality and the required processing time, an analysis regarding the impact of the most relevant processing parameters has been performed.
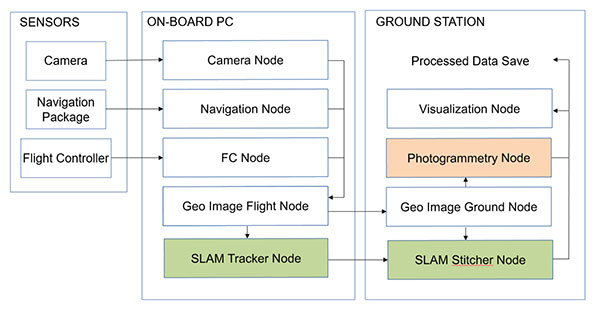
    Figure 5. ROS node layout with SLAM (green) and photogrammetry workflow (red).

    The photogrammetry process consists of four steps:

    • camera alignment (optimizing the homographic equation)
    • mesh creation by generated tie points
    • orthophoto creation (dense cloud or digital elevation model)
    • export.

    Analyses and Evaluation. To evaluate the correct workflow of both approaches of 2D live-stitching and the 3D photogrammetry, a real-world flight test above agricultural cropland has been performed. The results of both approaches are shown in Figure 7 and Figure 8. Generally, agricultural cropland and its mean textured surface pose a challenge for mapping processes because of the limited number of trackable features.
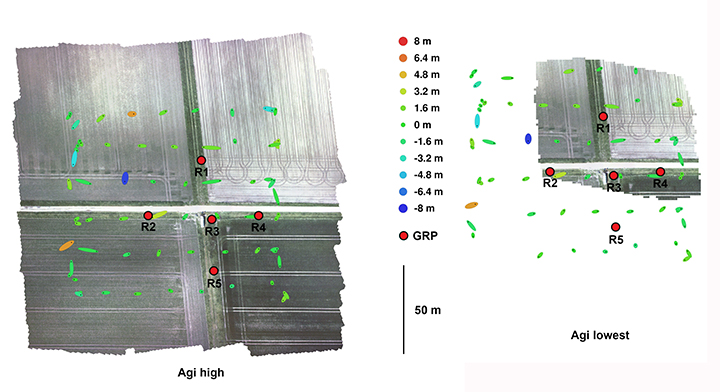
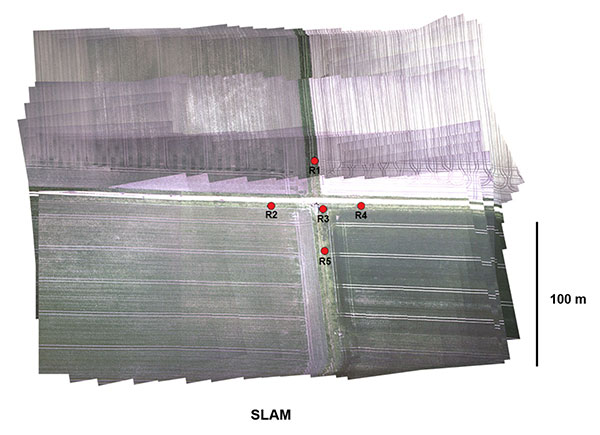
    Figure 7. Orthophotos created with the profiles high and lowest (including ground reference points).
    Figure 8. Orthophotos created with 2D live stitching approach of cropland.

    Four predefined profiles were used to cover the requirement of compromise between processing duration and quality of the generated orthophoto. Each profile level generates a corresponding level of alignment accuracy and mesh face count: lowest, low, medium and high.

    To estimate the accuracy of the created maps by the different profiles, five ground reference points (GRPs) were distributed over the mission area. The location of the GRPs was determined using a RTK-GNSS system leading to a horizontal RMSE below 2 cm. To enable robust processing for this scenario, the overlap and the sidelap was chosen to be 70%. A ground-sampling distance (GSD) of 2 cm was needed to identify the GRPs. This resulted in a mission consisting of six times 100-meter (m) lines with a distance of 25 m in an altitude of 60 m over ground. During the flight time of 4.5 minutes, 271 images were taken.

    To compare the profiles, they were triggered one after another with the same set of images. The created results are shown in Figure 7. All profiles resulted in consistent solutions and were successfully georeferenced. The map based on the lowest profile could not recreate the complete area (Figure 7, right). The remaining profiles led to similar results without notable differences to visual inspection. The processing time varied between 1.2 and 3.6 minutes. A comparison of this and other criteria is given in Figure 9.
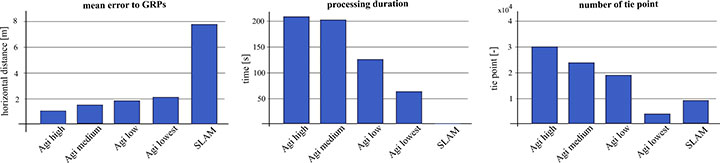
    Figure 9. Evaluation and comparison of defined software profiles and visual SLAM.

    The created final image of the SLAM pipeline is shown in Figure 8. The image was updated with every new image and was therefore finished before the UAV landed. The mean location error measured using the reference points was about 8 m, significantly larger than the errors observed in the photogrammetry results. In Figure 9 the results are contrasted to the results of the photogrammetry approach.

    While the mean error in the low profile is half as high as in the lowest profile, the calculated errors using the medium and high profiles are not enhanced significantly. The number of tie points created by the lowest profile is an order a magnitude lower compared to the other three profiles.

    We conducted flight tests on Langeoog island in the North Sea, to gather information on efforts to protect the island’s coastline from water erosion. For this reason, sand was selectively washed up to the coastline by dredgers at the beginning of October 2017. Between Oct. 26 and 31, due to severe weather with a storm flood, a huge erosion of the washed up sand occurred, and the result is shown in Figure 10. The level of erosion was determined by comparison of the orthophoto of the same area. The dislocation averaged out to 9.9 m with some peaks up to 17.6 m.
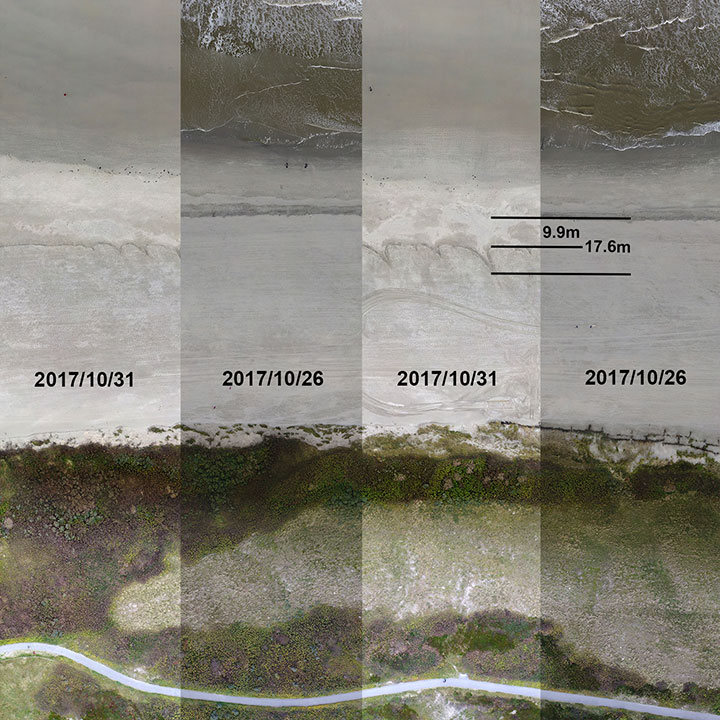
    Figure 10. Evaluation of erosion.

    The 3D photogrammetry provides a more detailed image compared to the image of the 2D-live-stitching approach (Figure 11), but both approaches can provide the desired information of the area.
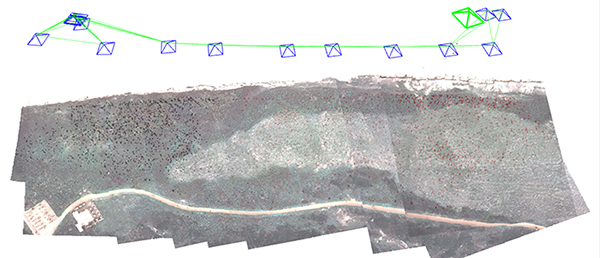
    Figure 11. Result of the SLAM approach with camera poses and tracked features.

    Both implemented approaches were successfully integrated to get the desired fully automated rapid aerial mapping solution. This also includes the basic tasks of the automated mission planning, camera control, image transport to ground station, automated processing and the visualization of the results.

    CONCLUSION

    The benefits of multi-constellation GNSS positioning have been demonstrated with a focus on UAVs and UGVs operating in catastrophic scenarios, especially where GNSS signal reception might be blocked. This position information is also used for georeferencing of images and visual reconstruction of the area. The overall system has demonstrated the capability of an automated orthophoto generation. Both implemented mapping methods — a 2D live stitching and a 3D photogrammetry — provided results that fulfill the requirements to get an instantaneous 2D overview and a contemporary 3D reconstruction of the area.

    ACKNOWLEDGMENTS

    This work was done within the joint research project ANKommEn, funded by the German Federal Ministry of Economic Affairs and Energy, administered by the Space Administration of the DLR (funding code: 50NA1518). Project partners are the Institute of Flight Guidance (IFF), the Institute of Mobile Machines and Commercial Vehicles (IMN) — both part of Technische Universität Braunschweig — and AirRobot GmbH & Co. KG, a German manufacturer of multirotor UAVs. The professional fire brigade of Braunschweig and the Lower Saxony Water Management, Coastal Defense and Nature Conservation Agency also participate as associated project partners.

    MANUFACTURERS

    The UAVs are modified AR200 hexacopters, manufactured by AirRobot GmbH & Co. KG and equipped with sensors and processing units by TU Braunschweig. The UGVs are by Robotnik Summit XL. The network processor board is a Ventana GW5520, with a an embedded Cortex A9 processing board, Phytec phyBOARD-Mira i.MX6. A custom break-out board by the Institute of Flight Guidance combines an Analog Devices ADIS16488 IMU and a u-blox LEA-M8T GNSS receiver. The UAVs carry an Allied Vision Manta G-917 RBG camera, a Velodyne VLP-16 lidar, a FLIR A65sc IR camera and an Intel NUC. The navigation software framework is by the Institute of Flight Guidance. The photogrammetry software is Agisoft Photoscan.


    SIMON BATZDORFER holds a Dipl.-Ing. in mechanical engineering and is a research engineer at the Technische Universitaet Braunschweig, Institute of Flight Guidance (IFF).

    MARKUS BOBBE holds a M.Sc. in aerospace engineering and is a research engineer at the Braunschweig IFF.

    MARTIN BECKER holds a Dipl.-Ing. in aerospace engineering and is a research engineer at the Braunschweig IFF.

    ULF BESTMANN received his Dr.-Ing. in mechanical engineering from TU Braunschweig. He is head of the navigation department of the IFF. He co-founded the company messWERK GmbH, a service provider in flight testing and certification.
  • Innovation: Indoor positioning using wearable ultra-wideband antennas

    Innovation: Indoor positioning using wearable ultra-wideband antennas

    Body Fitting

    UWB is being used in a novel microwave imaging and localization system, one which features Antonio Vivaldi’s namesake antenna.

    By Fengzhou Wang and Guohua Wang

    INNOVATION INSIGHTS with Richard Langley

    VIVALDI. No, you aren’t reading an article in Gramophone. This happens to be the name of a particular kind of broadband antenna, which is particularly useful at microwave frequencies and for ultra-wideband (UWB) applications in particular. It was invented by the British electrical engineer Peter J. Gibson in 1978 while working at Philips Research Laboratories. In a 1979 conference paper entitled “The Vivaldi Aerial,” Gibson described it as “a new member of the class of aperiodic continuously scaled antenna structures and, as such, it has theoretically unlimited instantaneous frequency bandwidth.” He went on to say “This aerial has significant gain and linear polarisation and can be made to conform to a constant gain vs. frequency performance. One such design has been made with approximately 10 dBI gain and -20 dB sidelobe level over an instantaneous frequency bandwidth extending from below 2 GHz to above 40 GHz.” Broadband indeed!

    So why did Gibson name the innovative antenna “the Vivaldi aerial”? It has to do with its shape. Another term for the Vivaldi antenna (sometimes called the Vivaldi notch antenna) is the tapered slot antenna. The planar antenna, constructed out of thin metal sheet or printed circuit board (PCB), features a slot line gap cut out of the sheet or etched from the PCB, which gradually flares in the direction of wave propagation (see Figure 1 in this month’s article to see what a Vivaldi antenna actually looks like). Since the spacing of the gap is related to the wavelength of the radio waves that can be launched, the antenna can be used over a wide frequency range not unlike the log-periodic antenna used in shortwave broadcasting or the biconical antenna and its butterfly antenna subtype used for UHF TV reception. Of course, according to the reciprocity theorem, an antenna designed to transmit radio waves can generally be used to receive radio waves with the same antenna properties (gain, bandwidth and so on).

    But let’s get back to the tapered slot antenna’s formal name. According to one his co-workers, the shape of the antenna reminded Gibson (who was also a musician and composer) of the cross-section of an early trumpet. So he named his antenna after Antonio Vivaldi, the famous baroque music composer, who wrote several concertos featuring trumpets. And 1978, the year of the antenna’s invention, was the three-hundredth anniversary of Vivaldi’s birth. It doesn’t hurt that the shape of the slot also looks a bit like a cursive “V” when the antenna is stood on its end.

    While the basic Vivaldi antenna generates (or receives) linearly polarized waves, it is possible to combine two elements at right angles to generate (or receive) circularly polarized waves.

    Because of its broadband characteristics and ease of PCB manufacturing, the Vivaldi antenna has been used extensively in UWB applications. Conventional radio transmissions use a variety of modulation techniques but most involve varying the amplitude, frequency and/or phase of a sinusoidal carrier wave. But in the late 1960s, it was shown that one could generate a signal as a sequence of very short pulses, which results in the signal energy being spread over a large part of the radio spectrum. Initially called pulse radio, the technique has become known as impulse radio ultra-wideband or just ultra-wideband for short. The bandwidths of UWB signals are quite large. For example, in the U.S., current Federal Communications Commission rules for pulse-based positioning or localization implementations require the applied bandwidth to be between 3.1 and 10.6 GHz and the bandwidth to be greater than 500 MHz or the fractional bandwidth to be more than 0.2.

    The use of large transmission bandwidths offers a number of benefits, including accurate ranging and that application in particular is being actively developed for positioning and navigation in environments that are challenging to GNSS such as indoors and built-up areas.

    In this month’s column, we learn how UWB is being used in a novel microwave imaging and localization system, one which features Antonio Vivaldi’s namesake antenna.


    Indoor localization is challenging work using traditional location-based services such as GPS. Approaches for indoor position estimation have used radio-frequency (RF) signals including narrowband signals such as Wi-Fi and Bluetooth. Impulse radio ultra-wideband (UWB) signals have also been widely investigated. Compared with narrowband signals, UWB signals provide high signal-to-noise ratio, which helps to provide an accurate estimate of signal arrival time for time-based location algorithms such as time of arrival (TOA). Furthermore, UWB signals provide larger coverage areas and a ranging capability. Sub-millimeter positioning accuracy is achievable. And UWB-based location has an inherent high time resolution making it useful in a tracking system for medical and other applications.

    A number of investigations in UWB positioning have already been carried out, with several relatively expensive commercial UWB kits available from companies such DecaWave and BeSpoon. But additional work still needs to be carried out to fully evaluate the UWB solution, so this is still an open research topic. One problem area requiring further investigation is positioning in the non-line-of-sight (NLOS) environment. This is considered the main challenge for UWB location, since it is associated with strong fading due to reflection and diffraction from various obstructions such as furniture in the room. Various threshold crossing methods using techniques of energy detection, correlation and the multiple signal classification (MUSIC) spectral analysis algorithm have been used to resolve the multipath propagation problem in NLOS environments. However, these approaches require complicated signal processing, which increases the computing cost.

    Moreover, UWB technology is also being widely introduced in microwave imaging for military and biological applications. It provides high-precision detection and high-resolution images, depending, in part, on the operating frequency range. The radar-based microwave imaging or MWI is a time-domain confocal imaging method that aims to indicate the position of the targets by use of the delay time of the reflected signal. MWI technology highlights the target from the testing environment by using different values of the dielectric permittivity constant.

    In this article, we propose a hybrid method combining MWI and localization of body-worn UWB antennas for improving the accuracy of indoor positioning. The proposed system will be able to differentiate an LOS environment from an NLOS environment using MWI detection ability, and then adjust the scanning antenna array setup using robotic support. Furthermore, we introduce a threshold value in the filter function to highlight major obstructions in an NLOS environment such as a physical item. Using this proposed system for TOA measurements, we have obtained an overall average accuracy in two-dimensional localization of around 1.7 to 2.5 centimeters.

    SYSTEM EXPERIMENTAL SETUP

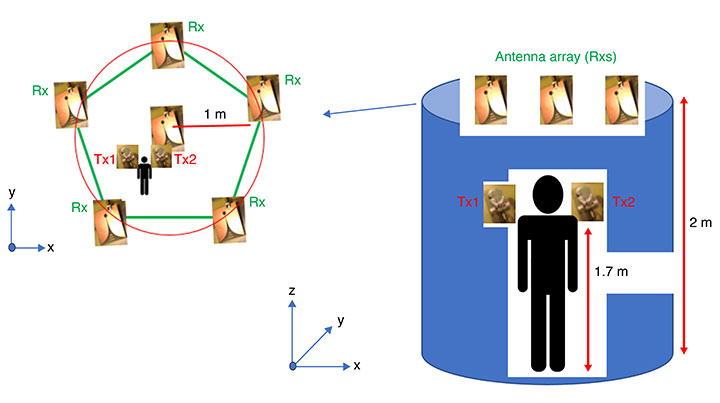
    We have developed a robotic antenna array for indoor microwave imaging to assist in indoor location with wearable antennas. The basic architecture of the proposed UWB localization system consists of two components: tag antennas and anchor antennas. Two thin-film tag antennas are worn on both shoulders of a human, and seven wideband Vivaldi antennas (also known as tapered slot antennas), acting as anchor antennas, are mounted on individual robotic supports, which can adjust the height and the rotation angle of each antenna. All the antennas are fabricated with printed-circuit board (PCB) material to reduce the cost.

    FIGURE 1. UWB antennas setup for the proposed location approach.

    In FIGURE 1, the Vivaldi antennas are shown with blue dots and are placed on the top of the robotic support 2 meters above the ground. The antenna array covers a scanning area with a radius of 2 meters. The two compact wearable tag antennas are placed on the left and right shoulders of the target human at a nominal height of 1.7 meters.

    Other main components of the proposed system are shown in FIGURE 2.

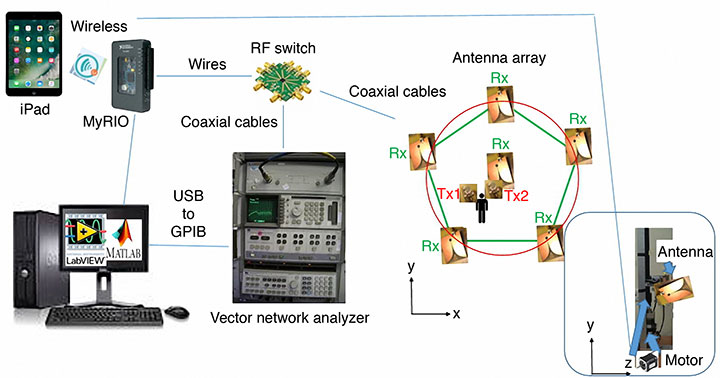
    FIGURE 2. The proposed system diagram.

    The system can be manually controlled by an Apple iPad or automatically controlled by a personal computer (PC). The PC runs the National Instruments (NI) Laboratory Virtual Instrument Engineering Workbench (LabVIEW) programming environment and an NI instrument monitor for debugging the operating process. Further information processing is carried out by combining the received signal from a vector network analyzer (VNA) though the USB-based NI-DAQmx driver software and associated cable and a mobile device such as the Apple iPad for remote control and cloud access. Two ports of the VNA are connected to an RF switch to transmit and receive signals using the antennas located in the scanning area. During the detection phase, the anchor antennas are sequentially active, and a number of signal time series are transferred back to the PC for imaging processing. The delay-and-sum algorithm is used for signal processing and imaging reconstruction in Matlab to find the position of any obstruction in the scanning area.

    The following specific components were used in the experimental setup shown in Figure 2: an Agilent HP 8510B VNA (operating from DC to 20 GHz for two-channel acquisition), a single-pole eight-throw (SP8T) switch (an Analog Devices HMC321LP4 on an evaluation PCB forming a switchboard), seven directional UWB Vivaldi receiving antennas (operating from 2 to 14 GHz); two body-worn UWB transmitting thin-film antennas (operating from 3 to 9 GHz), a reconfigurable input/output device based on a field-programmable gate array (FPGA) and a microprocessor (NI myRIO-1950 board), a general-purpose interface bus (GPIB) to USB cable (Agilent 82357B), and a personal computer running LabVIEW and Matlab.

    PRINCIPLES OF OPERATION

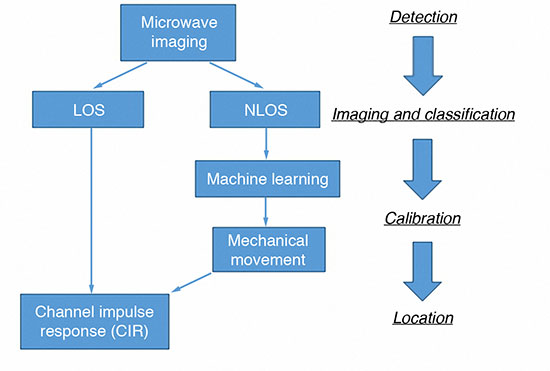
    In our proposed technique, the range-based TOA approach is implemented, making use of the high accuracy obtained by the fine time resolution of the applied UWB impulse signal. FIGURE 3 shows a flowchart of the proposed localization scheme in our approach. Initially, the system needs to be calibrated to normalize the responses of all the antennas in the anchor antenna array and to eliminate the effect of reflections from the environment. To calibrate the system for microwave imaging, no objects should be present in the scanning area at this stage.

    FIGURE 3. Proposed scheme for UWB localization in realistic environments with multipath situations.

    There are four main phases of the operation. Firstly, the radar-based UWB microwave imaging system is introduced into the localization system to classify the LOS and NLOS environments. If the environment is LOS, the system will go to the location phase directly. If the environment is NLOS, further operations for the antenna array configuration need to be carried out to reduce the multipath effect from the non-target object. In this case, the only located target is the pair of wearable tag antennas.

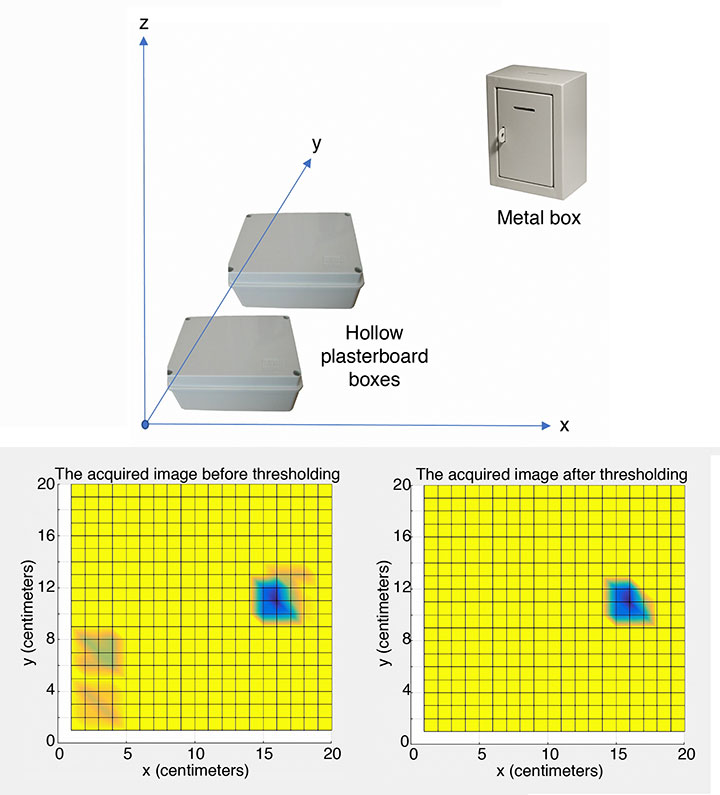
    Secondly, the system moves to the imaging and classification phase involving the Vivaldi antenna array on the anchor station. Using UWB impulses for MWI, the imaging system can detect the existence of inhomogeneity within a structure or medium and a two-dimensional (2D) image can be developed as shown in FIGURE 4.

    FIGURE 4. (Top) Layout of test setup. (Bottom left) The acquired imaging on shoulder plane before thresholding. (Bottom right) After thresholding.

    During the imaging process, one wearable antenna is transmitting a Gaussian pulse while the other is receiving the scattered signals. Circular synthetic aperture radar (CSAR) and elevation-CSAR (E-CSAR) are widely used approaches to extract 2D spatial information of the imaging scenario and have been used for small area 2D remote sensing and foliage target detection. For our current work, we have adopted the CSAR approach. We developed Matlab code to process the data and generate images.

    Various material obstructions such as hollow plasterboard boxes, solid concrete items and metal boxes were investigated during our experiments. We had to define threshold values for the various materials to get a more visually acceptable image.

    According to the experiments, metal has a significant effect in NLOS environments, and the threshold value was used to optimize the final imaging result (a 20-pixel by 20-pixel image). The scanned area could be visualized with the imaging results depending, in part, on the heights of the antennas on the anchor station and the threshold value used. In this case, two hollow plasterboard boxes are filtered out, leaving the metal box in the image as shown in Figure 4(c).

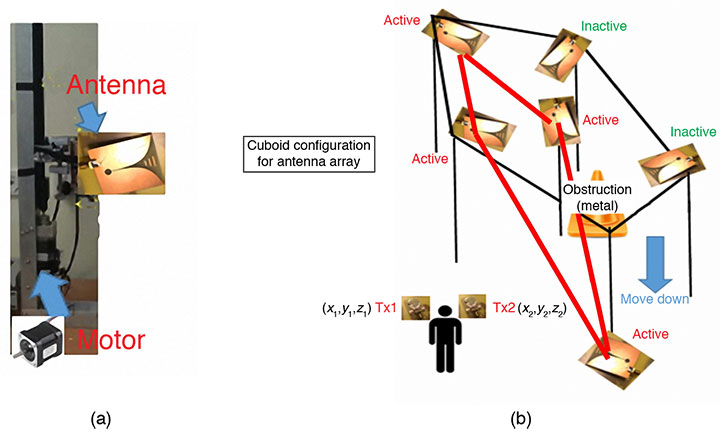
    In the third phase of the operation, the image result is fed into the machine learning algorithm used in the calibration phase. A pre-defined geometry of the antennas on the anchor stations, such as the six anchor stations in a cuboid shape, Y-shape or L-shape, was chosen for implementation in the current environment. The height and angle of the anchor antenna array pattern were adjusted using motors controlled by the NI MyRIO board. In this scenario, all the antennas on the anchor station are receivers (Rxs), and only body-worn antennas are transmitters (Txs).

    In this particular experiment, the obstruction (the metal box) is detected on the right upper side of the scanning area, so the cuboid configuration was selected as the anchor station setup. Four antennas on the left of the area were selected as receiving antennas as shown in FIGURE 5. Figure 5(a) highlights one of the antennas.

    FIGURE 5. (a) Setup of anchor station. (b) Pre-defined geometry setup for anchor stations used for the experiment of Figure 4.

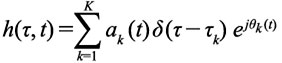
    Finally, in the fourth (location) phase, the time of arrival of the signal from the transmitting antenna array at the receiving wearable antenna is estimated by channel impulse response (CIR) and peak detection techniques. An inverse fast Fourier transform (IFFT) is then applied to obtain the impulse response of the measured channels. The channel impulse response is given by:

    where δ is the Dirac delta function, K is the number of resolvable multipath components, τk are the delays of the multipath components, ak are the path amplitude values, and θk are the path phase values. The MyRIO board controls the RF switch to circulate each receiving antenna and the corresponding S-parameter value (S21) is passed through the GPIB-to-USB cable for storage in the personal computer. The CIR, a peak detection technique and a TOA data-fusion method are used to accurately estimate the target’s location (xm, ym). Let (xi, yi) represent the position of the ith transmitting antennas, and r represent the range value obtained from the TOA measurement:

    RESULTS

    Let us summarize the procedure we followed for an experimental test of our proposed approach as described in the previous section. Our hardware setup is shown in Figure 1, and we carried out the experiment to demonstrate performance in both LOS and NLOS environments. Firstly, a 2D image of the scene area was reconstructed using the time-varying backscattered intensities as shown in Figure 4.

    Secondly, the image is processed based on a database to detect the dielectric constants of the obstructions. The shape of the obstruction might not be completely delineated as the low resolution of the image favors an increased efficiency of the imaging processing. However, the position of the obstruction can be found whether it is on a critical path or not. Thirdly, the proper archor-station setup is implemented using the MyRIO board to control the RF switch and antenna motors according to a pre-defined database in the personal computer. Lastly, the peak detection algorithm is used to estimate the TOA of the UWB signal from the Tx at the Rx. The TOA is directly estimated by the detection of the strongest peak of the CIR.

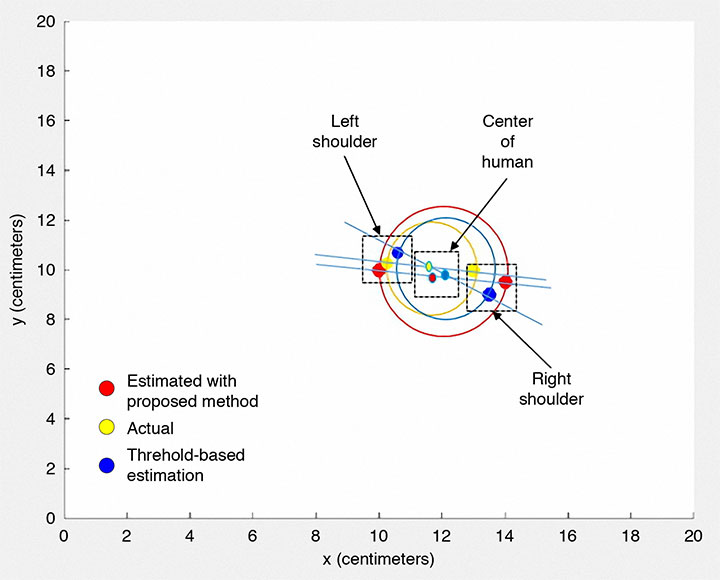
    FIGURE 6 shows the localization results for the situation in Figure 4. The same experimental method was repeated but using a threshold-based TOA estimation procedure, and the results compared with our procedure. The results using that approach are also displayed in Figure 6.

    FIGURE 6. UWB localization: estimated and actual positions of the antennas placed on the body for the environment as shown in Figure 5.

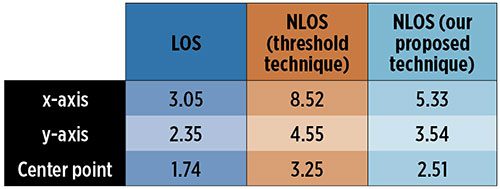
    In TABLE 1, we summarize the localization errors obtained in the different environments using the two estimation techniques. The average accuracy achieved for our proposed approach for a single antenna is in the range of 3 to 5 centimeters. Given that there are two sensing antennas, one on each shoulder, we could establish a middle point as the position of the human body, and combining the results of each antenna, we could improve the accuracy to about 2.5 centimeters in the NLOS environment.

    TABLE 1. Average localization error in centimeters for different testing environments with different estimation methods.

    The method accuracy depends on the pre-defined solution for the anchor antenna array in the NLOS environment, and the estimation accuracy could be improved by training the hardware during the operating period. Furthermore, the localization accuracy also can be enhanced by increasing the number of active anchor stations. However, this will cost more in terms of hardware implementation and also require more space for the apparatus.

    CONCLUSIONS

    This article presents a hybrid UWB technique combining radar-based microwave imaging and localization of a body-worn UWB antenna for mapping 2D environments. We provided an overview of the concept and method of detecting obstructions, and described a sample implementation that proved the concept and provides ideas for further improvements.

    Our results demonstrate the usefulness of the proposed technique, which provides similar performance regarding computational load and accuracy compared to traditional methods using a threshold-energy-based algorithm such as the search-back method and least-edge detection methods. The technique also is able to distinguish between LOS and NLOS environments.

    Our approach has some advantages compared to the common methods for NLOS location. One advantage is the reuse of the anchor station for the microwave imaging setup to get low-resolution results for calibration. In addition, the reconfigurable anchor-station setup could be suitable in any NLOS environment with the predefined database. The database could also be improved even after the hardware system is set up. Furthermore, since the radar-based UWB microwave imaging technique uses a short pulse of low-power microwaves in the frequency range 3 GHz to 10 GHz, the measured scattered signal in the far-field can be used for imaging specific material according to its dielectric constant.
    However, since the power level of the signal is limited, in part due to safety regulations, it is only detected over a short distance. The UWB pulse has a large bandwidth and, as such, the reflected signals contain a significant amount of information about the target for further imaging applications. Moreover, the anchor-station configuration model can be scaled by a factor suitable for the dimensions of any room or area under observation for a variety of indoor location applications.

    A couple of important points to note is that although it is a radio technique, UWB is license-free because of its low power, and UWB technology’s carrier-less transmission property offers the advantage of simple and compact hardware.

    Importantly, the performance of our proposed technique achieves more accurate localization of humans, for example, by using two body-worn transmitting antennas, one on each shoulder. The reconfigurable hardware structure under computer control provides the potential for a self-upgrading platform for indoor positioning with a more appropriate anchor-station setup being achieved using machine learning technology.

    ACKNOWLEDGMENTS

    The authors thank Iain Gold of the School of Engineering, University of Edinburgh, for his help in the fabrication and measurements of the antennas. The authors also acknowledge the Scottish Microelectronics Centre at the University of Edinburgh for measurement equipment support. This article is based on the paper “Localisation of Wearable Ultra-wideband Antenna for Indoor Positioning Application” presented at ION GNSS+ 2017, the 30th International Technical Meeting of the Satellite Division of The Institute of Navigation, Portland, Oregon, Sept. 25–29, 2017.


    FENGZHOU WANG received a B.S. (Hons.) degree in electrical engineering from Birmingham City University in England, and an M.S. degree from the University of Southampton, England. He is working towards a Ph.D. degree in the School of Engineering, University of Edinburgh, Scotland. His research addresses the area of RF sensor systems design and integration.
    GUOHUA WANG received his B.S. degree in machinery design and manufacture from Southwest Agricultural University, Chongqing, China; an M.S. degree in agricultural mechanization engineering from China Agricultural University, Beijing, China; and a Ph.D. degree in measurement technology and instrumentation from Beihang University, Beijing, China. He is a lecturer in the School of Instrumentation and Opto-Electronic Engineering in Beihang University. His research interests include automatic testing and partially reconfigurable systems.

    FURTHER READING

    • Indoor Positioning in General

    Getting Closer to Everywhere: Accurately Tracking Smartphones Indoors” by R. Faragher and R. Harle in GPS World, Vol. 24, No. 10, October 2013, pp. 43–49.

    Recent Advances in Wireless Indoor Localisation Techniques and System” by Z. Farid, R. Nordin and M. Ismail in Journal of Computer Networks and Communications, Vol. 2013, 2013, 12 pp., doi: 10.1155/2013/185138.

    “Hybrid Positioning with Smartphones” by J. Liu in Ubiquitous Positioning and Mobile Location-Based Services in Smart Phones, edited by R. Chen, published by IGI Global, Hershey, Pennsylvania, 2012, pp. 159–194.

    Ubiquitous Positioning by R. Mannings, published by Artech House, Norwood, Massachusetts, 2008.

    “Non-GPS Navigation for Security Personnel and First Responders” by L. Ojeda and J. Borenstein in Journal of Navigation, Vol. 60, No. 3, September 2007, pp. 391–407, doi: 10.1017/S0373463307004286.

    • Ultra-Wideband Positioning

    Comparing Ubisense, BeSpoon, and DecaWave UWB Location Systems: Indoor Performance Analysis” by A.R.J. Ruiz and F.S. Granja in IEEE Transactions on Instrumentation and Measurement, Vol. 66, No. 8, pp. 2106–2117, August 2017, doi: 10.1109/TIM.2017.2681398.

    Ultra-wideband Indoor Positioning Technologies: Analysis and Recent Advances” by A. Alarifi, A. Al-Salman, M. Alsaleh, A. Alnafessah, S. Al-Hadhrami, M.A. Al-Ammar and H.S. Al-Khalifa in Sensors, Vol. 16, No. 5, 707, 36 pp., 2016, doi: 10.3390/s16050707.

    Where Are We? Positioning in Challenging Environments Using Ultra-Wideband Sensor Networks” by Z. Koppanyi, C.K. Toth and D.A. Grejner-Brzezinska in GPS World, Vol. 26, No. 3, March 2015, pp. 44–49.

    Ultra-wideband Positioning Systems: Theoretical Limits, Ranging Algorithms, and Protocols by Z. Sahinoglu, S. Gezici and I. Guvenc, published by Cambridge University Press, Cambridge, U.K., 2008.

    • Time of Arrival Estimation

    Entropy-based TOA Estimation and SVM-based Ranging Error Mitigation in UWB Ranging Systems” by Z. Yin, K. Cui, Z. Wu and L. Yin in Sensors, Vol. 15, No. 5, May 2015, pp. 11701–11724, doi: 10.3390/s150511701.

    “Prior Models for Indoor Super-resolution Time of Arrival Estimation” by D. Humphrey and M. Hedley in Proceedings of VTC Spring 2009, the 69th Vehicular Technology Conference, Barcelona, Spain, April 26–29, 2009, 5 pp., doi: 10.1109/VETECS.2009.5073817.

    Ranging with Ultrawide Bandwidth Signals in Multipath Environments” by D. Dardari, A. Conti, U. Ferner, A. Giorgetti and M.Z. Win in Proceedings of the IEEE, Vol. 97, No. 2, February 2009, pp. 404–426, doi: 10.1109/JPROC.2008.2008846.

    “A New Time of Arrival Estimation Method Using UWB Dual Pulse Signals” by R. Zhang and X. Dong in IEEE Transactions on Wireless Communications, Vol. 7, No. 6, June 2008, pp. 2057–2062, doi: 10.1109/TWC.2008.070112.

    “Threshold-based TOA Estimation for Impulse Radio UWB Systems” by I. Guvenc and Z. Sahinoglu in Proceedings of ICU 2005, IEEE International Conference on Ultra-Wideband, Zurich, Switzerland, Sept. 5–8, 2005, pp. 420-425, doi: 10.1109/ICU.2005.1570024

    • Ultra-Wideband Antennas

    Microwave Imaging Using CMOS Integrated Circuits with Rotating 4 × 4 Antenna Array on a Breast Phantom” by H. Song, A. Azhari, X. Xiao, E. Suematsu, H. Watanabe and T. Kikkawa in International Journal of Antennas and Propagation, Vol. 2017, 2017, 13 pp., doi: 10.1155/2017/6757048.

    Ultrawideband Antennas for Microwave Imaging Systems by T.A. Denidni and G. Augustin, published by Artech House, Norwood, Massachusetts, 2014.

    “The Vivaldi Aerial” by P.J. Gibson in Proceedings of the 9th European Microwave Conference, Brighton, U.K., Sept. 17–20, 1979, pp. 101–105, doi: 10.1109/EUMA.1979.332681.

    • Characteristics of Antennas and Their Interaction with Humans

    GNSS Antennas and Humans: A Study of Their Interactions” by J.B. Bancroft, V. Renaudin, A. Morrison and G. Lachapelle in GPS World, Vol. 23, No. 2, February 2012, pp. 60–66.

  • Research Online: Positioning integrity parameters for vehicle safety

    By Yanming Feng and Charles Wang,
    Queensland University of Technology, Australia,
    and
    Charles Karl, Australia Road Research Board, Australia /
    Presented at ION International Technical Meeting 2018

    Connected vehicle safety and traffic applications depend on communication, position and velocity information to function. However, road users may have different vehicle communicating and positioning capabilities. Further, the performance of communicating and positioning could vary from time to time and location to location.

    The vehicle safety system must be fully aware of the performance of vehicle positioning outputs and warn drivers when the positioning system cannot be used for the intended level of safety applications. Minimum operational performance standards about positioning have not been established in the road community.

    This paper reviews and develops the required navigation performance parameters for vehicle positioning capability in terms of accuracy, integrity, timeliness and interrogability of positioning solutions.

    It attempts to adjust the integrity performance parameters for vehicle safety positioning and provide the analysis for integrity risk, protection level and different alert limits. It introduces the error ellipse representation to visualize the protection bubble area of each vehicle on the road. Experimental results demonstrate how different capability levels meet different integrity alarm limits.

    Available online via www.ion.org/publications/browse.cfm.

  • NGS 2018 GPS on BMs program in support of NAPGD2022 — Part 6

    NGS 2018 GPS on BMs program in support of NAPGD2022 — Part 6

    My last column described how the U.S. National Geodetic Survey (NGS) used the detailed analysis of the latest GPS on Bench Marks dataset to:

    1. generate a prototype hybrid geoid model to evaluate the residuals at stations not used in the hybrid geoid model,
    2. confirm that the stations recommended for re-observations should be observed again, and
    3. identify void areas that need additional observations.

    Since GEOID12B was created, users have been instrumental in providing OPUS with results on benchmarks in areas where NGS said that additional stations were needed. It showed how NGS used the detailed analysis to prepare material to assist users on strategically occupying stations to help support the GPS on Bench Marks Program and create a hybrid geoid model that accurately represents a current NAVD 88.

    To eliminate confusion of where NGS would like new observations, NGS’ material contains a specific list of stations that it would like occupied with GNSS during the 2018 GPS on BMs program. My previous column provided a summary of the latest details of NGS’ 2018 GPS on BMs campaign, which will be used to create the next hybrid geoid model in 2019.

    The analysis described in my column was the first cut at identifying stations that should not be used in a hybrid geoid model, and providing a list of specific stations that could help improve the hybrid geoid model. All new data received by the cut-off date of Aug.31, 2018, will be analyzed by NGS and, if appropriate, the results will be included in the next hybrid geoid model.

    This is a great opportunity to provide data that will help to improve the hybrid geoid model in your region.

    This column will describe NGS’ GPS on BMs 2018 interactive web map and provide an update and status report on stations observed in support of the 2018 GPS on BMs Program.

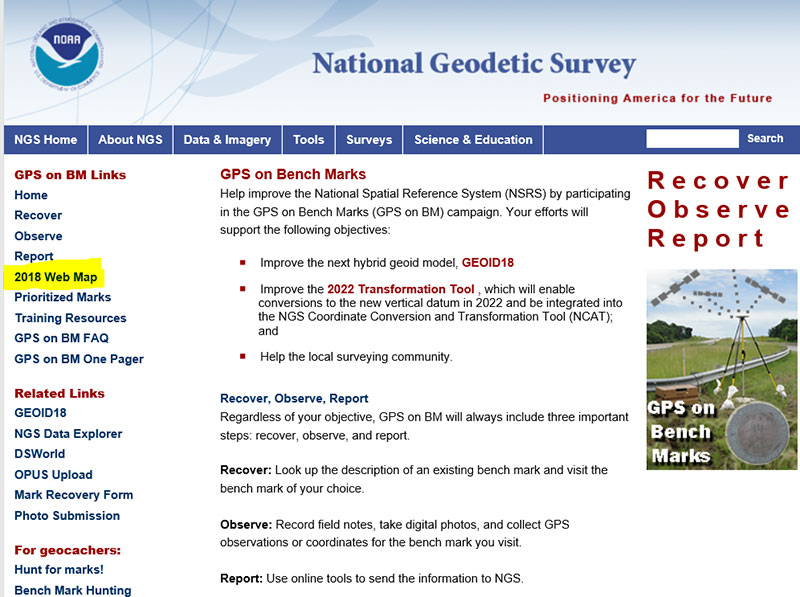
    First, NGS has a web page dedicated to the 2018 GPS on BMs program. See the box titled “GPS on Bench Marks Web Page.”

    GPS on Bench Marks Web Page

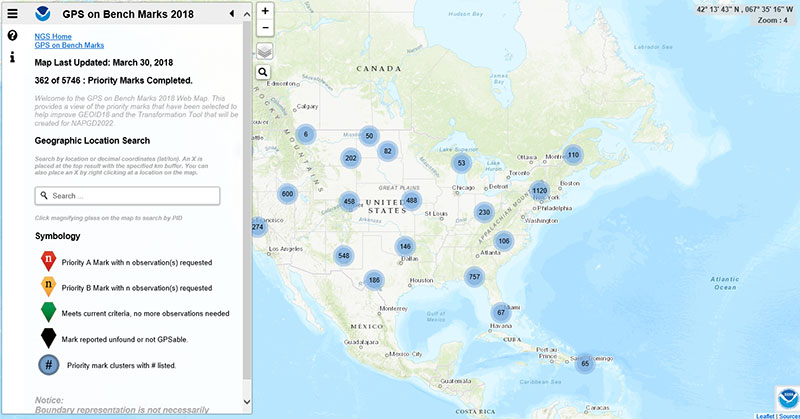
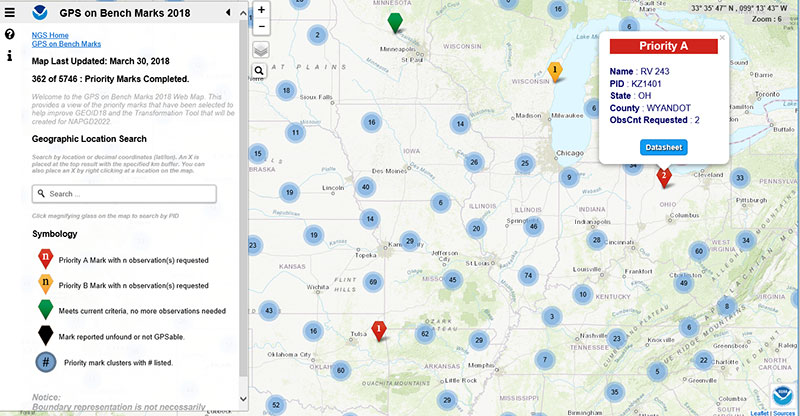
    The GPS on BMs 2018 web page contains a link to a web map where users can determine which bench marks NGS would like users to occupy before the Aug.31 deadline. On the left-hand side of the web page there is a link titled “2018 Web Map” (see highlighted section of box titled “GPS on Bench Marks Web Page”). The next few boxes demonstrate how a user can use the web map tool to locate bench marks in their local area of interest. The box titled “2018 Web Map” depicts what the user will see when the link “2018 Web Map” is clicked.

    2018 Web Map

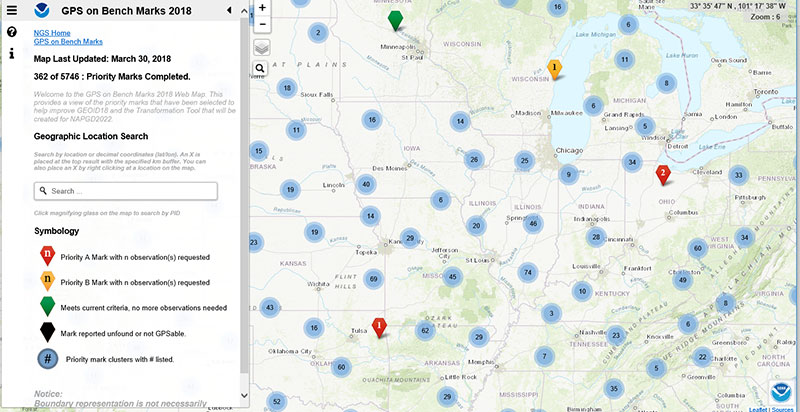
    The user can then click on the map and the tool will provide more details. The box titled “Map After Clicking on Priority Mark Cluster #488 in the Great Plains Region“ is a depiction of the map after clicking on a priority mark cluster.

    Map After Clicking on Priority Mark Cluster #488 in the Great Plains Region

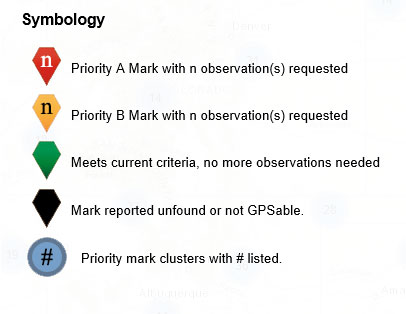
    The user can continue to check on the map until the map depicts individual bench marks where the symbology indicates the status of the monuments. The symbology labels are fairly straightforward. The box titled “The Web Map Symbology” provides the five different categories of monuments.

    The Web Map Symbology

    NGS is updating the map weekly to reduce users occupying stations that already have enough redundant observations. Clicking on a station provides the status of the station. The box titled “An Example of a Priority A Station” depicts station (PID KZ1401) that is labeled as a Priority A station and requires two observations.

    An Example of a Priority A Station

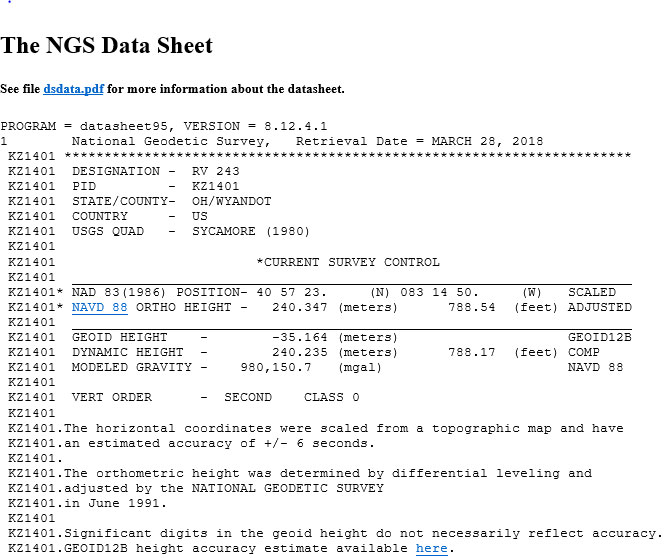
    The user can obtain the datasheet for the station by clicking on the Datasheet button in the box (see box titled “Excerpt from the Datasheet for PID KZ1401”).

    Excerpt from the Datasheet for PID KZ1401

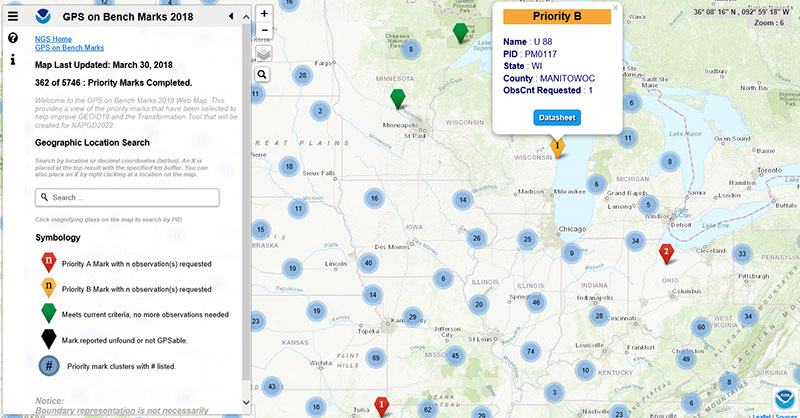
    The box titled “An Example of a Priority B Station” depicts a priority B station (PID PM0117) that NGS would like one more observation. Users should remember that priority A stations are more important than priority B stations but B stations are still important for the development and analysis of the hybrid geoid model.

    An Example of a Priority B Station

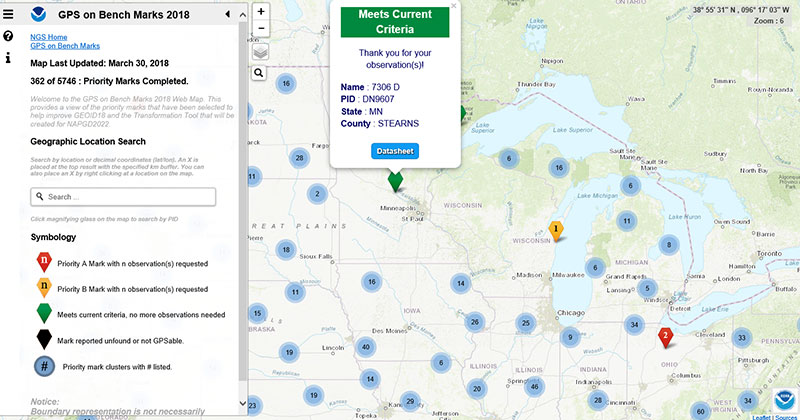
    The box titled “An Example of a Station that Meets Current Criteria” provides an example of a station that does not need any more observations. As previously stated, NGS will be updating this web map on a regular basis so users will not waste their time and resources.

    An Example of a Station that Meets Current Criteria

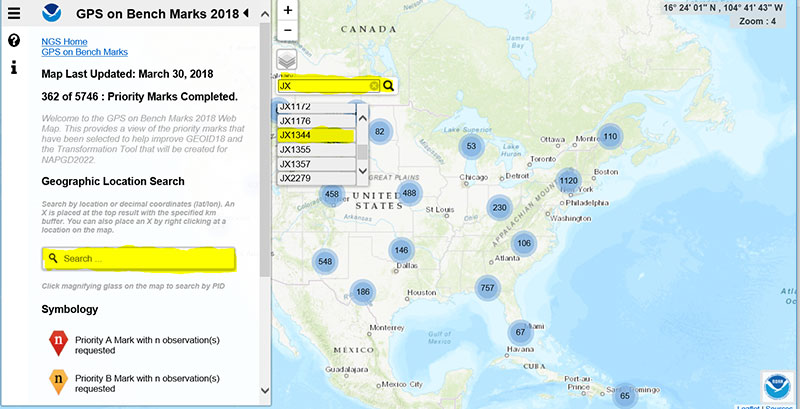
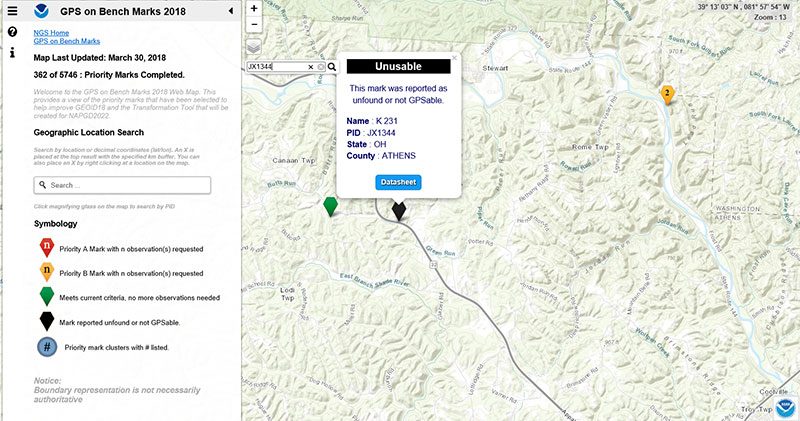
    The web map has a search feature, so if the user knew a priority A or B station’s PID, they could locate the station on the map. The box titled “An Example of Using the Web Map Search Feature“ demonstrates the search feature using PID JX1344 (see highlighted section in the box).

    An Example of Using the Web Map Search Feature

    The box titled “Output from Search Feature for PID JX1344“ is a depiction of the output using the search feature.

    Output from Search Feature for PID JX1344

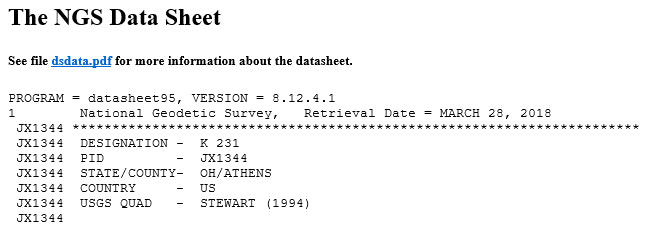
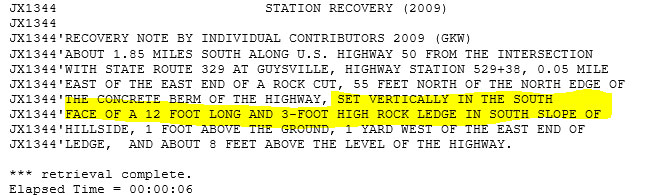
    The last category of stations that are shown on the web map are monuments that are reported as unfounded or not GPSable. This is very useful information for NGS and others to have on datasheets. The box titled ” Output from Search Feature for PID JX1344 “ depicts bench mark PID JX1344 that is labeled as unfound or not GPSable. The datasheet for JX1344 indicates that the bench mark is set vertically in a rock ledge (see highlighted section in the box titled “Excerpt from the Datasheet for PID JX1344.”

    Excerpt from the Datasheet for PID JX1344

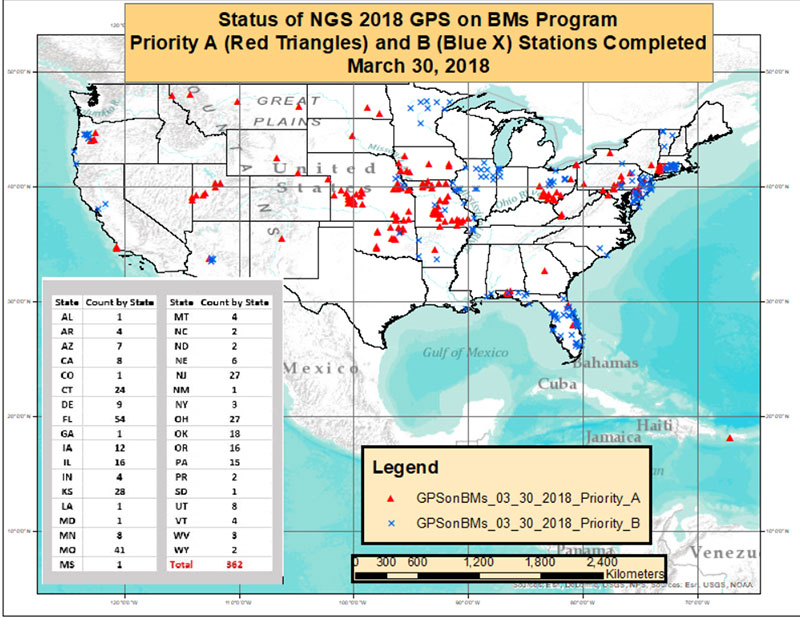
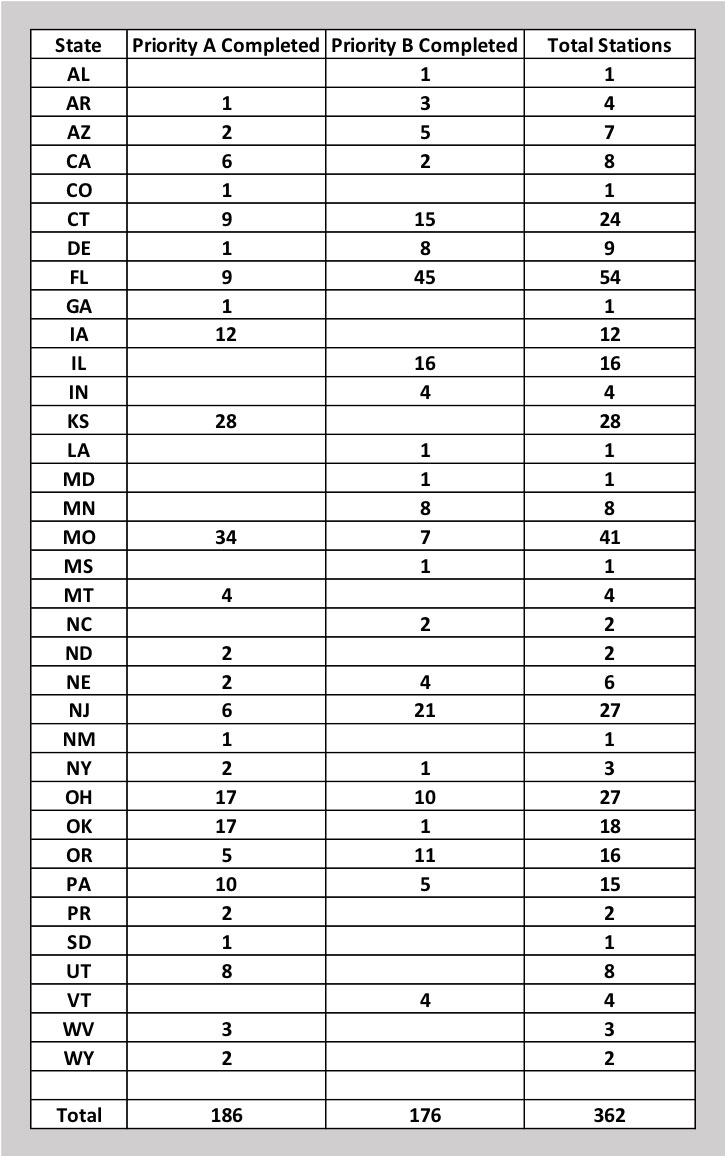
    As of March 30, 362 of the 5745 priority marks have been completed. The box titled “Status of NGS 2018 GPS on BMs Program as of March 30, 2018“ is a plot of the stations that are completed, and the box titled “Count of Stations Completed by State “ provides the number of stations completed by state. The red triangles are priority A stations completed and the blue “X” are priority B stations labeled as completed.

    It appears that the central portion of the country has been very active. For example, there are 34 priority A stations completed in Missouri and 28 completed in Kansas. The State of Florida has completed 45 priority B and nine priority A stations for a total of 54 stations (see box titled “Count of Stations Completed by State “).

    Status of NGS 2018 GPS on BMs Program as of March 30, 2018

    Count of Stations Completed by State

    March 30, 2018

    The number of stations completed to date represents about 6 percent of the total number of stations that need to be observed. Aug. 31 is only five months away. Hopefully, the number of completed stations will significantly increase during the next several months.

    If you have a GNSS receiver, please identify a priority monument nearby and occupy it. As I have explained in previous columns, there are many invalid GPS on BMs stations that may be used in the next hybrid geoid model unless more benchmarks with valid NAVD 88 heights are observed with GNSS.

    Please encourage your fellow surveyors and friends to occupy a benchmark to support the next NGS hybrid geoid model. This is your opportunity to help develop a current, valid hybrid geoid model in your area.

  • Orolia to acquire Talen-X to enhance Assured PNT offerings

    Orolia to acquire Talen-X to enhance Assured PNT offerings

    Orolia, a resilient positioning, navigation and timing (PNT) company, has entered into a definitive agreement to acquire Talen-X.

    Talen-X is a U.S. technology innovator with the ability to characterize, enhance and implement advanced techniques and products to solve real-world GNSS vulnerability problems. It has expertise in GPS/GNSS performance, requirements, testing, integration and threat mitigation.

    Orolia has completed 10 acquisitions since 2007, including Spectracom, Spectratime and McMurdo brands. The transaction is subject to customary closing conditions and approvals required by the U.S. Defense Security Service (DSS) and the Committee on Foreign Investment in the United States (CFIUS).

    Through this acquisition, Orolia said it will significantly enhance Assured PNT capabilities across the global company’s portfolio to support mission-critical applications. The additional resources also strengthen Orolia’s commitment to serving the U.S. government, with further expansion of domestic capabilities and a greater U.S. footprint. Toward that end, the companies will reinforce their commercial cooperation to maximize market awareness and access.

    “Military personnel know that accurate and trusted time and position information is a critical enabler for almost all warfighting functions and systems,” said Orolia CEO Jean-Yves Courtois. “Reliable PNT data are critical for communications, sensors, network synchronization, situational awareness, command and control or search and rescue missions. This acquisition reinforces Orolia’s position as a major supplier of Assured PNT technology and enhances our ability to offer unique end-to-end solutions.”

    Talen-X has extensive technology integration and PNT engineering resources that will enable Orolia to rapidly develop and offer new, superior products and services to the U.S. market.

    “Our culture of innovation, together with our demonstrated testing capabilities, will complement Orolia’s global technology expertise and significantly enhance the reliability, performance and safety of military operations,” said Tim Erbes, CTO of Talen-X.

    Key terms of the transaction were not disclosed.

  • Trimble launches marine positioning GNSS receiver

    Trimble launches marine positioning GNSS receiver

    The MPS865 GNSS receiver is designed for marine positioning.

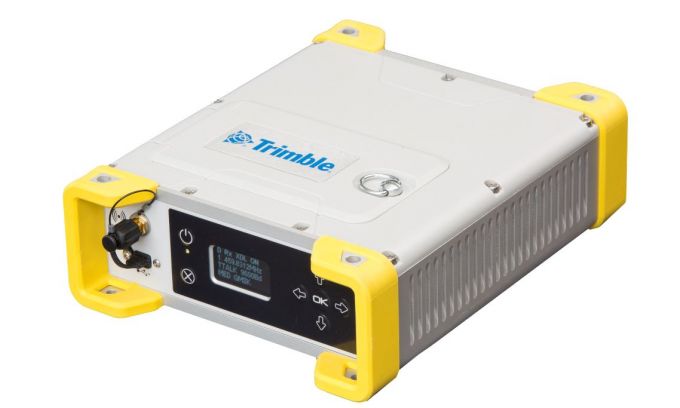
    Trimble has debuted the MPS865 marine positioning system multi-frequency and multi-application GNSS receiver.

    The Trimble MPS865 is a versatile, rugged and reliable GNSS positioning and heading solution for a wide variety of real-time and post-processing applications for marine survey and construction.

    It features integrated communications options such as Wi-Fi, UHF radio, cellular modem for internet connectivity, Bluetooth and MSS satellite-based correction channels.

    The patented GNSS-centric technology uses all available GNSS signals to deliver reliable positions in real time. The GNSS receiver provides for the connection of two GNSS antennas for precise heading.

    With a modular form factor, the MPS865 is flexible and can be used as an integrated on-board rover receiver, a base station or a continuously operating reference station. According to Trimble, the built-in precise heading feature ensures the receiver is of minimal size, consumes less power and has less cabling, which are all benefits when on-board space it at a premium.

    The MPS865 adds new features to improve usability in a congested marine construction site – multi constellations, cellular connectivity and beacon support. The multi-constellation option maintains productivity in marine sites or when antennas or satellites are partly obstructed.

    At many sites, the receiver can use the free-to-air beacon support. When coupled with GA830 antennas, the MPS865 will receive the free-to-air beacon signals to deliver sub-meter accurate horizontal positioning in many parts of the world. It always delivers precise heading even when no GNSS corrections are received.

    The marine receiver also has cellular, making it easier to use Internet Base Station Service (IBSS) and VRS corrections over the internet as well as communicate with the receiver via the internet and SMS messages. The receiver also can be used as a data access point on the vessel to download design files or for immediate remote support.

    The MPS865’s design enables a broad range of mounting capabilities and built-in communication options. Features include an internal removable battery, internal memory and optional accessory kits for specific applications.

    The receiver is also compatible with a variety of software solutions including the new Trimble Marine Construction software.

    The weatherproof, high-impact-resistant moulded aluminium housing protects it in extreme marine conditions or base-station applications.

    “With the addition of the MPS865 receiver to our portfolio, Trimble has introduced a new generation of rugged, compact and feature-rich GNSS, a solution the marine industry has been needing for some time,” said Scott Crozier, general manager of Trimble’s Civil Engineering & Construction Division. “This highly flexible and capable receiver can be combined with our marine construction software providing contractors with a market-leading solution for any marine survey or construction application.”

  • Latest YellowScan lidar system designed for UAV surveys

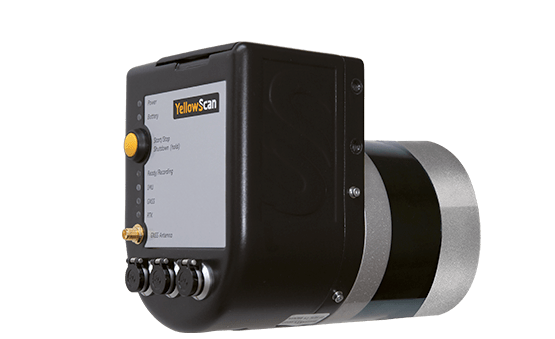
    YellowScan has launched a new lidar system, the Surveyor Ultra. It integrates the Velodyne VLP-32C scanner and the Applanix APX-15 GNSS/inertial measurement unit (IMU).

    With high density (600,000 shots per second), the system is suitable for high-speed UAVs and long-range needs (maximum range: 100 meters). Its light weight (1.7 kg) makes it easy to mount on any drone, including vertical takeoff and landing (VTOL) UAVs.

    As for all YellowScan lidar systems, the Surveyor Ultra is a turn-key system fitted for under vegetation 3D modeling and fast data processing, the company said.

    Applications such as forestry, archeology and environmental research will benefit from Surveyor Ultra, as they require long-endurance flights high above trees or over rocky mountains and rugged terrain.

    “The Surveyor Ultra shows great potential to safely and efficiently operate lidar on lightweight fixed-wing UAVs,” said Tristan Allouis, YellowScan CTO. “The Surveyor Ultra completes our product line, including the successful Surveyor Lidar System (integration of the VLP-16 scanner from Velodyne).”

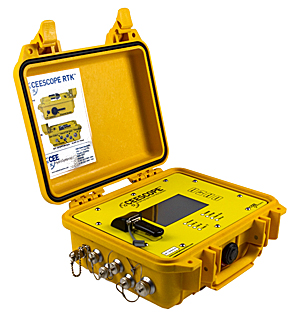
  • CEESCOPE echo sounder available with NovAtel OEM7 GNSS

    The NovAtel OEM6 GNSS receiver card used in the CEESCOPE echo sounder has been replaced with NovAtel’s latest low-power, high-performance OEM729 receiver.

    With 555 channels, the new GNSS option brings a vast increase in available channels for future-proofing, improved interference rejection and better performance in challenging environments, the company said.

    The TerraStar L-Band support remains.

    The OEM729-equipped CEESCOPE is available with a built-in UHF radio modem and direct Ethernet connectivity to the GNSS receiver for NTRIP cell-phone real-time kinematic corrections.

  • Beta program opens for Pix4Dfields for agriculture

    Pix4D has announced Pix4Dfields, its first fully dedicated product for agriculture. A beta program to test the software is now open.

    Pix4Dfields is designed to give users fast and accurate maps while in the field, with a simple yet powerful interface fully dedicated to agriculture.

    “When we decided to create a fully dedicated product for agriculture, we wanted to go beyond the research and development and create a product that actually understands agriculture,” the company said in a press release. “So in July 2017, we opened a new office in Berlin fully dedicated to do exactly that: Understand the agriculture industry, listen to our users, and create a product that caters to all the main agricultural practices.”

    Pix4Dfields is equipped with fast processing that provides accurate and instant results and an easy-to-use interface with tools tailored to agricultural workflows.

    Pix4Dfields is currently available as a closed beta, which we are opening to select users to test it and provide feedback. The product will evolve at a fast pace with new and updated features being added with every new iteration, the company said

    Pix4Dfields is currently available for macOS only; the next iterations will include Windows support as well.

    To join the beta program or learn more, visit the website.

  • SenseFly and Trimble optimize workflow for geospatial drone operators

    SenseFly and Trimble optimize workflow for geospatial drone operators

    Photo: Sensefly
    Photo: Sensefly

    SenseFly is partnering with Trimble to optimize the drone mapping workflow for geospatial professionals.

    The new integration is designed to ensure a smooth end-to-end mapping drone workflow. senseFly operators can now, within the recently launched eMotion 3.5 software, transform a senseFly S.O.D.A. camera’s georeferenced imagery into an automatically collated project (in .jxl format).

    This enables the one-click import of drone imagery into the Trimble Business Center Aerial Photogrammetry module without the need for manual project creation and organization of images.

    The senseFly-to-Trimble mapping workflow includes:

    • planning and monitoring a senseFly S.O.D.A.-based drone flight (in eMotion 3.5)
    • downloading the drone’s images for one-click georeferencing in eMotion 3.5 (Flight Data Manager)
    • clicking to create a .jxl format mapping project
    • opening a project within the Trimble Business Center Aerial Photogrammetry module
    • processing the drone’s imagery to generate orthophotos, contour maps, point clouds, digital surface models (DSMs) and feature maps
    • analyzing and acting upon the data.
    Screenshot: Trimble
    Screenshot: Trimble

    “Making work easier and more efficient for geospatial professionals is the goal that drives every solution we develop,” said Jean-Christophe Zufferey, senseFly co-founder and CEO. “Therefore, we are excited to collaborate with Trimble on more tightly integrating our solutions, since enhancements such as this new eMotion-to-Trimble Business Center workflow do exactly that, ensuring that the transition from data collection to acting upon this data is as seamless as possible.”

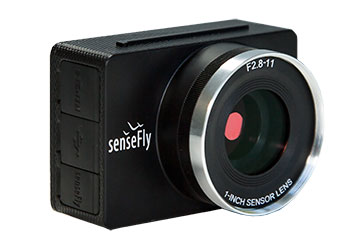
    The senseFly S.O.D.A. is built for professional drone photogrammetry work. The 1-inch, 20-megapixel RGB camera captures sharp aerial images across a range of light conditions, allowing senseFly fixed-wing drone operators to produce detailed, vivid orthomosaics and ultra-accurate 3D digital surface models.

    senseFly S.O.D.A. is compatible with most senseFly fixed-wing mapping drones, including the large-coverage eBee Plus.

    Trimble Business Center allows surveyors and other geospatial professionals to combine aerial photography with data collected from GNSS receivers, total stations, 3D laser scanners and more, for a complete field-to-finish workflow. By combining imagery from unmanned aerial systems with ground-based survey data, users can visualize their project from both aerial and terrestrial perspectives, measure points within the images and create 3D models of the infrastructure and terrain.

  • New Viametris backpack scanner integrates SBG Systems product

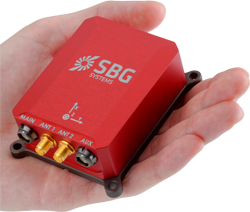
    Viametris, specialist of SLAM-based mobile scanning systems, has launched a backpack-based scanning system called the bMS3D-360. The company continues to rely on SBG Systems’ expertise in inertial navigation by integrating the Ellipse2-D, an inertial navigation system with embedded real-time kinematic (RTK) GNSS receiver.

    Photo: Viametris
    Photo: Viametris

    Viametris has been developing SLAM-based scanning systems for more than 10 years, including the iMS3D, a full indoor mapping system and the VMS3D, a car-based mapping system.

    The bMS3D-360 has been designed for the most challenging environments where GNSS is not accessible (indoor) or highly perturbed (urban canyons, forest, etc.). The surveyor starts the system, checks on a tablet that the GNSS and inertial information are computed, and starts the survey.

    Back at the office, the user launches the INS/GNSS post-processing software to increase orientation and position accuracy, and then uses the Viametris software to georeference and colorize the point cloud.

    Collected data are ready to be imported into common design software. This workflow (from collection to plan drawing) is seven times faster than a traditional method.

    The bMS3D-360 offers a 360-degree camera, which greatly simplifies the treatment work. When navigating in the point cloud, the user opens a unique picture of the 360-degree scanned environment instead of looking at four different camera points of view.

    Photo: SBG Systems
    Photo: SBG Systems

    The Ellipse2-D from SBG Systems is a compact inertial navigation system integrating an L1/L2 GNSS receiver. This industrial-grade INS computes roll, pitch and heading as well as position because of its embedded Extended Kalman Filtering.

    In real time, Ellipse2-D orientation data are used to correct the equipment attitude and help the SLAM computed heading. The embedded GNSS receiver provides absolute positioning to the point cloud as well as altitude constraint.

    When the GNSS faces sources of disturbance, the INS maintains the trajectory were the SLAM technology is limited.

  • National PNT Engineering Forum rejects Ligado test results

    An independent technical review published earlier this month found sufficient data in three government-conducted tests to assess the risk of using frequencies near the GPS band for a ground-based communications network — specifically, the one proposed by Ligado Networks. The panel rejected two tests sponsored by Ligado Networks, saying they did not meet minimum criteria for inclusion or use.

    The testing and various hearings before the Federal Communications Commission (FCC) come in response to increasing demand for commercial spectrum to support broadband wireless communications. The FCC and other branches of U.S. government are giving serious consideration to repurposing various radio frequencies, including the satellite communications bands next to GPS, to accommodate this.

    Ligado Networks has petitioned the FCC to repurpose satellite frequencies near GPS to also support terrestrial telecom services, effectively transferring its license for space-based broadcasting to powerful terrestrially-based broadcast towers. Ligado’s custom networks would provide services for industrial operations such as power grids and connectivity for drones and driverless cars, in addition to consumer broadband services.

    The National Executive Committee of the government’s National Coordination Office for Space-Based Positioning, Navigation, and Timing released the assessment by its National Space-Based PNT Systems Engineering Forum (NPEF) of testing methodologies used to analyze the impacts of adjacent band interference on GPS receivers. The assessment is also known as the “gap analysis.”

    The NPEF evaluated five tests performed by the following organizations, the first three of them government organizations and the last two private tests sponsored  by Ligado with little or no public or government input:

    • Federal Communication Commission (FCC)-mandated Technical Working Group (TWG) — done in 2011.
    • National Space-Based PNT Systems Engineering Forum (NPEF) — done in 2011.
    • Department of Transportation (DOT) Adjacent Band Compatibility (ABC) — done in 2017 but not previously released.
    • Roberson and Associates (RAA)
    • National Advanced Spectrum and Communications Test Network (NASCTN).

    The gap analysis concluded that the results from the first three tests are sufficient and appropriate to inform spectrum policy makers on the major impacts of a proposed LTE network on GPS receivers. The DOT test results revealed the power levels that GPS and GNSS receivers can tolerate from interference sources in the adjacent band in an effort to inform the enforcement of a GPS interference protection criterion.

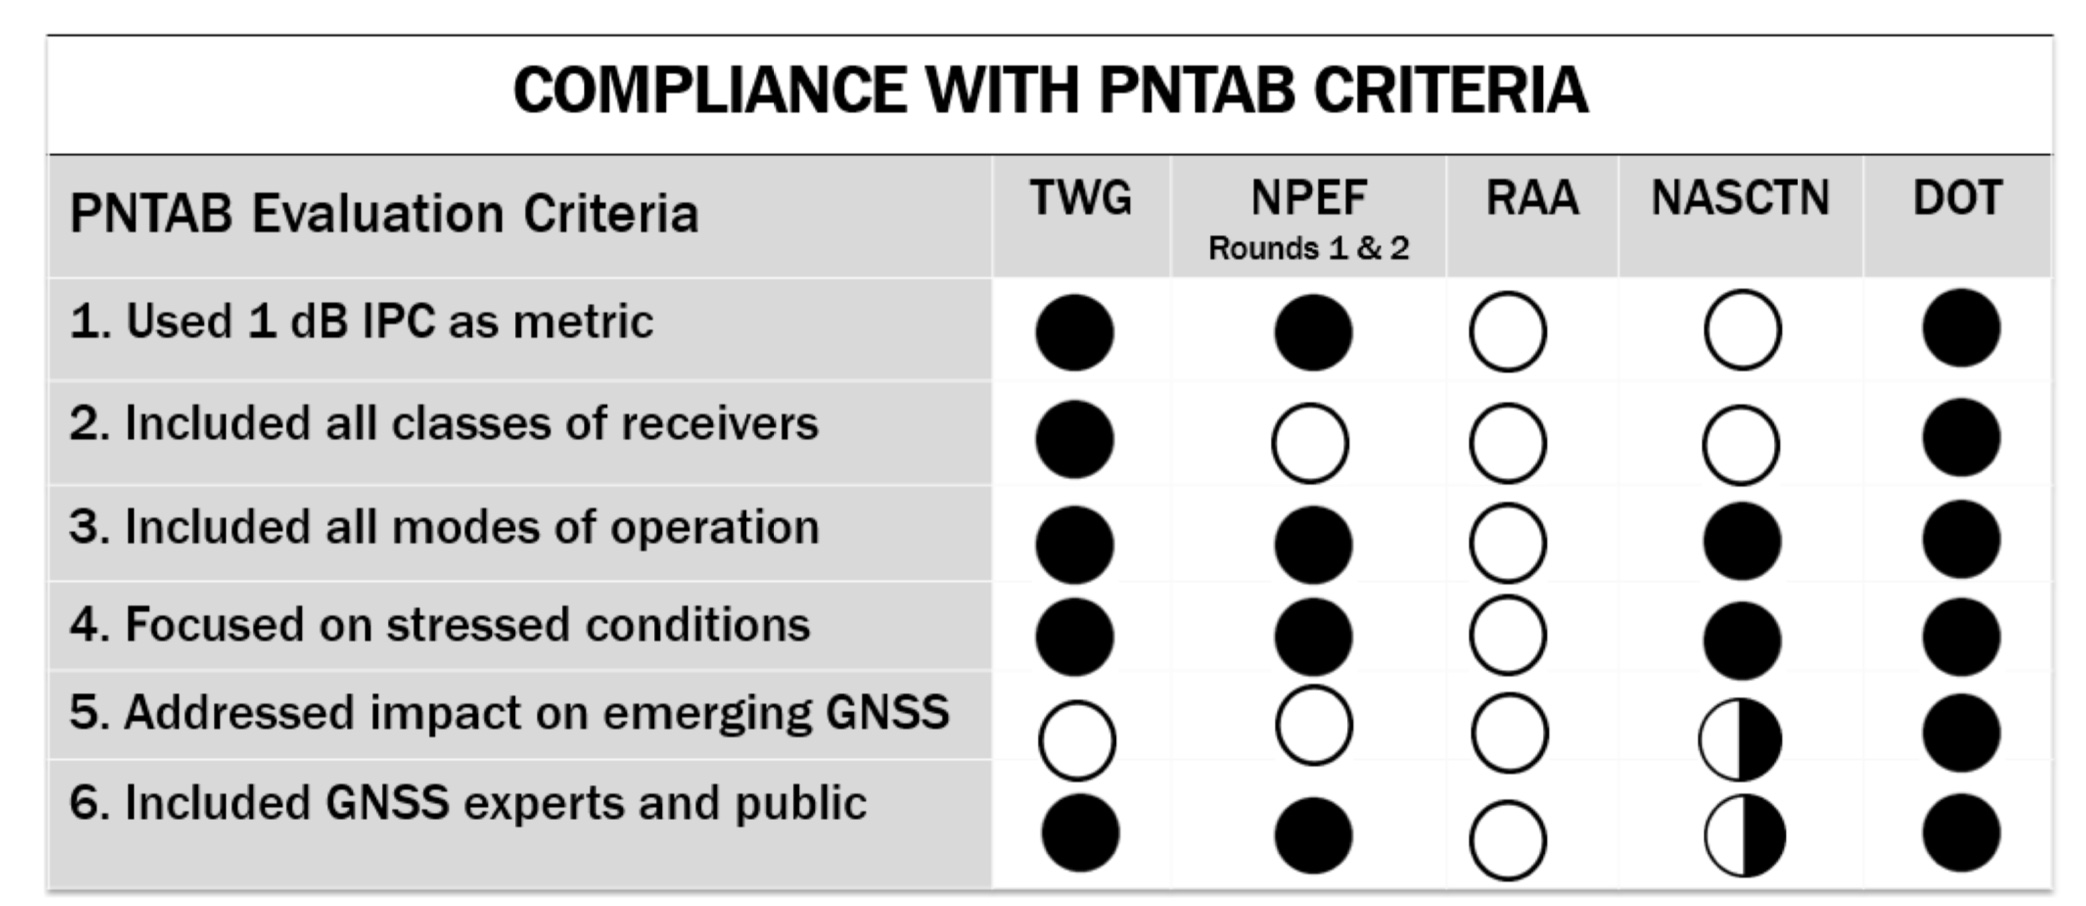
    PNT Advisory Board's set of minimum criteria. The two Ligado-sponsored tests are the RAA and the NASCTN. (Image: PNTAB)
    PNT Advisory Board’s set of minimum criteria. The two Ligado-sponsored tests are the RAA and the NASCTN. (Image: PNTAB)

    The NPEF team found the scope and framework of the last two tests, sponsored by Ligado, to be insufficient when evaluated against the PNT Advisory Board’s set of minimum criteria. Key among these criteria is one that specifies use of the internationally accepted 1 dB degradation Interference Protection Criterion (IPC):  a one-decibel (1 dB) degradation in C/N0, the carrier-to-noise power density ratio. Ligado has tried to redefine the standard measurement of interference to one more in its favor: a change in positioning and timing accuracy.

    For further background on this and other aspects of the gap analysis, see the January 2018 GPS World article by Brad Parkinson, “A Grave Threat to GPS and GNSS.”

    The NPEF strongly recommended that decisions impacting the GPS radio frequency environment be informed by data from tests that align with the PNTAB’s set of minimum criteria and with full consideration of the potential operational, scientific, and economic impacts.

    The full gap analysis study can be downloaded here.

    The NPEF is co-chaired by the Departments of Defense and Transportation and consists of representatives from at least 14 federal agencies.