Category: Applications

  • NGS 2018 GPS on BMs program in support of NAPGD2022 — Part 5

    NGS 2018 GPS on BMs program in support of NAPGD2022 — Part 5

    My last column highlighted two components of the North American-Pacific Vertical Datum of 2022 (NAPGD2022) — the geoid undulation model of GEOID2022 and gravity model of GRAV2022. It expressed that these two models will be very important to future surveyors and mappers that are incorporating geodetic data into NAPGD2022. The last column also emphasized the significant differences between NAPGD2022 and the U.S. National Vertical Datums of NAVD 88 and NGVD 29. A year ago, my February 2017 column provided information on strategically occupying benchmarks to support NGS 2017 GPS on BM Program. The column focused on addressing the following questions: (1) Is the large GPS on BM residual due to an issue with the NAVD 88 orthometric height or the NAD 83 (2011) ellipsoid height? and (2) Should stations with large GMS on BM residuals be included in the development of NGS’ hybrid geoid models? The column provided suggestions on how users can assist NGS in determining the reason for the large difference between the modeled hybrid geoid value and computed GNSS/leveling geoid computed value. My October 2016 column demonstrated how to use the GPS on BMs dataset to identify potential issues in published NAVD 88 and NAD 83 (2011) heights. It focused on analyzing the NGS’ GPS on BM data set that was used to create NGS’ GEOID12B hybrid geoid model. It provided procedures that users could employ when analyzing the differences between the modeled geoid values and the computed geoid values using GNSS/Leveling data (GNSS-derived ellipsoid height minus leveling-derived orthometric height). The October 2016 column provided several examples of large relative differences in residuals between neighboring stations.

    It should be noted that many of these large GPS on BM residuals could be due to an invalid NAVD 88 published height because the bench mark moved since the last time the height of the bench mark was adjusted and published, and/or an undetected error in an ellipsoid height due to a weak GNSS project design. Either way, in my opinion, most of these stations with large GPS on BMs residuals don’t accurately represent a bench mark with a current NAVD 88 height (or what I call a valid NAVD 88 height). When performing a geodetic survey, these stations would be identified as bench marks with invalid heights when following the appropriate Federal geodetic survey guidelines, procedures, and specifications. These bench marks should not be used in the hybrid geoid model just like they would not be used in controlling geodetic surveys. NGS’ goal is to create a hybrid geoid model that is consistent with published valid NAVD 88 values. User participation in NGS’ GPS on BMs Program is critical to creating a hybrid geoid model consistent with a current NAVD 88.

    Recently, NGS performed a detailed analysis of the latest GPS on BMs data file using the published NAD83 (2011) ellipsoid heights, NAVD 88 orthometric heights, and the latest experimental geoid model height, xGeoid17b, to compute a new set of GPS on BMs residuals. At this time, the analysis has only included the 48 conterminous States, District of Columbia, Puerto Rico, and Virgin Islands. These data included NAD 83 (2011) ellipsoid heights from all submitted GNSS projects and OPUS Shared results. The goal of the detailed analysis was to create a statistical ranking of the marks based on a quantitative analysis of the leveling and GPS data. The following attributes were considered during the analysis:

    • Total number of GPS observations to and from the station
    • Date of last GPS observation to and from the station
    • Whether or not the GPS station has repeat baselines between closely spaced neighboring GPS on BMs stations
    • Total number of times the mark has been leveled to
    • Date of latest leveling
    • Quality of leveling (single run; double run; or single run, double simultaneous)

    The analysis of this data set was used to identify stations that should not be used in the creation of a hybrid geoid model or a NAPGD2022 Transformation tool. The stations identified as outliers and labeled as “Do Not Use” in a hybrid geoid model were based on issues associated with the NAVD 88 published orthometric height and/or the NAD83 (2011) ellipsoid height. I have described some of these issues in previous columns (August 2015 column, June 2016 column, October 2016 column and February 2017 column) so I won’t go into details in this column. NGS used the detailed analysis of the latest GPS on BMs dataset to: (1) generate a prototype hybrid geoid model to evaluate the residuals at stations not used in the hybrid geoid model, (2) confirm that the stations recommended for re-observations should be observed again, and (3) identify void areas that need additional observations.

    Since GEOID12B was created, users have been instrumental in providing OPUS results on bench marks in areas NGS said that they needed additional stations. Saying that, NGS realizes that everyone is busy and has limited resources to collect GNSS data on bench marks to support the next hybrid geoid model. NGS has used the detailed analysis to prepare material to assist users on strategically occupying stations to help support the GPS on Bench Marks Program, and create a hybrid geoid model that accurately represents a current NAVD 88. To eliminate confusion of where NGS would like new observations, NGS’ material contains a specific list of stations that they would like occupied with GNSS during the 2018 GPS on BMs program. This column provides a summary of the latest details of NGS’ 2018 GPS on BMs campaign which will be used to create the next hybrid geoid model in 2019 (see box titled “Personal Communication received from Galen Scott, Project Lead of NGS’ GPS in BM Program.”).


    Personal Communication received from Galen Scott, Project Lead of NGS’ GPS on BM Program

    In early 2019, NOAA’s National Geodetic Survey (NGS) will replace GEOID12B with GEOID18, a new hybrid geoid model to deliver improved GPS-derived NAVD 88-equivalent orthometric heights. This new model will serve as the official means for obtaining NAVD 88-equivalent heights via GPS. It will be the last hybrid geoid model that NGS will create before NAVD 88 is replaced by NAPGD2022.NGS will use available GPS on bench mark data to create the new model. Recent analysis of existing GPS on bench mark data and a prototype of the new hybrid geoid model created using that data has highlighted areas where additional data is needed to either confirm or update the local relationships between the ellipsoid, orthometric, and geoid heights.

    This email provides a prioritized list of bench marks for which additional GPS data is needed to improve the hybrid model. Data submitted on these marks will also support the development of the transformation tools that will be developed as part of the transition to the new datums.

    Data to support the hybrid geoid model will be accepted through August 31, 2018. NGS will continue to accept data to support the transformation tools through 2020. New prioritized lists of marks to support the transformation tools will be made available over the next few years as analysis of data requirements progresses.

    For the marks included in the attached document, NGS is requesting support in two ways:

    1. Attempt to locate the marks on the list and submit a mark recovery through DS World. Check this NGS page for more information on mark recovery.
    2. Collect 4 or more hours (more is better) of GNSS data on the mark following NGS guidelines, submit the data to OPUS and select the option to Share.

    More information, including training material, is available on the NGS GPS on Bench Marks (GPS on BM) website. Two matching, independent GPS observations are required for each mark. The list indicates how many observations we have so far on each mark (obs_cnt column). A tracking map showing the currently prioritized marks and the number of observations we have on each will be added to the GPS on BM website in the near future. To maximize efficiency, please check this map before observing a mark to ensure that the required data has not already been submitted.

    Please note: Marks on this list may be inaccessible, destroyed, or not GPS’able. If this is the case, please locate and observe another nearby NAVD 88 mark, within ~10 km.

    The mark list is provided in three file formats, but all contain the same information, so choose the format you are most comfortable with: excel spreadsheet, esri shapefile, and Google Earth kmz.

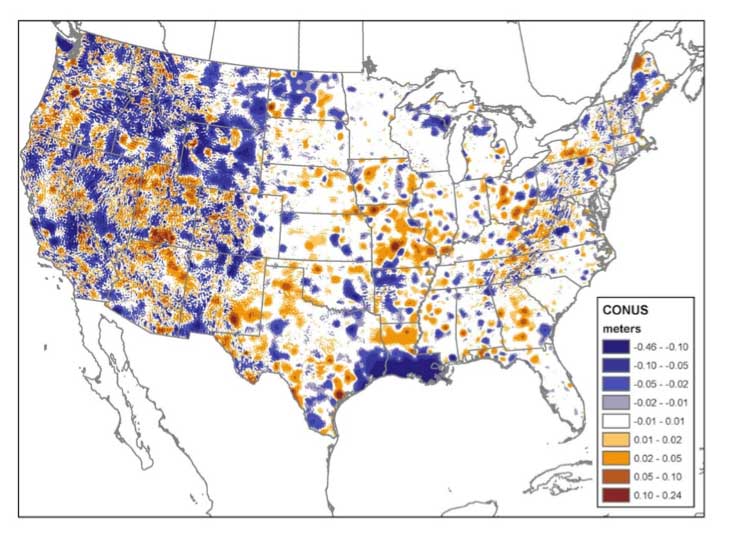
    The image below shows the changes between GEOID12B and the prototype hybrid geoid model. While data is needed on all the marks in the list, you may further focus your data collection efforts by looking for areas in this image that show large changes in your region.

    It is important for users to understand that NGS needs to have a high level of confidence that the OPUS Share results are accurate; therefore, they are requiring that “two matching, independent GPS observations are required for each mark.” The list of stations that they would like observed includes a count of the number of times that station has already been observed. NGS will be updating a website as stations are submitted so participants will not be wasting resources observing a station that has already been observed by someone else. It should be noted that if a station is only occupied once, it will still be useful for validating the hybrid geoid model; but stations occupied twice can be used in defining the hybrid geoid model.

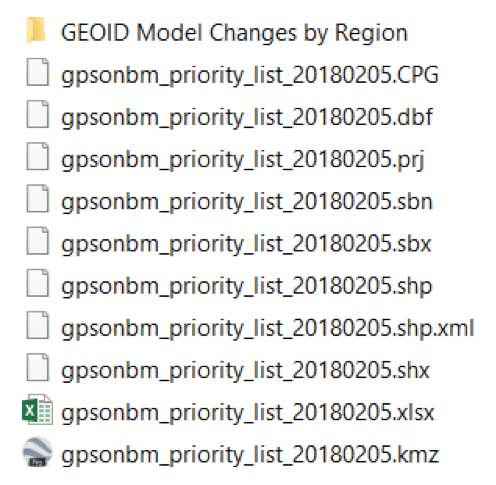
    The attached file includes the list of stations that NGS would like observed to support the next geoid model. The information is provided in three different formats — excel spreadsheet, esri shapefile, and Google Earth kmz (See the box titled “List of Files for the 2018 GPS on BMs Program.”)


    List of Files for the 2018 GPS on BMs Program

    The data set also contains a folder titled “GEOID Model Changes by Region” which contains plots that depict changes between GEOID12B and the Prototype Hybrid Geoid Model (Note: at this time, NGS is denoting this prototype hybrid geoid model as GEOID18v2.2).


    List of Files from Folder Titled “GEOID Model Changes by Region”


    Figure 1 is a plot of the change between the prototype GEOID18v2.2 and GEOID12B in the Mid-Atlantic States. Looking at figure 1, the reader can see that there are some significant differences between the prototype hybrid geoid model values and the published GEOID12B values. On figure 1, all of the dark blue values are differences at the -10 cm level and the dark orange values are differences at the 10 cm level. There are several reasons for these changes including newly observed gravity data observations (especially in area with new GRAV-D data), improved data and models from satellites programs, new and improved algorithms for processing gravity data and estimating topographic effects, additional OPUS Share results in areas where GEOID12B didn’t have observations, and differences based on stations that were included in GEOID12B but rejected in the prototype model based on the latest detailed analysis.
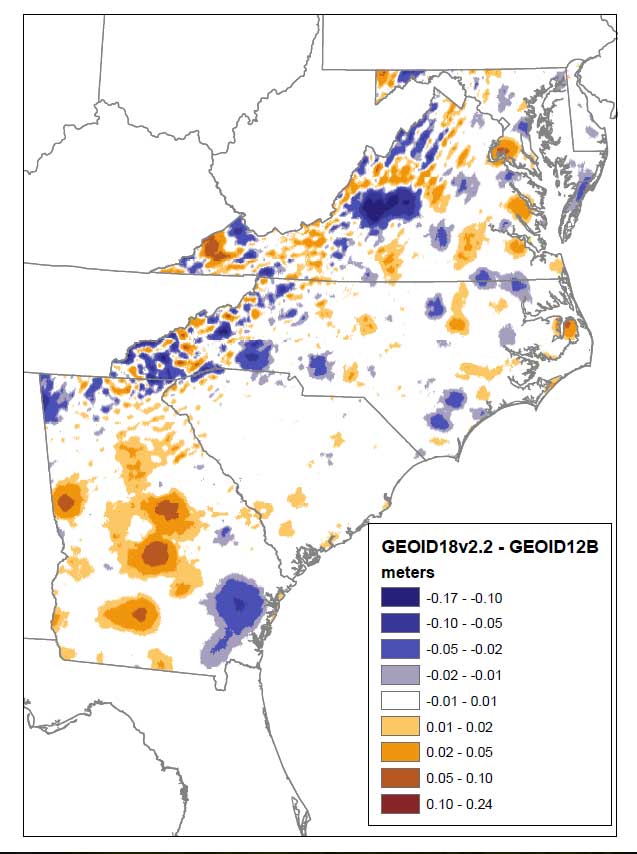
    Figure 1 – Changes between Prototype GEOID18v2.2 and GEOID12B in the Mid-Atlantic States (units = meters).

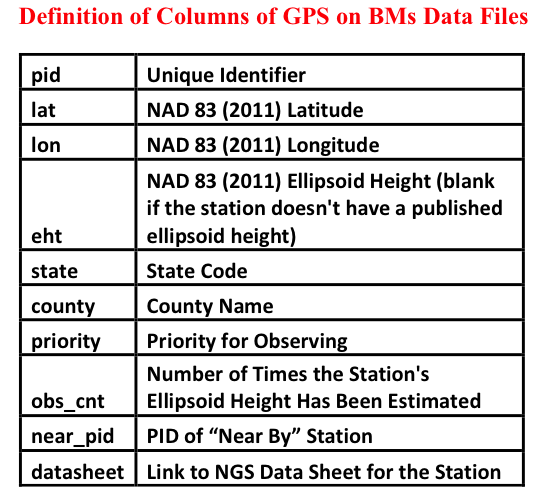
    As previously mentioned, the list of stations that NGS would like observed with GNSS are provided in three formats: excel spreadsheet, esri shapefile, and Google Earth kmz. The box titled “Sample Data Elements Extracted from the Excel File Titled “gpsonbm_priority_list_20180205.xlsx” provides a sample of the data from the excel file. The box titled “Definition of Columns of GPS on BMs data file” provide the columns and a brief definition of the data field.

    Sample Data Elements Extracted from the Excel File Titled “gpsonbm_priority_list_20180205.xlsx”
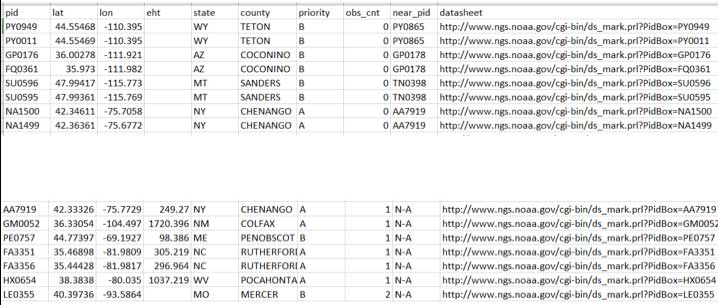
    The priority column has two entries – A or B. Priority A is more important than priority B. In other words, if the user has to make a choice, NGS would like the priority A station observed first. The obs_cnt field will be updated as users submit their OPUS Shared results. Remember, NGS is requiring two matching, independent GPS observations for the station to be included in the development of the hybrid geoid and transformation tool.

    The near_pid provides the pid of the station that is near the original station. The selection of the near_pid was based on the original station’s position and a search of the NGS database for a station within 5 to 15 kilometers of the original station. NGS’ analysis indicated that the original GPS on BMs station may have moved so an additional observation on the same station will not help to generate a hybrid geoid model that represents the current NAVD 88. It would warp the geoid model to fit the published NAVD 88 height but if the station moved since it was last leveled to, then it does not have a valid NAVD 88 height. As previously stated, when performing a geodetic survey, these stations would be identified as bench marks with invalid heights when following the appropriate Federal geodetic survey guidelines, procedures, and specifications. The surveyor would then level to another bench mark until they met the survey’s specifications. These bench marks with invalid heights should not be used in the hybrid geoid model just like they would not be used in controlling geodetic surveys. If the near_pid column is “n-a” then NGS would like the original station observed.

    The box titled “Number of Priority Stations in Each State” provides the number of priority A and B stations for every State in the lower 48, the District of Columbia, Puerto Rico, and the Virgin Islands. Overall, there are 6082 stations in the list – 3544 Priority A stations and 2538 Priority B stations.

    Number of Priority Station in Each State
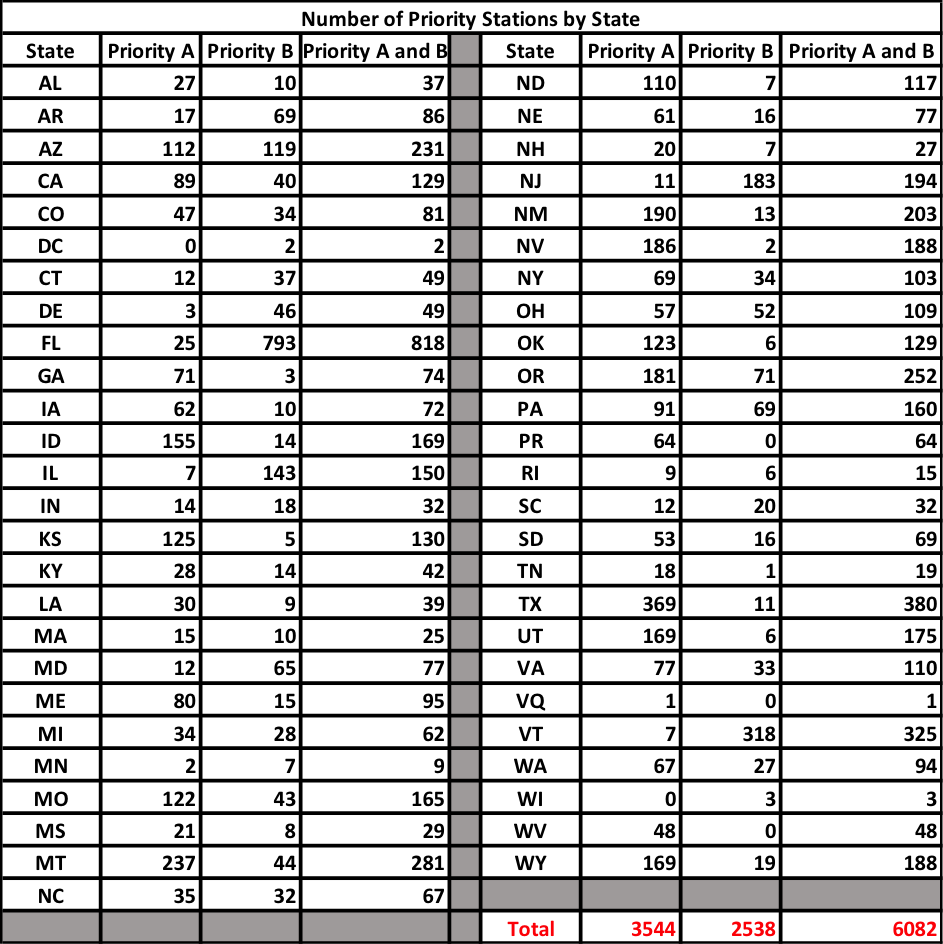
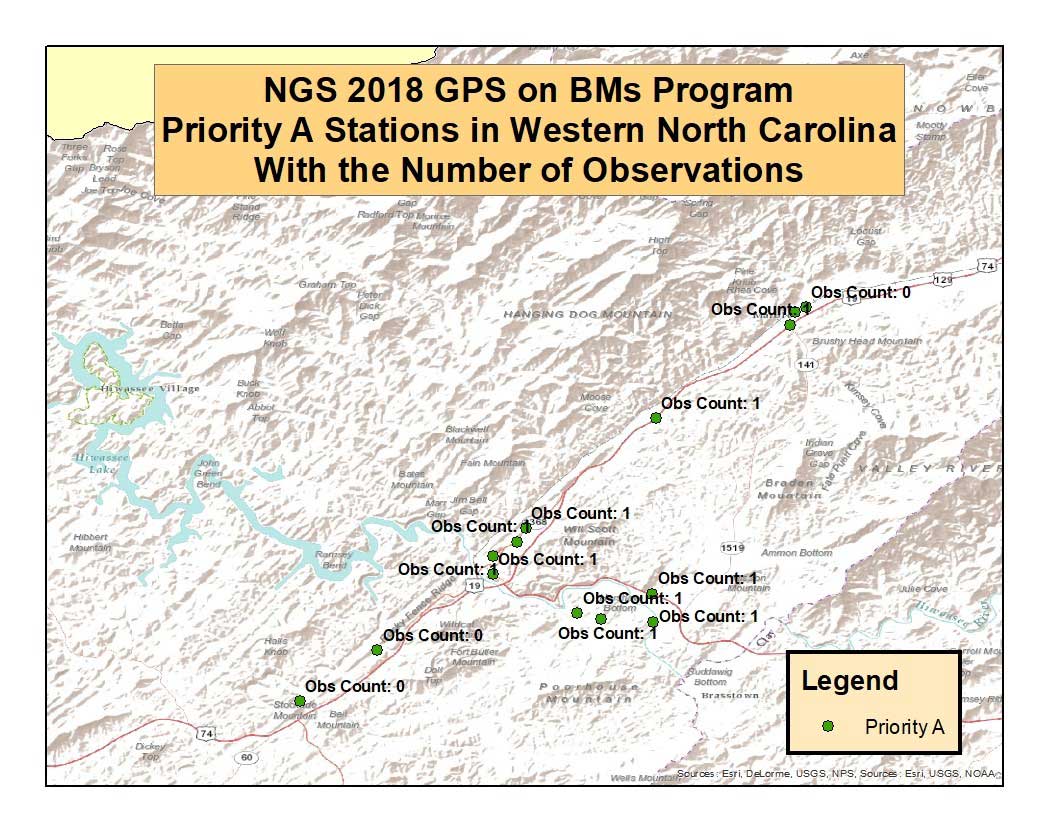
    As an example of a State in eastern United States, the box titled “List of PIDs of Priority “A” and “B” Stations in North Carolina” provides the list of priority A and B stations that need to be observed in North Carolina. The box titled “List of PIDs of Priority “A” Stations in North Carolina” provides the list of priority A stations in North Carolina. Figure 2, titled “NGS 2018 GPS on BMs Program, Priority A and B Stations in North Carolina,” depicts the locations of these stations. Figure 3 depicts the location and PID of the priority A stations in western North Carolina. Figure 4 depicts the same stations with their Obs_Cnt value.

    List of PIDs of Priority “A” and “B” Stations in North Carolina That Need to be Observed
    Information extracted from Excel File Titled “full_priority_list.csv”
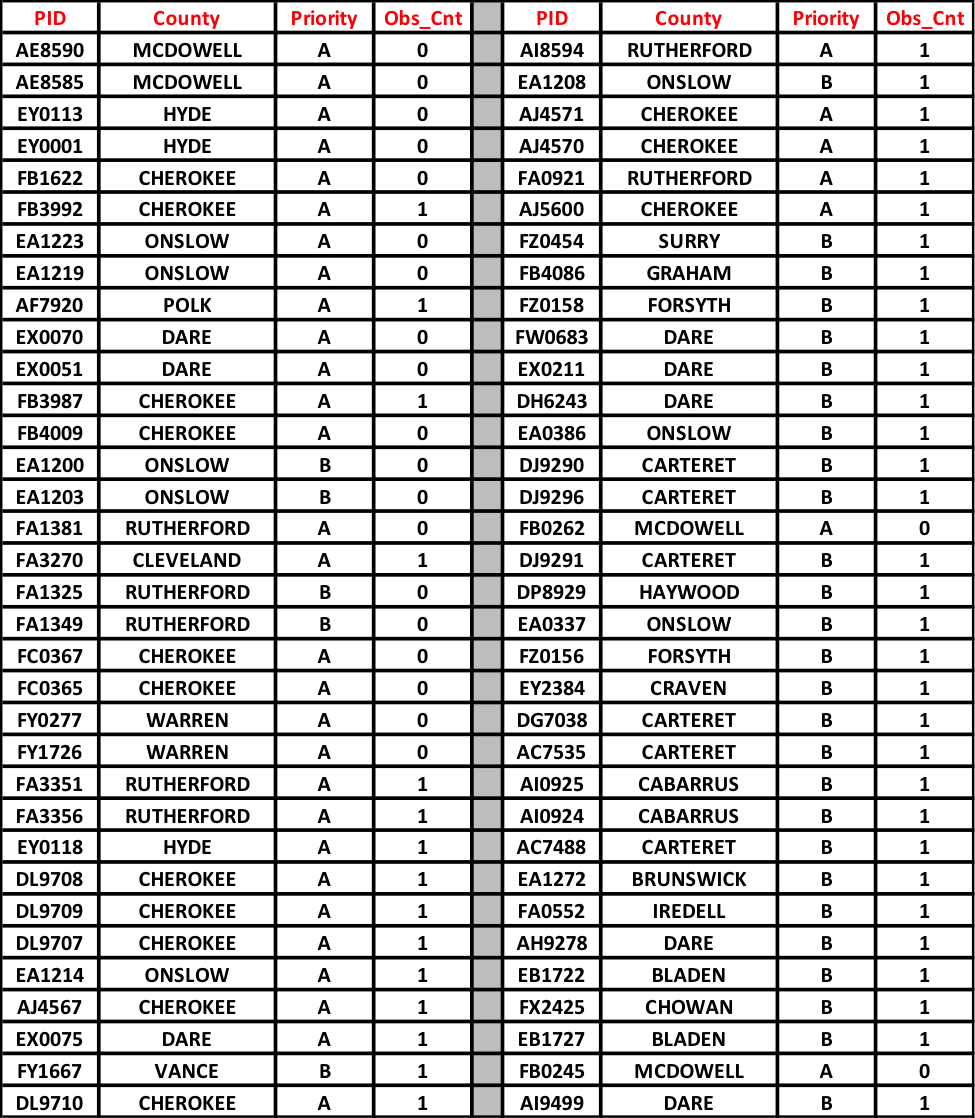
    (Note: The stations in this table may not be the final list of priority A and B. The attached zip file contains the latest list of stations. The latest list was received too late to modify the table.)

    List of PIDs of Priority “A” Stations in North Carolina
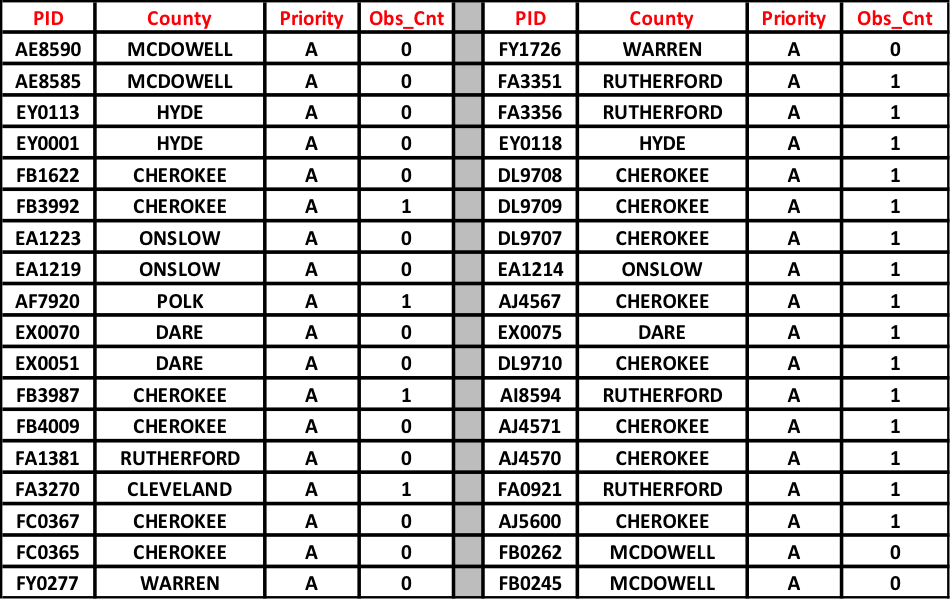
    (Note: The stations in this table may not be the final list of priority A and B. The attached zip file contains the latest list of stations. The latest list was received too late to modify the table.)
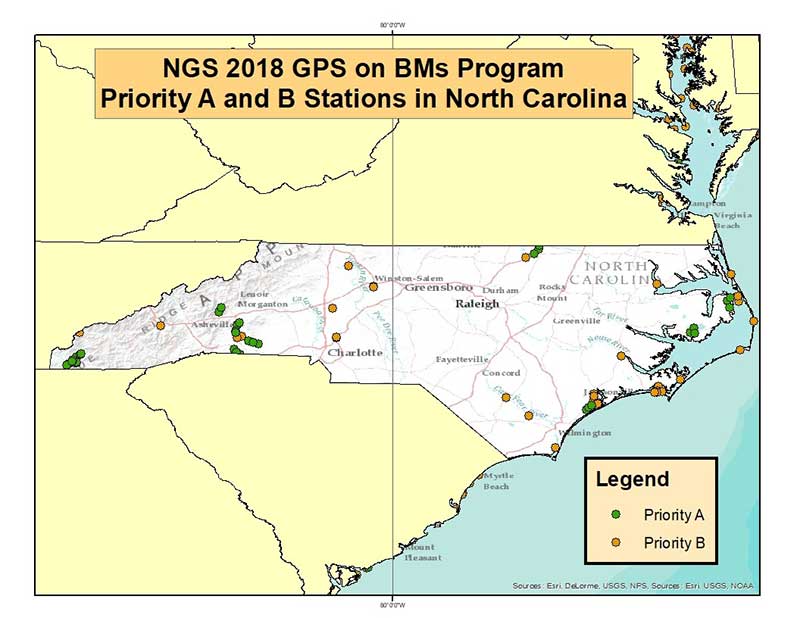
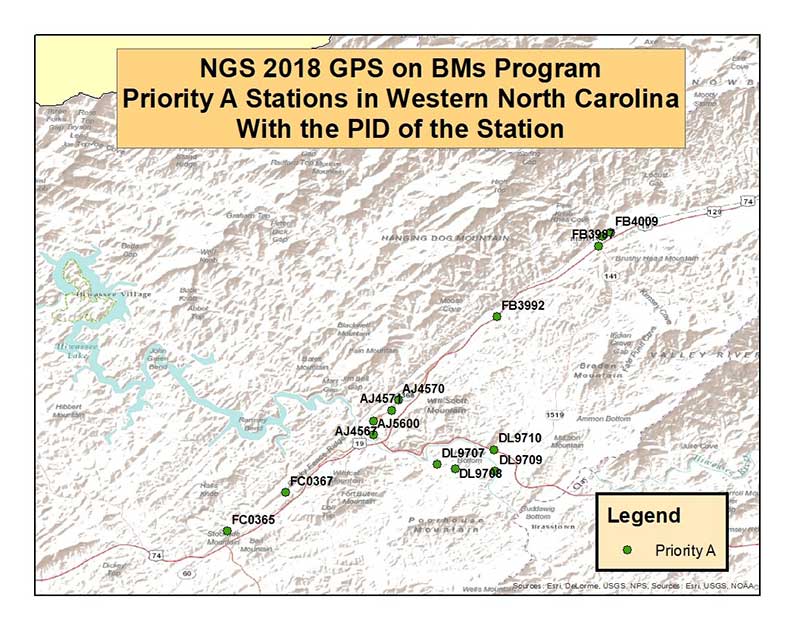
    Figure 2 – NGS 2018 GPS on BMs Program – Priority A and B Stations in North Carolina.
    Figure 3 – NGS 2018 GPS on BMs Program – Priority A Stations in Western North Carolina With the PID of the Station.


    Figure 4 – NGS 2018 GPS on BMs Program – Priority A Stations in Western North Carolina With the Number of Observations.

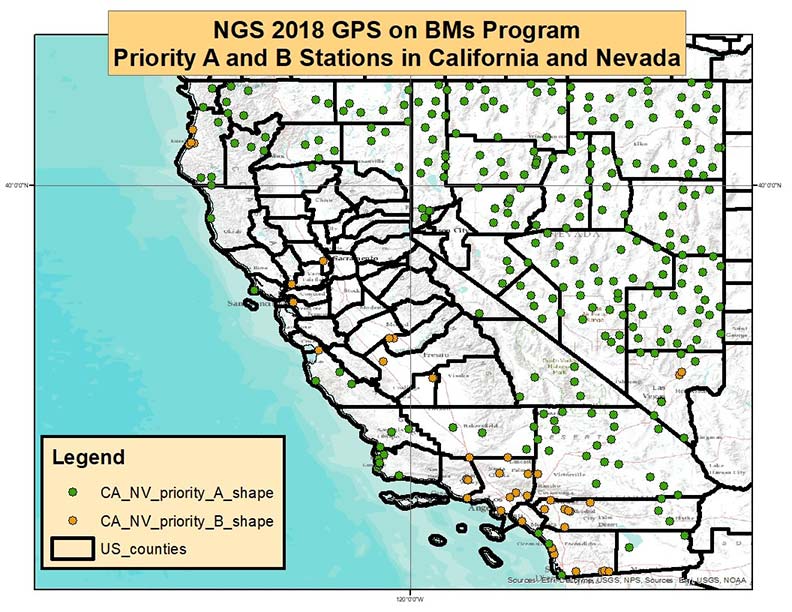
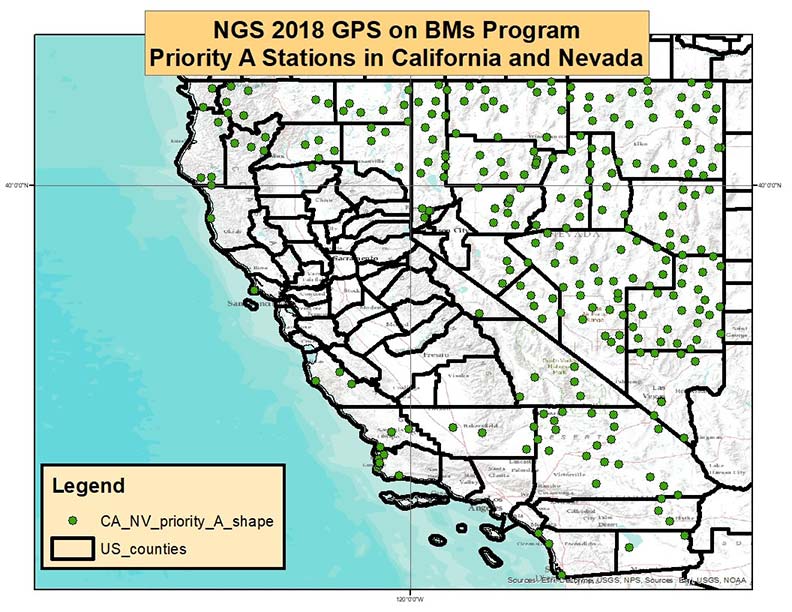
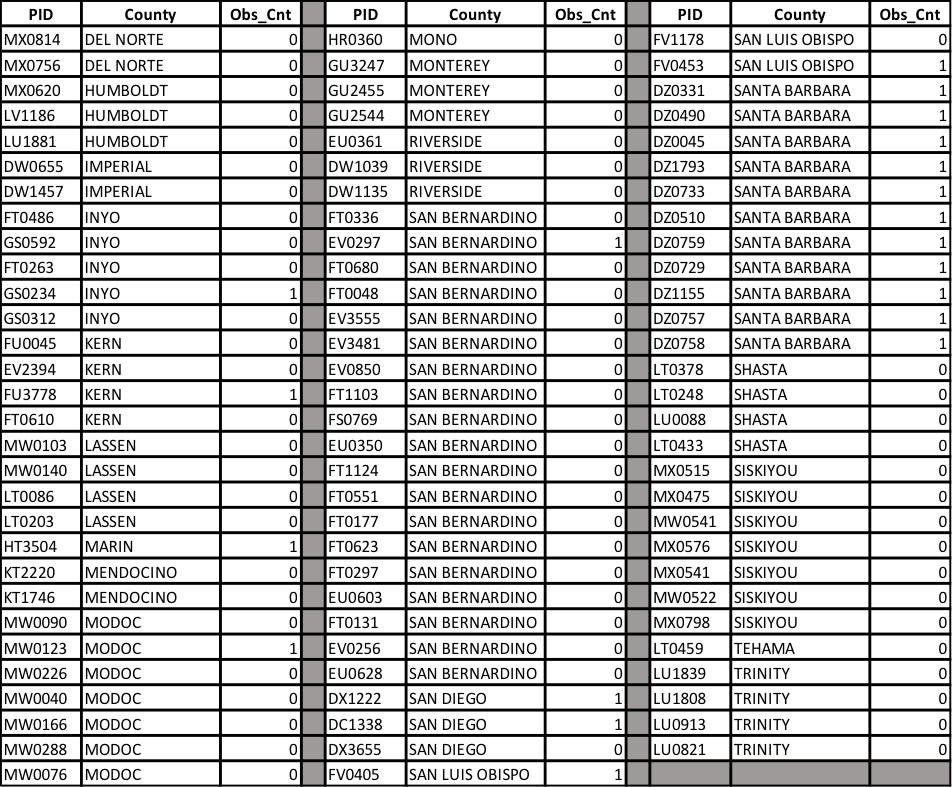
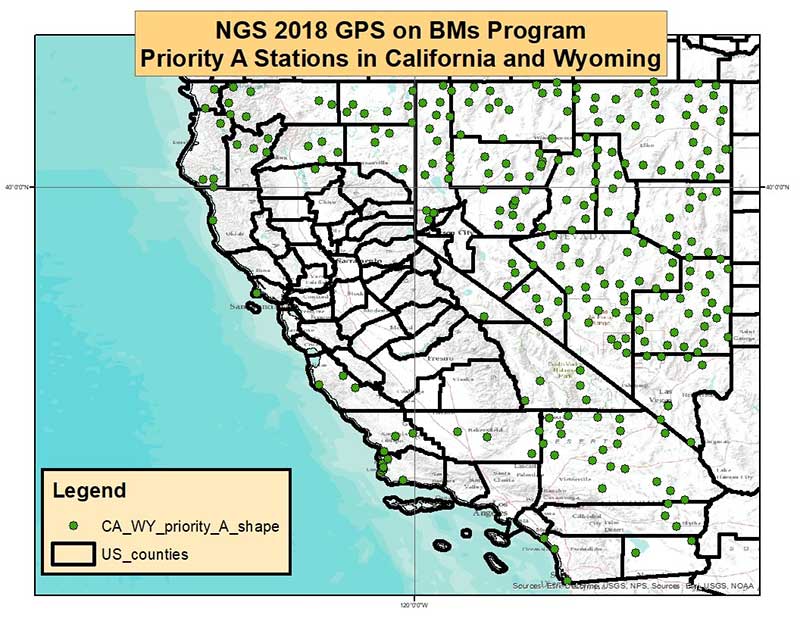
    For completeness, I will provide an example of a region in the western United States – California and Nevada. They are larger States than North Carolina and have more Priority A stations that need to be observed. Figure 5 depicts the Priority A and B stations in California and Nevada, and figure 6 depicts the Priority A stations in California and Nevada. It is recognized by NGS that managing how these stations are observed and who does what is a monumental task. Some state agency may undertake observing all of the Priority A stations; for example, Gary Thompson, Chief of the North Carolina Geodetic Survey, has committed to observing all of the Priority A stations (personal communication). Other States have County and City surveyors that will help observe and manage the process. All of the information provided in the 2018 GPS on BMs allow individuals to sort the data in ways that meet their needs. For example, the box titled “List of Priority “A” Stations by County in California” provide the list of stations in California by county.

    Figure 5 – NGS 2018 GPS on BMs Program – Priority A and B Stations in California and Nevada.
    Figure 6 – NGS 2018 GPS on BMs Program – Priority A Stations in California and Nevada.

    It should be noted that NGS identified the priority stations based on hybrid geoid requirements. The NGS geoid team would desire a valid GPS on BMs observation every 30 km. Therefore, some of the priority A stations are in areas void of any GPS on BMs stations. There may be many reasons for this but, most likely, it’s because it’s located in an unpopulated or mountainous region of the county. Either way, it may be difficult to obtain observations at these stations. The new hybrid geoid model will be created using whatever data are available. In these void areas, the geoid will be controlled by the nearest GPS on BMs stations. There is nothing wrong with this approach. The only issue will be that it will not be possible to evaluate the relation of the hybrid geoid model and NAVD 88 in these void areas. Figure 7 depicts the priority A stations and the population of cities in Northwestern Nevada and Northeastern California. The figure indicates that these priority A stations are located in an unpopulated region of Nevada. It’s obvious why there’s no GPS on BMs in this region since nobody lives there but the geoid doesn’t depend on population. In any event, if the user can obtain an observation in these regions it will really help in creating an accurate hybrid geoid model.

    List of Priority “A” Stations by County in California

    (Note: The stations in this table may not be the final list of priority A and B. The attached zip file contains the latest list of stations. The latest list was received too late to modify the table.)
     

    NGS’ process for determining which stations were outliers and which stations should be re-observed involved analyzing both GNSS and leveling data from NGS’ database. The GPS on BMs residuals were computed using the procedure described in the box titled “Procedure for Computing the GPS on BMs Residuals.”
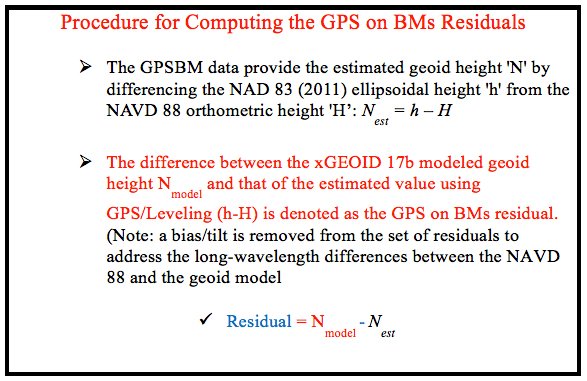
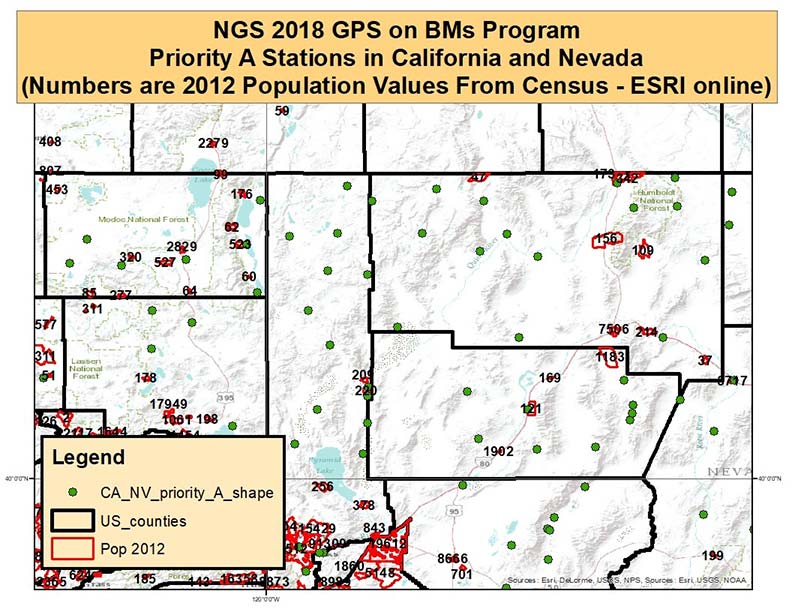
    Figure 7 – NGS 2018 GPS on BMs Program – Priority A Stations in California and Nevada. (Numbers are 2012 Population Values from Census – ESRI online)

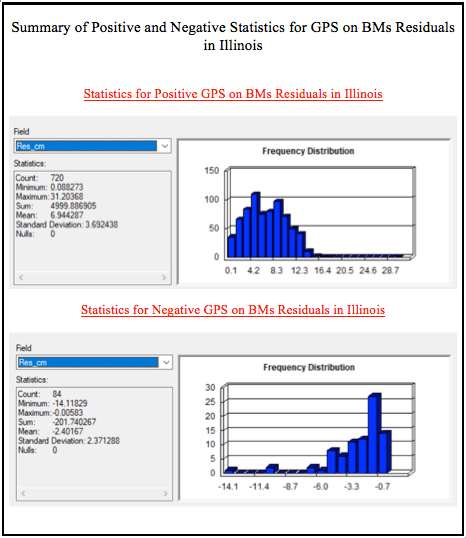
    Figure 8 depicts the location of the GPS on BMs stations in Illinois. The box titled “Summary of Statistics for GPS on BMs Residuals in Illinois” provides a summary of the GPS on BMs residuals for the State of Illinois. The results indicate that there are 804 GPS on BMs in Illinois and the residuals range between -14.1 cm to 31.2 cm. They have a mean of 6.0 cm with a standard deviation of 4.6 cm. The table titled “Statistics for GPS on BMs Residuals in Illinois With Rejections Removed” indicates that most residuals fall between 2 and 10 cm. The box titled “Summary of Positive and Negative Statistics for GPS on BMs Residuals in Illinois” provides a summary of the statistics for the positive and negative set of residuals.
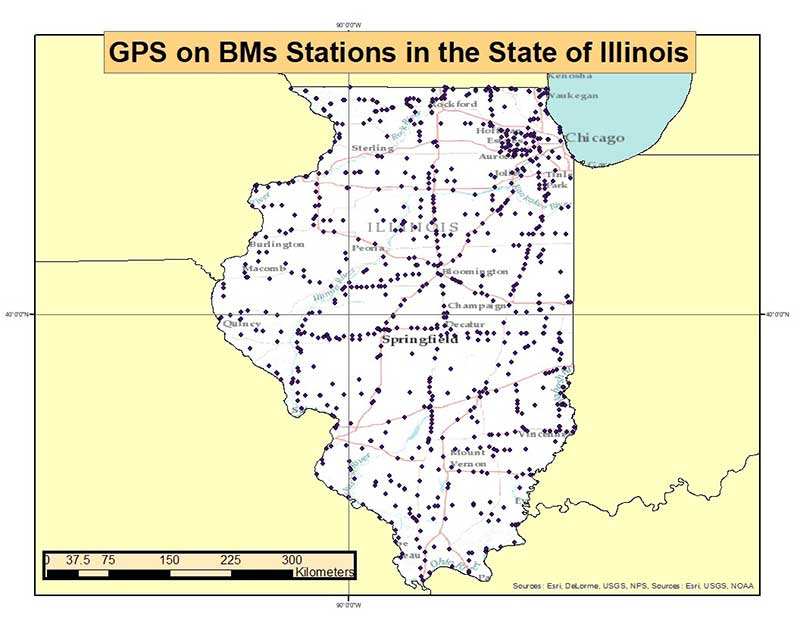
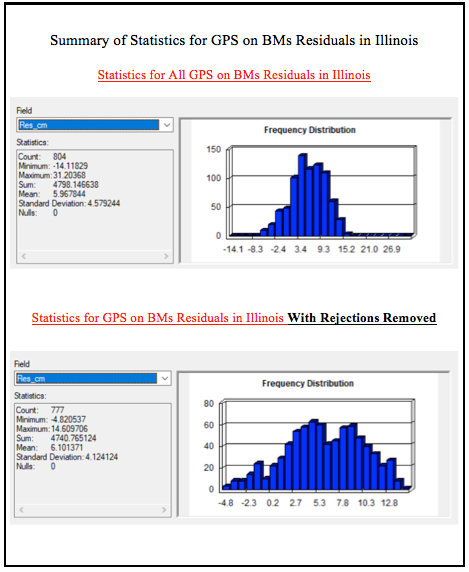
    Figure 8 – GPS on BMs Stations in the State of Illinois.

    Figure 9 depicts the GPS on BMs residuals in the Springfield, Illinois, Region. During the detailed analysis of the latest GPS on BMs dataset, the analysts identified outliers that appeared to be large relative to their neighbors. Figure 9 depicts these outliers with a “X.” Stations designated with a “X” are stations that were designated as DO NOT USE in the creation of the hybrid geoid model. Figure 9 also indicates were the analyst recommended that a station should be observed before the creation of the next hybrid geoid model. These stations are labeled as Priority A stations on figure 9. Figure 10 is an enlargement of the same area that depicts a station that was recommended to be rejected in the hybrid geoid model (PID KB0702). The stations surrounding PID KB0702 all seem to be consistent with each other (residuals in smaller blue squares) so the analyst recommended that station KB0702 be rejected. At the same time, by rejecting this station, this creates a void area that needs to be filled. Therefore, the analyst also recommended that a new station be observed here; hence, the two priority A station plotted near the rejected station. Figure 11 is a plot of another rejected station (KB1018) in the same region but, in this case, the analyst did not recommend an additional observation in the area because there was another nearby station (station in red triangle) that was consistent with its neighbors (residuals in smaller blue squares).
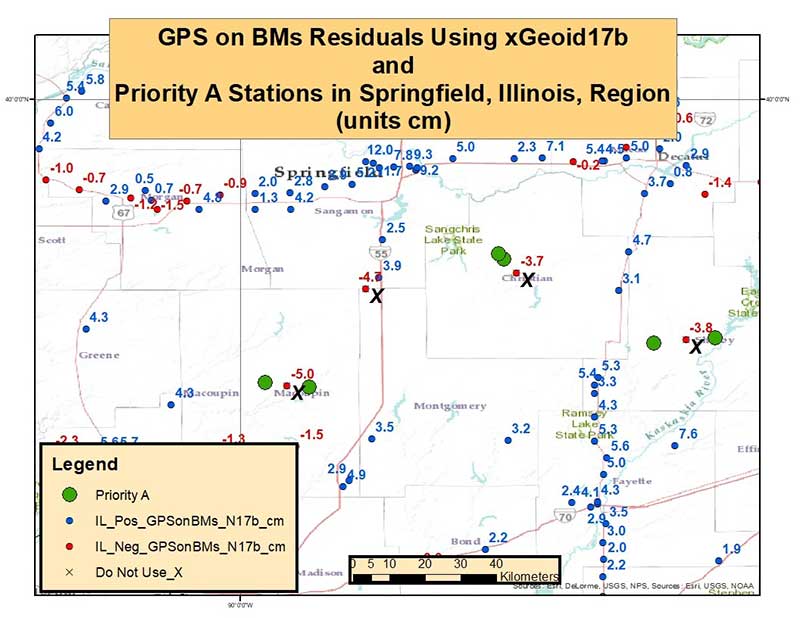
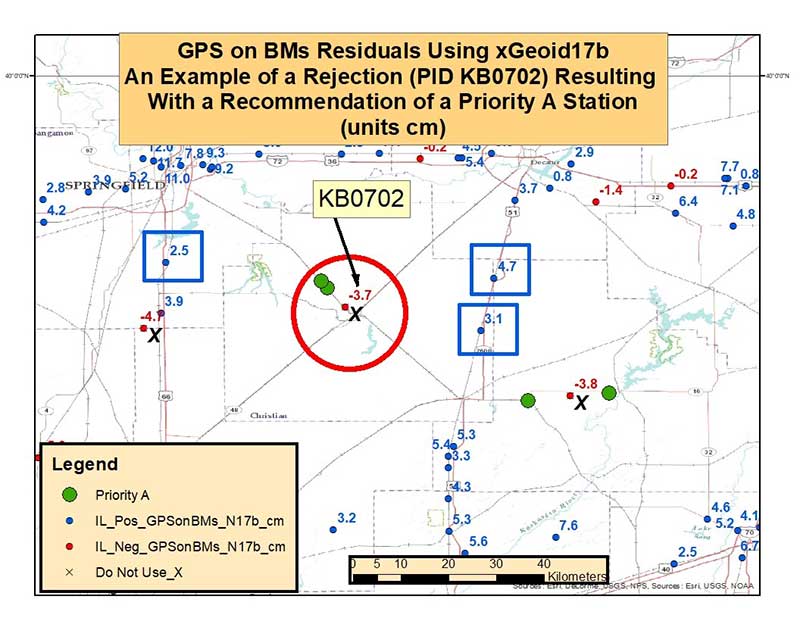
    Figure 9 – GPS on BMs Residuals Using xGeoid17b and Priority A Stations in Springfield, Illinois, Region (unit cm).
    Figure 10 – GPS on BMs Residuals Using xGeoid17b – An Example of a Rejection (PID KB0702) Resulting with a Recommendation of a Priority A Station (units cm).

    As previously mentioned, and provided in the box titled “Attributes Considered During Analysis,” several attributes were analyzed before making the recommendations but, typically, GPS on BMs residuals between +/- 5 cm were used to identify which stations needed to be investigated.

    Attributes Considered During Analysis

    ➢ Total number of GPS observations
    ➢ Date of last GPS observation
    ➢ Whether or not the GPS station has repeat baselines
    ➢ Total number of times the mark has been leveled to
    ➢ Date of latest leveling
    ➢ Quality of leveling
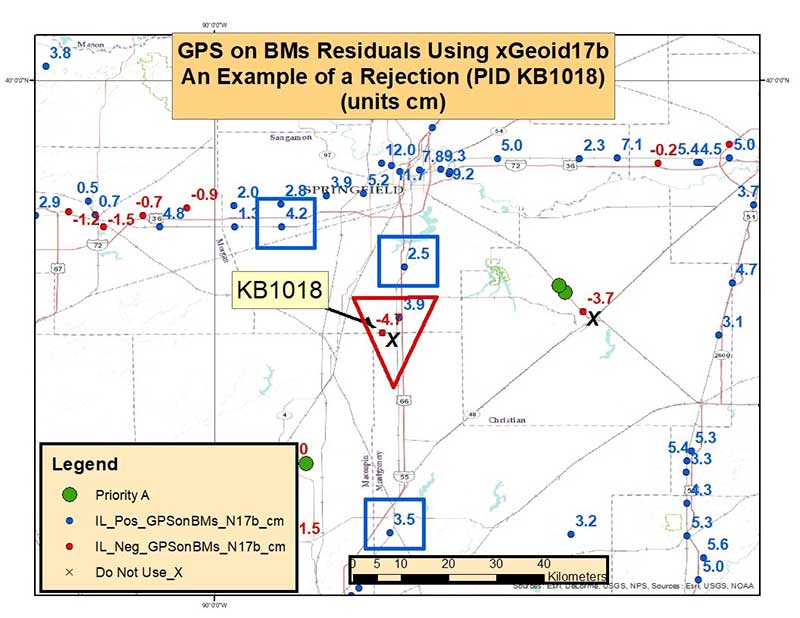
    Figure 11 – GPS on BMs Residuals Using xGeoid17b – An Example of a Rejection (PID KB1018) of an Outlier (units cm).

    This analysis is the first cut at identifying stations that should not be used in a hybrid geoid model and providing a list of specific stations that could help improve the hybrid geoid model. All new data received by the cut-off date of August 31, 2018, will be analyzed by NGS and, if appropriate, the results will be included in the next hybrid geoid model. This is a great opportunity to provide data that will help to improve the hybrid geoid model in your region. My next column will provide a status report on the 2018 GPS on BMs Program.
  • UK government issues highest level study of SatNav vulnerabilities

    A U.K. government report issued on Jan. 30 looks at the vulnerability of all satellite-based positioning systems: GPS, Galileo, GLONASS, BeiDou, QZSS and more. Issued by the Office of the Government Chief Scientific Adviser, Sir Mark Walport, and informally called the Blackett Report, designating the highest level of government scientific studies, named after a UK physicist who won the 1948 Nobel Prize, the review aims to “lay out the breadth, scale and implications of our reliance on ‘the invisible utility’ mainly in terms of existing critical national infrastructure (CNI).”

    “Satellite-derived Time and Position: A Study of Critical Dependencies” states in the forward that it “represents a vital step in understanding the UK’s dependency on GNSS and recommends measures to improve our resilience. Importantly, it also recognises that innovation will be key to realising, fully and safely, the economic and societal benefits offered by GNSS.”

    The report points to the fragility of satellite positioning signals which can be affected by cheap jammers, spoofers, weather and interference from other radio signals — among other vulnerabilities. The 86-page PDF document is downloadable here.

    The review incorporates the results of a separate but related study, issued in April 2017, looking at the fiscal consequences of a GNSS disruption in. “Economic Impact to the U.K. of a Disruption in GNSS” was briefly summarized in a June 2017 column from this magazine (scroll down to “At What Cost Ignorance?”). The report attempted to quantify the cost of a GNSS disruption, should one occur. The authors came up a figure of 5.2 billion pounds ($6 billion) for a 5-day disruption.

    David Last, a UK consultant engineer specializing in radio navigation and communications systems, professor emeritus at the University of Bangor, Wales and past president of the Royal Institute of Navigation, consulted on the June 2017 economic impact report, and was a member of the expert panel and co-author of the January 2018 Blackett Report. He was to have given a presentation on them at the ION International Technical Meeting in Reston, Virginia on January, but could not make the trip. The following materials are drawn from his prepared presentation.

    Some of the conclusions from the June 2017 economic impact study are:

    • There are alternatives to GNSS, specific to each application
    • However, there is no universally-applicable single alternative for positioning and navigation
    • Among the most salient needs: higher quality (more expensive) oscillators for timing
    • “The most applicable mitigation strategies for the largest number of applications are eLoran and Satelles.”
    • “Omnisense and Locata may be preferred for localised applications that require high levels of accuracy.”

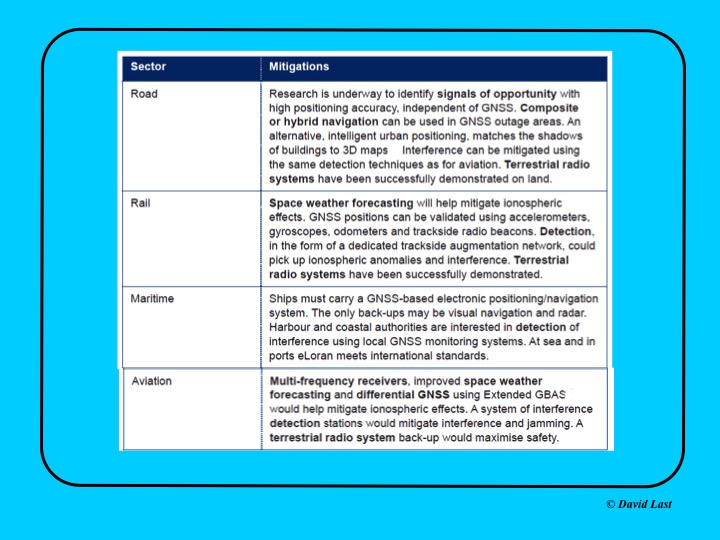
    From the just-issued Blackett Report, the first figure displayed above presents recommended mitigations to impacts on GNSS applications in road, rail, maritime and aviation. Alternative options include composite or hybrid navigation, terrestrial radio systems, space weather forecasting, eLoran, various methods of interference detection, multi-frequency receivers and differential GNSS.

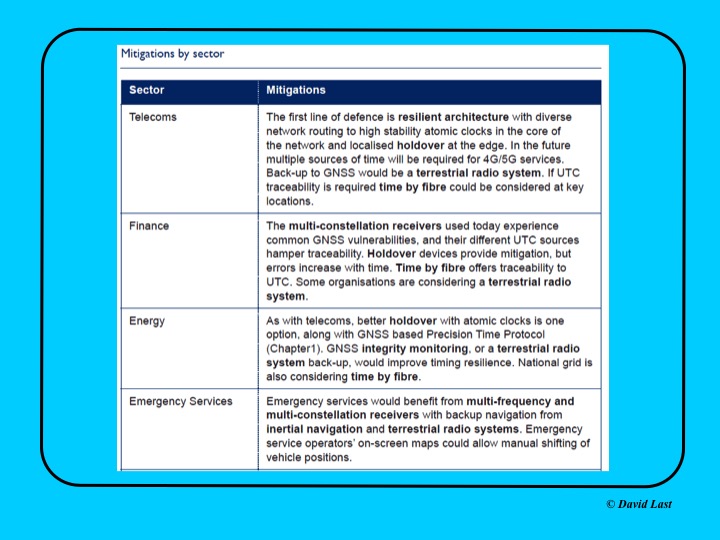
    A second figure from Last’s presentation, shown above, covers the mitigations recommended for telecoms, finance, energy, and emergency services sectors. Mitigations for these applications include a resilient architecture with diverse network routing to high-stability atomic clocks, terrestrial radio systems, time-by-fiberoptics, multiconstellation receivers, holdover devices, GNSS integrity monitoring, and inertial navigation.

    Concluding recommendations of the Blackett Report:

    1. CNI operators to review and report on their reliance on GNSS. Cabinet Office to assess overall dependence of CNI on GNSS.
    2. Add loss or compromise of GNSS-derived PNT to National Risk Assessment, not just as a dimension of space weather.
    3. In allocating radio spectrum to new services and applications, address the risk of interference to GNSS-dependent users, including CNI.
    4. Review the legality of the sale, ownership and use of devices and software to cause deliberate interference to GNSS receivers or signals.
    5. Assess the need to monitor interference of GNSS at key sites such as ports and share the data with government
    6. Employ GNSS-independent back-up systems.
    7. Cross-government PNT Working Group to report to Cabinet Office on ways to improve national resilience.
    8. Government to facilitate as those procuring GNSS equipment for CNI specify performance standards.
    9. Map PNT testing facilities and explore how industry and critical services can better access them.
    10. Leverage UK academic and industrial expertise in time and geo-location, increasing coordination among existing centres of excellence.
  • Delair offers advanced UAV for aerial surveying and mapping

    Delair offers advanced UAV for aerial surveying and mapping

    Delair, a supplier of drone solutions for commercial industries, has introduced the next-generation of its high-performance DT26X Lidar UAV.

    The DT26X is a long-range fixed-wing drone that combines highly accurate lidar sensing capabilities with an integrated high-resolution RGB (red, green, blue) camera, dramatically increasing the precision, efficiency and cost effectiveness of surveying and 3D mapping.

    The Delair DT26X lidar drone combines lidar sensing with RGB camera data to enable highly accurate and high-resolution 3D representation and measurement over large areas with minimal flights and in challenging environments. (Image: Delair)

    Details of the new model, which builds on Delair’s proven expertise in long distance, beyond visual line of sight UAV operations, were revealed at the International Lidar Mapping Forum in Denver.

    Aerial-based lidar allows for extremely detailed and accurate collection of elevation data of the ground, even in large and vegetated areas, but is typically performed with specialized, single function platforms or expensive manned aircraft surveys with long lead times.

    Camera-enabled drones offer a complementary solution for collecting imagery that can augment the lidar-based models. Most projects therefore require multiple mapping flights and separate UAVs, with initial missions using lidar sensors and subsequent flights equipped with RGB-cameras to enhance the digital rendering.

    The Delair DT26X lidar’s combined payload of a lightweight sensor and integrated camera allows the acquisition of lidar and photogrammetry data in a single flight, which drastically reduces cost and immediately provides an extremely detailed digital model of the inspected assets.

    The lidar sensor is specifically designed for UAV use, adding little weight or bulk to the Delair frame. The fully-integrated smart RGB camera enables real-time camera sensor control and in-flight photo review with automated quality checks.

    The new platform delivers increased accuracy in 3D mapping and modeling of terrain and corridors in challenging physical environments (e.g. mountainous, inaccessible by road or foot, dense vegetation) and with difficult visibility, lighting or weighting conditions.

    Its long range flying capabilities — allowing coverage of up to 2,400 square acres, communication range of 30 kilometers and 100 minutes of flight time — improve the efficiency of aerial mapping operations over large areas. As a result, the Delair DT26X lidar is well suited for uses such as environmental and land surveys, forestry monitoring, infrastructure surveillance, powerline and pipeline inspections, and road and rail construction.

    “The combination of a sophisticated lidar sensor and an industrial grade RGB camera removes the ‘either/or’ decision of choosing between lidar and imagery data acquisition for geospatial professionals,” said Chase Fly, geospatial product manager at Delair. “This is the most versatile and cost-effective UAV solution for large area, long range mapping and surveying where accuracy and detail are required. It provides the precision and visibility required by the most demanding use cases and allows data acquisition and advanced digitization not possible through terrain-based or satellite 3D mapping techniques, or with limited short-range UAVs. With this configuration, users can acquire all the data required for a colorized point cloud from a single flight, which eases the point cloud classification process back in the office, saving significant time and money.”

    New lidar sensor for more accurate mapping. The Delair DT26X lidar fixed-wing UAV incorporates the new RIEGL miniVUX-1DL lidar sensor, a specially designed device for the needs of UAV use.

    The small form factor sensor includes a downward looking and optimized field of view specifically geared for corridor mapping tasks. The wedge prism scanner construction produces a field of view of 46 degrees, and the circular scan pattern provides a very high point density and point distribution.

    It offers a high scan speed of up to 150 scans per second and a measurement rate of up to 100,000 measurements per second. It is effective in penetrating poor lighting conditions or dense foliage. The lidar sensor makes use of RIEGL’s Waveform-lidar technology, allowing echo digitization and online waveform processing. It supports multiple-target resolution of up to five target echoes per laser shot.

    “The new Delair UAV is typically the type of drone RIEGL had in mind when designing the RIEGL miniVUX-1DL, and represents another step toward completing our UAV lidar equipment product portfolio. The scanner’s specific wedge prism scanning mechanism generates a circular scan pattern, resulting in high point densities and therefore is especially well suited when deploying the scanner from fast moving acquisition platforms such as fixed-wing UAVs. The FOV (field of view) of the miniVUX-1DL is 46deg, resulting in optimized efficiency for downward-looking, linear acquisition set-ups like corridor mapping applications, for example. We are pleased to have such an innovative company like Delair as an esteemed OEM integration partner, bringing our sensing technology to key market sectors that require a flexible lidar solution,” commented Michael Mayer, managing director, RiCOPTER UAV GmbH.

    RiCOPTER UAV GmbH is a subsidiary of RIEGL Laser Measurement Systems GmbH, an international provider of technology in airborne, mobile, terrestrial, industrial and unmanned laser-scanning solutions. RiCOPTER UAV GmbH commercializes RIEGL’s turnkey lidar UAV solution and laser-scanning payloads dedicated for UAV integration.

  • Sentera adds elevation maps to AgVault platform

    Elevation variance maps are now available within the Sentera AgVault platform, offering agronomists, crop consultants and growers additional field insights.

    Topography and elevation data helps agriculture professionals increase operating efficiencies when building variable rate prescriptions, creating drainage or land-leveling plans, and designing subsurface drainage.

    Elevation maps are ordered within AgVault and are delivered as both a color-mapped topographic map image and a set of industry-standard shapefiles.

  • Raven grows precision ag facility in South Dakota

    Raven Industries has given South Dakota State University (SDSU) $5 million to establish a precision agriculture facility within the College of Agriculture and Biological Sciences on its main campus in Brookings, South Dakota.

    SDSU is the first U.S. land-grant university in the country to offer both a four-year degree and a minor in precision agriculture.

    The facility will be the nexus for innovation and collaboration across several disciplines, including engineering, agronomy, horticulture, mathematics and the decision sciences, according to SDSU President Barry Dunn.

    It will enhance innovation and the development of educational programs that will deliver applications to enable data-driven decisions in precision farming, ranching and conservation, as well as promote collaboration between faculty, students and industry experts.

  • Trimble acquires e-Builder to expand construction management solutions

    Trimble has acquired privately-held e-Builder, a software-as-a-service (SaaS)-based construction program management solution for capital program owners and program management firms.

    e-Builder extends Trimble’s ability to accelerate industry transformation by providing an integrated project delivery solution for owners, program managers and contractors across the design, construct and operate lifecycle, the company said.

    e-Builder manages more than $300 billion of construction project value and over 200,000 projects from some of the most influential owners in North America. Owners benefit from the e-Builder solution through improved transparency and accountability while contractors benefit from faster payments, increased productivity and improved competitive advantage.

    The e-Builder solution is uniquely designed to measure and manage every step of the capital project delivery process including planning, design, procurement, construction and operations.

    Trimble’s wide range of construction hardware and software solutions significantly improve project cost, schedule and effectiveness — beneficially impacting owners, architects, engineers and contractors. The Trimble presence in construction has two points of focus, one on civil engineering projects and the other on the construction of buildings and structures. Both will benefit from the e-Builder acquisition.

    Trimble solutions leverage constructible building information model (BIM) workflows to integrate processes, improve information fidelity, reduce rework, establish transparency and deliver higher productivity. By using Trimble technologies, contractors and owners are realizing substantial reductions in total project cost.

    The combination of Trimble and e-Builder accelerates value creation for both owners and contractors by combining e-Builder’s best practice solutions for owners with Trimble’s construction lifecycle solutions, access to contractors and global reach.

    The combined solution portfolio will accelerate the integration of field operations with enterprise needs, enabling additional productivity gains. The tangible benefits include more consistent on-time and within-budget project delivery that is enabled by improved visibility, clear accountability for outcomes and the ability to convert large volumes of disparate data into actionable workflows and measurable outcomes.

    “e-Builder has always recognized that owners play a key role in the construction lifecycle and that their influence will be key to the adoption of transformative construction technology,” said Steven Berglund, president and CEO of Trimble. “Trimble will extend its reach into the owner community by leveraging e-Builder’s presence. In turn, we intend to aggressively bring e-Builder solutions to civil and building contractors and the international market. We see a significant opportunity in leveraging data and intelligence gained through design-construct workflows across the full infrastructure lifecycle. e-Builder’s solutions and, more importantly, its organization provide a strong platform for significant growth.”

    “e-Builder’s mission is to improve project execution to make construction faster, less expensive and more reliable,” said Ron Antevy, president and CEO of e-Builder. “The addition of our solutions to Trimble’s broad portfolio extends our collective ability to best support owners and contractors with project delivery and management. e-Builder current and future customers will benefit from Trimble’s construction management expertise, culture of innovation and global reach to take e-Builder solutions to the next level.”

    The e-Builder business will be reported as part of the Buildings and Infrastructure Segment.

    Financial Terms

    The all cash purchase price of $500 million will be financed through a new $300 million credit facility and cash. The new facility has terms and conditions similar to the existing revolver with a 364 day term.

    e-Builder’s reported trailing twelve month revenue is approximately $53 million. In recent years, e-Builder’s revenue growth rate has exceeded 20 percent annually, with greater than 65 percent subscription revenue as a percentage of total revenue. The transaction is expected to be dilutive to Trimble’s first quarter non-GAAP net income per share by $0.01 per share and dilutive to full year 2018 non-GAAP net income per share by $0.02 to $0.03 per share, due to the impact of fair value accounting of e-Builder’s deferred revenue and interest expense. Trimble expects the acquisition to be accretive to 2019 non-GAAP net income per share.

    An overview of e-Builder and the strategic rationale for the acquisition is available on Trimble’s Investor Relations website. For a more detailed description of the acquisition and credit agreements see Trimble’s Form 8-K filed with the U.S. Securities and Exchange Commission (SEC) on Feb. 2, 2018.

    About e-Builder

    Founded in 1995, e-Builder is a provider of integrated, cloud-based construction program management software for top facility owners and the companies that act on their behalf.

    The company’s flagship product, e-Builder Enterprise, improves capital project execution, resulting in increased productivity and quality, reduced cost and faster project delivery.

    Since 1995, e-Builder’s technology leadership and construction industry focus have helped thousands of global companies, government agencies, and health care and educational institutions manage billions of dollars in capital programs with solutions to improve the plan, build and operate lifecycle.

    The company is based in Plantation, Florida.

  • NVIDIA Jetson takes to the sky to improve worksite visualization

    Komatsu plans to introduce NVIDIA graphics processing units (GPUs) to its SmartConstrution jobsites. The GPUs will communicate with drones from Skycatch, a Komatsu partner, which will collect 3D images, generate terrain data and “visualize” site conditions.

    Komatsu is deploying the artifical intelligence (AI) project as an extension of its SmartConstruction initiative in Japan; the drone-assisted, automated equipment service was launched to alleviate the burden of the country’s severe shortage of skilled workers.

    The company has deployed SmartConstruction at than 4,000 jobsites across the country, and the AI extension will be integrated into those sites.

    Working with NVIDIA, OPTiM Corp. — another Komatsu partner and an internet of things management software company — will provide an application to correlate terrain data to jobsite workers and construction machines for visualization.

    Enter Jetson. At the center of this collaboration is the NVIDIA Jetson artificial intelligence platform. When Jetson, which works with NVIDIA’s cloud technology, is installed in construction machines, it will be able to provide 360-degree images, enabling prompt recognition of workers and other machines nearby. The technology could potentially decrease fatalities that result from workers being struck by an object, piece of equipment or vehicle.

    Jetson will also be used with the stereo cameras installed in the cabs of construction equipment, and will recognize continuously changing jobsite conditions on a real-time basis, to better provide accurate instructions to machine operators.

    Future plans call for use not only for automatic control of devices, but also for high-resolution rendering and virtual simulation of construction and quarry jobsite operations.

  • Trimble MX9 mapping system designed for surveying, engineering, GIS

    Trimble has released its MX9 mobile mapping solution for large-scale scanning and mapping missions.

    The Trimble MX9 combines a vehicle-mounted mobile lidar system, multi-camera imaging and field software for efficient, precise and high-volume data capture for a broad range of mobile mapping applications such as road surveys, topographic mapping, 3D modeling and asset management.

    The Trimble MX9 captures dense point-cloud data along with 360-degree immersive georeferenced imagery using a spherical camera, GNSS/INS technology and dual-head laser scanning sensors.

    Trimbe-MX9-mobilemapper-O

    The system’s innovative and lightweight design facilitates easy installation and setup on a variety of vehicles. Spatial data can be captured at highway speeds from inside the vehicle for safe operation in transportation corridors.

    The intuitive, browser-based field software, accessible via most tablets or any notebook, enables operators to quickly establish and conduct data-acquisition missions, monitor the status of the system, and assess the quality of the acquired data in real time.

    “The Trimble MX9 is our next-generation mobile mapping system, focused on simple operation and integrated workflows for a new generation of users and applications,” said Ron Bisio, vice president of Trimble Geospatial. “We believe there’s a tremendous potential for a system that offers high-quality performance, simple installation and easy operation.

    “Being able to capture high-fidelity and survey-grade data for a whole project site, a complete city or even a statewide road-network allows our customers to use mobile mapping data for a variety of surveying, engineering and mapping applications.”

    The Trimble MX9 is designed for applications including transportation infrastructure planning, as-built surveying, GIS mapping and asset management. Survey and engineering professionals can analyze road cross-sections, perform clearance inspections, conduct topographic mapping, and also use the data for machine control.

    Mapping professionals can utilize the same data for city mapping and planning, inventory mapping and 3D modeling of buildings and linework.

    Complete integration with Trimble office software allows users to seamlessly process the acquired data and generate deliverables for a wide variety of applications. Tools are available for survey and engineering applications as well as deriving and publishing GIS and asset management deliverables.

    Users can also easily export their data for use with third-party software.

    The Trimble MX9 is available for virtual or live demonstrations, depending on customer location, beginning in April. The MX9 system includes a roof rack. Optional accessories such as a GNSS azimuth measurement system (GAMS) or a distance measurement instrument (DMI) are available.

  • Fractus Antennas launches 5G chip antenna

    Fractus Antennas has launched a mobile antenna that enables coverage at 3G, 4G and 5G — the TRIO mXTEND chip antenna component.

    The TRIO mXTEND has been specifically designed to provide flexibility to operate any required frequency band inside any wireless device.

    It is capable of operating the main mobile communication standards, enabling worldwide coverage, as well as GNSS such as GPS, GLONASS and BeiDou (1561 MHz, 1575 MHz and 1598-1606 MHz) and the main short range wireless bands such as Bluetooth and Wi-Fi (2400-2500MHz and 4900-5875MHz) through the same antenna component.

    The TRIO mXTEND is a modular, multiband and multi-port antenna component that enables top-quality worldwide coverage at any mobile communication standard. Its reconfigurable and off-the-shelf nature allows multiple architectures so the antenna component can be assembled into any mobile or IoT device.

    It has been designed for providing mobile operation in three different frequency regions: 698-960 MHz, 1710-2690 MHz and 3400-3800 MHz. In addition, TRIO mXTEND is presented in an ultra slim component of 1 millimeter that enables easy placement into any device.

    The Fractus Antennas team will be at Mobile World Congress in Barcelona, either at the venue or in Fractus Antennas Headquarters, which is based in the city. Those interested are invited to arrange a meeting.

  • Korea will launch its own satellite positioning system

    Korea will build its own navigation satellite system by 2034, providing independent positioning and navigation signals over an area spanning a 1,000-kilometer radius from the country’s capital, Seoul.

    The Ministry of Science and information and communications technology (ICT) announced that it would finalize a plan for the Korean Positioning System (KPS) at a Space Committee meeting on Feb. 5.

    According to a preliminary statement from the Ministry of Science and ICT, the KPS initiative will develop a ground test in 2021, core satellite navigation technology by 2022 and begin actual satellite production in 2024. The system will comprise a total of seven navigation satellites, three of them geostationary above the Korean Peninsula.

    Figure from the 2016 paper shows a conceptual view of real-time WADGPS operation. The reference station transmits observation data at 1 Hz frequency to the master station. The master station is operated in real time and creates correction information and basic integrity information thereby configuring a message. A message is sent to the satellite communication simulation device according to its own transmission protocol. The satellite communication simulation device performs broadcasting of WADGPS correction information into the L1 band. A message created in every sec is coded with reserved GPS PRN C/A code and modulated with L1 frequency. Since additional correction information transmission medium such as geostationary orbit satellite or pseudolite is not considered in this study, radio frequency (RF) signals are created using simulation devices and performance was verified while connecting the signal with user receivers via cable. Additionally, a commercial communication network was used to transfer correction messages in order to verify user performance, which is located remotely. (Image: Korean Journal of Positioning, Navigation, and Timing)
    Figure from the 2016 paper shows a conceptual view of real-time WADGPS operation. The reference station transmits observation data at 1 Hz frequency to the master station. The master station is operated in real time and creates correction information and basic integrity information thereby configuring a message. A message is sent to the satellite communication simulation device according to its own transmission protocol. The satellite communication simulation device performs broadcasting of WADGPS correction information into the L1 band. A message created in every sec is coded with reserved GPS PRN C/A code and modulated with L1 frequency. Since additional correction information transmission medium such as geostationary orbit satellite or pseudolite is not considered in this study, radio frequency (RF) signals are created using simulation devices and performance was verified while connecting the signal with user receivers via cable. Additionally, a commercial communication network was used to transfer correction messages in order to verify user performance, which is located remotely. (Image: Korean Journal of Positioning, Navigation, and Timing)

    Korea currently relies on the U.S. GPS system, which has suffered repeated local area jamming emanating from North Korea.

    “As the GPS becomes a necessity in everyday life, broken signals for any reason can set off a nationwide chaos,” said an official for satellite navigation at the Korea Aerospace Research Institute (KARI).

    Officials stated the the KPS will also improve  available un-aided accuracy of GPS in its service area from about 10 meters now to less than one meter.

    “Advanced nations are trying to secure strong GPS capabilities by sending up satellites to prevent a chaos that can take place while they depend on other nations’ satellites,” stated the KARI spokesperson.

    The initiative appears to be separate from the Korean Wide Area Differential GPS System, whose development was the subject of a 2011 paper presented at the Institute of Navigation (ION) International Technical Meeting. The abstract for that paper stated:

    “[The] project is scheduled for 2010 to 2014 under the contract with the Ministry of Land, Transport and Maritime affairs (MLTM). After that, Korea will launch a geostationary multifunctional satellite with a navigation payload which will be broadcasting augmenting signals for GPS.”

    In March 2016, the Korean Journal of Positioning, Navigation, and Timing published a paper titled “Performance Analysis of WADGPS System for Improving Positioning Accuracy,” by Hyoungmin So , Jaegyu Jang, Kihoon Lee, unpyo Park and Kiwon Song. Its conclusion section stated:

    “In this paper, configuration of observation reference stations and master station and initial experiment results were presented to verify accuracy correction performance of the WADGPS. The wide area correction algorithm was implemented using eight reference stations and one master station. For the initial performance verification, static and dynamic experiments were conducted. The experiment result showed that the static experiment had a horizontal accuracy performance with a level of 1 m (95 percent). In the dynamic experiment using a vehicle, performance degradation occurred compared to that of static experiment. The reason for this was due to the measured value error at the user receiver caused by multipath and visibility limitation. In summary, the implementation and performance of the algorithm of early stage were verified. For the future study, user operation characteristics will be considered and additional performance analysis on created correction information will be conducted.”

  • Mayflower delivers anti-jam antenna systems to U.S. Air Force

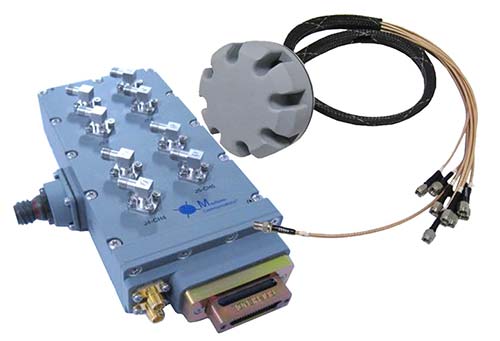
    Mayflower Communications Company has delivered its Multi-Platform Anti-Jam GPS Navigation Antenna–Federated (MAGNA-F) to the U.S. Air Force Special Operations Command (AFSOC) in August 2017.

    Mayflower’s MAGNA-F anti-jam antenna system.

    Mayflowers’ GPS anti-jam system (MAGNA) provides protection for multiple military GPS receiver types (C/A and SAASM).  The AFSOC platform has been proven in an operational environment.

    MAGNA-F can provide protected GPS signals to different receivers simultaneously. It protects critical mission systems on the platform and provides unwavering position, navigation and timing (PNT).

    The MAGNA-F system provides the fixed-wing platform with unsurpassed high-performance anti-jam capability.

    “The MAGNA-F is easy to install as a drop in FRPA replacement, provides high-performance GPS anti-jam, and is very reliable,” said Joe Thomas, director of government programs for Mayflower.

    The integration and testing of the MAGNA-F began in late January and February of 2017 and was led by the U.S. AFSOC Program Team at U.S. Special Operations Command (USSOCOM).

    The flight testing proved the Mayflower MAGNA-F provides the highest level of PNT assurance for size, weight and performance (SWaP) constrained fixed-wing and UAS platforms.

    The MAGNA-F is built on an open systems architecture and can be used with multiple military or civilian GPS receivers.

    The MAGNA-F enables growth capabilities across a variety SWaP constrained platforms including rotary wing, fixed wing, and small to large unmanned aerial systems (UAS). The MAGNA AJ systems are also adaptable for U.S. Army ground vehicle AJAS requirements.

    Over the past five years, Mayflower has delivered anti-jam systems across multiple aircraft (fixed wing, UAS) and U.S. Navy strategic-level submarine platforms.

    The Mayflower family of anti-jam systems have a wealth of military live tests (flight and ground) and “real-world” operational experience. The Mayflower SAS (NavGuard 500), SAGE (NavGuard 501) and MAGNA-F (NavGuard 502) assures a Technology Readiness Level (TRL 8/9) product. Each of these systems are software upgradable with capabilities such as direction of arrival, jammer characterization, and operational with U.S. Army pseudolites.

  • DoD offers $110K in startup contest for GNSS-denied navigation technologies

    The U.S. Department of Defense (DoD) and Israel’s Ministry of Defense are joining forces for the third time in setting up a startup competition to tap into new technologies to beat terrorism. More than $200,000 in prizes will be awarded to the most promising startups.

    “As terrorists become ever more sophisticated, technological innovations become an increasingly critical component of detecting and defeating them,” challenge organizers said.

    The challenge is is divided into two tracks.

    • The Urban Navigation Technologies Challenge focuses on navigating without GPS — an increasingly important issue for special forces, law enforcement and other anti-terrorism professionals who need to operate indoors or in environments where GPS is not available. (See more below.)
    • The General Technologies Challenge includes surveillance, social media analytics, image and video, cybersecurity, drones, robotics, personal protection, biometrics, reconnaissance, and detection of explosives or water contamination.

    Both tracks are open to all startups, entrepreneurs, and research groups worldwide, with a deadline of March 9. Entries will be reviewed by an international panel of judges from the DoD, Israel Defense and other organizations.

    The most promising startups will be invited to present at the Combating Terrorism Technology Conference in Tel Aviv University on June 17.

    Navigation Challenge

    Entries in Urban Navigation Challenge might include location services based on beacons, technologies incorporating pre-loaded maps, technologies that estimate a user’s position via dead-reckoning or step-counting, and any other technology for navigating or positioning with no GPS.

    Technologies may include: laser, inertial, vision, simultaneous localization and mapping, dead reckoning, pre-installed beacons or other infrastructure, pre-loaded maps, Wi-Fi, cellular or any other solution that operates in a GNSS-denied environment.

    The winning startup will receive a $100,000 prize and a runner-up receives $10,000.

    In addition, Navigation Challenge finalists will demonstrate their technologies in a dedicated urban navigation test facility in Israel.