An autonomous Peugeot Citroën has driven itself all the way from Paris to Bordeaux, a distance of 360 miles (580 km). (Credit: PSA Peugeot Citroën)
On Oct. 2 one of PSA Peugeot Citroën’s four autonomous vehicles traveled the motorway from Paris to Bordeaux to take part in Intelligent Transport Systems (ITS) World Congress, which was held Oct. 5–9.
The 580-km trip was completed entirely in autonomous mode without driver involvement. The car autonomously adjusted its speed and changed lanes to overtake, taking into account other vehicles, speed limits and infrastructure.
In July 2015 PSA Peugeot Citroën became the first carmaker to obtain the relevant authorizations to carry out open road tests using four autonomous prototypes and some 15 such models in 2016.
PSA Peugeot Citroën is working to develop solutions and technologies to make the car of tomorrow smarter, the carmaker said, to enhance driver comfort and adapt to changing customer behavior and expectations. Autonomous driving features will help cut the number of accidents linked to human error and reduce driver fatigue in monotonous driving situations. These projects will soon be applied to production models, with the gradual deployment of driverless features.
“The journey made by our prototype today proves that autonomous vehicles are no longer of matter of science fiction. This ushers in a new era for mobility, which I find truly exciting,” said Carlos Tavares, chairman of the managing board of PSA Peugeot Citroën.
At the ITS World Congress PSA Peugeot Citroën presented its car-to-car and car-to-infrastructure communication systems, along with its autonomous vehicle. The systems, which offer a new source of information, use data transmitted by other vehicles and infrastructure to enhance awareness of the vehicle’s surrounding environment. The idea is to improve road user safety by anticipating certain critical situations to reduce the number of accidents.
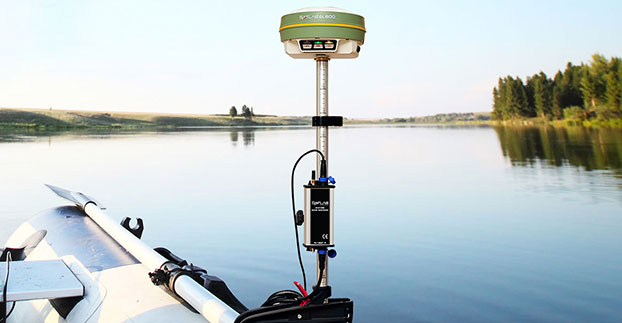
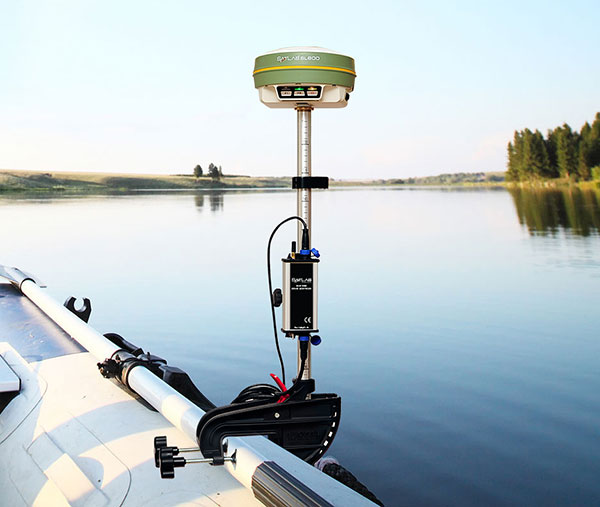
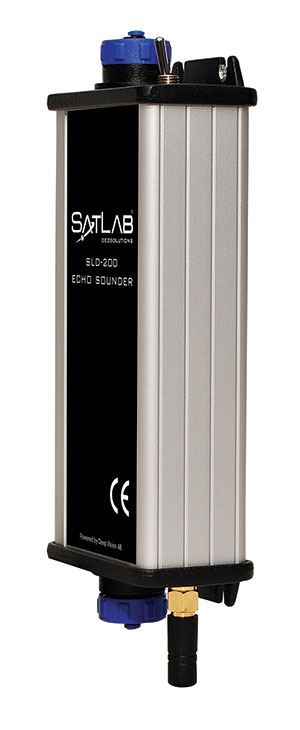
Swedish-based Survey and GIS equipment maker Satlab Geosolutions AB has announced the availability of its SLD-100 GNSS Rover accessory to facilitate Hydrographic measurement in bodies of water up to 100 meters in depth. It is designed for those who find themselves needing to survey into bodies of water, streams and rivers.
With survey-grade accuracy, the Satlab SLD-100 can be added to any brand GNSS RTK Rover to allow for position and depth measurements to be made simultaneously. With a built-in 10-hour lithium battery and transmitter unit with Bluetooth connectivity, the SLD-100 provides standard depth data streams in several industry standard NMEA formats at 1Hz, 4800 bps, providing compatibility with any hydrographic surveying software package.
“Our new SLD-100 survey receiver is extremely easy to use with position and depth information externally logged on a computer or controller,” said Birol Güçlüer”, CTO and partner of Satlab. “With the included transom mounting hardware, installation is quick and easy.”
The SLD-100 is available now for a suggested retail price of US$2995.
CyberCity 3D and Fayetteville, N.C., are moving the city from 2D to 3D GIS mapping, a transformation focused on interoperability, high scalability and wide reach. The result is a more engaging and detailed 3D streaming map that’s elevated the city’s planning and development capabilities.
The City of Fayetteville’s GIS Manager, Richard Tuinstra, spearheaded the plan to design a mapping system that used three-dimensional mapping and web-based architecture while getting a high rate of return on the investment. Tuinstra took an approach outside the traditional GIS “box,” seeking content that could run on scalable web architecture. He found CyberCity 3D, a geospatial city modeling company near Los Angeles.
“The City of Fayetteville has always understood the great benefits of using 3D GIS for its daily operations, from public safety, parks and recreation to urban design and planning, but has found it difficult to get a good start,” said Tuinstra. “Partnering with CyberCity has made our first steps in 3D GIS a quick and easy process. The result so far has been well received by our city manager’s office and the city staff members. Some of the great advantages of this mapping system are that it only requires a simple web browser and is very user friendly. We can’t wait to expand geographically and thematically on what we have achieved right now.”
According to the city’s information technology director, Dwayne Campbell, the plan had to include three requirements. “First, it had to avoid costly, time-consuming training and software licensing. Second, the solution needed to be delivered as a software service in an open environment capable of running on all mobile devices. Finally, the City needed a strategy that enabled it to continue to leverage our existing investment in Esri’s ArcGIS software.”
The city ultimately chose the combination of CyberCity 3D buildings for their accuracy and interoperability, while looking to CesiumJS.org for its open source 3D globe mapping. CyberCity 3D created more than 550 buildings for the project, from best-in-practices photogrammetry, to insure GIS integrity and flexibility. CyberCity 3D also provided imagery and street names via its streaming images services on the Cesium 3D Globe; as a government institution, the City of Fayetteville pays no streaming fees for the 3D Globe and image layers. In addition, the city requested a tree layer; the existing GIS zoning and district mapping data the city generated with Arc GIS software was also seamlessly included.
“The unique combination of CyberCity 3D’s buildings, the Cesium 3D Globe, and ArcGIS software create an unsurpassed mapping system for the City of Fayetteville,” said CyberCity 3D CEO Kevin DeVito. “This dynamic move to 3D will enable the city to best plan for its future while engaging its employees, stakeholders and the community at large in an immersive manner.”
As an early adopter, the City of Fayetteville has gone from using 2D PDF maps to owning cutting-edge 3D GIS content on a platform that reaches not only city employees and stakeholders, but every citizen. This dynamic solution vastly increases their understanding of the geospatial elements of the city. Its deployment also allows for the easy addition of other GIS layers such as business points of interest or FEMA poly-layers for environmental planning and sustainability, expanding the map’s usefulness, engagement and return on investment.
The PennDOT TDS developed by GeoDecisions enables collection and processing of millions of data points.
GeoDecisions, an information technology company specializing in geospatial solutions, has developed a new traffic data system (TDS) that processes more than 20 million new records per month for the Pennsylvania Department of Transportation (PennDOT).
Built on the Esri platform, the TDS helps PennDOT’s Bureau of Planning and Research better manage the download of traffic data from collection sites throughout the commonwealth of Pennsylvania.
“Built to Federal Highway Administration standards, GeoDecisions’ redesign of our TDS provides us a method to seamlessly introduce new counting devices, more efficiently verify our raw traffic data, and speed up our process for creating yearly traffic volume maps,” said Andrea Bahoric, planning division manager with PennDOT.
The new TDS improves PennDOT supervision of 45,000 short-term or portable counters that classify vehicles, record traffic volume and weight, and determine driving speed. The system’s mobile Field Operations Module (FOM) also streamlines in-pavement counter inventory and maintenance activities.
“FOM enables PennDOT field technicians to use smartphones or tablets to perform site reviews and document issues,” said Greg Ulp, senior project manager with GeoDecisions. “Convenience and efficiency are critical factors when enhancing technology and managing assets.”
PennDOT’s predecessor traffic data management system contained nine applications with dated technology requiring manual intervention to collect and verify information. GeoDecisions’ TDS redesign features five modules streamlined for better performance and usability. The new automated system includes remote user access and cutting-edge GIS mapping, web service, database and coding technologies.
“Our transportation system solutions provide a proven business model for analytics, reporting, reliability, and technology workflow management,” said Tom Saltzer, vice president of government delivery with GeoDecisions. “PennDOT’s redesigned TDS is a long-term collection, verification, and geospatial solution that reflects their ongoing enterprise GIS investment strategy.”
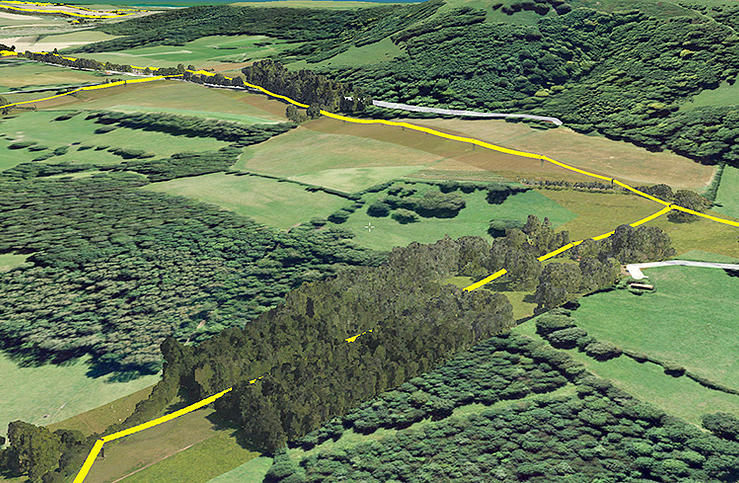
Bluesky has completed a multi-million pound aerial mapping project to assess the impact of vegetation on the electricity network of East Anglia and the South East of England. Working on behalf of UK Power Networks, Bluesky undertook the largest ever combined laser mapping and aerial photography survey commissioned by an electricity distribution network operator in the UK — some 34,000 square kilometers.
The laser mapped (LiDAR) data and aerial photographs were then analyzed to assess the proximity of vegetation to the overhead power lines in order to create a proactive three-year vegetation management program. Bluesky worked in partnership with ADAS, an agricultural and environmental consultancy, to complete the project.
Dedicated survey planes equipped with a lidar mapping system and aerial survey equipment flew the whole of the South East and East of England. Capturing millions of individual laser mapped height measurements and approximately 310,000 aerial images in just over three months, Bluesky successfully completed the unprecedented data capture element of the project within tight project deadlines, in challenging weather conditions and in adherence with strict Air Traffic Control restrictions.
The 80 terabytes of raw data was then processed and analyzed to identify which overhead line spans had vegetation infringement; for example the length of vegetation infestation along each span and its location and distance from the overhead line.
This information has now been incorporated into a 3D web portal that can be viewed from the desktop, enabling UK Power Networks employees to carry out virtual patrols of the network, saving time and reducing the risk of foot patrols, sometimes across difficult terrain including physical barriers such as rivers, ditches, livestock and numerous other potential hazards.
“This innovative £2.5 million project is of immense benefit to our customers and to the company,” said Nigel Hall, head of service development at UK Power Networks. “The risk-based tree-cutting program will help reduce tree-related power cuts for customers, with the additional benefit that it could be carried out without any disturbance to local landowners because it was done from the air rather than on foot.
“As a company it will help us get best value from our £19 million annual tree cutting budget, and the web portal will mean staff can carry out ‘virtual patrols’ from their desk, saving them time and reducing the potential hazards if they had had to walk the lines themselves.”
“Prior to commissioning the LiDAR and aerial mapping project, UK Power Networks undertook regular manual surveys as part of its assessment of network resilience, but the capture of LiDAR and associated aerial photography for the entire catchment area allows for evidence based decision making and long term planning, and provides a proven solution for other network operators,” added Rachel Tidmarsh, managing director of Bluesky.
Roy Dyer, Head of Arboriculture in ADAS and manager of the ADAS contribution to this contract said, “This has been a ground breaking contract. The combination of Bluesky’s technical ability and ADAS’ consultancy experience in managing vegetation near overhead lines enabled us to successfully deliver this challenging contract and improve the management and resilience of the overhead lines owned by UK Power Networks.”
Aeris is partnering with Isotrak Ltd. to provide improved cellular connectivity and data analytics for Isotrak’s global customers.
By leveraging Aeris’ machine-optimized and patented AerCore IoT and M2M network, AerPort connectivity platform and AerVoyance IoT and M2M analytics platform, Isotrak has added advanced capabilities to its 3iS FleetVision solution, part of its real-time ATMSi (Active Transport Management System) fleet management system. Isotrak can now provide business intelligence data to provide retailers and manufacturers with a full view of their transportation ecosystem — including their own fleets as well as those of third-party suppliers.
The collaboration between Aeris and Isotrak will provide customers with a reliable mobile network optimized to meet the demands that IoT/M2M solutions for fleet management creates, while providing actionable visibility and measurement into the performance of vehicles and drivers through data analytics. Isotrak’s integrated supply-chain solutions depend on accessing near real-time data with robust alerting and reporting capabilities, which Aeris is able to deliver through its carrier-agnostic network.
“Our fleet management system provides data for a total vision of a fleet manager’s transportation ecosystem. We wanted to ensure reliable connectivity services and data insights no matter where our customers are located,” said Jason Price, sales and marketing director with Isotrak. “By leveraging Aeris’ expertise in IoT network solutions, we are able to quickly provide a robust, global solution that goes well beyond improved connectivity and competitive rate plans to offer customers real-time, useful information at their fingertips to help improve their cost structure.”
Aeris’ global support of major cellular technology standards, such as GSM, CDMA and LTE, enables partners like Isotrak to offer customers flexibility and the potential for growth throughout the globe, the companies said.
“The inherent security built into the Aeris system gives companies like Isotrak peace of mind, and the speed of onboarding, even with a private virtual network, provides a competitive advantage,” said Mohsen Mohseninia, vice president for international market development at Aeris. “We can deliver technology that can be quickly deployed and will show immediate value while also helping to reduce the time to market for new products and services.”
Part 1 of this column appeared in the June Survey Scene newsletter, Part 2 appeared in the August newsletter. Upcoming Survey Scene newsletters will carry additional columns in this series.
Basic Understanding of Scientific and Hybrid Geoid Models
David B. Zilkoski
In my first newsletter column of this series, I discussed the basic concepts of GNSS-derived heights. I discussed the three types of heights involved in determining GNSS-derived orthometric heights: ellipsoid, geoid and orthometric.
In my second column (Part 2), I discussed guidelines for detecting, reducing, and/or eliminating error sources in ellipsoid heights. The column focused on guidelines for establishing accurate ellipsoid heights in a local geodetic network.
This column, Part 3, will describe the differences between a scientific gravimetric geoid model and a hybrid geoid model, and why it is important to use both geoid models in your analysis. The latest published United States National Geodetic Survey (NGS) hybrid geoid model, Geoid12B, is made consistent with the United States National vertical height reference frame, that is the North American Vertical Datum of 1988 (NAVD 88). This means a user will be consistent with NAVD 88 when using GEOID12B to estimate GNSS-derived orthometric heights. However, this doesn’t guarantee that your GNSS-derived orthometric heights are accurate.
NGS’ new Beta experimental geoid height models xGEOID14B and xGEOID15B are not distorted to fit the published NAVD 88 heights so they are useful for identifying valid NAVD 88 bench marks (that is, ensuring the monuments haven’t moved since their last survey and their published heights are still valid). Therefore, it is extremely important to validate all NAVD 88 height constraints used to estimate accurate GNSS-derived orthometric heights. Understanding NGS’ scientific and hybrid geoid models will help the user perform the appropriate analysis to determine which leveling-derived orthometric height constraints should be used as constraints. This newsletter will focus on differences between geoid models in a local project area.
Information on NGS’ experimental geoid models can be found here.
Thursday, August 20, 2015
Yearly Experimental Geoid Model Available for Public Review
In 2022, NGS will replace the current North American Vertical Datum of 1988 with one that is based on the geoid — a model of global mean sea level that is used to measure precise surface elevations. NGS created and released annual experimental models of the geoid starting in 2014. This year’s models, xGEOID15A and xGeoid15, are now available for public comment on the NGS beta website. The annual experimental models include new data from the Gravity for the Redefinition of the American Vertical Datum project, which has systematically collected airborne gravity data across the nation since 2008. For more information, contact: [email protected]
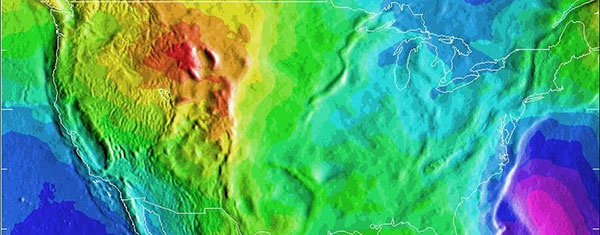
A depiction of the United States geoid. Areas in yellow and orange have a slightly stronger gravity field as a result of the Rocky Mountains.
While we often think of the earth as a sphere, our planet is actually very bumpy and irregular.
The radius at the equator is larger than at the poles due to the long-term effects of the earth’s rotation. And, at a smaller scale, there is topography—mountains have more mass than a valley and thus the pull of gravity is regionally stronger near mountains.
All of these large and small variations to the size, shape, and mass distribution of the earth cause slight variations in the acceleration of gravity (or the “strength” of gravity’s pull). These variations determine the shape of the planet’s liquid environment.
If one were to remove the tides and currents from the ocean, it would settle onto a smoothly undulating shape (rising where gravity is high, sinking where gravity is low).
This irregular shape is called “the geoid,” a surface which defines zero elevation. Using complex math and gravity readings on land, surveyors extend this imaginary line through the continents. This model is used to measure surface elevations with a high degree of accuracy.
How Does the U.S. National Geodetic Survey Generate a Geoid Model?
Generating geoid models is a fairly complex process and is performed by individuals with expertise in physical geodesy and geophysics. It is too complex of a topic for this newsletter but the following excerpt from an NGS publication by Dan Roman provides a good overview of NGS’ process.
Development of the North American Gravimetric Geoid: Adapting the Process to Determine a Unified Central American Geoid
D.R. Roman National Geodetic Survey, 1315 East-West Highway, Silver Spring, MD, USA, 20910
2 Data & Process Improvements
Techniques discussed here have already been addressed previously in Roman and Smith (2001) and Smith et al. (2001), hence only a summary of the approach discussed in those papers is given here. Essentially, the approach currently under investigations seeks to take advantage of recent and pending gains in various data sets related to the gravity field and significantly reduce approximations considered acceptable in the past.
The first thing to consider is the justification for using a geoid over a quasi-geoid, or more accurately, orthometric heights over normal heights. Convincing arguments have been made for orthometric heights (Holdahl 1984) and normal heights (Heiskanen and Moritz 1967). While orthometric heights require extensive knowledge of the gravity field, it is just that reason that warrants their use. Given the extensive knowledge and available data sets, it is incumbent on governmental agencies to generate such models. With a model of the gravity field from the surface to the geoid at hand, anyone subsequently desiring to transform from orthometric to normal heights need only apply it. However, if normal heights are developed and orthometric heights are later desired, the development of such a model will then be required. Clearly, this is a task best suited to national and international organizations that have access to such data and methods. It should not be left to those researchers desiring to use height models in their studies that may not have access to sufficient resources to accomplish this.
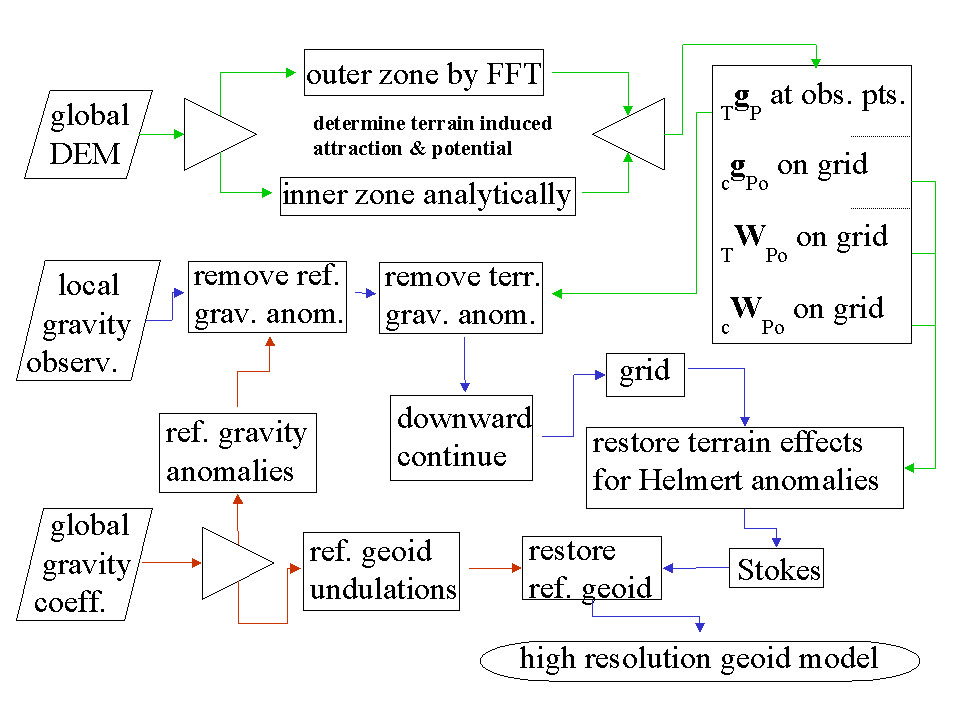
With that understanding then, the development of a gravimetric geoid model follows as a mechanism to readily convert between ellipsoidal and orthometric heights. The method summarized here seeks to break the gravity field into three components and solve them separately. In fact the long wavelength component will be derived from a global reference gravity model. The short wavelength will be determined from the terrain. Both of these components will be removed from available gravity observations, which will then reflect the intermediate wavelength signal. A flowchart depicting the determination of these three signals and the generation of a gravimetric geoid is given in Figure 1. Paths shown in red highlight the use of the reference model, paths in green show the determination of the terrain effects, while paths shown in purple highlight the main path to determining Helmert anomalies and then a gravimetric geoid model.
Fig. 1 Determination of a gravimetric geoid using Helmert anomalies.
The expected accuracy of global gravity models in the near future is expected to vastly improve with commission errors below 1-2 cm at wavelengths of 200-300 km (Tscherning et al. 2000). Use of a remove and restore technique (Bašiæ and Rapp 1992) will then result in significantly reduced errors in the residual signal that will be manipulated.
The approach discussed in Roman and Smith (2001) develops the North American gravimetric geoid by removing the terrain effects, downward continuing the residual values, and then restoring the effects of the condensed terrain to generate Helmert anomalies (Heiskanen and Moritz 1967).
To this end, the gravitational attraction of the terrain (TgP) will be calculated and removed from the gravity observations. It will be split into inner and outer zones to reduce computation times. Smith et al. (2001) showed that the effects of using FFT to determine gravitational attraction and potential for both condensed and 3D masses is negligible beyond about a 4 degree cap radius from the point of interest (P). Inside that zone, DEM’s are employed to capture the spherical relationships between the points and more accurately determine the attraction. With available or pending 1 and 3 arc-second DEM’s (Smith and Roman 2001a, NIMA 2001), the signal that may be determined is limited mainly by the computational facilities available to a researcher.
Additionally, the DEM’s will be used to construct grids for the attraction and potential of the condensed terrain (cgPo and cWPo), as well as the potential of the actual terrain (TWPo), all on the geoid. This will capture the short wavelength gravity signal represented by the terrain to the resolution of the grid generated and facilitate later incorporation of this signal into Helmert anomalies.
The resulting point values should be composed mainly of intermediate features in the gravity field with sources deriving from variations in the Moho depth and lateral density variations. This signal should be sufficiently smooth to reduce errors resulting from downward continuation. It should also sufficiently sample the intermediate field to permit the use of minimum curvature (Smith and Wessel 1990) to generate a grid at the same interval as that of the above terrain effects.
Once these terrain effects are restored, these extremely high resolution grids represent residual Helmert anomalies and may be processed using the Stokes integral to determine a best fitting residual gravimetric geoid. Adding the reference geoid derived from the selected global coefficient model will create an equally high-resolution regional gravimetric geoid model.
For a specific country, GPS-derived ellipsoid heights at leveled bench marks (GPSBM’s) provide control information for generating a hybrid geoid model that can be used to specifically, easily, and accurately transform heights between ellipsoidal and orthometric heights (Smith and Milbert 1999, Smith and Roman 2001b).
What are Hybrid Geoid Models and how are they Generated?
NGS’ hybrid geoid model GEOID12B is computed based on the gravimetric geoid USGG2012. As described above, the gravimetric geoid is computed using the satellite model (GOCO3S), terrestrial gravity data, and the altimetric gravity anomaly over oceans. The heights of USGG2012 represent an equipotential surface relative to the reference ellipsoid. The differences between USGG2012 and the zero height surface of NAVD88 are represented by NAD 83 (2011) GNSS-derived ellipsoid heights on NAVD 88 published benchmarks (GPSBM data). See article by Milbert, D.G., 1998: “Documentation for the GPS Benchmark Data Set of 23-July-98,” IGeS Bulletin N. 8, International Geoid Service, Milan, pp. 29-42.) for a excellent description of NGS’ GPSBM dataset.
Currently, the USGG2012 is fitted to the GPSBM data by using the method of least squares collocation. (See section labeled “Excerpts from NGS’ Geoid 12 Web Page” for specific details on how NGS generated hybrid geoid model GEOID12B.) Areas where there are no GNSS observations on published NAVD 88 benchmarks are filled in by USGG2012 geoid. This means a user will be consistent with NAVD 88 when using GEOID12B to estimate GNSS-derived orthometric heights. Being consistent with NAVD 88 is important but being consistent doesn’t guarantee that your GNSS-derived orthometric heights are accurate. The documentation of GEOID12B states that “The relative accuracy of GEOID12B to NAVD88 is characterized by a misfit of +/-1.7 centimeters nationwide.” However, if a published NAVD 88 height used in the development of the hybrid geoid model isn’t valid, then the model is precise but not accurate. That’s why it is important to ensure the monuments used in hybrid geoid models haven’t moved since their last survey and that their published heights are still valid. We will discuss this in more detail later in this newsletter.
Hybrid geoid model, GEOID12B is computed based on the gravimetric geoid USGG2012 . More specifically, they are computed using the satellite model GOCO3S, terrestrial gravity data, and the altimetric gravity anomaly over oceans. The heights of USGG2012 represent an equipotential surface relative to the reference ellipsoid. The differences between USGG2012 and the zero height surface of NAVD88 are represented by GPSBM data.
Currently, the USGG2012 is fitted to the GPSBM data by using the method of least squares collocation. That implies that the voids or empty areas where there are no GPSBM data are filled in by USGG2012 geoid.
There are over 500,000 leveled marks and 80,000 GPS marks over U.S. territory. Of those, there are only 26,000 GPSBM, with half of them concentrated in 5 states. The data density is uneven and sparse in some states. Lists of GPSBMs can be downloaded from the GEOID12B home page.
The GPSBM data provide the geoid height ‘N’ by differencing the ellipsoidal height ‘h’ from the orthometric height ‘H’:
N = h – H
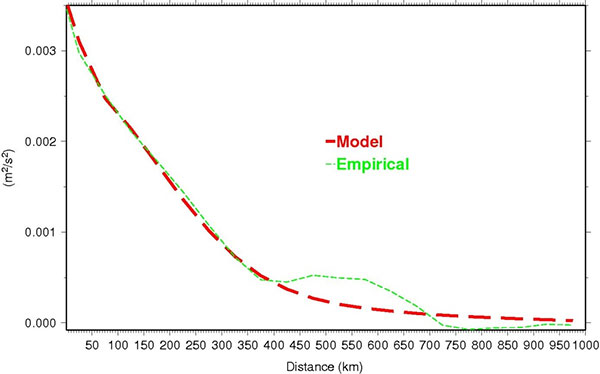
The difference between the geoid height N and that of USGG2012 is computed at every GPSBM. Then, a mathematical model using Least Squares Collocation (LSC) fitting Gaussian functions to describe the behavior seen at the GPSBM is developed. Figure 1 shows empirical data versus the model.
Figure 1: Covariance functions of the geoid differences between USGG2012 and GPSBMs.
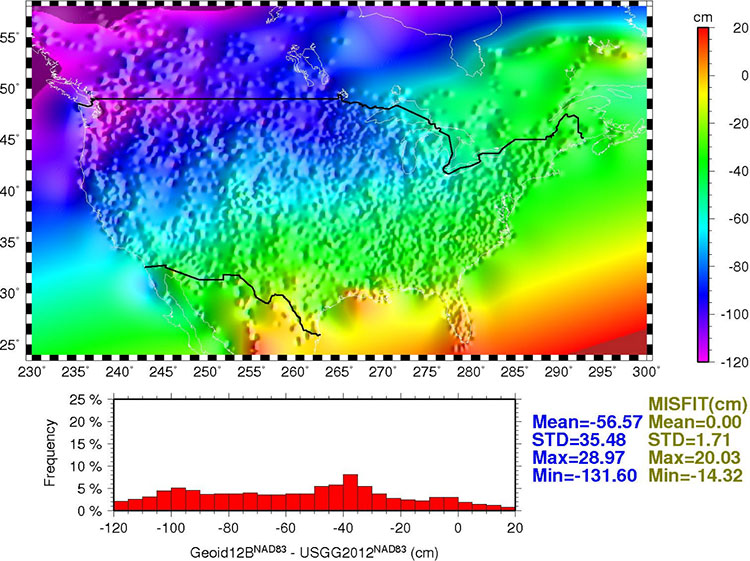
Once the relationship between the points is modeled, the model is used to generate a regular grid for interpolation purposes. Figure 2 shows the final conversion surface. This surface represents the difference between NAVD 88 as a datum and the geopotential (geoid) surface used in the gravimetric geoid and is representative of what the datum transformation surface will be when the new geopotential datum is released in 2022. (Similar to VERTCON, which transforms heights from NGVD29 to NAVD88.)
Figure 2: GEOID12B conversion surface.
Summary and Recommendations
Three hybrid geoid models GEOID12, GEOID12A, and GEOID12B are created. They are very similar, but have distinctive differences in few areas. GEOID12A differs from GEOID12 in that it does not use GPSBM data collected in the southern tier states along Gulf Coast, while GEOID12B differs from GEOID12A only in Puerto Rico.
Data in the database are constantly updated, hence older geoid models do not reflect the newer data. To guarantee data consistency, latest model should be used. At this time, GEOID12 and GEOID12A should be superseded by GEOID12B.
Use data conversion outside the GPSBM data areas with caution. Significant extrapolation errors are expected in areas where there are no GPSBM data.
The relative accuracy of GEOID12B to NAVD88 is characterized by a misfit of +/-1.7 centimeters nationwide.
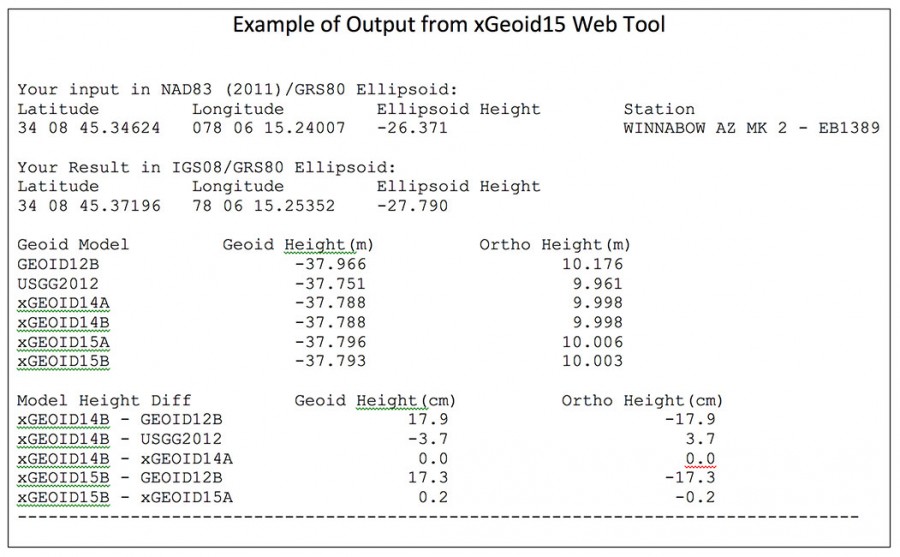
As previously stated, NGS released its latest gravimetric geoid model, xGEOID15. This site will allow the user to compare geoid heights from GEOID12B, USGG2012, xGEOID14 and xGEOID15. (See an example of an input and an output file below.) There are some limited features to this tool. It only provides the results in IGS08 and you are limited to the number of coordinates you can submit at once (20 stations).
Saying that, this tool can be useful for identifying valid NAVD 88 published monuments to be used in the development of future hybrid models. More importantly, it can be used to identify monuments that should NOT be used in future hybrid geoid models or used as constraints in GNSS survey project adjustments.
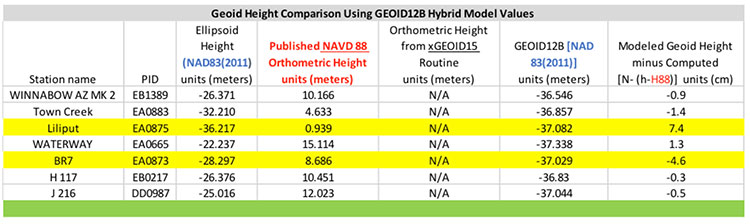
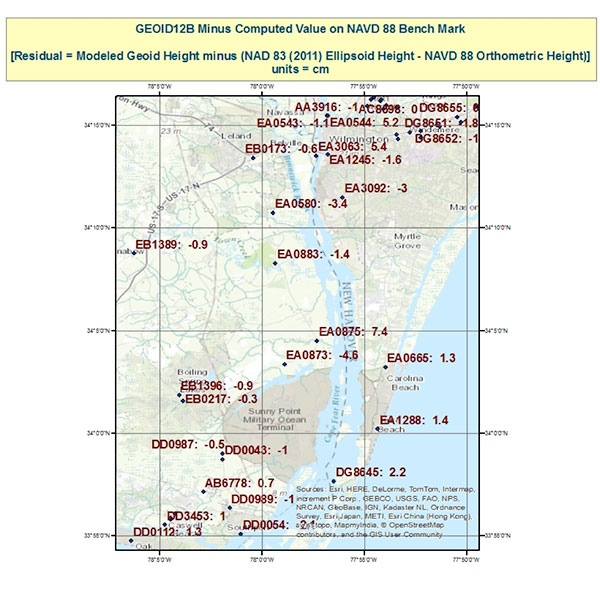
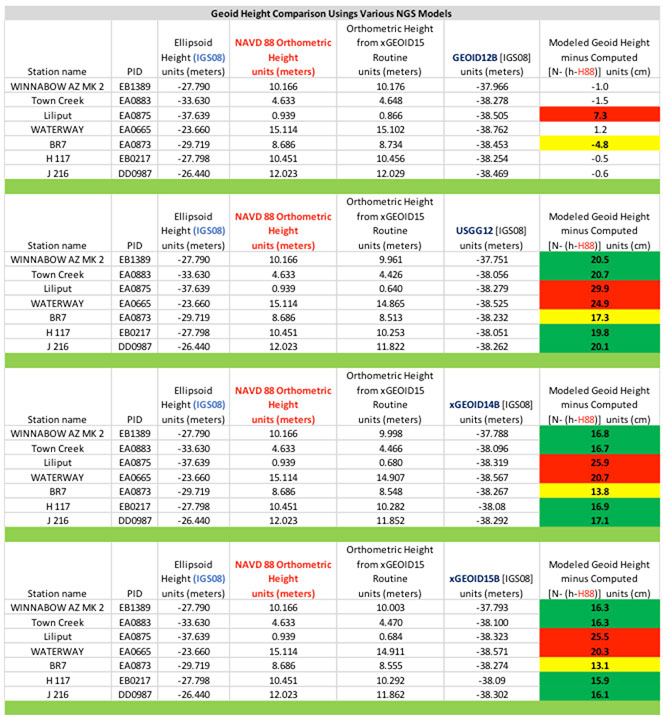
First, let’s look at the hybrid geoid model GEOID12B values compared with computed geoid height values using the equation N (Computed Geoid Height) = [h (NAD 83 (2011) Ellipsoid Height) – H (NAVD 88 Orthometric Height)]. Table 1 lists the differences between the modeled GEOID12B values and the computed geoid height values for a few stations in an area in eastern North Carolina. Figure 1 depicts the stations locations and values. Many of the differences are less than 1.5 cm which is consistent with NGS’ documentation of GEOID12B that states “The relative accuracy of GEOID12B to NAVD88 is characterized by a misfit of +/-1.7 centimeters nationwide.” However, what is important to notice is that two stations have large differences; station LILIPUT’s difference is 7.4 cm and station BR 7’s difference is -4.6 cm (See highlighted rows in table 1 and boxed area on figure 1). This means that the relative difference between stations LILIPUT (EA0875) and BR 7 (EA0873), which are only 3.3 km apart, is 12.0 cm. This is a large difference and may be indicating a large error in the ellipsoid height and/or the orthometric height at station LILIPUT (EA0875) or station BR 7 (EA0873). In the second newsletter we highlighted that stations LILIPUT and BR 7 were only 3.3 km apart but were not simultaneously observed during the same session. Since the relative difference is 12 cm, the ellipsoid heights of these two should be investigated. It should also be noted that the difference between stations BR 7 (EA0873) and TOWN CREEK (EA0883) is only 3.2 cm. This implies that station B 7 (EA0873) is consistent with some of its neighbors. In the second newsletter we noted that stations B 7 (EA0873) and TOWN CREEK (EA0883) were simultaneously observed during the same session. This may be an indication that B 7 is stable relative to its neighbors and that the orthometric and/or the ellipsoid height of station LILIPUT needs to be investigated.
So what does this mean to the user? If the user establishes a GNSS-derived orthometric height near station LILIPUT using GEOID12B, their results will disagree with the published NAVD 88 heights to around 7 cm; if they establish a GNSS-derived orthometric height near station BR 7, they will disagree with published NAVD 88 heights to around –5 cm. This could also mean that the results in a project could really disagree by more than 7 cm if station LILIPUT moved since its last survey. At this moment, we don’t have enough information to determine if the ellipsoid height or the orthometric height is the problem, or which station may have moved since its last survey.
Table 1. Geoid Height Comparison using GEOID12B Hybrid Model Values.Figure 1. Geoid12B minus Computed Value on NAVD 88 Benchmarks.
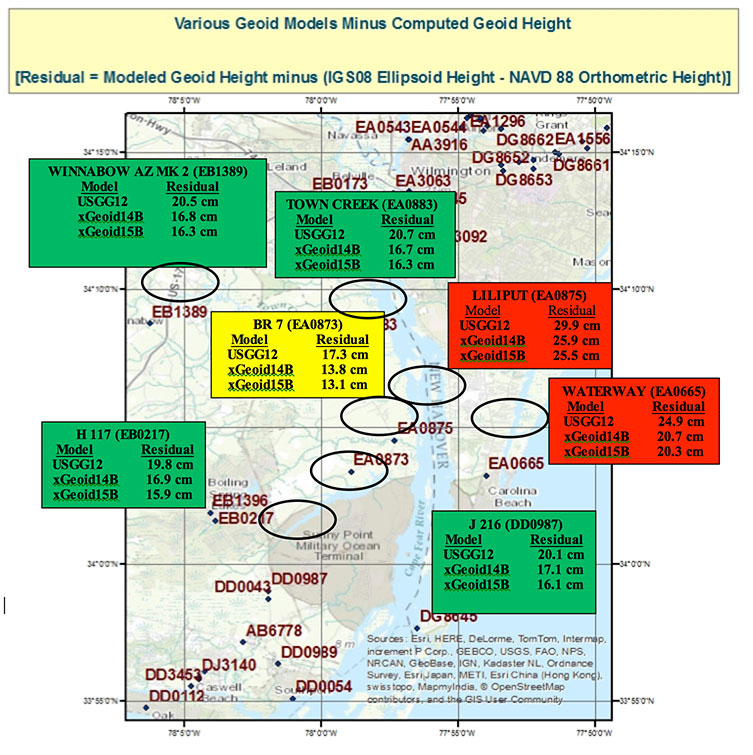
Next, let’s look at the differences using the experimental geoid models which are not distorted to be consistent with the NAVD 88 published heights. There will be a bias and a tilt between the systems but in this small areal extent the tilt should not be significant to our analysis. The bias can be removed by looking at relative differences between stations. Table 2, titled “Geoid Height Values for Various NGS Models using xGeoid15 Web Tool,” provides the modeled geoid height minus the computed geoid height where N (Computed Geoid Height) = [h (IGS08 Ellipsoid Height) – H (NAVD 88 Orthometric Height)]. Figure 2, titled “Various Geoid Models minus Computed Geoid Height,” depicts the differences between the various experimental models and computed geoid heights.
Table 2. Geoid Height Values for Various NGS Models using xGeoid15 Web Tool.Figure 2. Various Geoid Models minus Computed Geoid Height.
What is important to note is that stations LILIPUT (EA0875) and WATERWAY (EA0665) seem to be outliers compared to the other stations in the area of study (red boxes on figure 2); and station B 7 (EA0873) seems to be consistent with its neighbors (yellow box on figure 2). For example, station LILIPUT (EA0875)’s residual using xGeoid15B is 25.5 cm and station BR 7 (EA0873)’s residual using xGeoid15B is 13.1 cm, a relative difference of 12.4 cm. Similarly, station TOWN CREEK (EA0883)’s residual using xGeoid15B is 16.3 cm and station BR 7’s residual is 13.1 cm, a relative difference of only 3.2 cm. In my opinion, station LILIPUT (EA0875) needs to be investigated to determine if it has moved since it was last surveyed. In addition, stations east of LILIPUT (EA0875) such as WATERWAY (EA0665) should also be investigated for an ellipsoid and/or orthometric height issue. As previously mentioned, it is also important to note that station BR7 (EA0873), the box in yellow, appears to be consistent to the 3 cm level with its westerly neighboring stations (the boxes in green). This is important to note because the hybrid geoid model could be significantly difference around stations LILIPUT and BR 7 if station LILIPUT was not used in the development of the hybrid geoid model. I am not suggesting that NGS did anything incorrect by including these stations. The goal of the hybrid geoid model is to be consistent with published NAVD 88 values. Unless there is enough information to determine that a station has moved since the last time it was surveyed, the station should be included in the hybrid model. This is where the user may be able to help NGS. If users would investigate outliers like LILIPUT and BR 7 and provide new GNSS survey data and/or leveling data, NGS may have the appropriate information to determine if the monument should be included in the hybrid model.
Part 2 in this Survey Scene series discussed procedures which need to be followed to detect, reduce, and/or eliminate error sources to estimate accurate GNSS-derived ellipsoid heights. This column, Part 3, discussed why a user should understand the differences between NGS’ scientific gravimetric geoid model and hybrid geoid models, and why it is important to use both types of geoid models in their analysis. It demonstrated how to use these geoid models and ellipsoid heights to identify potential issues with published NAVD 88 heights.
My next newsletter column will focus on analyzing the NAVD88 orthometric heights in this area. It will provide basic procedures for validating NAVD 88 height constraints used to estimate GNSS-derived orthometric heights.
The Trimble R1 GNSS receiver is now available for collecting professional-grade GPS data with Esri’s Collector for ArcGIS. The GNSS receiver is rugged certified MIL-STD-810, IP65 rated, compact, and lightweight and provides professional-grade positioning information to iOS, Android or Windows mobile handhelds, smartphones and tablets using Bluetooth connectivity for Bring Your Own Device (BYOD) capabilities.
“We’re very pleased that Esri will distribute the R1 GNSS receiver to its customers,” said Ron Bisio, general manager of Surveying and Geospatial at Trimble. “Offering a complete, integrated solution that provides accurate data collection enables Esri and Trimble’s joint customers to build a better and more reliable asset inventory.”
Some users of Collector for ArcGIS on consumer-grade mobile devices might find their GPS to be less accurate than they need it to be. Now the locational precision of mobile devices can be enhanced via Bluetooth connected to the Trimble R1 GNSS receiver. The receiver is capable of supporting multiple global satellite constellation systems, including GPS, GLONASS, Galileo and BeiDou, and delivers GNSS positions in real time without the need for postprocessing.
“Collector for ArcGIS is used by organizations to collect and update GIS data in the field,” said Esri product manager Jeff Shaner. “Many of our customers like the ease of use of Collector for ArcGIS on consumer handheld devices. Paired with the Trimble R1 GNSS receiver, users can now capture GIS data on their smartphones and tablets that meets the more stringent spatial accuracy requirements of their organization.”
Designed for GIS professionals in a variety of organizations, the stand-alone Bluetooth Trimble R1 GNSS receiver enables users to collect high-accuracy location data with Collector for ArcGIS on an existing device — whether it’s a modern smart device, such as a mobile phone or tablet, or a traditional integrated data collection handheld or tablet. The receiver can be pole mounted, carried in a vest pocket, or attached to a belt using the optional belt pouch for ease of use.
The Trimble R1 GNSS receiver is available now through Esri. Learn more about Esri’s hardware solutions at esri.com/hardware.
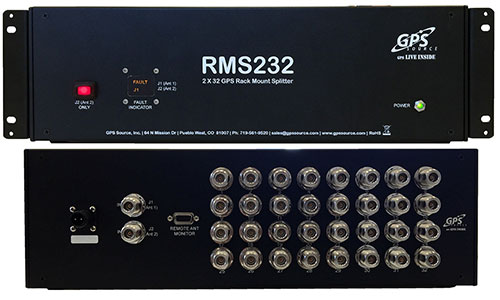
GPS Source has released a GPS/GNSS rackmount splitter with dual antenna inputs and antenna health monitoring. Developed for the wireless industry, the dual-input splitter provides a GPS timing signal to up to 32 GPS/GNSS synchronization modules and receivers. Its design ensures the GPS timing signal is always available, even in the event of an antenna or cable failure, the company said.
Like GPS Source’s GPS rackmount splitters, the new rackmount splitter amplifies and splits the GPS/GNSS signal. However, the new splitter also includes dual GPS antenna input ports, a health monitor and sensor switch. Up to 32 GPS/GNSS receivers or timing synchronization modules can access the signal at one time. Antenna redundancy is acquired through the use of primary and backup antennas. The sensor monitors the health of the primary antenna connected to the splitter. Based on the information provided by the sensor, the splitter will automatically switch antennas. The ability of the splitter to switch antennas allows all connected GPS devices to remain fully functional in the event of an antenna failure, which is important in today’s wireless environment.
“The demand for high-speed wireless internet and data network access over a wide area has grown at a record pace,” said Robert Horton, CEO of GPS Source. “This growth has led to a strong demand for solutions that support more than one function because of limited space and increased usage. The new rackmount splitters, RMS216 and RMS232, will keep multiple timing synchronization modules operating for an extended period when a GPS antenna or cable fails. This extended period gives a solution provider supporting a cell site, base station, or DAS network, the ability to identify and fix any GPS/GNSS antenna or cable problem before other challenges arise.”
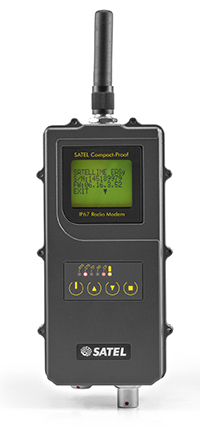
Satel’s new UHF radio data modem Compact-Proof, designed for outdoor measurement applications, features autonomous rechargeable battery power and a robust housing with IP67 protection.
Compact-Proof from Satel gives users double advantages with a powerful lithium-ion battery and the EASy radio data technology including a display and a robust housing with IP67 protection, the company said. With transmitting power of 1,000 mW, it can be operated fully autonomously as a repeater station in the field for more than 15 hours. The power can also be supplied parallel via an external rechargeable battery with a solar panel; alternatively, the Compact-Proof can be recharged overnight, and within five hours it is ready for the next work day.
The user-friendly installation, robust IP67 housing and 4-pin and 8-pin ODU connections make the new radio data modem Compact-Proof attractive for measurement applications, Satel said. The device features all functions of the Satel radio data modems EASy and 3AS and is 100 percent compatible with these solutions.
In addition, it supports the radio protocols of Pacific Crest, Trimble and other GNSS providers, which expands the areas of application.
Whether in the rainforests of Vietnam or in the Arctic, the temperature range of -30°C to +65°C and the frequency ranges of 330 MHz…420 MHz and 403 MHz…473 MHz make the Compact-Proof a reliable partner for all outdoor applications, Satel said. The housing features a robust, compact design with a display and foil keyboard.
As a light version — without an internal battery — the device offers numerous advantages for outdoor applications and even withstands the harsh conditions of machine control environments, for example.
In Germany, radio data transmission solutions from Satel are distributed exclusively by systems provider Welotec.
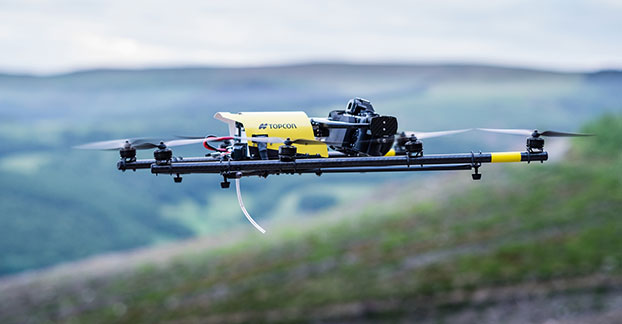
Topcon Positioning Group has added a rotary-wing unmanned aerial system (UAS) to its mass data-collection solutions line. The Falcon 8 — powered by Ascending Technologies — is designed for inspection and monitoring, as well as survey and mapping applications.
“Rotary-wing systems provide the perfect solutions for small-scale sites and projects for which flexibility of takeoff and landing or an oblique perspective is required,” said Charles Rihner, vice president of the Topcon GeoPositioning Solutions Group. “The Falcon 8 offers the flexibility to maneuver in small spaces and can cope with challenging environments often presented in inspection and monitoring. It is also well suited for smaller mapping or modeling projects up to 85 acres that require high-resolution imaging.”
The Falcon 8 features new AscTec Trinity technology, an autopilot safety feature that provides three levels of redundancy for protection against performance drop or loss of control. Three IMUs (inertial measurement system) synchronize all sensing data and identify, signal and compensate when needed.
Two models are available — the GeoEXPERT for surveying, modeling and mapping projects, and InspectionPRO for industrial inspection and monitoring applications. The GeoEXPERT includes a HD RGB camera payload, while the InspectionPRO features an HD RGB camera and infrared sensor combination.
“Both versions offer easy deployment and operation with real-time video and data monitoring capability, navigation software for planning and optimizing flights, as well as photo-tagging and desktop software to quickly generate high-quality and easy-to-edit material,” said Rihner.
The Falcon 8 complements the Topcon Sirius Pro fixed-wing UAS, providing large area accurate mapping without the requirement for traditional ground control.
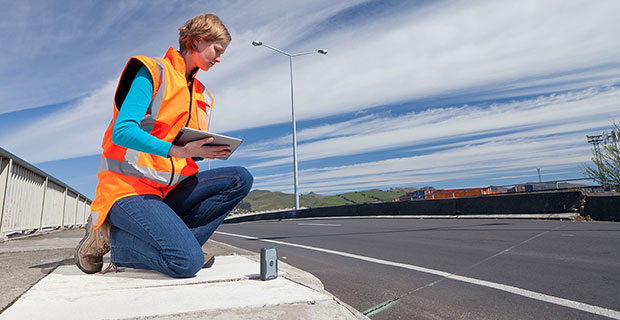
BYOD Sub-Meter Positioning for Mapping and GIS Professionals
Employees bringing their own mobile phones and tablets to their jobs in the field enables them to complete more tasks using fewer devices. However, this practice introduces operational and security vulnerabilities.
By Matt van Doorn
In the mapping and GIS industries, mobile devices such as smart phones and tablets have a growing presence in the field; they enable businesses to work smarter and more efficiently. The Bring Your Own Device (BYOD) trend — essentially the use of commercial-grade devices for work purposes — will likely not slow down. BYOD is not without its pain points. Organizations face many security vulnerabilities when commercial-grade devices access critical data via corporate IT networks. Additionally, there are applications where a mobile device’s location capabilities are not accurate enough for GIS professionals to efficiently and effectively locate an asset and collect data.
Company IT departments have multiple options that control and monitor access to combat BYOD security issues; however these options do not resolve the accuracy issue. Traditional company-issued handheld integrated receivers for data collection are designed to meet accuracy demands in almost any physical environment condition. While these devices are the most appropriate technology option for some applications, they tend to be expensive for the positioning tasks where a smart phone or mobile device is “good enough.”
What to do when better accuracy on a mobile device is required, but it doesn’t make sense to invest thousands of dollars in a traditional receiver? With proper research, field professionals will find professional solutions that pair with consumer-grade smart devices to produce the requisite accuracy for a fraction of the cost of a traditional receiver.
Requirements and Accuracy
At a minimum, handheld receivers destined to work in conjunction with mobile devices must meet the following requirements:
The device must have moisture ingress protection to function properly in snow, ice, rain or dust environments.
The device must survive falls in hard terrain. It should have shock, drop and vibration protection.
The device must last the full workday for the professional to complete all workflows on a single battery charge.
Legacy company-owned receivers typically meet the requirements above and have had a long-term reputation for accurately providing positioning data. These devices are still the appropriate solution for environments where it does not make sense to take a smart device, such as a remote location in rough terrain where the smart device may not perform.
However, a smart device can in many cases enable the employee to be more efficient. Thanks to the accessory market, many of the above-listed requirements can be easily addressed. For example, smart-phone juice packs can fix the battery longevity issue; cases can protect against weather, shock or dropping; and screen covers can address the sunlight screen visibility issue. With a smart device in hand, GIS and mapping professionals not only have access to GPS data, but they are able to access and complete other work-related tasks from the same device such as email, internet access and voicemail. Plus, a smart phone is only a fraction of the cost of traditional receivers.
The most critical component that smart devices still cannot address is sub-meter accuracy, which many mapping and GIS professionals require to successfully do their job.
Accuracy Drives Cost. Mapping and GIS businesses are acutely aware of the efficiencies created by greater accuracy. With poor information, errors become increasingly costly. When robust, accurate data is collected, there is a direct correlation to improved workflows and operations. This allows professionals to be more strategic in ensuring that applications are effective and efficient across operations.
Aerial and satellite imagery made initial steps toward generating more accurate data collection, bringing mapping and GIS professionals to within a 50-centimeter range of the assets. Subsequently, high-speed lidar collection tools, designed to capture large areas at 5–10 cm accuracy, came to the market. While these tools significantly improved data collection, precise measurement typically requires more time, more expense and highly specific instruments in order to generate more data.
Today, handheld receivers can achieve high accuracy without using survey-grade tools, in applications that include:
Mapping: Any application, including locations, quantities, densities, specific areas and map change.
Aquatic monitoring
Buried utility infrastructure/cable location
Water/wastewater disposal
Location and elevation measurements: for example, elevation data on manholes or trunk lines.
Requirements vary across applications and industries. The mapping/GIS professional must determine the level of accuracy their workflow requires.
Accuracy Evaluation
A typical smart device, properly assisted, can achieve an accuracy range of up to 5–6 meters when used to locate an asset. In many cases this is good enough. To obtain positioning data, iOS devices use the application “Location Services,” which is available on multiple mobile platforms. Location Services enables location-based apps and other applications to use information from GPS and cellular and Wi-Fi networks to determine location information. The location provided by a hybrid system with cellular-assisted GPS (A-GPS) allows the device to identify location within a 5–6 meter range of an asset. Wi-Fi positioning alone can determine a location with an accuracy of about 74 meters, and cellular positioning alone offers about a 600-meter range for location, according to industry sources (www.windowscentral.com/gps-vs-agps-quick-tutorial).
However, cellular positioning can be limited when there is no network available. In remote or industrial settings, this could create difficulties in asset location. In water/wastewater, for example, when a GIS professional is in a ditch looking for a valve or a meter and there isn’t a network connection, the accuracy level provided without GPS may not be sufficient for that application. When A-GPS is not available due to a lack of cellular network, GIS professionals also have to deal with convergence time.
Another example involves searching for a manhole cover when the ground is covered by a couple feet of snow. In this case, the 5-6 meter range is quite large and could lead to a lot of time spent digging until the manhole is uncovered. This wastes time and energy, and leads to higher costs. Some receivers have the sub-meter capability and can provide the location data directly to the professional’s consumer-grade smart device through Bluetooth. By simply pairing the receiver with a cellphone, the GIS professional can quickly locate the asset, collect data and move on to the next task.
Accuracy Solutions
Location shortcomings in consumer-grade devices generally boil down to antenna performance. Consumer-grade smart devices are designed for exactly that: consumers. With antennas for Wi-Fi, Bluetooth and GPS built into the small device, there will be compromises in location accuracy. When location must be pinpointed, an integrated handheld receiver can enhance accuracy. Receivers are readily available with 12 channels parallel tracking. Some receivers can also support multiple satellite constellations, including GPS, GLONASS, Galileo, Beidou, and QZSS with up to 44 channels of parallel tracking. The accuracy of these devices is further supported by augmentation: WAAS, EGNOS, MSAS and GAGAN. These receivers can provide sub-meter accuracy, with asset location with as close as 60 centimeters. Some devices also support Virtual Reference Stations (VRS) and Trimble’s Real Time eXtended (RTX) correction service for sub-meter accuracy. Some RTX services achieve real-time sub-meter accuracy with IP and cellular connectivity, or over satellite L-band.
A receiver that integrates with the workflows of various mapping and GIS softwares as well as third-party applications will pair up nicely with a mobile device. The computations are all done for the professional, and will transmit signals via Bluetooth into the host devices using NMEA protocol. On iOS and Android devices, the location is available through the Location Services API. Third-party applications are also able to work with the receiver through consumer-grade devices that utilize the location services API. Some receivers are available across operating systems including iOS, Android and Windows, and are available to upgrade to the latest smart device whenever needed.
Important Device Attributes
Receivers designed to be compatible with a variety of smart devices can be shared among multiple devices. When it is time for a smart device upgrade, the new device can easily integrate with the receiver. Additional features that make these receivers especially convenient to use in the field include:
Small size: Mapping and GIS professionals don’t always have an extra hand available to carry an extra device. If it can fit in a vest, jacket pocket, pouch, clipped onto a belt, or pole mounted it will function in many scenarios.
Lightweight.
Rugged: Some receivers comply with MIL-STD-810 ruggedness with IP65 rating for shock, drop and vibration.
Battery life: for field performance for a full work day.
External antenna port: An accessory port for external data if the collecor needs to be mounted on top of a vehicle, or in a hard hat situation; a bonus feature worth consideration.
BYOD Trend and Limitations
The smart-device market will not cool down anytime soon. Gartner Research predicts that in 2015, almost 2.3 billion devices will be shipped worldwide. Whether these smart devices are provided by the company or truly BYOD, they will need to be augmented to effectively serve the applications they are intended to support. Solving the security issue can have a bearing on whether a company chooses to let employees use their own device or provide one; either way, enhancing the location capabilities of the device can be easily achieved with accurate receivers.
Matt van Doorn is a product management, product marketing, market management and business development professional at Trimble Navigation. He has years of experience in the data communication and telecommunication industry with deep knowledge of international markets.