Marine navigation company Savvy Navvy has developed an in-house approach to processing and reconciling fragmented hydrographic data — combining official hydrographic data with expert geospatial data analysis to scale chart coverage faster and with greater accuracy.
The latest rollout adds more than 2,200 U.S. lakes and extends coverage into Estonia, Lithuania and Latvia in Europe, opening more waterways for boaters across the globe to explore. This comes not long after Danish charts from hydrographic offices were also added to the navigation app.
Prioritized by where boaters are most active, the latest update includes all major Minnesota lakes and expands lake coverage in 20 other U.S. states.
Elena Petru. (Credit: Savvy Navvy)
“Land mapping across much of the developed world, has benefited from sustained investment over several decades. Hydrographic data, the mapping of water, has a different history,” explained Elena Petru, geospatial data engineer at Savvy Navvy. “Survey cycles are longer, coverage is uneven, and for inland waters like lakes and reservoirs the situation is patchier still.
“Multiple authorities may hold overlapping or conflicting data for the same body of water, formats vary, and there is no single canonical source that can simply be downloaded and trusted. This fragmentation is exactly the challenge our geospatial team is solving through a structured reconciliation process.”
Petru joined Savvy Navvy in 2023, bringing her geomatics background from land data roles into the specific challenges of marine and inland water charting. Her expertise has enabled development of new data pipelines to overcome these marine charting challenges — marking a significant step in Savvy Navvy’s ongoing chart development program being based on unique, comprehensive data.
“You’d be surprised how often official sources do not fully line up. One of the main challenges is that the same lake can be represented slightly differently depending on the dataset. The task was not to pick one and apply it, but to compare sources carefully, understand where they differed, and make informed decisions about how each lake should be represented,” Petru said. “By going beyond official sources with our own expert validation process, we can integrate new regions faster while maintaining high data integrity, which overcomes one of the biggest difficulties in marine navigation. It’s exciting to see this data go live in the Savvy Navvy app knowing boaters can now use it on the water every day.
This approach forms part of Savvy Navvy’s broader data processing pipeline, enabling consistent, repeatable expansion into new regions. Through these data pipelines we can now deliver faster, more expansive chart coverage including waters not yet fully covered by official hydrographic surveys.
Savvy Navvy has been downloaded more than three million times globally. Unlike other boating navigation solutions, Savvy Navvy provides smart routing, giving users optimal routes and dynamic ETAs based on real-time data: departure time, chart information, weather conditions, tide, boat specifications and local regulations. The updated chart coverage is available across both the Savvy Navvy app and its integrated solutions.
Last month Savvy Navvy launched its new waves feature, turning complex wave data into a simple visual view that helps boaters understand how conditions will actually feel on the water. Worldwide chart coverage is available on all Savvy Navvy plans.
Without hesitation, the family awakened from their sleep, grabbed wallets, smartphones, car keys and hurriedly descended the stairs into the shelter. Doors sealed, the children crawled into their shelter beds.
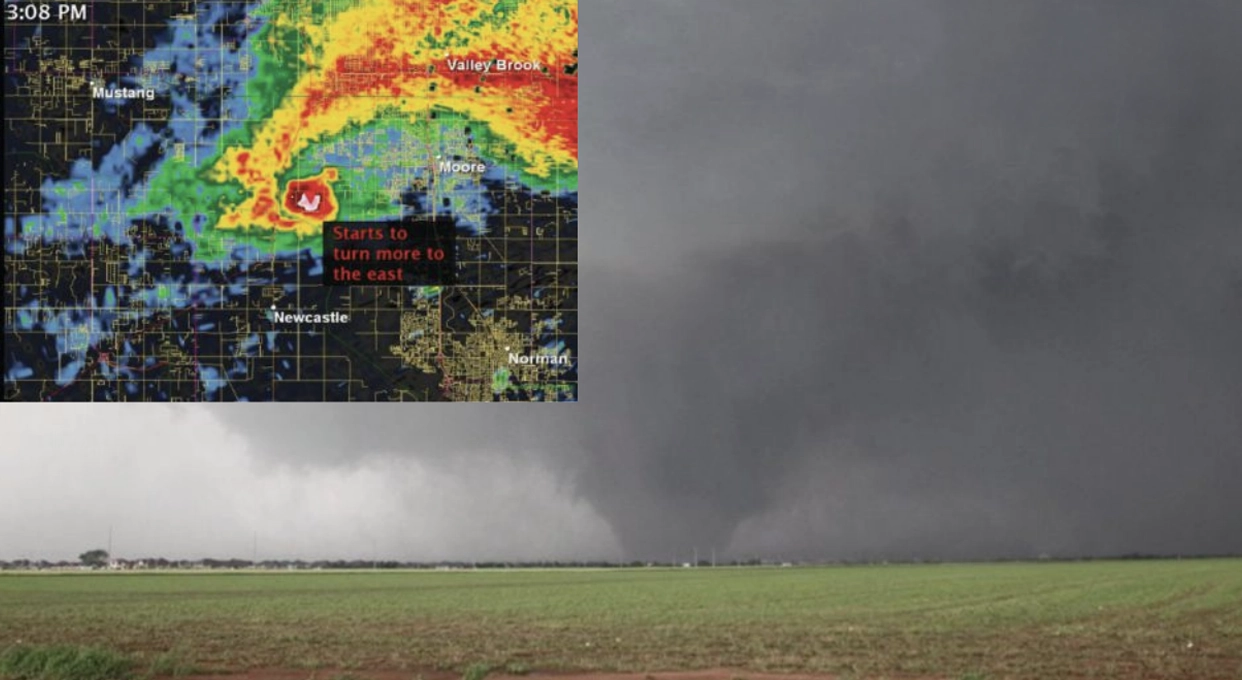
The mother and father, listening to the weather radio, heard their county’s name in the emergency broadcast. They looked at the smartphone’s weather map blinking with the text alert. A large swath of rain covered the area, painting yellows and reds inside a field of green. At the trailing edge of the storm, where skies were beginning to clear, the storm’s red tail began curling into a ball, moving directly toward them. Inside the ball, a dark red deepened into a growing magenta core. White pixels appeared within the magenta tail. Its path was unchanged and it was closing.
The man and woman huddled together watching the storm radar app on his mobile device not thinking about how their situational awareness is a confluence of spatial wizardry and atmospheric thermodynamics. The WSR-88D NEXRAD (Level III) radar scans a 143-mile radius, sweeping 14 elevation angles every five minutes to create a composite view of the surrounding weather. Colors correspond to the intensity of reflected hydrometeors (forms of precipitation) ranging from 0 dBZ, light rain in blue and green, to 75 dBZ, hail in magenta, and at 95 dBZ, it is physical debris carried aloft showing as white. Assembling the radars from across the country creates a seamless national weather mosaic (weather.gov/Radar). The dot on the smartphone’s weather app marking their own position is GNSS, orbiting far above.
In his hand both the NEXRAD and GNSS are blended in real-time as he watches the Tornado Vortex Signature (TVS) move toward his family and his house. Beyond the closed shelter doors, tornado sirens wail, mixed with peals of thunder. The warnings are no longer county names but names of towns. There are people for whom such a moment is not hypothetical. Scott Bagenzie knows exactly what comes next, not from imagination but from experience.
On Monday, May 20, 2013, at 2:56 p.m. Central Time, an EF5 tornado touched down northwest of Newcastle, Oklahoma, rapidly intensifying as it carved a path to Moore. The tornado lasted 36 minutes and covered 17 miles (FIGURE 1). Scott was caught by it, and I had the privilege of hearing him tell me what it is actually like to be inside those moments of sheer terror the rest of us only read about. He left work at 2:15 p.m. despite National Weather Service warnings for the counties flanking Oklahoma City. As he closed his car door, the sirens at the Mike Monroney Aeronautical Center went off. Security tried stopping him. He drove anyway.
“I was dodging cars left and right as people were taking pictures out to the southwest. I called Mari and said, hey, I’m running to the house to make sure the pets are taken care of. And she said, You crazy ***, take care of yourself.”
He pulled into his driveway, secured two cats in the closet and the dogs in the front bathroom, then stepped outside to see where the tornado was. His neighbor, who had an underground shelter in his garage, called out from next door: Get in over here! Scott went. As soon as the latch clicked behind them, debris began hitting the house above.
Weather as GIS
Weather is the most common topic of greetings. It is often the front page on newspapers. Television news is incomplete without a weather report, and weather is among the most downloaded apps on smartphones.
In many ways, the first GIS was weather, starting in the mid-1800s, long before computers, GNSS and GPS, hand-plotting data points, and then hand-drawing lines of equal pressure, temperature, humidity and winds on charts.
In the 1990s as a U.S. Navy weather specialist, I drew these charts by hand, plus four upper air charts learning how 3D spatial volumes interact. That was manual GIS. Now, in 2026, weather continues leading geospatial innovation via phased array radars, dual-pole radars (horizontal and vertical scans), acoustic atmospheric sensors, and predictive modeling for weather and climate, all of them layering atmospheric data using complex algorithms to forecast a dynamic fluid medium moving over an irregular spinning sphere that is unevenly heated. It is remarkably accurate, pushing the edges of geospatial predictive modeling.
The architecture of violence
The primary driver of powerful tornadoes is atmospheric thermodynamics unique to North America. Dry air crossing over the Rockies, cold arctic air pulled south by the jet stream, and warm moist air drawn north from the Gulf of America converge in a cauldron that can boil a normal convective storm into a sustained mesoscale supercell producing EF-5 tornadoes, the most powerful on record. Even though they make up less than one percent of all tornadoes, it is rare for EF5 tornados to occur anywhere else on Earth.
The Enhanced Fujita (EF) scale for measuring them was developed in 1971 by Theodore Fujita, a Japanese engineer whose forensic study of atomic bomb blast damage at Nagasaki and Hiroshima led to his damage-based framework for measuring tornado intensity.
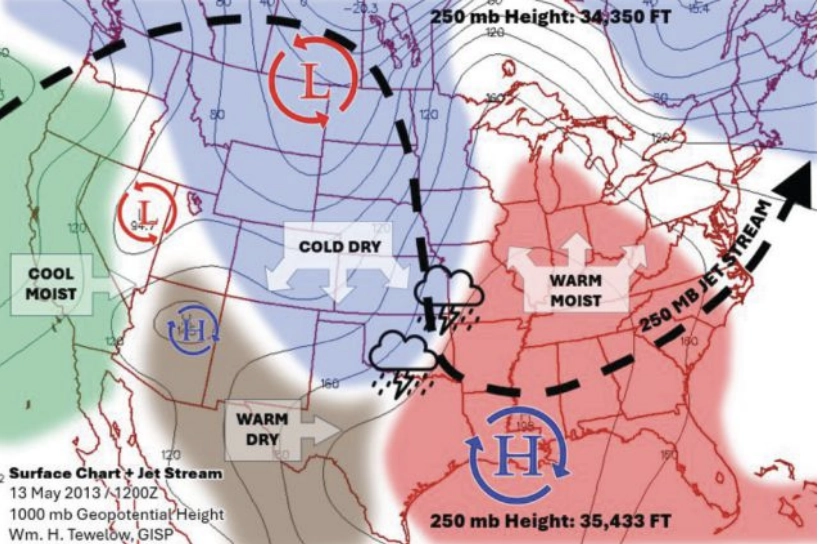
FIGURE 2 This NOAA chart shows a height of 250 millibars (mb) of pressure over Tornado Alley in the U.S. (Credit: William Tewelow | Chart from NOAA NWS)
The jet stream, a river of air riding a thermal pressure gradient in the upper atmosphere, creates vorticity as cold dense arctic air plummets south, wedging beneath the warmer Gulf air and forcing it upward along the frontal boundary, before the jet stream curves back north. FIGURE 2, the 300 mb (mb stands for millibars of pressure) chart, shows this process has caused a low pressure over Texas sitting in a 1,200-foot-deep ravine. A jet streak will form as air rushes into the ravine increasing the jet stream’s speed, which draws in rising convection currents that can spawn mesoscale storm cells and set up the potential genesis of severe tornadoes.
When a funnel cloud forms, it is the visible physics of pressure dropping the temperature to the dew point causing condensation. The dropping pressure forms a bowl shape. Air flows into the dropping pressure, and the base of the cloud rotates cyclonically. As the rotation increases, centrifugal force of the colder dense rotating air pushes out the warmer higher-pressure air, further lowering the pressure at the core and deepening the bowl. That continues as the base descends into higher pressures at the surface, tightening the bowl into a cone. The difference in pressure between air outside the cone and what’s inside the vortex core can be 100 mb. That is basically a hole and wind rushes in to fill that void, but centrifugal force acts against the air. A tornado is born.
Wraiths of destruction
On May 31, 2013, 11 days after Moore, a multiple-vortex tornado formed near El Reno, Oklahoma. Along its periphery, small vortices spun around the rotating edge, circling, combining, breaking apart, vanishing and reforming, like wraiths of destruction dancing in a ring. The column darkened, descended and enveloped its own micro-vortices, forming the largest tornado ever recorded: 2.6 miles wide at its base.
It grew so rapidly that experienced TWISTEX storm chasers attempting to place instrument disks behind it were consumed as it expanded from 1.6 miles to 2.6 miles wide. A father, his son, and a colleague were killed; their car was found eight miles away.
Storm chasers are not thrill-seekers. WSR-88D NEXRAD, even at its lowest scan angle, already sits at 14,000 ft at its range limit because of the Earth’s curvature; spotters provide the ground truth radar cannot. Instruments such as Ground-based Local Infrasound Data Acquisition (GLINDA) extend that capability further: Tornadoes produce infrasound as low as 0.5 Hz, with a correlation between tornado size and frequency that may one day provide an early warning radar cannot.
I asked Scott whether he felt the tornado before he heard it.
“I couldn’t feel it,” he said, “but I could hear the sound of the train coming.”
I pressed him to describe it beyond the cliché. He thought for a moment, then said, “It’s not a cliché. That is what it sounds like. It sounds like a freight train, and the sound of the house being torn apart.”
The roar grows
Back in the shelter, the physics unfolded exactly as Scott described. Unaware of the sensation, a deep groaning sound resonates miles ahead of the tornado. A low constant roar grows louder as it approaches. Explosions pop as transformers blow. The shelter is pitch black except for the phone screen, that small glowing window showing a white ball of catastrophe moving toward them. The roar grows louder. Ears pop. Temperature drops. The house shakes. The roar of the freight train is so loud the screams inside the shelter cannot be heard. The doors rattle. The whirlwind is trying to break in. Then the roar fades, almost to silence, an eerie quiet.
In Scott’s shelter, the sequence was identical. His ears popped suddenly and painfully; they hurt for a full day afterward. In an EF5 tornado, pressure drops from roughly 950 mb in the surrounding air to 850 mb at the vortex core. The 100 mb passing over him was equal to a 3,000-ft pressure drop. It is the equivalent of instantly ascending two Empire State buildings stacked on top of each other, like falling straight up into the sky. Fighting against that force, Scott and his neighbor held shut the shelter latch as the doors bounced on their hinges.
“I don’t know how well those are constructed. I didn’t take any chances.”
Nearby, employees sheltering in a bank vault were physically holding the vault door closed as the tornado passed a thousand feet away. The vault’s timed lock could not engage. Five or six people leaned against a door designed to stop a robbery, fighting powerful thermodynamic forces.
Then Scott no longer had to hold the latch. The truck on the other side of the garage wall had been pushed against the hatch from outside, pinning them in. When they finally forced it open and stepped out. There was nothing.
“She just started screaming. She said, ‘No way, it didn’t do that.’ I told her, yeah, there’s nothing left.”
The entire event, from first debris strike to silence, lasted roughly one minute. At 28 miles per hour, a tornado traverses one mile in two minutes, plowing through a neighborhood in seconds.
Mapping the aftermath
The question the rest of us ask from a safer distance is: What is the true pattern of destruction across time and geography? To answer it, I built a Tornado Severity Index (TSI) using National Weather Service tornado data. On average, there are 970 tornadoes per year, 81% are EF0 and EF1; 18% are EF2 and EF3; and the catastrophic EF4 and EF5 make up 1%.
The NWS database reports the start and end coordinates, path width, magnitude, fatalities, injuries, and damages to property and crops. Working with the coordinate pairs, I calculated the distance and radial bearing of each path. But the EF scale alone tells only part of the story: A powerful tornado crossing an empty field and a moderate tornado crossing a dense neighborhood are not equivalent human events.
I did not want the TSI to be another version of the EF scale, so the weighting was based entirely on the human toll. The formula is total fatalities (F) at 100% plus injuries (I) at 10%, =F + (I x 0.1) and normalized on a scale of 1 to 100. Economic damage was originally part of the equation, but the data are inconsistent and unreliable across reporting jurisdictions.
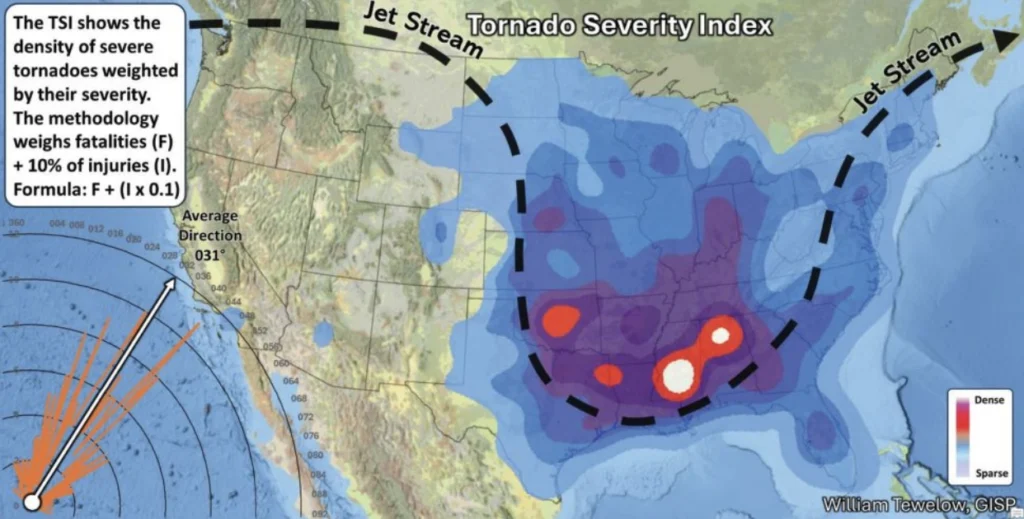
FIGURE 3 The Tornado Severity Index (TSI) takes the human cost into account. (Credit: William Tewelow)
The resulting composite doesn’t measure the strength of tornadoes, but rather their human impact (see FIGURE 3). The dataset of tornadoes from 1950 to 2024 is 71,813. Filtering it down to those tornadoes that had a human consequence where the TSI>1 reduced it to 2,362 tornadoes. I reduced it further to 1,625 including only those with one or more fatalities. This was made into a heatmap. The data were further reduced to 301, only filtering out all except where TSI>10. The heatmap color scale was weighted to the TSI Score. It shows where the highest concentration of intense tornadoes occurs.
The results confirm Tornado Alley from Texas up through Oklahoma, and it also reveals Dixie Alley, an even more destructive corridor of severe tornadoes over Mississippi, Alabama and Tennessee. These areas align with the deep spring meridional jet stream discussed earlier. The northern side of the jet stream enhances cyclonic flow for storms in the area. The peak region of vorticity is where the jet stream turns back north again over Dixie Alley. Additionally, the rising terrain in that area causes orographic lifting and more rain, many times hiding the tornadoes within the pouring rain.
GIS reveals what the physics predict: a narrow corridor of atmospheric geometry where conditions for catastrophic tornadoes are optimized, running through the same communities, year after year.
For the sake of context, the Joplin, Missouri tornado on May 22, 2011, that caused 158 fatalities, 1,150 injuries, and damages of $2.8 billion ranks at the top of the TSI. The Moore tornado only scored 16.6 due to far fewer fatalities.
The dataset reveals the physical signatures of severe tornadoes. On average, they peak in mid-May at 5:30 p.m. with a strength of EF4.2, carve a path 36 miles long and 2,073 feet wide, and each one causes 13 fatalities, 173 injuries, and losses of $71.5 million. Severe tornadoes do not travel west. They do travel a spectrum where most of them fall within a range from 016° to 060° with an average path of travel northeast at 031°. This is why Scott was right to question the reports of the El Reno tornado tracking southeast: What appeared to be southward motion was lateral growth. The tornado was not moving south; it was becoming enormous.
“Pretty much sucking everything up,” Scott said, with confidence born out of his experience.
The pattern and the person
The TSI heatmap is a record of moments like Scott’s, representing a convergence of humans caught up in brutal atmospheric physics, where air becomes violent. The science explains the experience. It cannot prevent the next EF5; the thermodynamics will prevail.
What GIS adds is pattern, memory and prediction. The TSI with directional analysis gives emergency managers, planners and underwriters insights for understanding where storm physics and humans intersect most acutely, and therefore where shelter codes and warning systems must be most robust.
The family in their shelter, watching the white dot approach on the glowing screen, is experiencing the culmination of decades of geospatial and meteorological investment: NEXRAD networks, GNSS constellations, real-time data fusion in a consumer app. But as Scott will tell you, the most important instrument was the steel latch on the shelter door, and what mattered most was the neighbor who held it open for him as the tornado approached.
Tornadoes are Earth’s thermodynamic engines of absolute chaos.
“I’m not interested in tornadoes,” Scott told me. “Once burnt, you don’t play with the matches anymore.”
Scott moved out of Oklahoma in 2013. The science is fascinating. People press right up to the edge of it, but the experience when science becomes personal is sheer terror.
Live tracking tornadoes with GIS census tracts can know in real-time the impact on populations to immediately begin rescue operations, clean-up and recovery.
GIS cannot capture the whirlwind, but it can track the most violent of them: northeast at 031°, seven football fields wide for 36 miles.
The market for mid- and high-precision GPS receivers is set to experience significant expansion in the coming years. Driven by evolving technologies and growing applications across various sectors, this market is attracting substantial attention, according to The Business Research Company.
The market size for mid- and high-level precision GPS receivers is expected to reach $6.85 billion by 2030, expanding at a compound annual growth rate (CAGR) of 12.2%. This robust growth over the forecast period is fueled by advancements in autonomous vehicle systems, expanding smart infrastructure projects, the rise of precision agriculture, increased use of highly accurate mapping solutions, and wider adoption of sophisticated GNSS correction services.
Important trends shaping the market include the pursuit of centimeter-level positioning accuracy, the integration of RTK and PPK technologies, use of multi-frequency signal processing, compatibility with survey software, and enhanced GNSS mapping precision.
The market features numerous influential companies, including Stonex Group Inc., Raytheon Technologies Corporation, Hexagon AB, Trimble Inc., Topcon Positioning Systems Inc., u-blox AG, Hi-Target Surveying Instrument Co. Ltd., CHC Navigation Technology Ltd., Carlson Systems Holdings Inc., Septentrio N.V., Hemisphere GNSS Inc., Javad GNSS Inc., Swift Navigation Inc., Thales Group, Geneq Inc., South Surveying & Mapping Technology Co. Ltd., Tersus GNSS Inc., Eos Positioning Systems Inc., NavtechGPS Inc., Satlab Geosolutions AB, Tallysman Wireless Inc., Leica Geosystems AG, NovAtel Inc., Spectra Precision, Unistrong Science & Technology Co. Ltd., and ComNav Technology Ltd.
Notably, in March 2023, Netherlands-based CNH Industrial N.V., a provider of agricultural and construction equipment as well as precision automation solutions, acquired Hemisphere GNSS for $175 million. This strategic move aims to combine Hemisphere’s high-precision GNSS receivers and satellite-based correction technologies with CNH’s capabilities to enhance machine control, autonomy, and positioning in both construction and agricultural sectors. Hemisphere GNSS, headquartered in the U.S., supplies advanced GNSS receivers, antennas, and correction services tailored for surveying, machine control, agriculture, and marine uses.
Top companies in this sector are actively launching new products to maintain competitive advantage.
For example, in October 2025, Unicore Communications Inc., a China-based GNSS technology provider, introduced the UM98XC Series-a next-generation, all-constellation, multi-frequency RTK GNSS module. Supporting GPS, BDS, Galileo, GLONASS, and QZSS systems along with L-Band and CLAS correction services, the UM98XC offers centimeter-level positioning accuracy. It also features advanced anti-jamming capabilities, energy-efficient design, and consistent performance in challenging environments, making it well-suited for autonomous driving, precision agriculture, unmanned aerial vehicles, and smart transportation sectors.
This launch underscores Unicore’s commitment to pushing the boundaries of GNSS precision, reliability, and scalability for industrial and automotive applications.
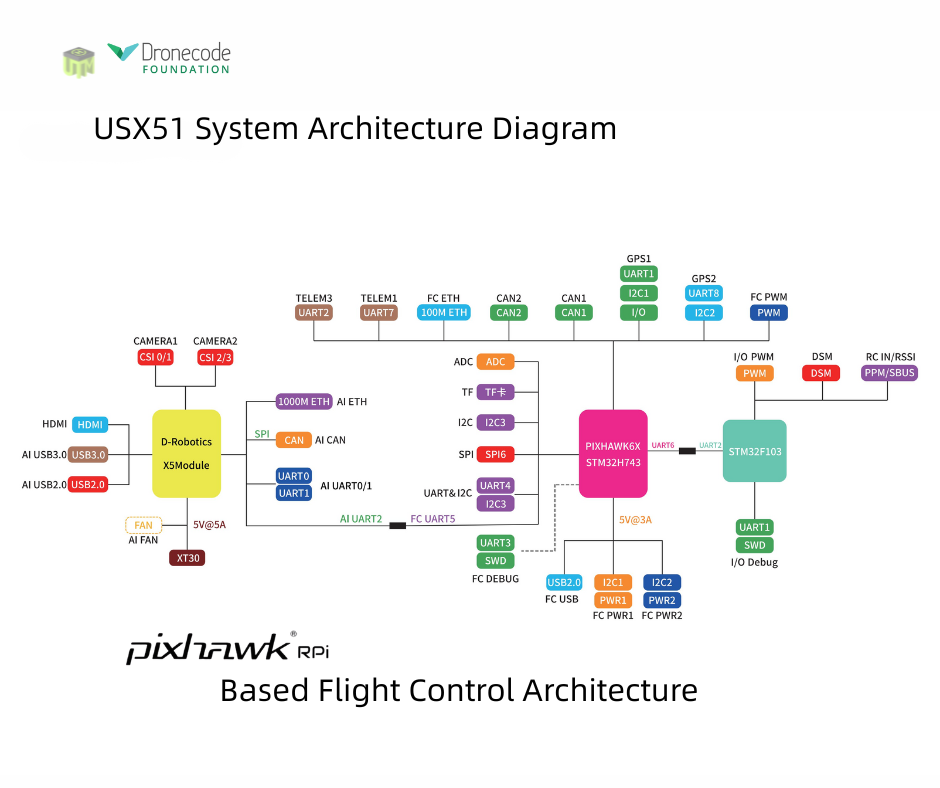
The USX51 Computing Power Flight Controller by UTMSYS is a system architecture that combines the Pixhawk 6X flight controller with the D Robotics RDK X5 edge-computing module.
According to the development team, the goal of the USX51 platform is not only to provide hardware, but to simplify complex UAV system integration for developers, research teams, and robotics engineers working on real world deployment scenarios.
The USX51 system integrates Pixhawk 6X and RDK X5 to support PX4-based UAV development for GNSS-denied, VTOL, and multi-sensor applications.
The system is designed to support PX4-based UAV development while separating real-time flight control tasks from high compute perception workloads. This decoupled architecture helps maintain flight stability while allowing developers to expand into vision based and autonomous applications.
The USX51 supports development scenarios including:
GNSS-denied navigation
VTOL mission platforms
Multi-sensor integration
Visual perception and tracking
ROS2-based robotics workflows
Research and autonomous UAV development
Credit: UTMSYS
The Pixhawk 6X handles flight critical control functions, while the RDK X5 module provides onboard computing capability for visual processing, sensor fusion, and autonomous related workloads.
The system also provides multiple communication interfaces including Ethernet, CAN, UART and I2C, allowing developers to integrate cameras, thermal modules, lidar systems, and additional peripherals into their UAV projects.
Current ecosystem development around USX51 includes PX4 integration, ROS2 workflows, developer testing programs, and community based project collaboration.
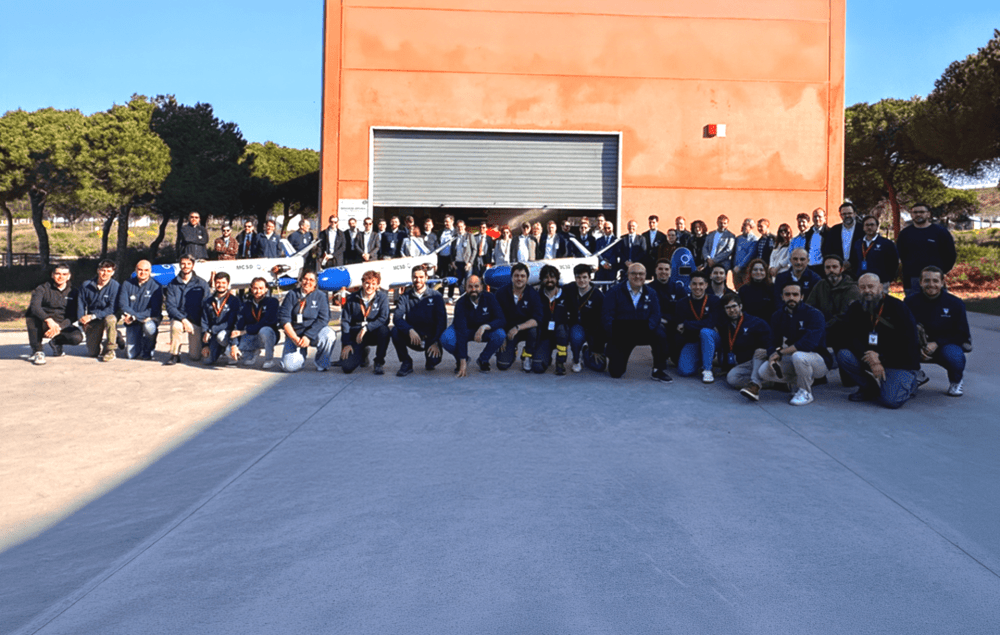
The UAV Navigation–Grupo Oesía flight control system, as a subcontractor to SATNUS, proved key to the success of the demonstration.
In March, the Spanish consortium SATNUS successfully completed the fourth flight demonstration campaign under Pillar 3 of the Next Generation Weapon System / Future Combat Air System (NGWS/FCAS) program, held at the INTA‑CEDEA facilities. The campaign comprised a total of nine flights aimed at verifying the flight control software dedicated to collaborative manned‑unmanned teaming (MUT) operations, led by SATNUS and developed in cooperation with international partners Airbus GmbH and MBDA, and integrated into the Next Generation Autonomy Computer (NGAC). During these tests, the remote carriers were represented by both real and simulated platforms of the manned‑unmanned teaming & common systems demonstrator (MCSD).
During the campaign, key MUT functionalities were demonstrated, including formation flight, evasive maneuvers, collaborative navigation, mission replanning and formation breakup, among other capabilities. Flights involved up to three real Remote Carriers operating simultaneously, supported by UAV Navigation–Grupo Oesía’s technological contribution in guidance, navigation and control (GNC) systems, which acted as a key enabler for the safe execution of the flight maneuvers carried out within the objectives defined by SATNUS under Pillar 3 of the NGWS/FCAS program.
The campaign concluded with the execution of flights 29, 30, and 31, in the presence of the Combined Project Team (CPT) and representatives from the National Program Offices of the three participating nations: Spain, France and Germany.
Engineering teams from all SATNUS partner companies, including members from UAV Navigation–Grupo Oesía, carried out highly specialized work to achieve this milestone, successfully meeting all established objectives. In this context, UAV Navigation–Grupo Oesía’s contribution supported the proper execution of operations and helped validate the capabilities demonstrated throughout the campaign.
SATNUS has expressed its appreciation for the support and trust of the Spanish Armed Forces and the Spanish Ministry of Defence throughout the entire process and will continue advancing the development of capabilities within other NGWS/FCAS-related programs.
The U.S. commercial drone industry is at an inflection point. After years of incremental progress, the FAA’s landmark Part 108 Beyond Visual Line of Sight (BVLOS) rule is expected to take effect later this year, unlocking a new era of scaled commercial drone operations across delivery, infrastructure inspection, public safety, perimeter protection and beyond. It’s a pivotal moment for drone operators to get ahead of the most significant regulatory shift the commercial drone industry has seen.
Today, AirData UAV announced it is joining the Commercial Drone Alliance (CDA), bringing its operational platform into the industry’s broadest coalition for drone policy and progress. As a member of the CDA, AirData will actively contribute to the policies and standards that will define the next chapter of the U.S. drone economy through the CDA.
Part 108 introduces sweeping new operational requirements across pre-, during and post-flight documentation, personnel roles, risk-categorized operational areas, and mandatory continuous data reporting, and AirData’s platform is already built to meet them.
“We are at a critical moment for the drone economy,” said Lisa Ellman, Chief Executive Officer of the Commercial Drone Alliance. “As the industry moves toward broader BVLOS operations and frameworks like Part 108, access to scalable, reliable operational data such as that which AirData provides will help to safely unlock the full potential of the drone economy.”
Credit: AirData UAV
AirData’s platform delivers the tools operators will need to meet Part 108’s requirements, including: checklists, automated compliance documentation, flight logging across every mission, and fleet-wide analytics that give program managers visibility into operational risk. With more than 61 million flights across 450,000 pilots and 850,000 drones globally, AirData has been building the compliance infrastructure the industry now needs.
As the industry’s leading policy advocate, the CDA has been central to advancing the regulatory frameworks. The CDA is an independent non-profit organization led by key members of the commercialdrone industry. It works to educate policymakers and the public on the safe integration of drones into the national airspace and to advocate for policies that enable commercial drone operations.
“We have long served as the intelligence backbone for drone operations,” Eran Steiner, CEO and founder of AirData UAV. “We look forward to leveraging our data, insights, and experience to enable scalable, compliant, and mission-critical drone programs, particularly as frameworks like Part 108 unlock the next phase of scaled BVLOS operations in the United States.”
AirData’s platform gives public safety agencies, enterprise operators, and drone programs of every size the maintenance documentation, pilot currency tracking, asset management, checklist discipline, and operational data history that regulators will expect when Part 108 takes effect.
The U.S. Federal Aviation Administration (FAA) has issued a proposed rule that would allow specific categories of critical infrastructure sites to apply for restrictions on drone operations around their facilities.
The restrictions would be submitted and approved via a new FAA web portal. Approval will be based on safety or security criteria. Sixteen sectors would be eligible for restrictions including energy production, transportation systems, chemical facilities, water treatment plants, and defense industrial complexes.
The rule would establish two types of restrictions:
Standard Unmanned Aircraft Flight Restriction (UAFR): A general restriction that bars unmanned aircraft operations within a specific boundary, except for operators who have previously met rigorous safety and security standards.
Special Unmanned Aircraft Flight Restriction (UAF): A much more severe restriction that bars unmanned aircraft operations within a specific boundary for all operators unless they have the express prior approval from both the FAA and the sponsoring agency (for example, the Department of Homeland Security).
The restricted area would have clearly defined horizontal and vertical boundaries. Violators could face civil or criminal penalties.
The rule would also allow site operator to contact law enforcement if a drone flew in a restricted area, after which authorities can use Remote ID to locate the control station or operator. Pilots could face license suspensions, revocations, fines and criminal charges for entering these no fly zones.
Drone operators are encouraged to check B4UFLY for the latest breakdown on where pilots can and cannot fly.
Additional Information:
Restriction criteria includes impacts to aviation safety, protecting people and property on the ground, national security, or homeland security.
The full list of eligible site categories are:
Chemical
Commercial
Communications
Critical manufacturing
Dams
Defense industrial base
Emergency services
Energy
Financial services
Food and agriculture
Government services and facilities
Healthcare and public health
Information technology
Nuclear reactors, materials, and waste
Transportation systems
Water and wastewater
The comment period on the proposed rule will run until July 5, 2026.
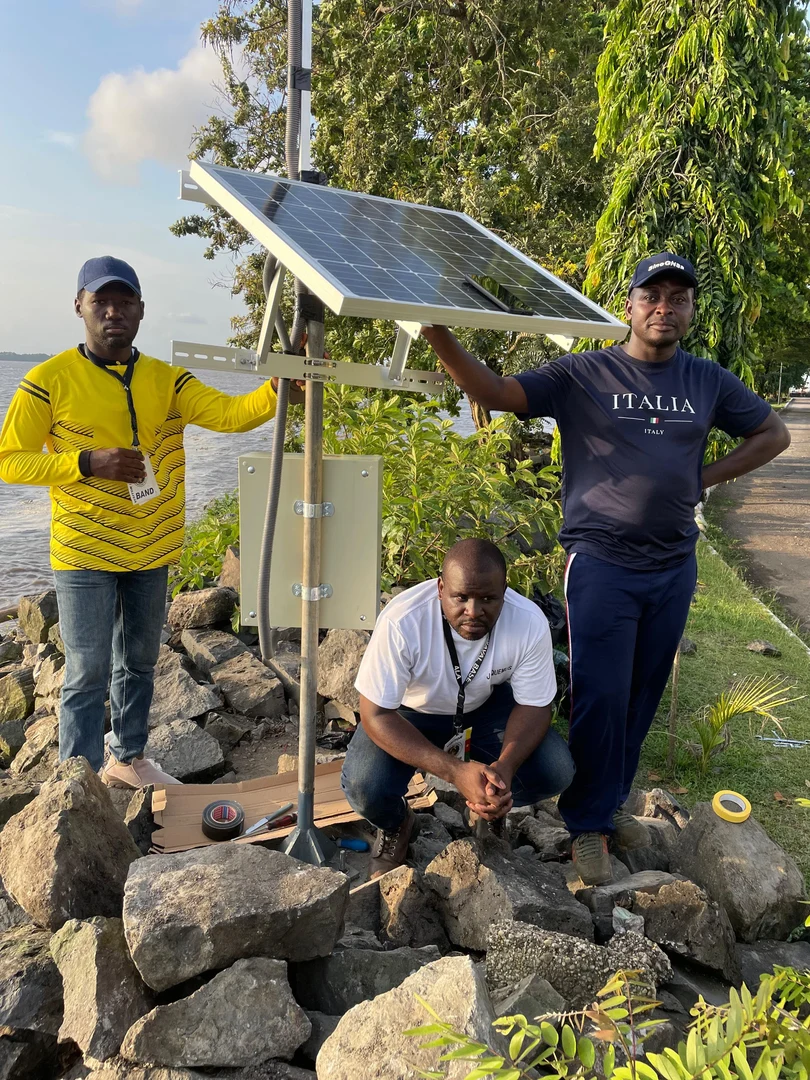
Cost-effective sensors from the University of Bonn are measuring water levels along rivers and coastlines in Africa and the Pacific region.
Using a low-cost sensor and GNSS Interferometric Reflectometry (GNSS-IR), river water levels can be monitored around the clock. The water-level data are automatically transmitted via cellular networks to an analysis center.
Researchers at the University of Bonn developed the method several years ago and tested it on the Lower Rhine. With support from the European Space Agency (ESA), the monitoring system is now also being used in Africa and the Asia-Pacific region.
Researchers at the Institute of Geodesy and Geoinformation at the University of Bonn, led by Makan Karegar, have transferred water -level monitoring technology from the Rhine to Africa, Australia and the Philippines as part of ESA projects. Originally developed in the DFG Collaborative Research Center SFB 1502 (DETECT), the technology enables continuous, freely accessible monitoring of inland and coastal waters in data-poor regions worldwide.
Active on three continents
The technological centerpiece is the Raspberry Pi Reflector (RPR), a compact, solar-powered sensor developed at the University of Bonn. Using GNSS-IR, it measures water levels with centimeter-level accuracy.
Only a portion of the signals emitted by the GNSS satellites is directly captured by the antenna. The rest is reflected by the water surface and reaches the receiver via this detour. When superimposed with the directly received signal, it forms specific patterns known as interference patterns. These can be used to calculate the distance from the antenna to the water surface.
Each unit costs less than 800 euros, is powered by solar energy, and transmits data daily via mobile networks. “Modern gauge stations are prohibitively expensive, and conventional ones are highly vulnerable to flood damage,” said Makan Karegar, project manager. “These two factors together have left many countries in the global south with little to no ground-based water-level monitoring. The low-cost GNSS-IR sensor was developed precisely to address this gap.”
CAMEO-WAGST Project
The CAMEO-WAGST project (“Cameroon Advanced Measurements for Enhanced Observations of Water levels using Affordable GNSS-IR and Sentinel-3 & 6 Technology”) has established the first dedicated GNSS-IR network for monitoring water levels along coasts and rivers in Camroon and was funded by ESA. Between May and June 2025, researchers collaborated with Loudi Yap, director of the Research Laboratory in Geodesy at the National Institute of Cartography to install eight RPR sensors in Cameroon: two on the Sanaga River and six along the coast. “A lack of infrastructure for reliable hydrological and coastal monitoring in Cameroon has so far hindered effective flood risk management and early warning systems,” Yap said.
This collaboration, under the umbrella of the EO Africa Research and Development Facility, is already bearing fruit, said Roelof Rietbroek, research coordinator at ESA’s EO Africa R&D Facility. “We hope this paves the way for more reliable monitoring of flood-prone regions in Africa.”
St3TART-FO Project
Building on this success, the follow-up project St3TART-FO also was launched in collaboration with ESA. A total of 17 RPR sensors will be installed in seven countries, including West Africa, Australia and the Philippines. “The goal is to create a freely accessible reference measurement network for calibrating satellite data,” Karegar said. For the first time, the network will provide continuous water-level data at previously unmonitored locations.
The collaboration is based on years of scientific exchange between Africa and Europe. Partners include:
International Institute for Water and Environmental Engineering (2iE), Burkina Faso
National Institute of Cartography, Cameroon
Environmental Protection Authority (EPA), Ghana
Nigeria Hydrological Services Agency (NiHSA)
University of Maiduguri, Nigeria
Assane Seck University of Ziguinchor, Senegal
University of Southern Queensland, Australia
University of the Philippines Diliman.
Technology Transfer and Capacity Building
Both projects promote technology transfer and local capacity building through training, workshops and mentoring, enabling partner institutions to operate RPR networks independently. “We want to leave behind a sustainable monitoring capacity that is operated by local scientists and institutions, openly shared with the world, and maintained well into the future,” Karegar said.
With financial support from the Transdisciplinary Research Area (TRA) “Sustainable Futures” at the University of Bonn, Karegar developed the open-access data platform gnss4surfacewater.com, which provides an independent, ground-based service for monitoring current and historical water levels using GNSS-IR. Also visit CAMEO-WAGST GitHub for code and field photos.
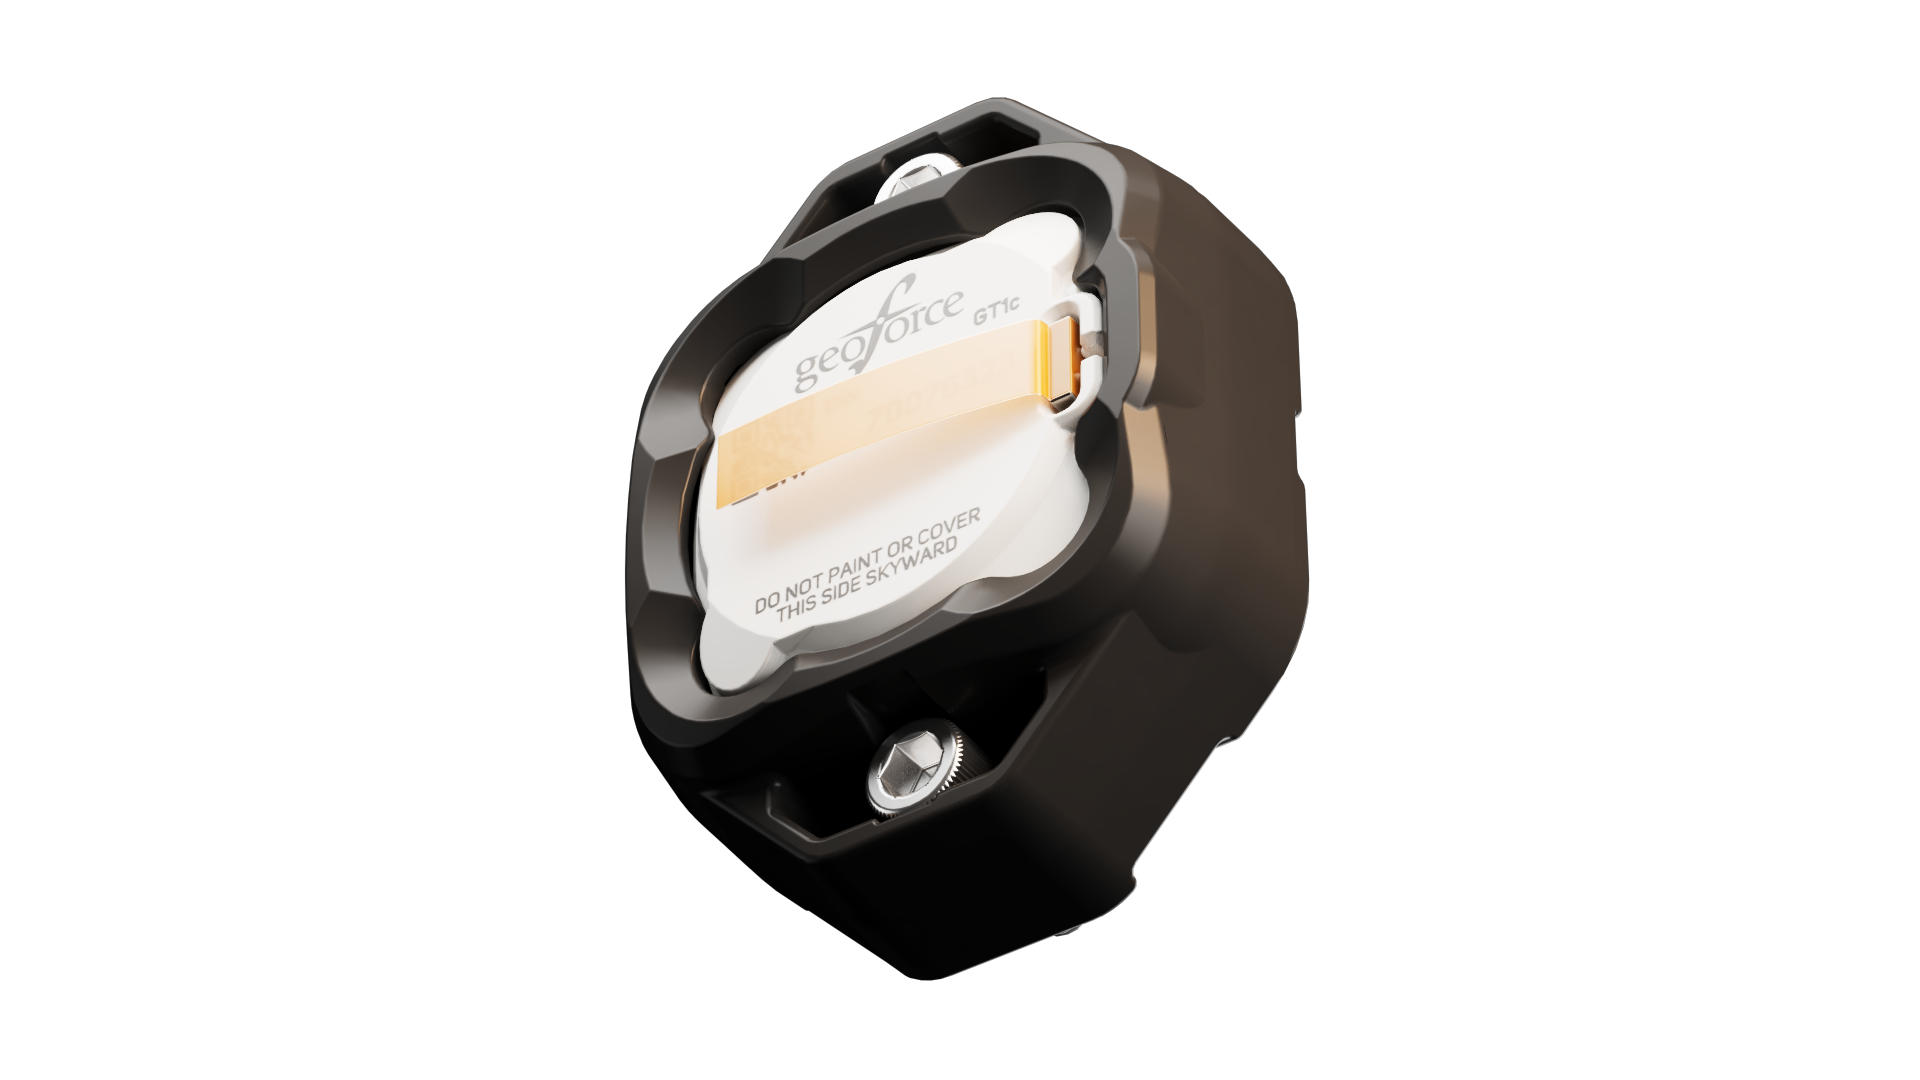
Geoforce has launched the GT1c, which enables rugged cellular equipment tracking at scale. According to Geoforce, the GT1c has a more cost-effective, purpose-built design to complement Geoforce’s full range of satellite tracking devices.
The GT1c operates on AT&T’s network, built for the next era of IoT connectivity for business. The device’s launch builds on a collaboration with AT&T Business announced in March and represents the first product outcome of the relationship.
The GT1c captures and feeds smart location updates to Geoforce’s mobile-enabled asset intelligence platform, providing field operations and asset managers with visibility into the location, movement and utilization of industrial assets and equipment.
The GT1c has an encapsulated design, reinforced bezel, and intrinsic safety certification to ensure that it can survive in hazardous, heavy-vibration environments and extreme temperature ranges. It’s low price means customers can afford to track almost every asset class, the company said.
Pilot programdemonstrates value
In a pilot program with Black Diamond Equipment Rental, the GT1c demonstrated that expanding tracking across mid-tier and small assets is both practical and operationally impactful. The heavy-duty equipment rental company expanded tracked inventory by 26% across smaller and mid-tier construction and oil and gas rental assets. The result was a significant reduction in operational friction and time savings expected to exceed 500 hours per year.
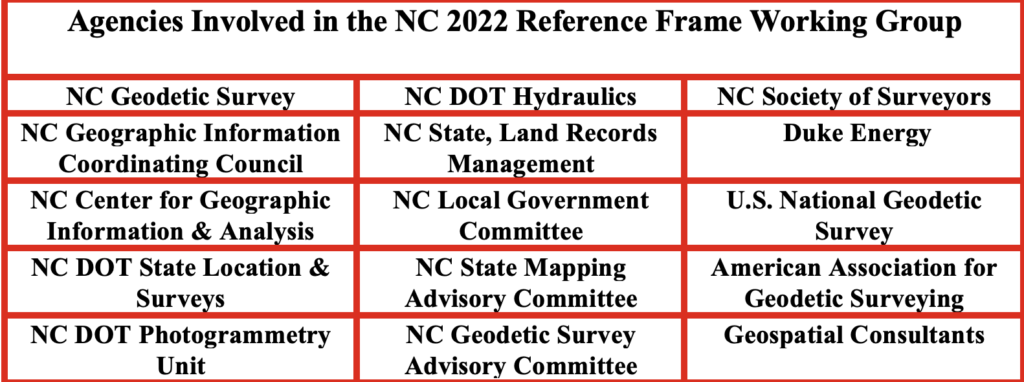
As noted in my previous newsletter, NC RFWG agencies are proactively conducting self-assessments of their needs and processes to identify challenges and opportunities early, enabling a smooth transition and sustained operational efficiency. The working group meets monthly to review progress on activities.
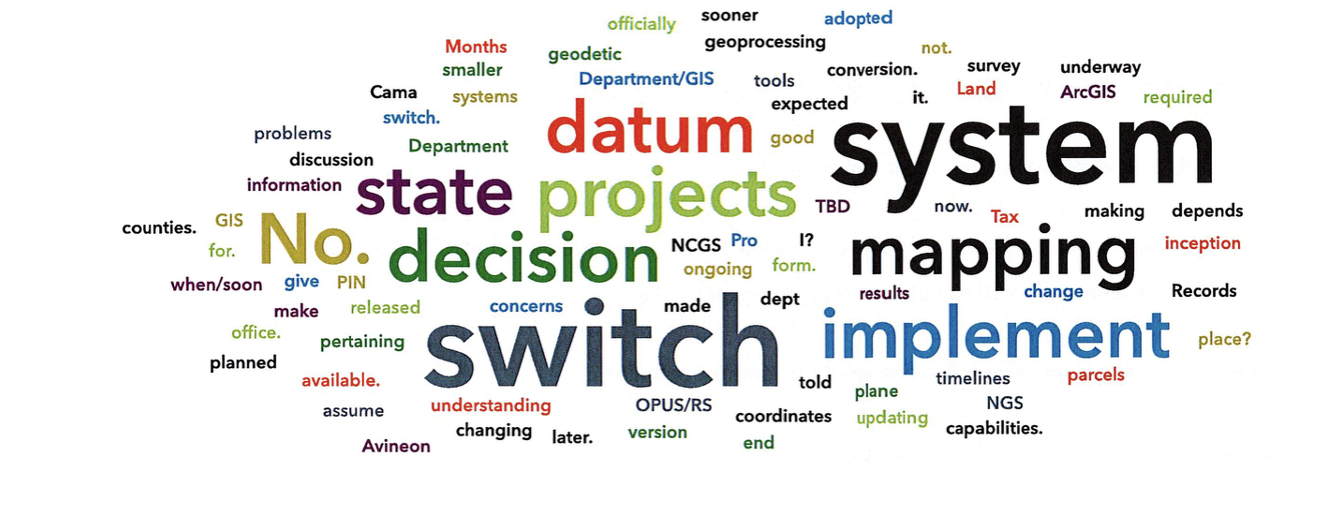
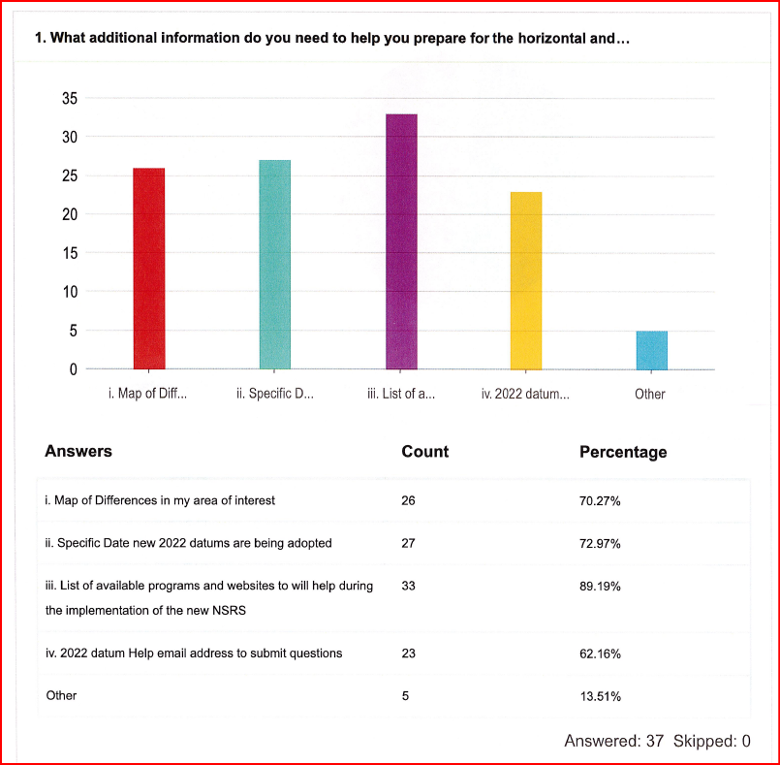
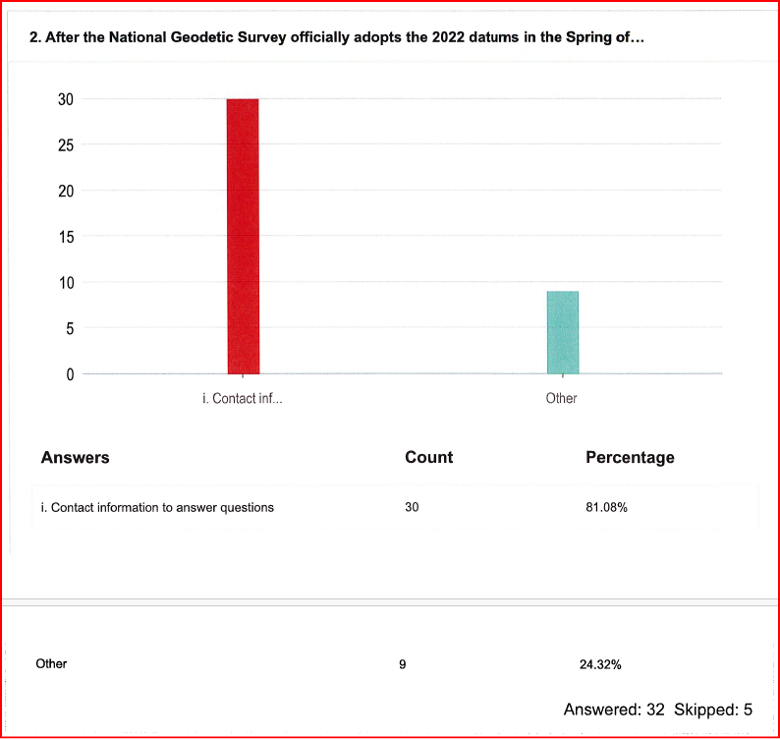
One key task of the working group was to develop a short online questionnaire. The goal was to open a dialogue with geospatial professionals and better understand their readiness for the upcoming modernization of the National Spatial Reference System (NSRS).
The questionnaire was designed to address the following key questions:
Are you prepared to implement the new NSRS once the National Geodetic Survey (NGS) officially adopts it?
Do you have the necessary tools and resources in place to ensure a smooth transition?
Has your organization established a timeline for transitioning to the modernized NSRS?
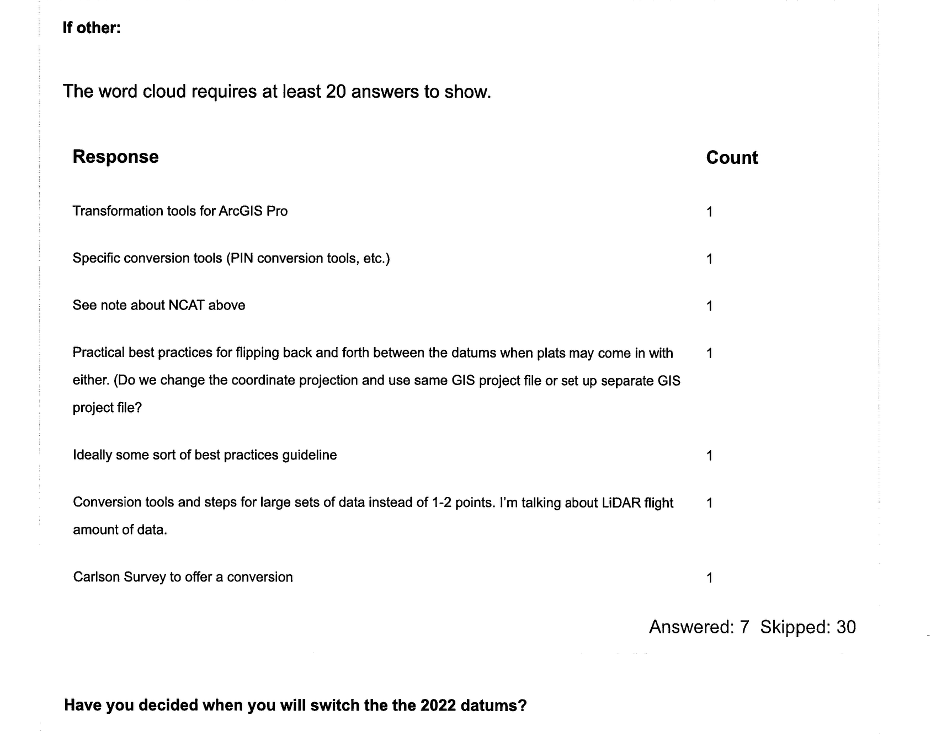
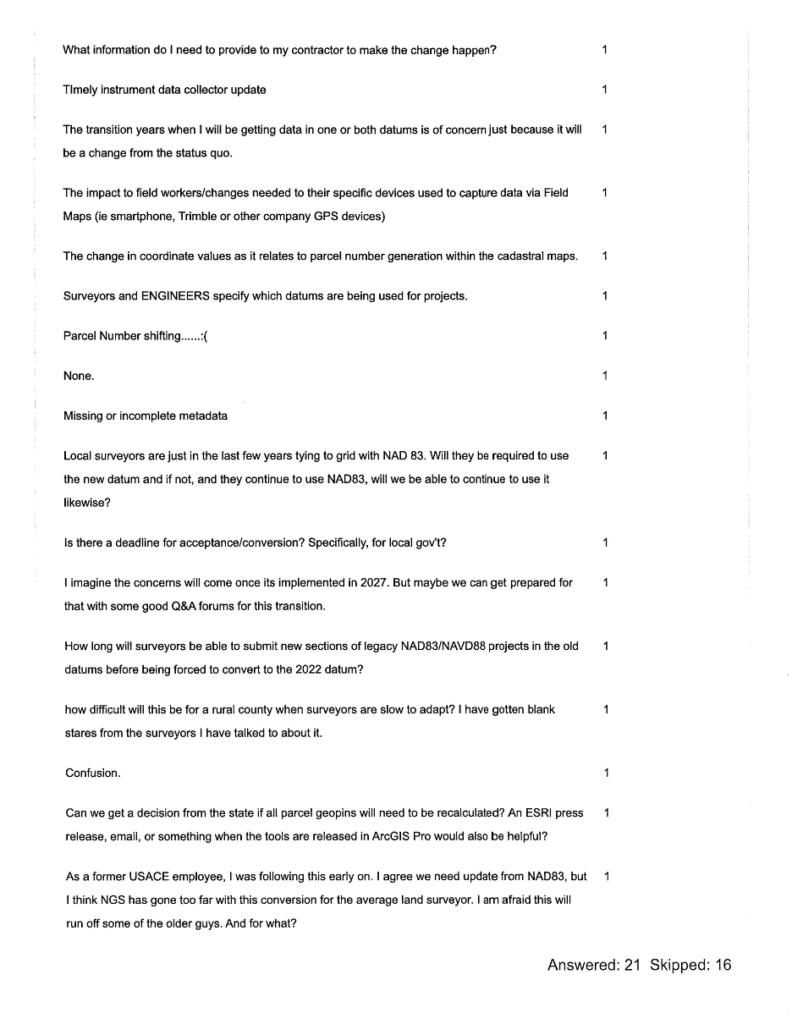
What concerns do you have regarding the transition to the new NSRS?
The section titled “Introduction of North Carolina Questionnaire” explains the purpose and background of the survey, while the section titled “North Carolina Online Questions” presents the list of questions included in the questionnaire.
Introduction of the North Carolina Questionnaire
This questionnaire seeks stakeholder input on the upcoming modernization of the National Spatial Reference System (NSRS). Your feedback is welcome on the proposed questions, as well as any concerns about the datum transition, tools (such as updated NCAT, OPUS, and SPCS2022), data transformation strategies, workflow impacts, and preparation needs.
The National Geodetic Survey (NGS) is replacing the North American Datum of 1983 and the North American Vertical Datum of 1988 with new plate-fixed terrestrial reference frames (NATRF2022, PATRF2022, CATRF2022, and MATRF2022) tied to the International Terrestrial Reference Frame 2020, along with the new vertical datum, the North American-Pacific Geopotential Datum of 2022.
In spring 2027, new horizontal and vertical datums will be implemented:
Horizontal
North American Terrestrial Reference Frame (NATRF2022)
Replaces the North American Datum of 1983 (2011)
Vertical
North American-Pacific Geopotential Datum of 2022 (NAPGD2022)
Replaces North American Vertical Datum of 1988
Units
14B NCAC 03 .0602 REQUIRED FOOT CONVERSION
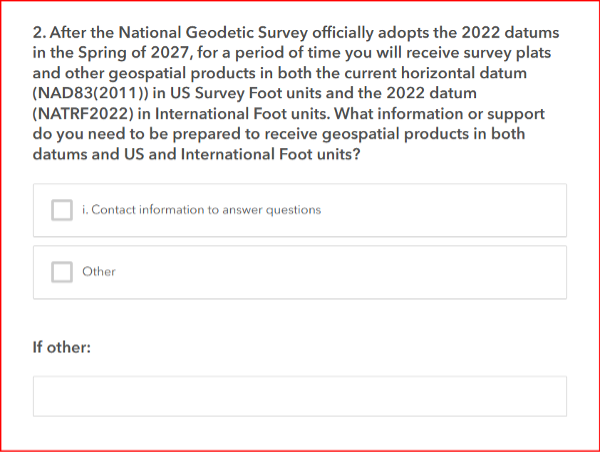
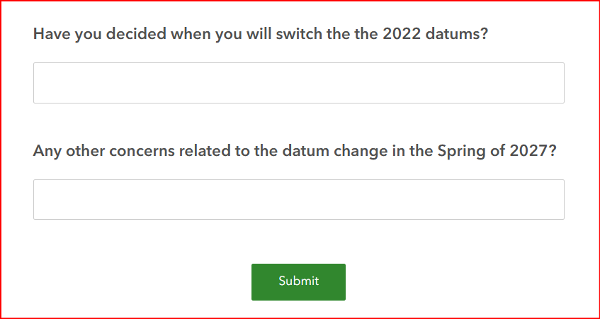
North Carolina Online Questions
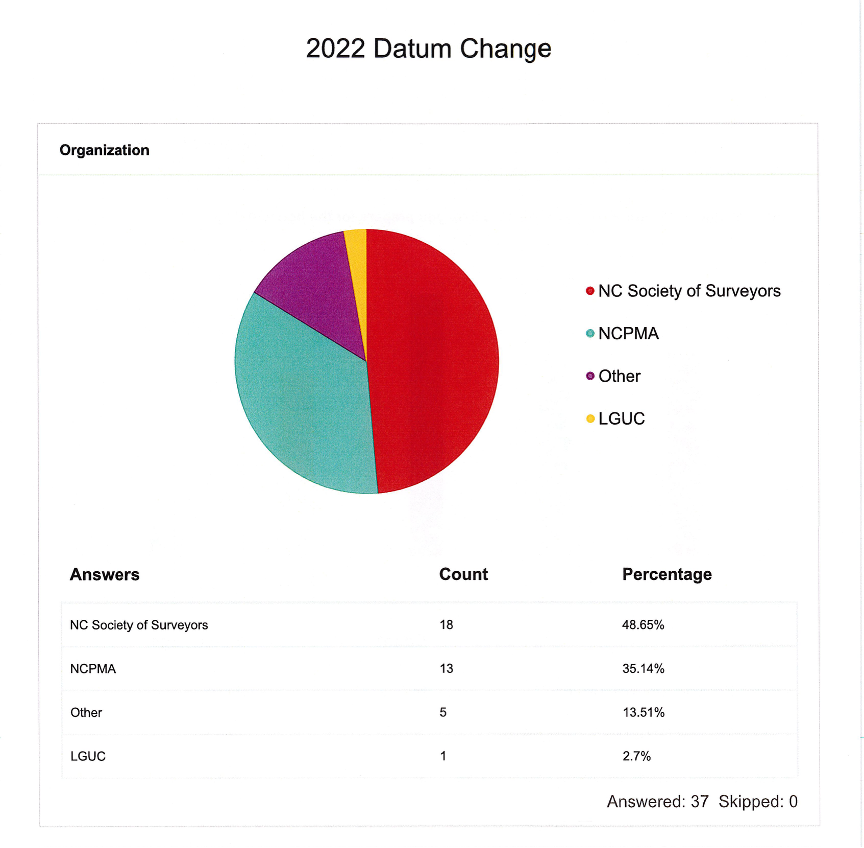
The section titled “Results of North Carolina Online Questionnaire” summarizes the survey responses collected as of April 27, 2026.
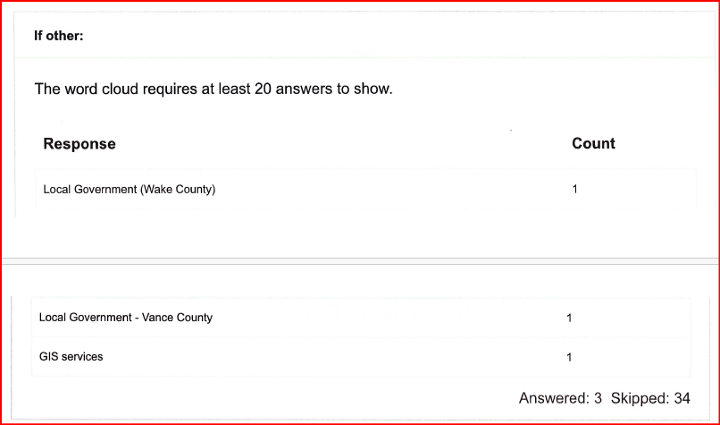
[Note: NCPMA refers to the North Carolina Property Mappers Association, and LGUC refers to the North Carolina Local Government Committee.]
Results of the North Carolina Online Questionnaire
(April 27, 2026)
This questionnaire solicited input from the North Carolina Property Mappers Association (NC PMA), the North Carolina Geographic Information Coordinating Council (GICC), and the North Carolina Local Government Committee (LGC). Although focused on North Carolina, the results may benefit other working groups. The NC working group is reviewing all feedback—especially regarding the Spring 2027 datum change—and will develop materials to address it.
In addition to the questionnaire, the working group prepared a short guidance document on the new reference frames for local governments and state agencies. It outlines how to prepare for the 2027 datum change and covers:
Preliminary steps for transitioning when NGS and North Carolina officially adopt the new datums in 2027.
Actions users can take now to ready NSRS‑referenced data for the modernized NSRS and the shift from U.S. Survey Foot/International Foot.
Estimated coordinate changes with the 2027 adoption of:
North American Terrestrial Reference Frame (NATRF2022)
North American-Pacific Geopotential Datum of 2022 (NAPGD2022)
New national geoid model (Geoid2022)
North Carolina State Plane Coordinate System of 2022 (SPCS2022)
Current NC statewide digital orthoimagery acquisition cycle and statewide lidar collection schedule.
How the NC CORS and Real-Time Network (RTN) will support the modernized NSRS.
Web links to more detailed resources.
The working group is developing a case study on preparing a FEMA Elevation Certificate using the modernized NSRS (NATRF2022 and NAPGD2022). It will be featured in upcoming newsletters. The North Carolina Geodetic Survey will host the materials on its website, and I’ll share the public link once it’s available.
The GPS Next Generation Operational Control System program of the U.S. Space Force has been cancelled by the Defense Acquisition Executive, based upon the recommendation of the acting service acquisition executive.
OCX was intended to update command and control of the GPS satellite constellation, replacing the current system, known as the Architecture Evolution Plan (AEP), as well as replacing the Launch, Anomaly and Disposal Operations system. However, the program was unable to deliver needed capabilities on an operationally relevant timeline at an acceptable level of risk to meet the GPS constellation modernization needs.
“It’s important we refine and update acquisition processes to prioritize rapid, incremental capability delivery versus complex ‘all or nothing’ system deliveries,” said Acting Service Acquisition Executive Tom Ainsworth. “The Department of War [Defense] has made clear that we need to deliver warfighting capability at a faster rate. We must continue to work with industry to meet the needs of our warfighters as we focus on delivering the right technology on the right timeline to enhance our capabilities and maintain space superiority.”
In July 2025, following a multi-year regimen of factory testing, the Space Force contractually accepted OCX from RTX (Raytheon) and began extensive integrated systems testing to resolve liens carried over from factory testing, as well as to ensure the system could operate within the broader GPS enterprise of ground systems, satellites, and user equipment.
As of January 2026, the program cost was approximately $6.27 billion which included complete Raytheon funding to date and other government costs, such as the cost of government testing and support costs to the OCX acquisition program office.
“Regrettably, extensive system issues arose during the integrated testing of OCX with the broader GPS enterprise,” said Mission Delta 31 Commander Col. Stephen Hobbs. “Despite repeated collaborative approaches by the entire government and contractor team, the challenges of onboarding the system in an operationally relevant timeline proved insurmountable. We discovered problems across a broad range of capability areas that would put current GPS military and civilian capabilities at risk.”
Because of past delays on the OCX program, the Space Force has made incremental improvements over the last 10 years to AEP. These successful upgrades provide confidence that further upgrades to GPS ground systems will continue to support the enterprise and deliver new capabilities.
“Ultimately, we analyzed the work remaining on OCX and compared this with the current GPS control system capability,” Hobbs said. “The analysis revealed additional investment in OCX was no longer the best solution for protecting and advancing GPS capabilities. Instead, we will continue enhancing the current control system to operate the GPS satellite constellation.”
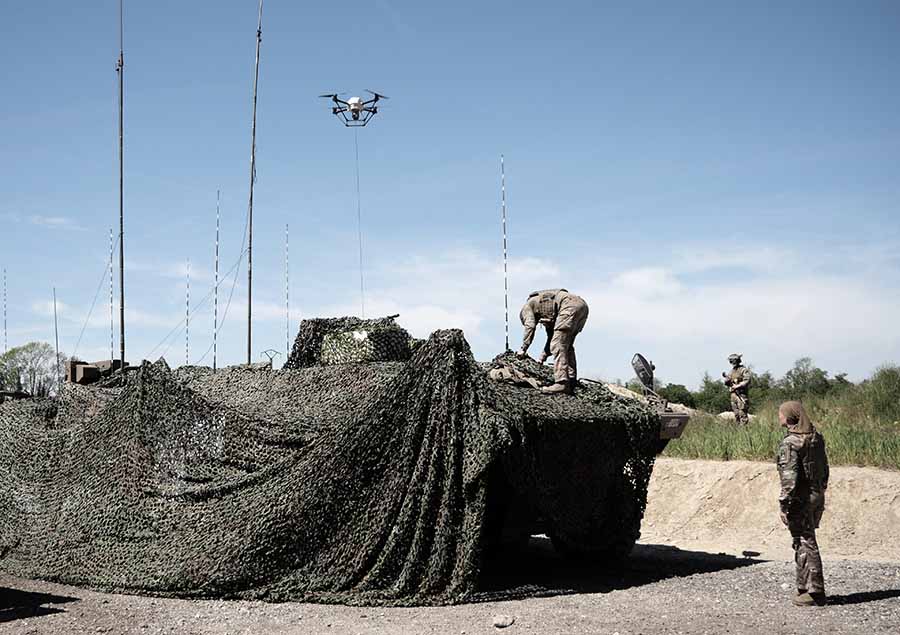
Elistair, manufacturer of tethered drones for security applications, participated in Orion 2026, France’s most ambitious joint military exercise in decades. In the exercise, Elistair contributed its Khronos automated tethered DroneBox, used for ISR and tactical communications missions.
Running from February to April, ORION 2026 mobilized up to 12,500 military personnel across the country in a high-intensity, multi-domain scenario involving land, sea, air, space, cyber and electromagnetic domains. More than 1,200 drones of all types were deployed throughout the exercise.
Elistair participated in Phase O4 (April 7–30) following its fisrt contribution during Phase O2 in February, which demonstrated France’s ability to fully integrate into a NATO command structure for collective defense scenario. During the week of April 27, forces conducted offensive exploitation operations, river crossings, retaking of key positions, and live-fire exercises.
The Khronos system
Forces need real-time situational awareness in contested and GNSS-denied environments. The Khronos system provides continuous aerial surveillance from fixed or mobile platforms. It does not depend on GNSS, radio frequency infrastructure, or battery-limited free-flying aircraft.
Khronos deploys from a transportable DroneBox in under two minutes. The system can deliver continuous day and night imagery for up to 24 hours, making it a “pocket watchtower” for tactical units.
The tethered drone operates in GPS- and RF-denied conditions through a secured tether and advanced positioning system. Elistair targets armed forces, law enforcement, civil security agencies, and private security operators in more than 70 countries. The company runs operations from France and North Carolina.