Eos Positioning Systems (Eos) has become a member of the Municipal Information Systems Association (MISA) Canada’s National Partner Program (NPP). This collaboration aims to enhance the capabilities of Canadian municipalities in utilizing GNSS technology for improved mapping and asset management.
The partnership between Eos and MISA Canada facilitates the digital transformation of Canadian cities and towns by bringing together municipal leaders and technology innovators. Eos specializes in providing high-accuracy GNSS technology to local governments, enabling them to maintain critical infrastructure and public services more effectively.
Eos manufactures GNSS receivers in Canada that offer submeter to centimeter-level accuracy for GIS and mapping applications. These tools are particularly useful for utility and infrastructure mapping, public works asset management, environmental monitoring and planning and emergency response coordination.
The GNSS receivers from Eos are designed to integrate with existing GIS software and mobile devices, allowing field teams to efficiently collect, update, and manage spatial data with high precision. As part of MISA’s NPP, Eos will provide members with access to specialized solutions, training resources, and ongoing technical support to maximize the benefits of GNSS technology in municipal operations.
Mapbox and Hyundai AutoEver, a software affiliate of Hyundai Motor Group, have developed an integrated AI-driven 3D navigation system with advanced driver-assistance (ADAS) capabilities. This system, powered by Mapbox 3D Live Navigation and MapGPT, operates on Hyundai Mobis’ cockpit domain controller.
The Mapbox 3D Live Navigation system offers 3D lane-level guidance, augmented reality overlays and real-time driver assistance. It integrates Mapbox’s navigation technology with Hyundai AutoEver’s software-defined vehicle platform and Hyundai Mobis’ AR-enabled cockpit domain controller. This integration provides drivers with turn-by-turn navigation enhanced by ADAS alerts, including collision warnings and lane departure notifications.
MapGPT, an AI-powered location assistant, complements the navigation system. It facilitates voice-driven interactions for dynamic routing, real-time traffic updates and hyper-local search. The system also allows voice-activated controls for in-car functions such as climate control and music. For electric vehicles, MapGPT includes features such as real-time range monitoring and charging station recommendations.
At CES 2025, Mapbox and Hyundai AutoEver will demonstrate these technologies, showcasing features such as lane-level AR navigation, voice-controlled systems and electronic vehicle-specific tools.
HERE Technologies and Amazon Web Services (AWS) have entered a cloud infrastructure agreement aimed at advancing the development of software-defined vehicles (SDVs). This partnership combines HERE’s mapping solutions with AWS technologies to accelerate the creation of advanced driver assistance systems (ADAS), automated driving (AD) and new digital car experiences.
The collaboration leverages HERE’s expertise in location technology and AWS’s cloud capabilities to address the growing importance of live mapping in modern vehicles. These data-intensive operations can now be supported and scaled more efficiently using AWS, potentially reducing development times and accelerating innovation in the automotive industry.
HERE has been utilizing AWS for its core cloud infrastructure, data platform and AI/ML model deployment for nearly a decade. This expanded collaboration allows HERE to offer automakers a comprehensive set of cloud-native tools and technologies, enhancing various aspects of vehicle functionality, from improved active safety features to optimized infotainment systems.
Key developments
A key development from this partnership is SceneXtract, a solution that streamlines the process of creating simulation-ready scenes for testing ADAS and AD systems. By combining HERE HD Live Map data with AWS’s natural language processing and generative AI services, automotive developers can more efficiently prepare simulations, potentially accelerating the development and deployment of advanced driving technologies.
Beyond the automotive sector, HERE and AWS are collaborating on transportation and logistics solutions. These new offerings, built on AWS infrastructure, aim to help enterprise customers optimize fulfillment, improve supply chain visibility, and support sustainability goals.
TomTom and Esri have partnered to integrate TomTom’s global map and traffic data into ArcGIS, Esri’s comprehensive geospatial platform.
This collaboration aims to provide businesses and governments with location-based insights for various applications, including infrastructure maintenance, traffic flow analysis and retail site optimization. Esri is a prominent provider of geographic information system (GIS) technology, offering mapping and spatial analysis applications that facilitate efficient data collection, management and analysis. Organizations across various sectors — including governments, educational institutions, non-profits and businesses —can utilize the software.
In February 2023, Esri joined the Overture Maps Foundation, a collaborative effort initiated by Amazon Web Services, Meta, Microsoft and TomTom. This foundation aims to establish a location data standard and promote a data-sharing ecosystem to enhance maps, location technology applications and location-based insights.
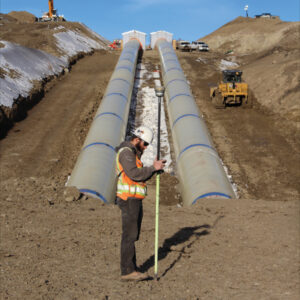
All construction work begins with surveying to map the site and generally ends with surveying to document what was done on it — called “as built.” Therefore, surveyors are the first to arrive at a construction site, well before the first heavy machinery, and the last ones to leave, well after the construction crews have left with their equipment. During construction, surveyors get to work any time there are changes in the plans.
Surveyors are not the only ones to use survey-grade GNSS receivers on a construction site, though. GNSS for machine control is increasingly common on excavators, graders, dozers and other heavy machinery. It enables operators to achieve accurate earthmoving and grading operations with minimal manual intervention, significantly improving efficiency and reducing rework by providing real-time positioning data based on 3D design models. Additionally, a dedicated display in the cab allows operators to see a visual representation of the machine’s position relative to the design model and to make adjustments in real-time.
This month’s cover story features case studies from four companies:
CHC Navigation (CHCNAV) on grading for an airport construction project in Shanghai, China.
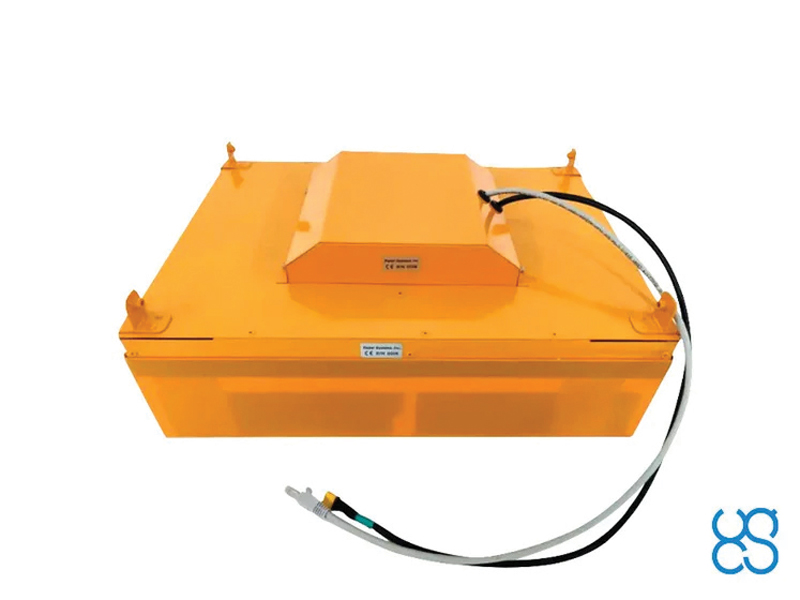
ComNav Technology on a river flow monitoring system to mitigate the effects of flooding in Japan.
Nearmap on solving the stormwater challenges of a small town in Michigan.
Frontier Precision on the repair of a canal in Montana in very challenging conditions.
Construction of a building cannot begin until the ground is level and matches the design so that it can bear the weight of the planned structure. At times, part of the ground needs to be sloped to ensure proper drainage or to meet the aesthetic needs of the project. However, the ground at a construction site is often uneven and/or sloped the wrong way. Therefore, a critical phase of any AEC project is grading, which is a specialized phase of the construction process that uses machinery such as graders, bulldozers, excavators, and dump trucks to move and shape large amounts of earth.
Traditionally, grading involved the use of string lines and optical levels, which are still valuable for smaller projects. These tools provide a visual reference for achieving the desired slope and allow for manual adjustments as needed. Modern construction practices rely on laser levels — which provide accurate measurements, ensuring a consistent slope — and, increasingly, on GNSS receivers, which aid in precise grading, especially in large-scale projects.
In a recent project to build an apron — a paved area where aircraft are parked, loaded, unloaded, refueled and boarded, also known as the ramp, flight line or tarmac — as part of the expansion of Shanghai Pudong International Airport, the construction company adopted CHCNAV’s i93 GNSS receiver solution. The project, by a large state-owned construction company, began at the end of July 2024 and is expected to take two years to complete. By directly loading the designed triangulated terrain model (TTM) for surface stakeout, the project managers were able to visualize the cut-and-fill values at any location in real time. This approach doubled the stakeout efficiency and significantly improved the quality of site grading.
Project challenges and solution
The airport project covered approximately 360,000 m², demanding high-precision grading. Traditional surveying methods could only verify cut-and-fill heights at grid nodes, failing to effectively cover areas between these nodes. This limitation increased the risk of uneven construction and restricted the comprehensiveness of elevation data. Additionally, the traditional stakeout process was cumbersome and inefficient, requiring point selection before stakeout. To overcome these challenges, the construction team needed a surveying solution that could significantly enhance stakeout efficiency while improving grading precision and construction outcomes.
The construction team used the CHCNAV i93 GNSS receiver and LandStar field survey APP. By using the surface stakeout function for site grading, it was able to load the TTM generated from design data directly into the LandStar software, simplifying the grading process. The software enabled surveyors to obtain cut-and-fill values at any location in real time, thereby eliminating reliance on grid nodes and enabling dynamic verification across the entire site for higher grading precision. Lastly, the solution doubled the stakeout efficiency by reducing the steps of selecting feature points before stakeout.
Using CHCNAV’s Satellite Wide Area System (SWAS) corrections network, a global system that offers users fast and precise centimeter-level positioning services, the surveyor was able to achieve an elevation accuracy of -3 cm ~ +2 cm. SWAS covers most of the inhabited areas in China and is expanding its network globally. CHCNav’s satellite Precise Point Positioning service is being developed and tested; it will become part of the SWAS service in the future. The surveyor guides the site grading by comparing the difference between the elevation in the design plans and the measured elevation. Therefore, when the site grading is complete, it should match the design plans.
Conclusions
“The project involves large areas of earth excavation and levelling,” said Yang, the chief of the survey team. “In the past, we had to stake out all the points of the grid after getting the design drawings, and then calculate the elevation difference of each point. If there were some special points, we also had to calculate their positions in the grid. Now, in LandStar 8, we can directly convert the grid drawing into a TTM file and stakeout, which makes it easy for us to set the elevation difference at any point without the limitation of the grid. This increased efficiency accelerated the progress of the project and reduced our workload.”
The adoption of CHCNAV’s surveying and construction solution significantly accelerated the project’s site grading work. This task, which traditionally would have taken about one month to complete, was fully accomplished in just half a month. During the project acceptance phase, the results met all design requirements and passed inspection smoothly. The construction unit reported that the CHCNAV i93 GNSS receiver and LandStar field survey APP greatly enhanced the efficiency and accuracy of the site grading portion of the construction project.
It is essential to take effective measures to mitigate the effects of natural disasters — such as earthquakes or hurricanes — and to prevent them when possible, such as sometimes with floods. This involves multiple aspects, including the development and rehearsal of emergency plans, the construction and reinforcement of infrastructure, and the monitoring of environmental changes. By identifying potential disaster risks and taking preventive actions, the damage caused by these disasters can be significantly reduced and the resilience of communities and cities can be enhanced, thus better preparing for future catastrophes.
How can these disaster mitigation and prevention measures be specifically implemented? First, by creating detailed emergency plans and conducting regular drills, which ensures a quick and effective response during critical situations. Second, by reinforcing critical infrastructure, such as protective embankments and resilient systems, which strengthens the overall preparedness of both urban and rural areas. Moreover, monitoring environmental changes plays a pivotal role in prevention efforts. Real-time observation systems, including advanced sensors and data integration platforms, enable the early detection of potential risks. This facilitates timely preventive actions, minimizing losses with optimal efficiency and resource utilization.
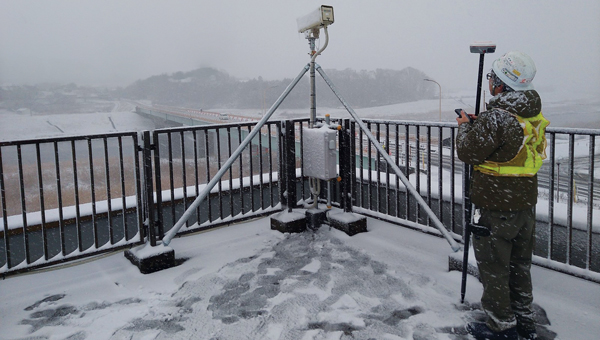
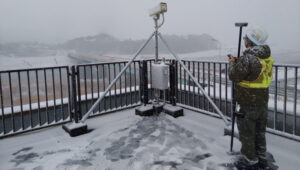
Mars Pro Laser RTK was used to precisely measure the positions of monitoring cameras in the Abukuma River basin.(Photo: Geosurf Corporation)
Monitoring systems
A key aspect of flood defense and disaster prevention is the establishment of monitoring systems and the enhancement of safety measures. In the Abukuma River basin, which flows through Fukushima and Miyagi prefectures in Japan, a flood monitoring system has been built that combines data from water level meters with real-time information on changes in water levels due to natural events such as typhoons. This provides residents with immediate visual updates to help them respond effectively.
ComNav Technology’s Mars Pro Laser RTK has played an important role in this flood prevention and disaster monitoring project. By using the device, which integrates advanced GNSS, IMU, and laser technologies, a team from Geosurf Corporation was able to accurately determine the locations for installing surveillance cameras, ensuring real-time monitoring of water flow conditions, and providing early warnings for natural disasters such as floods. The locations of these cameras typically include areas with a high risk of riverbank collapse, water level observation stations, and other critical spots that require close monitoring.
In the past, this task would have required using a total station. However, using Mars Pro’s very precise green laser, the crews were able to measure the locations of offset points that did not have a clear view of the sky, which is required to receive GNSS signals.
Centimeter-level accuracy
The green laser, which is visible in daylight, enabled the crews to achieve centimeter-level accuracy at any point within a range of 10 meters. They were also able to use its 120-degree tilt compensation feature to drive the stakes efficiently closer to the target point without worrying about leveling. During the RTK positioning process, the team used reliable correction information sources and precise post-processing analysis methods, ensuring that the measurement point consistency was maintained within 2 cm to 3 cm, thus ensuring high accuracy and consistency of the measurement results.
Positioning surveillance cameras in the Abukuma River basin required measuring not only their placements but also the reference points within their coverage areas. Beyond its convenience and reliability, the Mars Pro Laser RTK and its paired software, Survey Master, simplified the survey workflow by using wizard functions. Specifically, the procedure is to follow the instructions of the surveillance camera monitor to move onto the centerline and use the program’s Angle Offset Calculator to calculate the coordinates of a reference point at ±90 degrees to the line segment. Survey Master’s simple survey calculation tool eliminates the need to launch a CAD program in the field, making the staking more efficient.
For the correction information in RTK positioning, Geosurf Corporation used ichimil, a high-precision positioning service provided by Softbank. Geosurf also acquired raw data for post-processing at several locations at the same time and analyzed the measurement points using coordinate results from Japan’s Geospatial Information Authority.
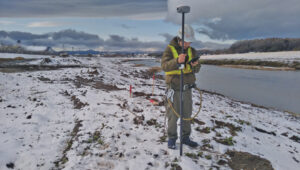
The surveyor used Mars Pro Laser RTK and Survey Master software to measure the reference points within coverage areas of surveillance cameras. (Photo: Geosurf Corporation)
Conclusions
The monitoring system combines water level data collected from devices such as water level meters with changes in water levels caused by natural events such as typhoons, providing real-time visual information to residents. This allows them to stay informed about current water levels, identify potential flood risks early, and take appropriate preventive measures, effectively reducing disaster risks and safeguarding lives and property. More than 100 surveillance cameras have been installed so far in the Abukuma River and its associated watershed.
Through this project, Mars Pro Laser RTK not only enhanced emergency response capabilities but also showcased the versatility of laser RTK technology in disaster prevention and mitigation applications. Climate change is increasing the damage caused by typhoons and torrential rains worldwide. As a result, the demand for such monitoring systems is expected to grow. ComNav Technology plans to further improve user experience by integrating laser technology with additional sensors and developing more innovative tools to address future disaster prevention needs.
While surveyors are typically the first to begin working on a construction site, but they do not start completely from scratch. As a basemap for their measurements, they often use satellite and aerial imagery, the latter collected by planes and UAVs — the same imagery used in geographic information systems (GIS) by governments at every level and private companies to plan, build, and manage buildings and infrastructure. These data include high-resolution orthimages, which are taken pointing straight down at the ground and adjusted to have a constant scale of distance across them; oblique images, which can offer an alternative view of the landscape and structures where height is important; 3D datasets, including digital elevation models and models of buildings, collected using lidar; and AI-derived spatial information.
Additionally, historical imagery datasets document the evolution of land use over time and make it possible to compare conditions before and after natural disasters, such as floods and earthquakes, to expedite emergency response and reconstruction planning.
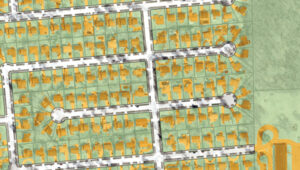
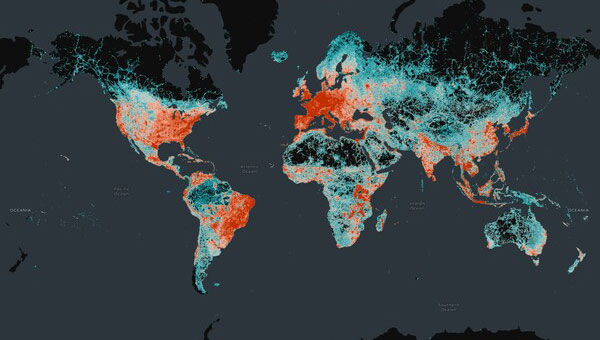
An aerial image of southfield, Michigan, from Nearmap’s natural pervious surface AI data layer. (Photo: Nearmap)
Stormwater utilities project
With a diverse population, more than 10,000 businesses, and a commitment to urban development, the City of Southfield, Michigan is known for its robust economy, thriving commercial centers, modern urban living and innovation. When it needed help to effectively manage its stormwater utilities, the city hired OHM Advisors. Founded in 1962 and with a multidisciplinary team of more than 700 experts, the firm provides consulting in the areas of architecture, engineering, planning, urban design, landscape architecture, surveying, and construction engineering. In turn, for this project, OHM Advisors used location intelligence from Nearmap, an aerial imagery company founded in 2007 that captures urban areas across the United States, Canada, Australia and New Zealand.
Initially, the city planned to have access to the Nearmap imagery for only a year, for use in its stormwater utilities project. However, once it realized how useful it would be across city departments and projects, it decided to continue buying it for the long term.
Aerial imagery
The City of Southfield is currently in the planning stages of considering a new initiative to assess stormwater fees based on the number of impervious surfaces — such as asphalt and concrete — which do not allow water to penetrate the ground, thereby contributing to increased runoff and straining municipal systems. However, the city is challenged by its limited budget for maintaining, let alone upgrading, its stormwater infrastructure. Additionally, the aerial imagery it had was old and one-time flyovers of the small city to update the imagery would have been prohibitively expensive, costing up $100,000.
By purchasing high-resolution aerial imagery (captured up to three times a year), geospatial data, and AI feature layers from Nearmap, as recommended by OHM, the city was able to efficiently map impervious surfaces and readily view, identify, and verify stormwater utilities at scale. This enabled the city to develop a highly accurate and equitable system for assessing fees based on near-real-time data. It also improved the precision and efficiency of its urban planning; enabled city planners to complete tasks remotely, spending less time in the field; and updated the imagery in its GIS.
Business impact
Using current aerial imagery, geospatial data, and AI data, Nearmap and OHM identified every impervious surface in the city, enabling Southfield to:
Accurately assess stormwater fees. Analysis of Nearmap imagery and AI data allowed OHM to tie impervious surface area to stormwater fees and establish a precise, data-backed fee structure that bolsters the city’s infrastructure funding.
Reduce costs. Nearmap offered a cost-effective alternative to traditional data collection, drastically reducing the city’s expenditure without sacrificing data quality.
Enhance urban planning. Access to Nearmap facilitated remote decision-making, allowing Southfield to optimize its urban planning.
Maintain consistent data. OHM and Nearmap led to the resolution of Southfield’s data discrepancies, ensuring reliable insights for future planning.
Conclusions
“Using the high-quality Nearmap AI data allowed the OHM Advisors’ GIS team to efficiently and effectively map out the impervious surfaces for the city,” said Mike Cousins, GISP, practice leader for GIS at OHM Advisors. “Having high-resolution and very recent imagery to pair with the impervious surface data helped with the analysis portion of the project at hand.” The collaboration between OHM Advisors and Nearmap marked a significant change in Southfield’s approach to stormwater management, illustrating the potential of advanced technology to improve urban governance.
The St. Mary Canal and siphon were completed in 1915 as part of the Milk River Project in North-Central Montana. The canal has delivered water to 110,000 acres of agricultural land in eastern Montana for 109 years. In June 2024, the siphon had a catastrophic blowout when both 90-inch siphon pipes failed, releasing 600 ft³ of water per second for more than 24 hours.
The stakeholders involved quickly went to work on a solution to replace the two siphon pipes. By mid-July, NW Construction, Inc. was brought on site to begin demoing and replacing the siphon. The company uses Frontier Precision as its supplier for all its surveying equipment. Utilizing a mix of GPS machine control, geospatial survey equipment, aerial drone surveys and CAD software, NW Construction will work through the blistering Northern Montana winter to restore the siphon in time for the 2025 irrigation season.
The harsh environment and speed of the project pose tough conditions for surveying. Winds regularly reach 60 mph with gusts up to 80 mph and temperatures go well below freezing for most of the winter. The surveyors on this project will have to overcome the challenges that come with this weather and the remoteness of the project.
The project has about six excavators, including two with tilt rotators, and four dozers, all equipped with GNSS machine control. “Everything we do is completely modeled for those guys through civil 3D and Trimble Business Center,” said Kenny Neskorik, project engineer for Northwest Construction. The GNSS receivers on the earth movers are running RTK as rovers and there is a single base receiver. “When we do any sort of concrete work for this project, we will also set up a robotic total station,” he said.
Additionally, the project uses a DJI Mavic UAV to collect aerial photogrammetry of such things as finished excavation and original ground stockpiles.
Requirements
The requirements for this project are atypical, Neskorik explained, due to its emergency nature. “The design and the construction are going on at the same time through two different entities,” he said. “My company is not the engineering firm stamping the plans. We’re the ones doing the work. I
could almost describe it as a design build, in which the contractor and the engineer meet in the middle to get the best product in the fastest way.”
The project’s biggest requirement is to get water back to the eastern part of the state by summer, when it will be needed to irrigate crops. “To do that,” Neskorik said, “we had to set control.” Because the project is only a few miles from the Canadian border, however, the power of radio broadcasts is restricted to only 2 Watts instead of the usual 35 Watts on RTK radios. “That really hurts your range to talk to your base,” he said. This required setting up several relay repeaters, especially since there’s almost no cell phone service in Montana
Challenges
An additional challenge is the solar cycle, which is nearing its peak. “We have noticed lots of Northern Lights, lots of auroras,” said Neskorik, “but we haven’t seen too many disruptions yet.”
Finally, the biggest challenge is the weather. “We’ve already had probably cumulatively two feet of snowfall,” said Neskorik. “Thankfully, some of that has already melted, but this area is one of the colder parts in the United States.” Browning, he pointed out, is just 30 minutes south of us, holds the world record for fastest temperature change in 24 hours — from 56 degrees Fahrenheit to negative 46 degrees. It’s not uncommon to see negative 50 degrees. “At that temperature, your batteries die really fast, you cannot use touch screens, and you have to drill to set stakes in the frozen ground is frozen. We’ve already experienced winds at nearly 80 miles an hour and that is pretty much how it goes for the entire winter. So, as you can imagine, it’s not an easy task flying a drone around here.”
Accuracy
“Our company standard for any excavator or dozer is an accuracy of one tenth of a foot,” said Neskorik. “We want our GPS rovers to have a vertical tolerance below 5/100s of a foot. Realistically, you’re probably getting a 1/10 of a foot. You cannot have any major fluctuations in the dirt because the pipe sits directly on it.” This all must happen in real time because there is no post-processing. “Everything is modeled and the machines are running on a model. We’re checking their grades as they’re doing the work.”
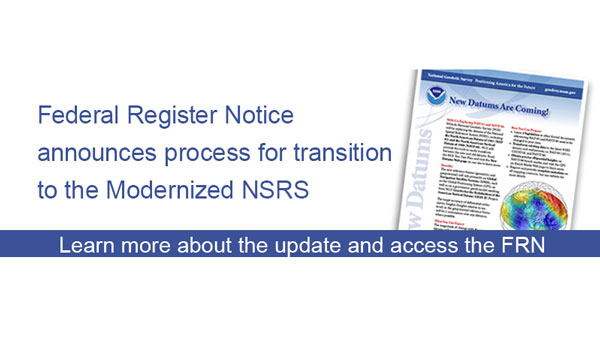
Well, it’s January 2025 and it’s almost here — that is, the release of the beta version of the new, modernized National Spatial Reference System (NSRS) – NATRF2022, PATRF2022, CATRF2022, MATRF2022 and NAPGD2022.
This newsletter will highlight some activities associated with the new NSRS. That said, this is short notice, but I would like to highlight that there is a webinar and workshop that will address the new NSRS scheduled for Jan. 9, 2025 — TRB workshop, “Navigating the Modernized National Spatial Reference System: A Geospatial Odyssey” and NGS webinar “Updates to Products and Models within the North American-Pacific Geopotential Datum of 2022.” I will provide more details on this later in the newsletter.
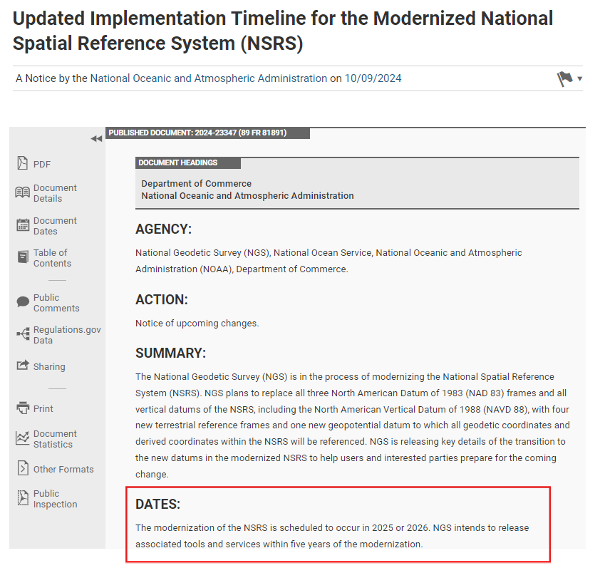
The modernization of the NSRS is scheduled to occur in 2025 or 2026. NGS intends to release associated tools and services within five years of the modernization. The following details from the Federal Register outline the process for the rollout of the modernized NSRS:
NGS plans to roll out components of the modernized NSRS in 2025 or 2026. As each component is released at beta.ngs.noaa.gov, it can be publicly tested with feedback provided to NGS. The testing will continue for at least six months after the final component is released on beta.ngs.noaa.gov.
Once testing is complete and all modernized NSRS components appear to be stable and correct, the Federal Geodetic Control Subcommittee (FGCS) will be asked to vote to approve the modernized NSRS (likely in 2026). If FGCS approves the modernized NSRS, NGS will publish an FRN announcing the approval of the modernized NSRS and begin a several-month process of transitioning all modernized NSRS components to the official website at geodesy.noaa.gov. During this transition, the beta website may be wiped of submitted data and no further submissions to the NGS IDB (the repository for the current NSRS) will be allowed.
Excerpt from Federal Register Notice. (Photo: Federal Register website)
What does “Only one major improvement to the current NSRS is expected during this time: ITRF2020 will be integrated in all products and services” mean? I understand that one product that ITRF 2020 will be integrated into is the NOAA CORS Network (NCN). The CORS coordinates and velocities will be updated with ITRF 2020 values. That said, NGS datasheets will still provide coordinates in NAD 83 (2011), epoch 2010.0.
As I’ve mentioned in previous newsletters, time really is running out and users need to obtain a working knowledge of the new, modernized National Spatial Reference System. For those attending the104th TRB Annual Meeting on Jan. 5-9, 2025, in Washington, D.C., there is a scheduled workshop on the modernized NSRS. The workshop is sponsored by TRB Geospatial Data Acquisition Technologies Committee (AKD70). The workshop, titled “Navigating the Modernized National Spatial Reference System: A Geospatial Odyssey,” will be held on Thursday, Jan. 9, 2025, from 9:00 am to noon, in room 202B in the Convention Center in Washington, D.C.
Thurs., Jan. 9, 2025 9:00 am to 12:00 pm Room 202B, Convention Center Washington, D.C.
This workshop will cover the following topics:
Why the NSRS is being updated
The key goals of the modernization effort
Timeline, standards and technology considerations
The Geospatial Data Act of 2018 and its impact
There will be a discussion about the replacement of the North American Datum of 1983 and vertical datums and implications for existing workflows
There will also be a discussion about use cases and practical scenarios, how to transition and how to leverage new technology and tools.
For those interested in more information on the TRB AKD70 committee, my August 2024 GPS World Newsletter highlighted activities associated with the Transportation Research Board’s ADK70 Standing Committee on Geospatial Data Acquisition Technologies.
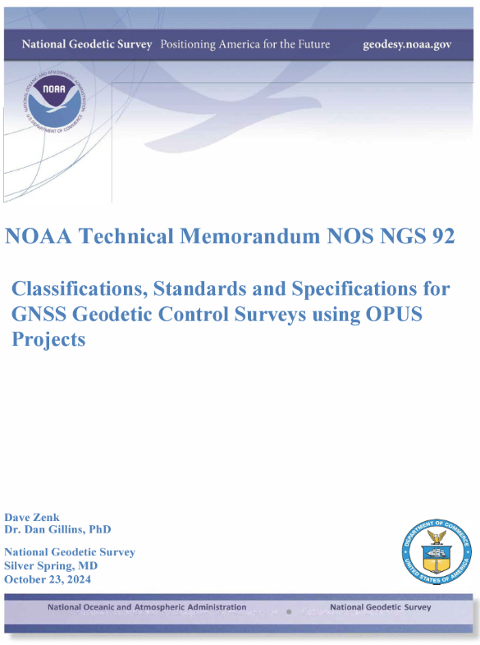
Since the new NSRS will be introduced this year, it is time for users of the NSRS to get familiar with the NOAA Technical Memorandum NOS NGS 92 document titled “Classifications, Standards and Specifications for GNSS Geodetic Control Surveys using OPUS Projects” written by Dave Zenk and Dan Gillins, Ph.D., National Geodetic Survey, published on Oct. 23, 2024. This document provides the specifications users must adhere to when submitting GNSS projects to NGS for review and publication.
Photo: NGS website
The section below explains the purpose of the document. There are a few items that I have highlighted in the preface that users should be aware of:
The document replaces NOAA Technical Memorandum NOS NGS 58 and NOAA Technical Memorandum NOS NGS 59
Users will need to follow these specifications for all projects that will be submitted to NGS using OPUS Projects for review and publication
This publication supplements Standards and Specifications for Geodetic Control Networks issued in September 1984 (Bossler 1984).
This publication replaces NOAA Technical Memorandum NOS NGS 58 Guidelines for Establishing GPS-Derived Ellipsoid Heights (Standards: 2 cm and 5 cm), Version 4.3 (Zilkoski et al. 1997) and also replaces NOAA Technical Memorandum NOS NGS 59 Guidelines for Establishing GPS-Derived Orthometric Heights (Zilkoski et al. 2008).
This publication provides classification, standards, and specifications for GNSS geodetic control surveys that use Global Navigation Satellite Systems (GNSS), which will be submitted to NGS using OPUS Projects for review and publication. These types of surveys were not well-established by the dates of the 1984, 1997, and 2008 publications, nor did OPUS Projects exist. In addition, since 2008 GNSS technology has improved and considerable research has been done into the best practices regarding these surveys and the analyses of achievable results (e.g., Allahyari et al. 2018; El Shouny and Miky 2019; Gillins and Eddy 2015, 2017; Gillins et al. 2019a; Gillins et al. 2019b; Jamieson and Gillins 2018; Park et al. 2018; Schenewerk et al. 2016; Soler and Wang 2016; Wang and Soler 2013; Wang et al. 2017; Weaver et al. 2018). That research supports this publication.
This publication is specifically limited to supporting OPUS Projects (version 5.x), the current North American Datum of 1983 (NAD 83), the North American Vertical Datum of 1988 (NAVD 88) and other current vertical datums that are officially recognized by NGS. Future versions of OPUS Projects and future datums will require revision of this publication.
I highlighted some important sections of the April 2023 webinar in my May 2023 newsletter. Future newsletters will address the specifications in more detail, but I would encourage readers to download the NGS 92 document and the April 13 webinar and slides.
On Dec. 18, 2024, NGS sent an email to individuals on NGS’s listserv informing them that they have made several updates to the NAPGD2022 products and that these updates are now available on the NGS alpha site.
NGS Dec. 18 newsletter. (Photo: NGS website)
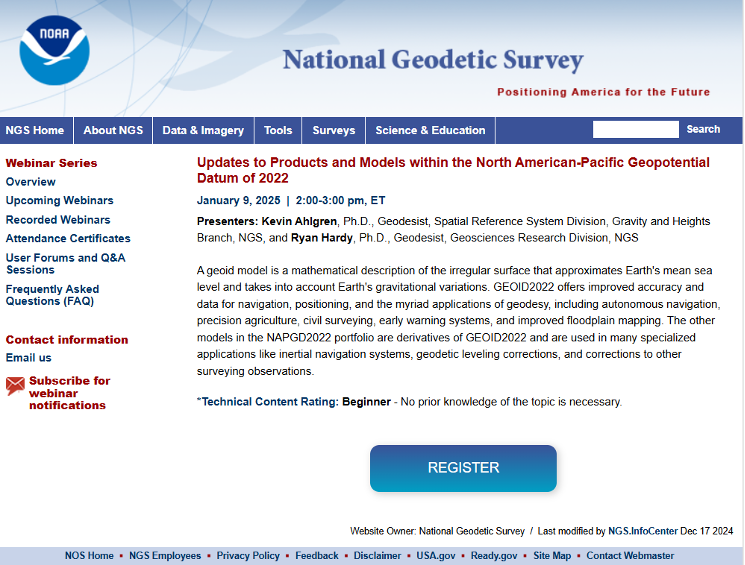
To explain the product updates, NGS has scheduled a webinar for Jan. 9, 2025, to discuss the North American-Pacific Geopotential Datum of 2022 (NAPGD2022).
As previously stated in my newsletters, users should obtain a working knowledge of the new, modernized National Spatial Reference System. NGS publicly given presentations that have been collected for public viewing can be downloaded here.
I would like to wish everyone a Happy New Year and a year filled with exciting opportunities.
The Overture Maps Foundation has released the general availability of its global transportation dataset. This dataset encompasses 86 million km of roads worldwide and is designed to support various industries, including automotive, logistics, navigation, urban planning and humanitarian response.
The transportation dataset incorporates detailed information from multiple sources:
Aerial imagery for accurate road representations
Clear road routes with recognizable highway signs
Comprehensive rail and ferry route information
Complex traffic rules and restrictions
Building upon OpenStreetMap data, Overture has re-engineered the data structure to create a more stable dataset with a documented schema, the company said.
Data enhancements
Overture has implemented several improvements to the OSM data, including:
Normalization: The dataset adheres to a standard set of attributes, ensuring uniformity across features such as right turns and speed limits. This seeks to facilitate simplified analysis, interpretation and use of the data.
Global Entity Reference System (GERS): Overture has introduced unique identifiers through a linear reference system. This allows users to attach external data, such as accident reports or road construction updates, to specific road segments with precise location information.
According to Overture, the transportation dataset will undergo continuous updates and improvements. Future enhancements will leverage artificial intelligence and other open data sources to maintain and expand the dataset’s accuracy and completeness.
A roundup of recent products in the GNSS and inertial positioning industry from the December 2024 issue of GPS World magazine.
Mapping
Photo: SPH Engineering
GPR System For terrestrial and airborne applications
The Zond Aero 500 NG is a versatile ground penetrating radar (GPR) system designed for both terrestrial and drone-mounted surveys, suitable for applications such as utility scanning, sinkhole detection, glaciology and geological studies. It operates in dual mode, allowing for ground-based and airborne surveys, enhancing data collection flexibility. Key specifications include a center frequency of 500 MHz, an operating bandwidth of 200 MHz – 900 MHz, a sampling rate of 25,600 samples per second and a scan rate of 50 scans per second, with depth penetration up to 4 meters in average soil conditions. The system features advanced electronics for real-time data collection, which can significantly improve the signal-to-noise ratio. It is compatible with DJI Matrice 300/350 UAVs for airborne applications.
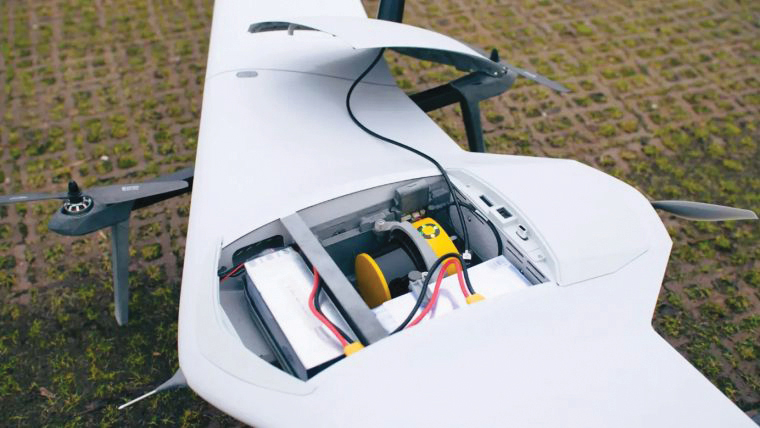
Streamlined Lidar Mapping YellowScan’s Surveyor Ultra integrated with DeltaQuad Evo
Integrating YellowScan’s Surveyor Ultra with the DeltaQuad Evo platform allows users to collect high-precision, high-density data across 1,200 hectares in a single flight while simultaneously capturing lidar and RGB data.
DeltaQuad Evo’s long-range flight capabilities and efficient vertical take-off and landing (VTOL) design, paired with the Surveyor Ultra’s lidar technology, allow users to streamline their workflows to reduce time spent in the air and on post-processing tasks, making it particularly beneficial for large infrastructure projects, forestry analysis and environmental monitoring. The system can be used for surveying, construction, forestry and environmental research.
Airborne Mapping System With a ‘cross-fire’ scan pattern
The VQ-1560 III-S is a dual-channel laser scanning system designed for airborne mapping applications. Its “cross-fire” scan pattern allows for simultaneous forward and backward viewing at the edges of the swath, along with a nadir view in the center. This configuration optimizes point distribution for effective target sampling. With pulse repetition rates reaching up to 4.4 MHz, the VQ-1560 III-S can operate at altitudes of up to 1,600 m above ground level (AGL). At a lower pulse repetition rate of 560 kHz, it can function at altitudes as high as 3,900 m AGL.
The system features inertial measurement unit (IMU) and GNSS integration, with the option to include one or two high-resolution RGB/NIR cameras. It is ideal for professionals in fields such as urban planning, forestry and environmental monitoring.
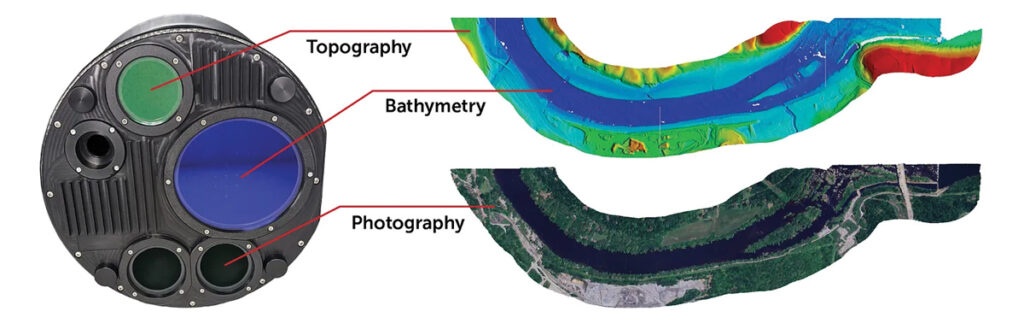
This bathymetric lidar system is designed for coastal and inland water mapping. It combines high-resolution topographic and bathymetric capabilities, allowing for seamless data collection across land and sea. It can be used for coastal zone management, environmental monitoring, infrastructure planning and more.
Fathom delivers data quickly by leveraging real-time quality control with Onboard and scalable processing with a CARIS workflow. It also includes a built-in topographic lidar and a multispectral camera for coastal surveys at a coverage of 50 km2/hour.
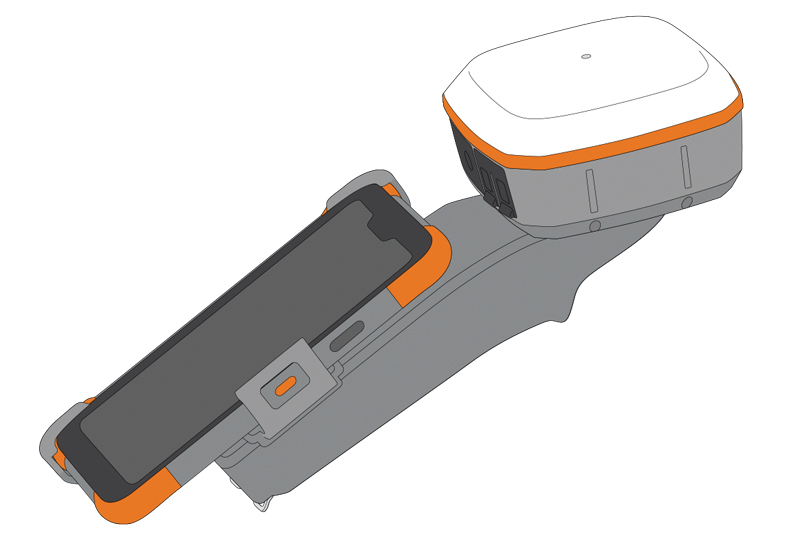
The Geode Grip is a mounting accessory featuring a specialized bracket. It allows users to securely attach smartphones directly to Juniper’s Geode GNSS receivers, offering an integrated and streamlined data collection solution.
The Geode Grip is a tool designed for professionals in surveying, mapping and geographic information systems (GIS) to enhance mobile data collection. It replaces the traditional survey pole with a handheld setup that aims to improve ergonomics. It is ideal for field projects that require precise location data and mobile data collection, such as environmental research, land surveying, agriculture and infrastructure engineering.
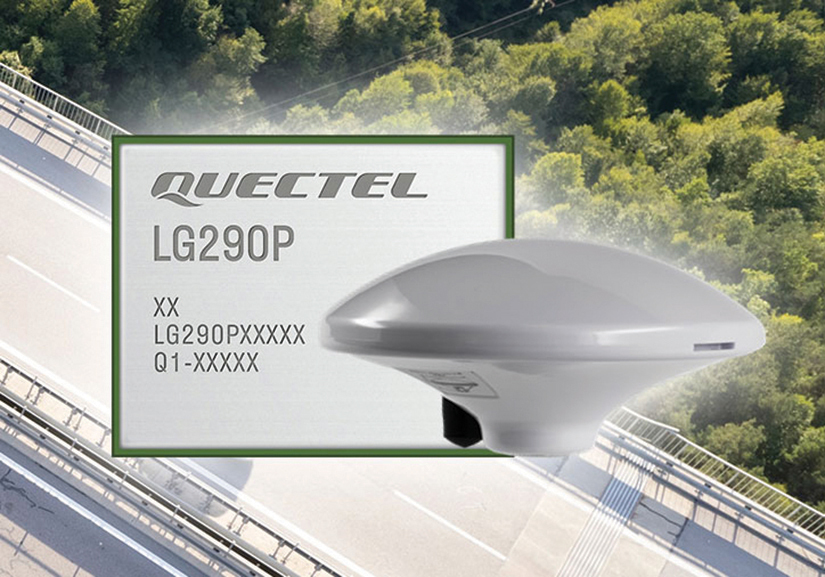
New Product Bundle For high-accuracy GNSS applications
Quectel Wireless Solutions has unveiled a new product bundle designed to facilitate the development of high-accuracy GNSS applications. The bundle includes the LG290P GNSS module, which is a quad-band, multi-constellation device capable of receiving signals from various satellite systems, including GPS, GLONASS, Galileo, BDS, QZSS and NavIC. The LG290P is engineered for high precision and supports RTK positioning, allowing for centimeter-level accuracy even in challenging environments. It can be used in diverse applications, such as autonomous vehicles, precision agriculture and surveying.
In addition to the LG290P module, the bundle includes options for either the YEGN103W8A geodetic antenna or the YEGD006U1A patch antenna. Both antennas are designed to operate within the same frequency bands as the GNSS module and are compliant with environmental regulations such as RoHS. This pre-integrated solution simplifies developers’ procurement and integration process by providing a one-stop solution that combines antennas with GNSS modules and RTK correction services.
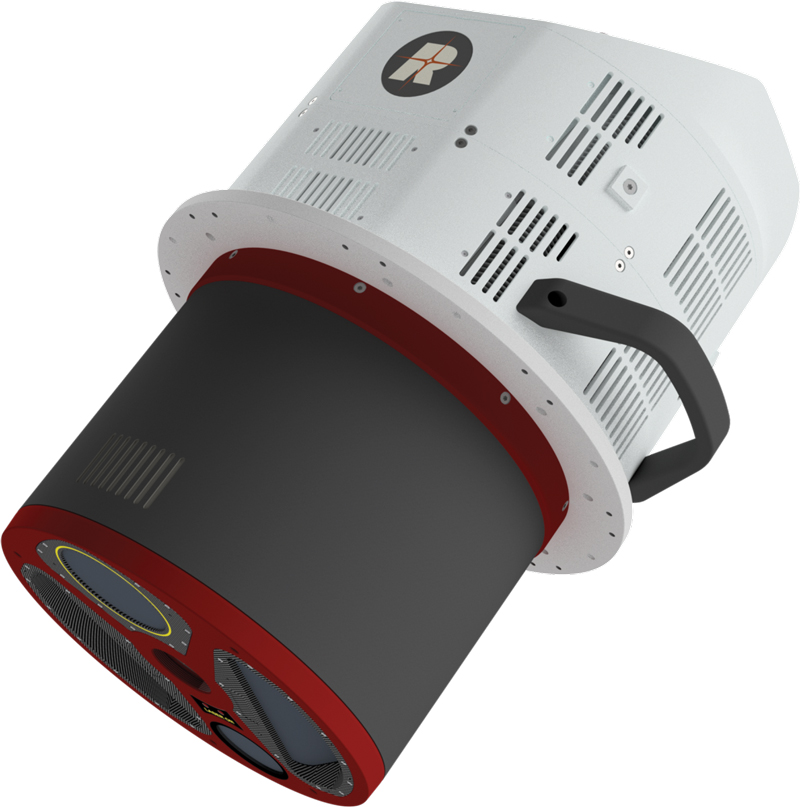
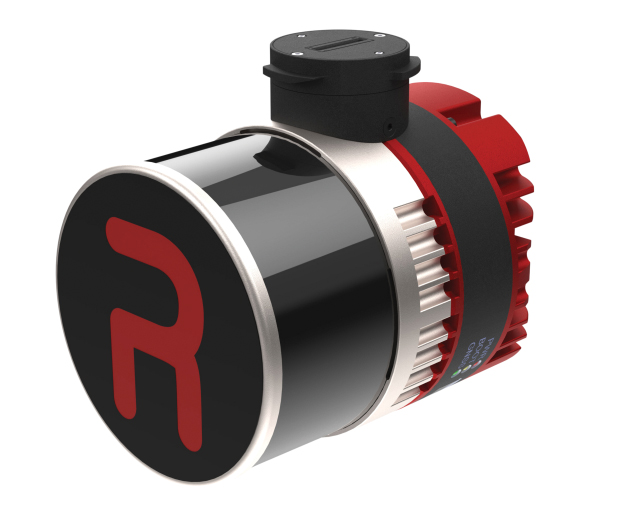
Lidar Camera Payload For surveying and mapping applications
The RESEPI Ultra LITE is a lightweight payload combining lidar and camera technology for advanced surveying and mapping applications. The system integrates the XT-32 lidar scanner to offer users advanced data accuracy and point density across various operational modes.
It has a compact design with a 5MP colorization camera, making it ideal for small unmanned aerial systems (SUAS) with strict volume constraints. It can be used for aerial and ground-based applications, including utility mapping, construction volumetrics, precision agriculture, forestry, site surveying and mining. Designed for seamless integration, the system is compatible with a wide range of platforms such as Freefly, WISPR, DJI, Sony and mobile setups. Inertial Labs’ proprietary SnapFit adapters ensure quick and secure mounting to enhance the system’s adaptability.
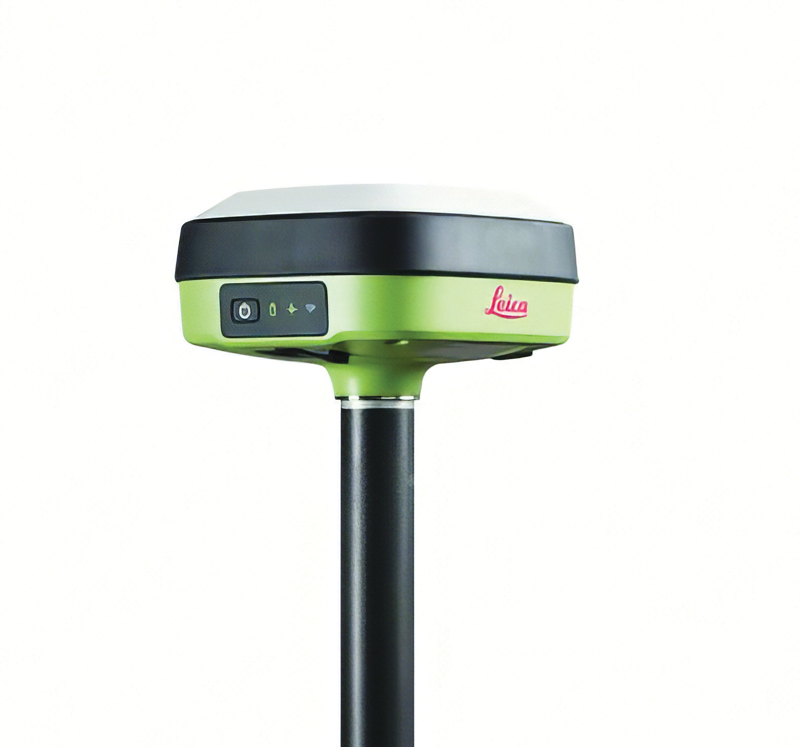
The Leica GS05 is a compact and lightweight GNSS smart antenna designed for surveying tasks, featuring calibration-free tilt compensation. This robust device allows for accurate measurements even when the survey pole is tilted up to 30°, enhancing data collection in challenging environments. Its integration with Leica Geosystems’ portfolio, including Leica Captivate software and total stations, seeks to maximize efficiency. The GS05 can function as both a base and an RTK rover, supporting single base stations and RTK networks such as Leica SmartNet.
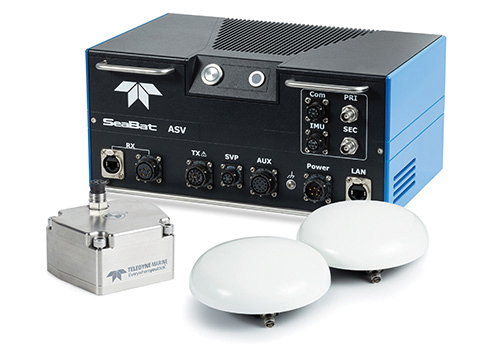
Intrepid is a GNSS/INS system integrated with the SeaBat T20-ASV processor and includes a compact IMU and two GNSS antennas, ensuring reliable and precise positioning.
It can automatically stream data to third-party software. This eliminates the need for manual sensor interfacing and reduces downtime. The Intrepid GNSS/INS benefits users in marine surveying applications by providing the precise navigation necessary for operational efficiency. Its intuitive design allows for simple configuration.
Miniature MEMS Sensor-Based IMU Can withstand high shock and vibrations
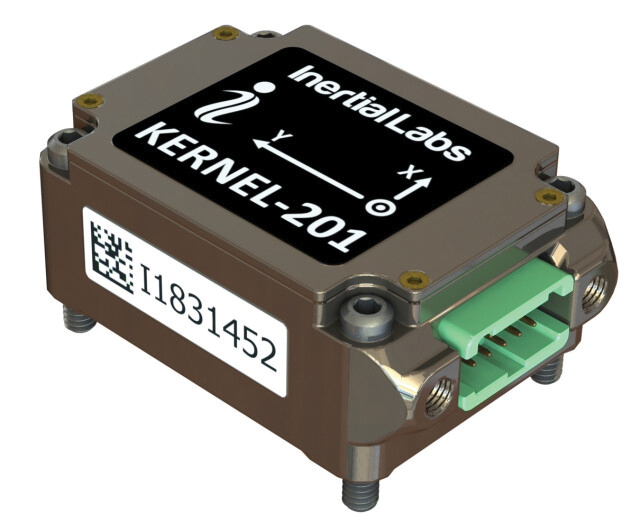
The KERNEL-201 features three-axis MEMS accelerometers and gyroscopes that offer ultra-low noise, high bandwidth and minimal latency. These characteristics make it ideal for applications such as pointing, stabilization and navigation in systems where performance and size are critical. Its volume of 0.38 cubic inches offers a high dynamic range.
Fully calibrated and temperature-compensated, the unit offers consistent, precise measurements even in challenging environments. It features an in-run bias stability of up to 0.7 deg/hr for gyroscopes and 0.005 mg for accelerometers, along with a low angular random walk (ARW) of 0.065°/√hr and velocity random walk (VRW) of 0.015 m/sec/√hr.
The unit is designed to withstand high shock and vibration while maintaining peak performance, making it suitable for a wide range of challenging applications. The KERNEL-201 can be integrated into various high-level systems, such as motion reference units (MRUs), GPS-aided inertial navigation systems (INS) and attitude and heading reference systems (AHRS). It offers continuous built-in testing (BIT), customizable communication protocols and flexible power options.
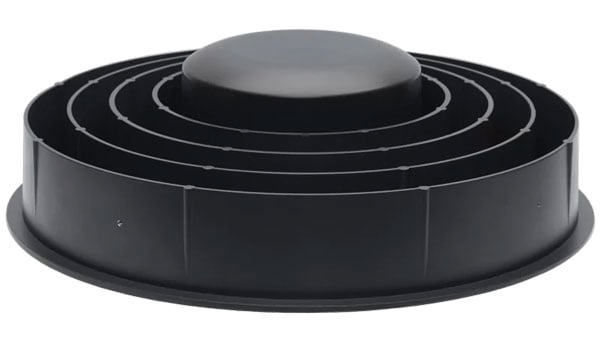
Smart Choke Antenna Offers comprehensive GNSS signal reception
The VCS6000XF full band smart choke antenna is engineered for CORS applications. It combines Tallysman Verachoke antenna elements with Septentrio’s Mosaic X5 full-band receiver to offer an integrated solution for OEM CORS systems.
The VCS6000XF offers comprehensive GNSS signal reception, including GPS/QZSS L1/L2/L5, GLONASS G1/G2/G3, Galileo E1/E5a/E5b/E6/E5 AltBoc, BeiDou B1/B2/B2a/B3, NavIC L5, SBAS and L-Band correction services.
The antenna features a 0.5 mm phase center variation and utilizes Calian’s eXtended filtering for near-band signal interference mitigation. The integrated Septentrio Mosaic X5 receiver provides capabilities such as anti-jamming, anti-spoofing, scintillation mitigation and receiver integrity by combining the antenna and receiver in the choke ring antenna.
My previous newsletter highlighted the Fall HSRP meeting that discussed how The Ohio State University and Michigan State University have made great progress in developing useful tools for the development and implementation of the new, modernized National Spatial Reference System (NSRS) in 2025. This newsletter will highlight the updates to vertical datums that The National Oceanic and Atmospheric Administration (NOAA) is working on.
Below is an excerpt of the agenda for the material that I will highlight in this newsletter. As I mentioned in my last newsletter, the HSRP website provides links to reference documents, presentations and recordings. I would encourage everyone to download the presentations or listen to the recordings to obtain all the details.
This newsletter will highlight the session on the vertical datums, including the International Great Lakes Datum (IGLD).
NGS has created a website that provides brief explanations with additional links for detailed information on the National Tidal Datum Epoch (NTDE), International Great Lakes Datum (IGLD) and Gravity for the Redefinition of the Vertical Datum (GRAV-D). The site highlights that NOAA is currently working on three major updates to vertical datums: the 1983-2001 NTDE, the International Great Lakes Datum of 1985 (IGLD 85), and the North American Vertical Datum of 1988 (NAVD 88). The site provides information on why the datums need to be updated.
Excerpt from NTDE. (Photo: NOS website)
The box titled “Excerpt from NTDE“ provides information about the NTDE. It explains what the NTDE is, what NOS is doing, and why the NTDE needs to be updated. If you click on the link titled “National Tidal Datum Epoch update” on the right side of the webpage, it provides more information and links about the NTDE update, such as how will the NTDE update impact you.
The National Tidal Datum Epoch (NTDE) is a 19-year time period established by the National Ocean Service for collecting observations on water levels and calculating tidal datum values (e.g. mean sea level, mean lower low water). The NTDE needs to be regularly revised to account for long-term effects of land movement, sea level rise, and changes in tidal constituents. Tidal datums and their data are used to generate products and services necessary for safe navigation, coastal hazard mitigation, ecosystem research, coastal engineering and marine boundary demarcations.
The NTDE Update: New Tidal Datums are Coming!
NOAA currently utilizes the 1983-2001 National Tidal Datum Epoch. This epoch is now undergoing revision and will be replaced by the fifth iteration of the NTDE. Measurements for the update will be based on water level data spanning the years 2002-2020. Once all data has been collected, NOAA will review, analyze, and generate revised datums. The current proposed release date for new NTDE products is after 2026.
The website also highlights two other NOS projects – the International Great Lakes Datum and the Gravity for the Redefinition of the Vertical Datum (GRAV-D). Again, if you click the “International Great Lakes Datum update” link on the right side of the webpage, it provides more information and links about the IGLD update such as how will the IGLD update impact you. Clicking the “Gravity for the Redefinition of the Vertical Datum” link on the right side of the webpage provides some more information and links about vertical datums.
Photo: MOS website Photo: NOS website
On the second day of the meeting, Jacob Heck, NOAA National Geodetic Survey (NGS), and Sierra Davis, NOAA Center for Operational Oceanographic Products & Services (CO-OPS), gave a presentation providing details on the update to the International Great Lakes Datums of 1985 (IGLD 85). The presentation addressed the following topics:
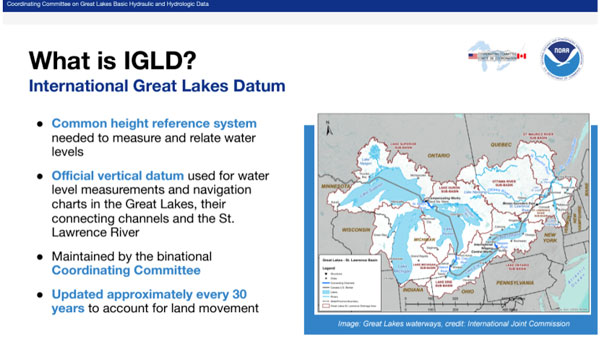
Define IGLD
Significance of the Great Lakes and need for a common water level datum
Binational coordination and mandates
Why IGLD needs to be updated
Updating the datum
Crucial observational infrastructure
Differences in IGLD (1985) and IGLD (2020)
Future of accessing the datum
Status of IGLD (2020) development
Project milestones to roll-out
Unresolved questions: low water datum
Outreach efforts underway
I have provided a few slides highlighting parts of the presentation. Again, the HSRP website provides links to reference documents, presentations, and recordings. I would encourage everyone to download the presentation or listen to the recording to obtain all the details. The presentation of the IGLD starts at 1:34:00 on the recording.
Photo: HSRP website
They explained the importance of the requirement for the coordination of water levels on the Great Lakes between Canada and the United States and the reason for establishing an international datum.
Photo: HSRP website
Due to land deformation, the IGLD is periodically updated, typically every 25 to 30 years. That is, an uplift in the northern region and subsidence in the southern region of the Great Lakes. See the box titled “Land Deformation in the Great Lakes.”
Land deformation in the Great Lakes. (Photo: HSRP website)
The IGLD was updated in 1955 and then again in 1985. This update is overdue by a few years. That said, it will be aligned with the new modernized NSRS and allow for more seamless updates in the future.
Photo: HSRP website
The presentation highlighted that the expected changes between the old datum, IGLD 85, and the new datum (IGLD 2020) will range from 30 cm to 65 cm.
Photo: HSRP website
The IGLD community measures hydraulic heads for water management using dynamic heights, not orthometric heights. The presentation explained why IGLD uses dynamic heights and how GNSS technology will be used to estimate IGLD dynamic heights.
The IGLD team have been working on getting the message out to the user community. The September 2024 HSRP presentation is just one example. Here’s a summary of the recent and future outreach activities:
Recent engagements:
All-Interested Congressional briefing (May 2024)
Canadian Hydrographic Conference (May 2024)
Canadian Geophysical Union Conference (May 2024)
IAGLR (May 2024)
Soo Locks Engineers Day (June 2024)
Michigan Sea Grant briefing (Jan 2024)
Illinois Coastal Management Program briefing (Sept 2024)
Upcoming:
Coordinating Committee’s ESG (TBD)
Boards of Control (Spring 2025)
2024 Great Lakes Conference, Chicago, IL
US Hydro 2025, Wilmington, NC
IAGLR 2025
The slide titled “Key Takeaways” summarized the essence of their presentation.
This newsletter highlighted NOS’s Tail of Three Datum website. The website provides brief explanations with additional links for detailed information on the National Tidal Datum Epoch (NTDE), International Great Lakes Datum (IGLD), and Gravity for the Redefinition of the Vertical Datum (GRAV-D). The site highlights that NOAA is currently working on updating the 1983-2001 NTDE, IGLD 85, and North American Vertical Datum of 1988 (NAVD 88). The newsletter also discussed the presentation on the International Great Lakes Datum (IGLD) 2020 that was given at the 2024 Fall HSRP meeting. Again, the HSRP website provides links to reference documents, presentations, and recordings. I would encourage everyone to download the presentations or listen to the recordings to obtain all the details.
The automotive navigation of tomorrow is highly connected and capable of dynamically using high-resolution map information and vehicle and environmental data from the cloud. It is an enabler for powerful driver assistance, intelligent e-mobility and autonomous driving. As a global provider of software engineering services for the mobility industry, Intellias is involved in many of these developments.
Although obtaining mapping and navigation data is easier today than it was 10 years ago — thanks to dashcams, UAVs and satellites — collecting this data is still labor-intensive. Even if most corners of the world are already recorded in public and private geographic information systems (GIS), the maps still need to be maintained regularly. Data accuracy and timeliness are the two biggest challenges in the mobility industry, followed by coverage, as the physical world is constantly evolving. To meet these requirements, the evolution of navigation and digital mapping is gathering pace. The following six technology and deployment trends will drive automotive mapping and navigation in the coming years.
1. Enriching Mapping Data With AI
Satellite imagery was a breakthrough for map creation. The wrinkle, however, is that most mapping software cannot work directly with satellite photos. Visual data first needs to be codified into comprehensive navigation datasets in a suitable format such as the Navigation Data Standard (NDS). Then map owners must keep it up to date. Both processes are costly and labor-intensive, making them great use cases for artificial intelligence (AI) in mapping.
AI algorithms improve the speed and precision of digital map building by offering the ability to update maps more regularly and map new areas faster. They can classify objects in satellite images — buildings, roads, vegetation — to create enriched 2D digital maps as well as multi-layer 3D map models. With precise maps, you can delight users with better ETAs, detailed fuel or energy usage estimates, and richer point-of-interest information.
Apart from facilitating the collection of mapping data, AI can also help with generating such data. Researchers from MIT and the Qatar Computing Research Institute (QCRI) recently released RoadTagger. This neural network can automatically predict the road type (residential or highway) and number of lanes even with visual obstructions present, such as a tree or building. The model was tested on occluded roads from digital maps of 20 U.S. cities. It correctly predicted the number of lanes with 77% accuracy and predicted road types with 93% accuracy.
That said, sensor data collection from connected vehicles isn’t going anywhere. OEMs are increasingly relying on their fleets to collect new insights for digital map creation, and this process is becoming easier with advances in machine learning. HERE Technologies recently presented UniMap — a new AI-driven technology for faster sensor data processing and map creation. The new solution can effectively extract map features in 2D and 3D formats, then combine them with earlier map versions. This unified map content data model allows new digital maps to be available in 24 hours.
Photo: Intellias
2. NDS.Live: From offline databases to distributed map data systems
Conventional onboard navigation systems are designed, developed and integrated with proprietary databases, which become obsolete with every new product generation. NDS.Live is the new global standard for map data in the automotive ecosystem, promoting the transition from offline to hybrid/online navigation. It minimizes the complexities of supporting different data models, storage formats, interfaces and protocols with one flexible specification. NDS.Live is not a database, but a distributed map data system.
NDS.Live was co-developed by global OEMs and tech leaders, including Intellias, Daimler, HERE, Denso, Renault and TomTom are among those who have already adopted it. For example, second-generation Mercedes-Benz User Experience (MBUX) systems are powered by NDS.Live. The distributed map data system provides fresh information for the driver assistance system, which gets visualized as augmented reality (AR) instructions on the head-up display (HUD). NDS.Live can help massively improve the navigation experience for EVs and regular connected vehicles. It also helps OEMs deploy value-added subscriptions for assisted driving and navigation.
3. 3D and HD map generation
3D maps enable accurate rendering of physical objects in a three-dimensional form. High-definition (HD) maps feature detailed information about road features (lane placements, road boundaries) and terrain type (severity of curves, gradient of the road surface). Both types of maps are essential for launching advanced ADAS features and, ultimately, ushering in the era of autonomous driving.
3D maps define how the vehicle moves and help it interpret the data it receives from onboard sensors. Since most sensors have a limited range, HD maps assist by providing the navigation system with extra information on road features, terrain and other traffic-relevant objects.
The bottleneck of both HD and 3D mapping is collecting and rendering data. In the case of 3D maps, you need to capture video in real time from multiple cameras, plan for interference due to vibration, temperature and hardware issues, and then repeat the process across billions of kilometers of roads across the globe. Rather than doing this huge task alone, mobility players and OEMs join forces:
• HERE and Mobileye, for example, partnered to crowdsource HD mapping data collection, with VW joining later. Mobileye developed a compact, high-performance computer vision system-on-chip called EyeQ. Installed by more than 50 OEMs across 300 vehicle models, the system supplies Mobileye with ample visual data they can then render into maps with the help of partners.
• TomTom, in turn, teamed up with Qualcomm Technologies to crowdsource HD mapping insights from its users. Qualcomm provides the underlying cloud-based platform for making and maintaining HD maps from various sources, including swarms of connected vehicles.
Photo: Intellias
4. Autonomous driving simulations
Autonomous vehicles require extensive road and track tests to pass security checks. Manufacturers also need to simulate near-crash events without putting anyone in danger. Hyper-realistic virtual worlds can be much safer testbeds for autonomous vehicles (AVs) — especially as virtualization technology improves.
A group of researchers released an open-source, data-driven simulation engine for building photorealistic environments for AV training. The engine can simulate complex sensor types including 2D RGB cameras and 3D lidar, as well as generate dynamic scenarios with several vehicles present. With the new engine, users can simulate complex driving tasks such as overtaking and following.
Waymo takes a similar approach of using real-world data collected from vehicle cameras and sensors to create highly detailed virtual testbeds. The Waymo team has built virtual replicas of several intersections complete with identical dimensions, lanes, curbs and traffic lights. During simulations, Waymo algorithms can be trained to perform the most challenging interactions thousands of times, using the same or different driving conditions and different vehicles from its fleet.
To perfect the performance of the algorithm, the team uses a fuzzing technique. During training sessions, engineers alternate the speed of other vehicles, traffic light timing and the presence or absence of zig-zagging joggers and casual cyclists. Once the Waymo algorithm learns the trick of driving through a specific intersection with a flashing yellow arrow, the “skill” becomes part of the knowledge base, shared with every vehicle across the fleet.
The new generation of high-fidelity 3D environments can be built with data from different sensor types to effectively convey all details of the material world to the algorithm. Existing 3D visual databases already include realistic details for traffic signs, pavement markings and road textures. With machine learning and deep learning algorithms, complex ADAS/AD scenarios can simulate close to real-life conditions.
Photo: Intellias
5. Digital twins of road infrastructure
While OEMs leverage dashcam data collection for building better navigation systems, transportation managers use the same intelligence to digitize road infrastructure. A digital twin is an interactive, virtual representation of physical assets or systems such as a smart traffic light network or smart parking facilities. Powered by real-time data, digital twins of road infrastructure can enable advanced urban planning scenarios. This includes dynamic traffic light signal optimization to reduce congestion as well as prioritized public and service transport management and accurate traffic predictions to optimize planning, signage, construction work schedules, etc.
Low latency is crucial for autonomous driving. Yet 3D map generation on the edge requires substantial computing power. Moreover, vehicles cannot store all mapping data on their route and need to constantly receive over-the-air updates. A group of researchers has proposed placing compact map distribution devices on roadside edges to facilitate point cloud data (PCD) map delivery on the go. The results show that autonomous vehicles can perform self-localization while downloading PCD maps. This system allows autonomous vehicles to receive dynamic new maps for each new destination instead of storing tremendous data records onboard.
6. AR in HUD navigation products
The latest vehicles have an upgraded human-machine interface (HMI)design, featuring new hardware and software elements that allow for AR navigation. AR in HUDs can deliver all standard information from static displays (driving speed, status of the ADAS system, fuel or charge levels), alongside dynamic routing instructions, including information on traffic signs, speed limits, construction work alerts and ETAs.
Overall, AR navigation systems can help drivers make better decisions on the road. A recent comparative study found that drivers using AR-augmented HUDs made fewer errors and drove faster on average than those using conventional HUDs. Participants also rated AR HUD instructions as more useful and easier to understand.
The next advance in navigation will be holographic displays, offering AR instructions in 3D. Advances in lidar technologies already allow for projecting ultra-HD holographic representations of road objects in real time into the driver’s field of view. Such systems can enable shorter obstacle visualization times and reduce driving-related stress, according to Tech Explore.
Brian Thompson, the CEO of UnitedHealthcare, was shot to death on Dec. 4 outside the New York Hilton Midtown in Manhattan, where the company was hosting an investor day. The suspect fled northward on 6th Avenue on a bike toward Central Park and is still unidentified.
Police initially believed the suspect fled on a Citi Bike, which is equipped with GPS tracking devices. However, it was later clarified that the suspect used a regular electric bike, not a Citi Bike, eliminating the possibility of GPS tracking through the bike-sharing system.
Many e-bikes do not come with built-in GPS trackers. While some newer models have integrated GPS units, aftermarket trackers must be installed separately on most e-bikes.
Even if the e-bike had a GPS tracker, its effectiveness would depend on whether it was active and connected to a cellular network to transmit location data.
Despite this setback, investigators are still utilizing various technological methods to track the suspect. Police are analyzing video from street cameras and other sources to trace the suspect’s escape route. Additionally, a cell phone was recovered from the alley where the suspect fled, which could potentially provide valuable information. The suspect was spotted on surveillance video carrying an e-bike battery less than two hours before the shooting, which might offer additional leads.
While GPS tracking through the bike is no longer an option, law enforcement is leveraging other technological resources and traditional investigative methods to locate the suspect.
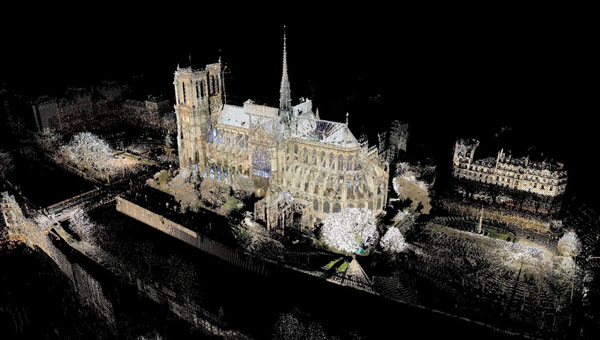
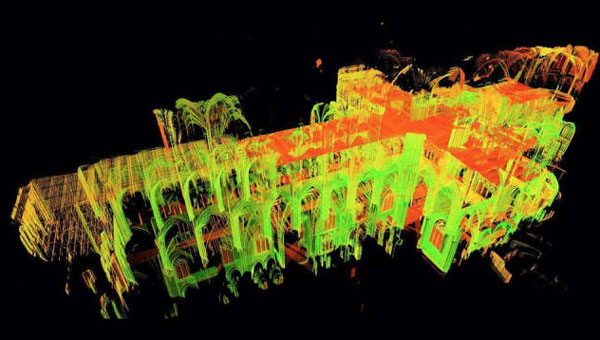
3D model of the Notre Dame Cathedral. (Image: Andrew Tallon/Vassar College)
Notre Dame Cathedral in Paris has reopened its doors five years after the devastating fire, showcasing its restored interior after extensive rebuilding work. The restoration, costing approximately €700 million ($737 million), was financed entirely by donations from around the world.
On April 15, 2019, Notre Dame went up in flames, with the spire collapsing and the roof being destroyed. The following years were dedicated to rebuilding the cathedral, including the reconstruction of the spire and the restoration of stained glass and woodwork.
A crucial element in the restoration process was the point cloud data collected by professor Andrew Tallon, an architectural historian from Vassar College, in 2010. Tallon’s project, which aimed to fully understand the Gothic structure and identify structural anomalies, involved creating a precise 3D model of Notre Dame using a Leica Geosystems terrestrial laser scanner.
This cloud of 1 billion points proved indispensable for the digital recreation of the cathedral’s interior and exterior. Tallon’s laser scans were the only truly accurate as-built measurements of Notre Dame, translating point clouds into detailed representations of its buttresses, ribbed vaults, stained glass, ornate carvings and other architectural details.
The value of point cloud data
While modern restoration efforts cannot fully replicate the artistry of centuries past, Tallon’s scans have been instrumental in reconstructing the Gothic cathedral, allowing architects to come remarkably close. Although Tallon died in 2018, his groundbreaking work remained a vital resource for restoring the iconic cathedral.
A point-cloud scan taken from Andrew Tallon’s scans of the Notre Dame Cathedral. (Photo: courtesy of Vassar University)
Tallon’s meticulous 3D scans of Notre Dame provided architects with information crucial for the cathedral’s reconstruction, including:
Precise 3D models: Tallon’s precise 3D model of Notre Dame included intricate details of the cathedral’s architecture, such as flying buttresses, rib vaults, stained glass windows and ornate carvings. This level of detail was unmatched by any historical drawings or records, which often lacked precision.
Dimensional and formal reconstruction: Pascal Prunet, one of the architects tasked with rebuilding the cathedral, said in an interview with Lindsay S. Cook that the point cloud data provided an “exact trace” of the cathedral’s state at the time of scanning, allowing him and his team to reconstruct elements — such as the vaults — “without hesitation” regarding dimensions or forms. This was essential for accurately rebuilding complex structures such as flying buttresses and rib vaults.
Structural analysis: The scans revealed structural details that were previously unknown, aiding in understanding how the cathedral was originally constructed and how it changed over time. This information was vital for designing custom supports and ensuring structural stability during reconstruction.
Integration with modern technology: The point cloud data was integrated into Building Information Modeling (BIM) processes, which allowed architects to create a digital twin of Notre Dame.
Restoration guidance: The scans provided a highly detailed record of Notre Dame’s pre-fire condition, which helped restoration professionals select appropriate techniques for stabilizing and rebuilding various parts of the cathedral.
Why precision matters
The two architects highlighted the crucial role Tallon’s laser scan of the cathedral played in their restoration process. They shared how this detailed digital model provided them with precise measurements and structural information, enabling Notre Dame to, in essence, “guide its own restoration.” By relying on this accurate data, the team could ensure its work remained faithful to the iconic cathedral’s original design and construction.
Tallon’s laser scan of Notre Dame Cathedral has proven invaluable in the restoration process. This digital twin, created in 2015, offers an unparalleled level of precision and detail, capturing the cathedral’s every nuance with accuracy up to 5 mm. This level of detail allows the restoration team to address the structure’s complexities and make informed decisions about the rebuilding process, ultimately helping to preserve Notre Dame’s authenticity and historical integrity.