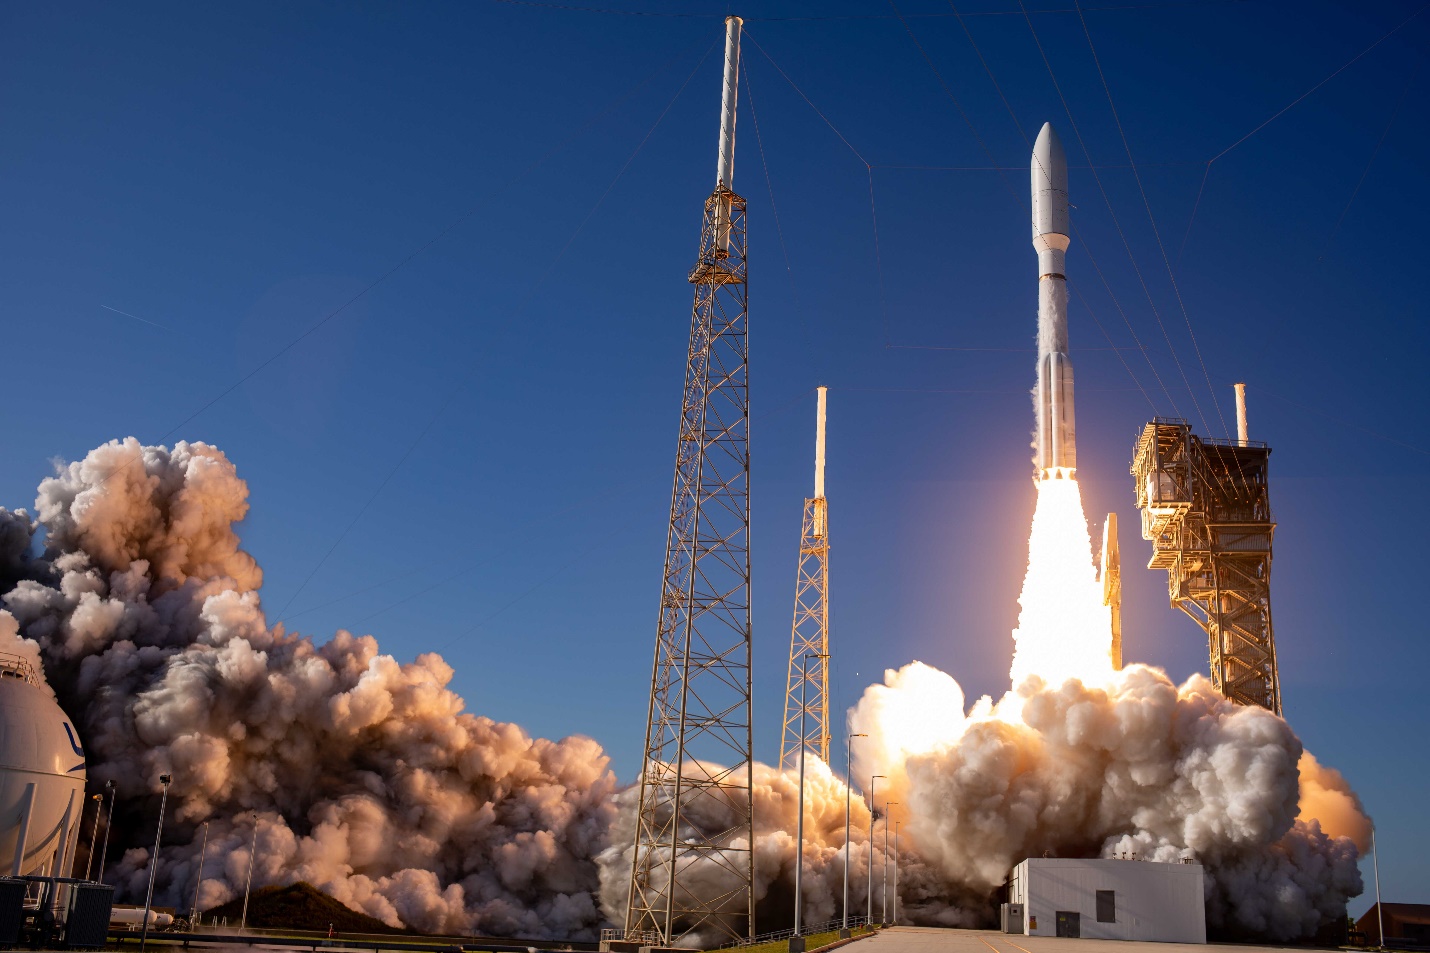
Space Systems Command (SSC), the National Reconnaissance Office (NRO), United Launch Alliance (ULA) and their mission partners successfully launched the “Silent Barker”/NROL-107 mission aboard an Atlas V rocket September 10, 2023, at 8:47 a.m. EDT from Space Launch Complex (SLC)-41 at Cape Canaveral Space Force Station, Florida.
The spacecraft was part of the Space Force’s Silent Barker satellite constellation network intended to provide space situational awareness, orbital surveillance and tracking.
According to a statement by ULA, Silent Barker is designed to detect and maintain custody of space objects. This capability enables indications and warnings of threats against high-value assets in geosynchronous orbit.
The mission aims to serves the needs of the U.S. Department of Defense and intelligence community by providing the capability to search, detect and track objects from a space-based censor for timely custody and event detection, the company said.
Surveillance from space allows the government to overcome existing ground sensor limitations and will enable the collection of timely satellite metric data around the clock.
One more Atlas V 551 remains in the NSSL inventory as the Space Force approaches the end of Atlas.
Beep Inc, a provider of autonomous shared mobility solutions, and Oxa, an autonomous vehicle software developer, have partnered to deploy autonomous vehicles driven by Oxa in the United States. The collaboration marks Oxa’s entry into the U.S. market.
Under the partnership, Oxa’s autonomy software will be installed in a variety of vehicle types operated by Beep, from current passenger shuttles to future vehicle platforms.
The Oxa Driver is a software platform that combines sensor data from cameras, lidar, and radar to gain a more comprehensive view of the world around it when compared to vehicles that rely on cameras alone. This software uses AI to accurately sense and predict changes to the vehicle’s environment while learning from previous journeys.
Two of the Beep shuttles featuring Oxa software are currently operating at the recently opened SunTrax test facility in Auburndale, Florida, — the first location in the United States specifically designed for connected autonomous vehicle and standard automotive testing in a single site.
Oxa is using the facility to showcase its passenger transportation solution ahead of public availability in late 2023.
“Seen & Heard” is a monthly feature of GPS World magazine, traveling the world to capture interesting and unusual news stories involving the GNSS/PNT industry.
Researchers at the University of Connecticut have conducted one of the largest understory species mapping projects using satellite data and have published the results of the study in the Remote Sensing of Environment journal. In this study, the researchers proposed an automated dense Sentinel-2 time series-based approach for understory plant communities and created maps of four understory classes that include native shrubs of greenbrier and mountain laurel, invasive shrubs of barberry, and the assemblage of mixed invasives at 10 m resolution in Connecticut’s deciduous forests. The researchers developed a strategy that distinguished plant species with an accuracy of 93% and determined that 53% of Connecticut’s understory is now comprised of invasive plant species such as barberry, bittersweet, winged euonymus (burning bush), and multi-flora rose.
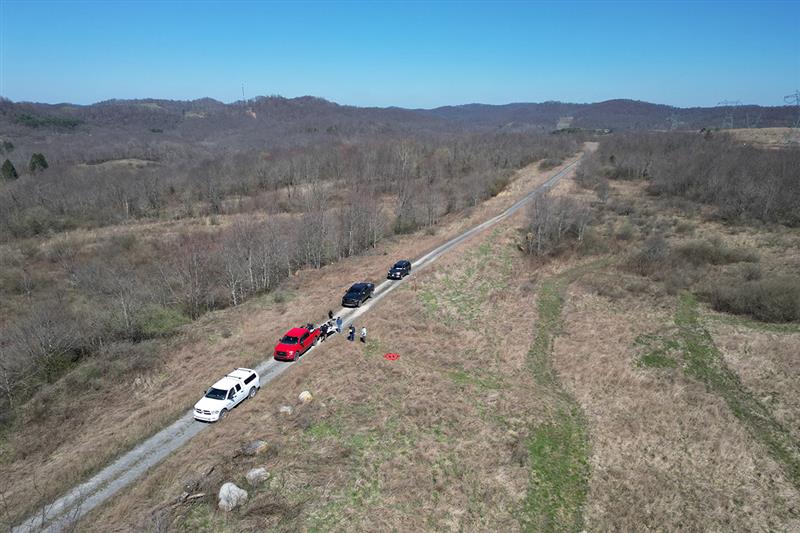
Invasive Species VS. UAVs
Image: Donn Bartram
Researchers at West Virginia University are using UAVs to develop tools to detect, map, treat and monitor invasive plant species with a grant from the Richard King Mellon Foundation. Multiflora rose is an invasive shrub that threatens native plants in more than 40 states, including West Virginia and Pennsylvania. This project aims to equip UAVs with sensors to collect environmental data in a designated area of southwestern Pennsylvania over multiple seasons. The research team will use that data, combined with machine learning technology, to develop software that can identify multiflora rose and, eventually, other invasive species.
Protecting Farms with GIS
Image: Daniel Balakov/E+/Getty Images
American Farmland Trust (AFT) is partnering with government agencies and advocacy groups in South Carolina to deploy GIS mapping tools to predict areas at the highest risk of development in the state. Palmetto 2040: Visioning Alternative Futures, Launching Solutions is a geospatial modeling and policy analysis tool designed to identify and model future outcomes. This mapping tool will project what land in South Carolina is at highest risk of development by 2040. The analysis will consider both rapid population growth and climate change impact on settlement patterns and agriculture, according to AFT.
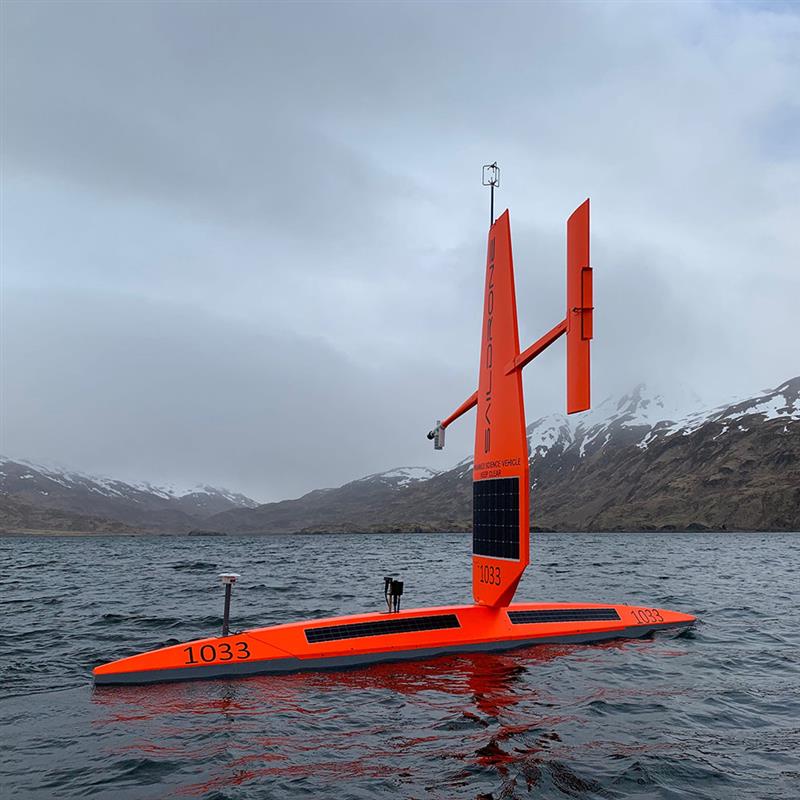
USV Take Hurricanes
Image: SailDrone
Saildrone is deploying 12 uncrewed surface vehicles (USV) into the tropical Atlantic and Gulf of Mexico this summer, supporting research by the National Oceanic and Atmospheric Administration (NOAA) to advance hurricane forecasting. Ten USVs will be deployed from St. Thomas, U.S. Virgin Islands; St. Petersburg, Florida; and Charleston, South Carolina; to operate in areas with a high probability of intercepting a storm, as indicated by historical data. Two vehicles will remain on land, ready for quick deployment in the event of an approaching hurricane. NOAA will use the data collected by the USVs to improve hurricane forecast models.
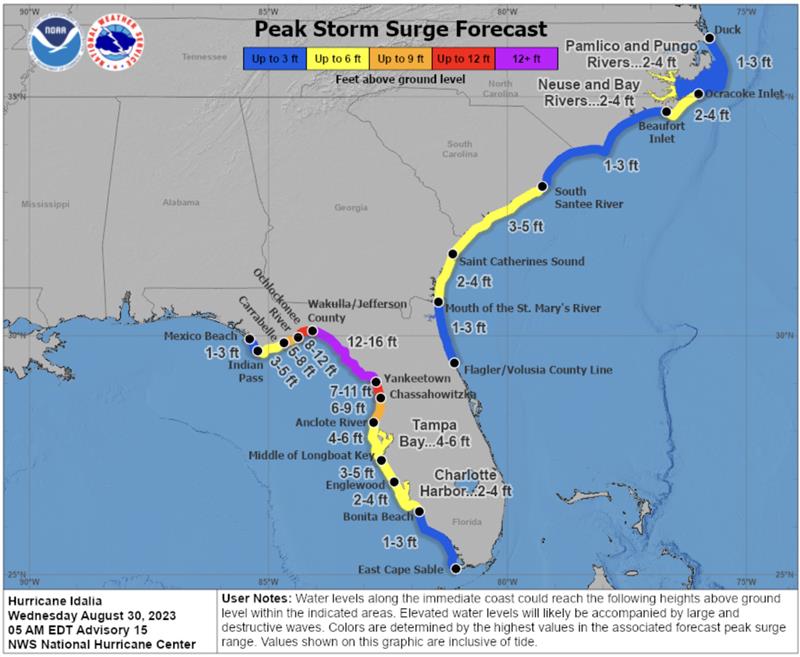
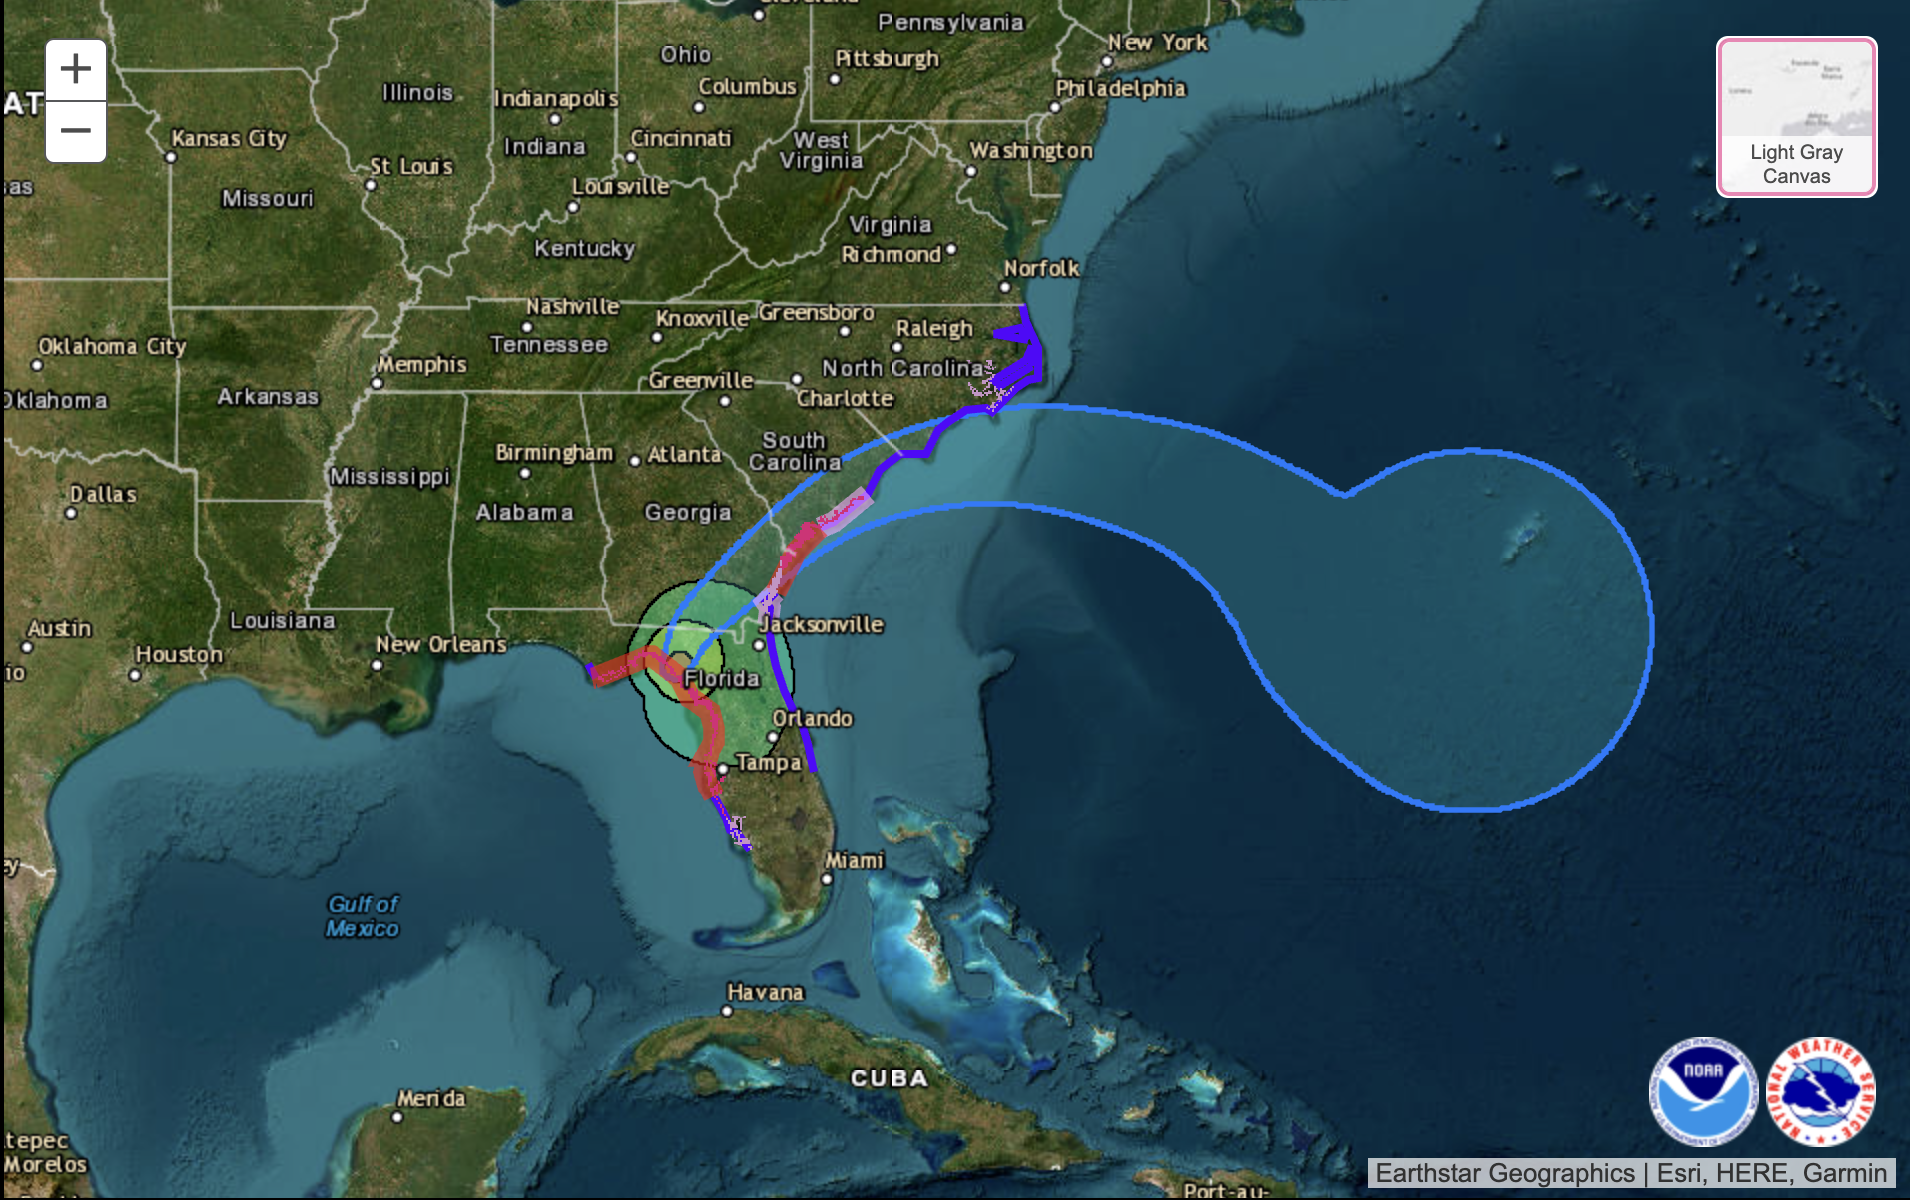
According to the U.S. National Hurricane Center (NHC), Hurricane Idalia made landfall along the Gulf Coast of Florida around 7:45 a.m. EDT on August 30 as a Category 3 hurricane. The NHC is continuing to map the storm’s path, and as of 9:00 a.m. EDT, a catastrophic storm surge was occurring with damaging winds spreading inland over Northern Florida.
Idalia is expected to bring excessive rainfall along its path from Florida through the Carolinas. The heavy rain could shift depending on the storm’s exact path.
Peak storm surge forecast in Florida. (Image: National Hurricane Center)
This hurricane and future storms this hurricane season, have the potential to become supercharged as sea surface temperatures have clocked record high temperatures.
Idalia is the ninth named storm to form in the Atlantic in 2023.
In late May, the National Oceanic and Atmospheric Administration (NOAA) predicted that there would be 12 to 17 named storms this year. However, on Aug. 10, NOAA revised its estimate to 14 to 21 storms.
There were 14 named storms last year, after two extremely busy Atlantic hurricane seasons in which forecasters ran out of names and had to resort to backup lists, reported The New York Times.
Readers can stay updated with Hurricane Idalia at the NHC website.
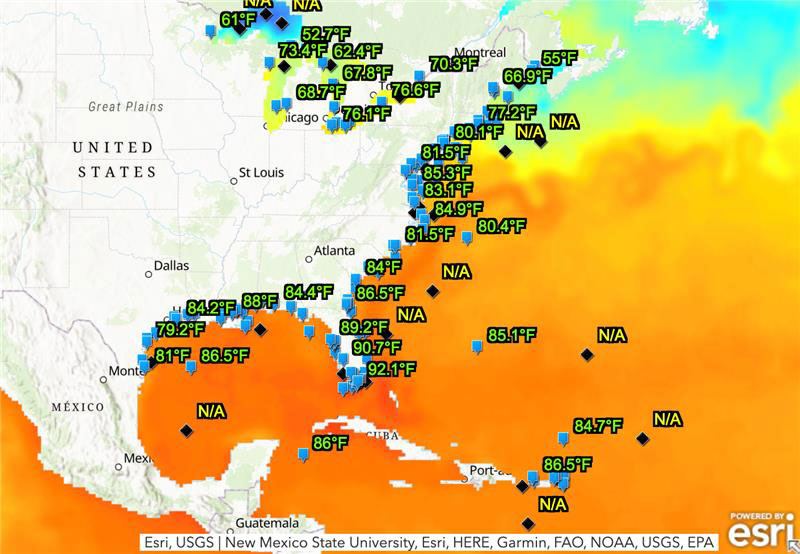
The ocean off the Gulf of Mexico is undergoing a marine heat wave that could pose a threat to coral reefs, as water temperatures reach 90°F. A coral reef watch map, provided by the National Environmental Satellite, Data, and Information Service of the National Oceanic and Atmospheric Administration (NOAA), shows that the water near the Florida Keys is significantly higher than usual, which causes coral bleaching and other marine life concerns.
Image: NOAA
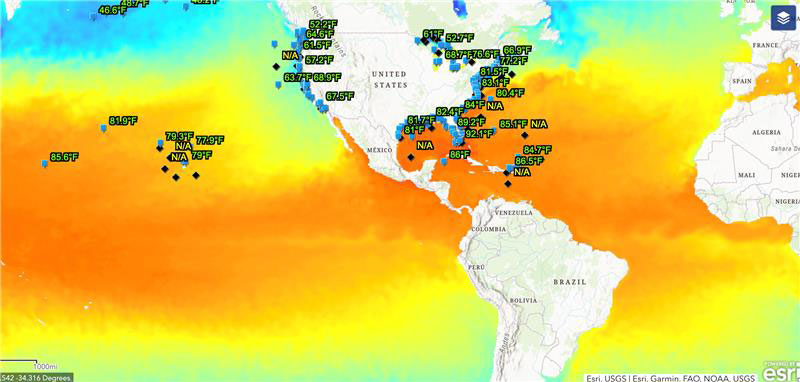
The Gulf of Mexico is not the only place that is suffering this marine heat wave. 40% of the globe is experiencing extreme temperatures,Dillon Amaya, a physical scientist at NOAA, stated in an interview with the New York Times.
This map provides water temperatures globally. The blue-green colors represent cooler temperatures whereas yellow-orange colors represent hot temperatures. (Image: NOAA)
The current water temperatures are the hottest ever recorded. Scientists say that these high temperatures are typical, but not until August or September. It is only July.
The marine heat wave is mainly due to a climate phenomenon, El Niño, that typically brings warmer ocean temperatures. However, now El Niño is coming on top of long-term warming caused by greenhouse gas emissions and worldwide contribution to global warming.
When sea temperatures rise too high, corals bleach, expelling the algae they need to live. If the water does not cool quickly enough, and if bleaching events happen frequently, the corals die. Coral reefs are vital to the marine life that relies on them and 25% of all marine life — including more than 4,000 kinds of fish — depends on reefs, according to NOAA.
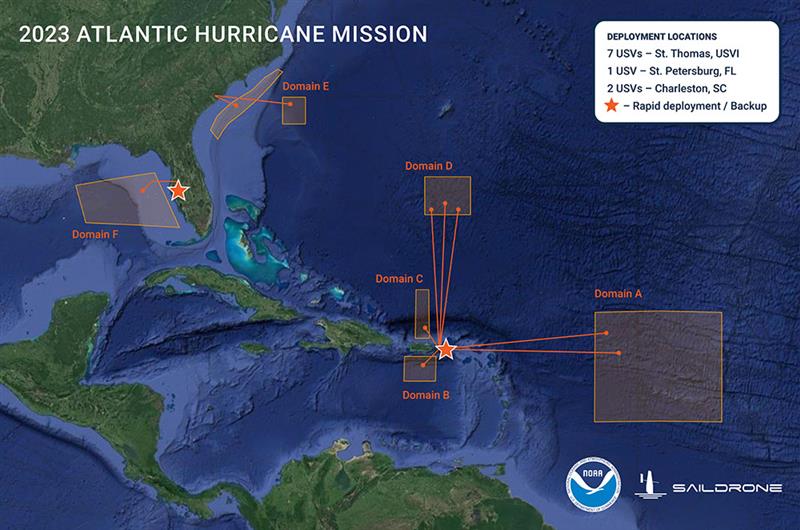
Graphic showing the USV domain areas during the 2023 Atlantic Hurricane mission. (Image: SailDrone)
Saildrone — a data solutions company for maritime security, ocean mapping, and ocean data — is deploying 12 uncrewed surface vehicles (USV) into the tropical Atlantic and Gulf of Mexico this summer, supporting the research by the National Oceanic and Atmospheric Administration (NOAA) to advance hurricane forecasting.
Saildrone is deploying 10 USVs from St. Thomas, U.S. Virgin Islands, St. Petersburg, FL, and Charleston, SC, to operate in areas with a high probability of intercepting a storm, as indicated by historical data. Two vehicles will remain on land, ready for quick deployment in the event of an approaching hurricane.
Image: SailDrone
A Saildrone Explorer is a 23-ft USV propelled by the wind and powered by solar energy. During the past two missions in 2021 and 2022, Saildrone vehicles sailed through several storms and major hurricanes, including Hurricane Sam in 2021, and Hurricane Fiona in 2022.
In addition to the Saildrone Explorers, NOAA is using a variety of aerial, surface, and sub-surface technologies, — including its Hurricane Hunter airplanes, small, uncrewed aircraft systems, gliders, drifters and floats.
The goal is to create a complete picture of the ocean-atmosphere interactions that drive hurricanes.
The USVs will transmit data, including air temperature and relative humidity, barometric pressure, wind speed and direction, water temperature and salinity, sea surface temperature, and wave height and period in near real time to scientists at NOAA’s Atlantic Oceanographic and Meteorological Laboratory and Pacific Marine Environmental Laboratory, Saildrone’s science partners for the mission.
NOAA will use the data collected by the USVs to improve hurricane forecast models. The data will also be archived by NOAA’s National Environmental Satellite, Data and Information Service and sent by NOAA to the World Meteorological Organization’s Global Telecommunication System, where it is available for the world’s major forecast centers — some 20 agencies worldwide, including NOAA.
To produce GNSS satellite orbit ephemerides and clock data with high precision and for all constellations, the Navigation Support Office of the European Space Agency’s European Space Operations Centre (ESA/ESOC) continually strives to keep up and improve its precise orbit determination (POD) strategies. As a result of these longstanding efforts, satellite dynamics modeling and GNSS measurement procedures have progressed significantly over the last few years, especially those developed for the European Galileo satellites. Because the accuracy of ESA/ESOC’s GNSS orbits has reached such a high level (about 1 to 3 centimeters), introducing a completely new type of GNSS satellite into the processing is not as easy as it used to be. New spacecraft models – the first and foremost being a model for a satellite’s response to solar radiation pressure (SRP) – are needed for the “newcomer” so that the quality of the overall multi-GNSS solution does not suffer. Just as important are spacecraft system parameters, or metadata, such as the location of the satellite antenna’s electrical phase center and the satellite attitude law.
In this article, we show the efforts we have made at ESA to bring the quality of our orbit estimates for the GPS Block III satellites up to par with those for Galileo and the earlier GPS satellite blocks. We report on the results from on-ground and in-flight determinations of the Block III transmit antenna phase center characteristics up to 17 degrees from the antenna boresight direction. Moreover, we take advantage of the non-zero horizontal offsets of the transmit antenna from the spacecraft’s yaw axis to estimate the satellite yaw angle during Earth eclipse season and present a simple analytical formula for its calculation. Finally, we describe the development and validation of improved radiation force models for the Block III satellites.
We start, however, by giving a brief overview of the GPS Block III program.
GPS BLOCK III
The U.S. Space Force GPS Block III (previously referred to as Block IIIA) is a series of 10 satellites being procured by the United States to bring new future capabilities to both military and civil positioning, navigation, and timing (PNT) users across the globe. Designed and manufactured by defense contractor Lockheed Martin (LM), the satellites are reported to deliver three times better accuracy, 500 times greater transmission power, and an eightfold enhancement in anti-jamming functionality over previous GPS satellite blocks. At ESA/ESOC, we are paying particular attention to this new tranche of satellites as they are the first to broadcast L1C, a new common signal interoperable with other GNSS, including Galileo.
At the time of this writing, there are six GPS III space vehicles (SVs) in orbit. The first one – nicknamed “Vespucci,” in honor of Italian explorer Amerigo Vespucci – lifted off atop a SpaceX Falcon 9 rocket from Cape Canaveral Air Force Station, Florida, in December 2018, and entered service on January 13, 2020. An additional four SVs are expected to be launched soon, before moving on to an updated version called GPS IIIF (“F” for Follow On). The first Block IIIF satellite is projected to be available for launch in 2026.
In view of the growing number of GPS III SVs in orbit, and soon to be joined by IIIFs, accurate spacecraft models and metadata information are becoming more and more important in order to maximize PNT accuracy.
SATELLITE ANTENNA PHASE CENTER PARAMETERS
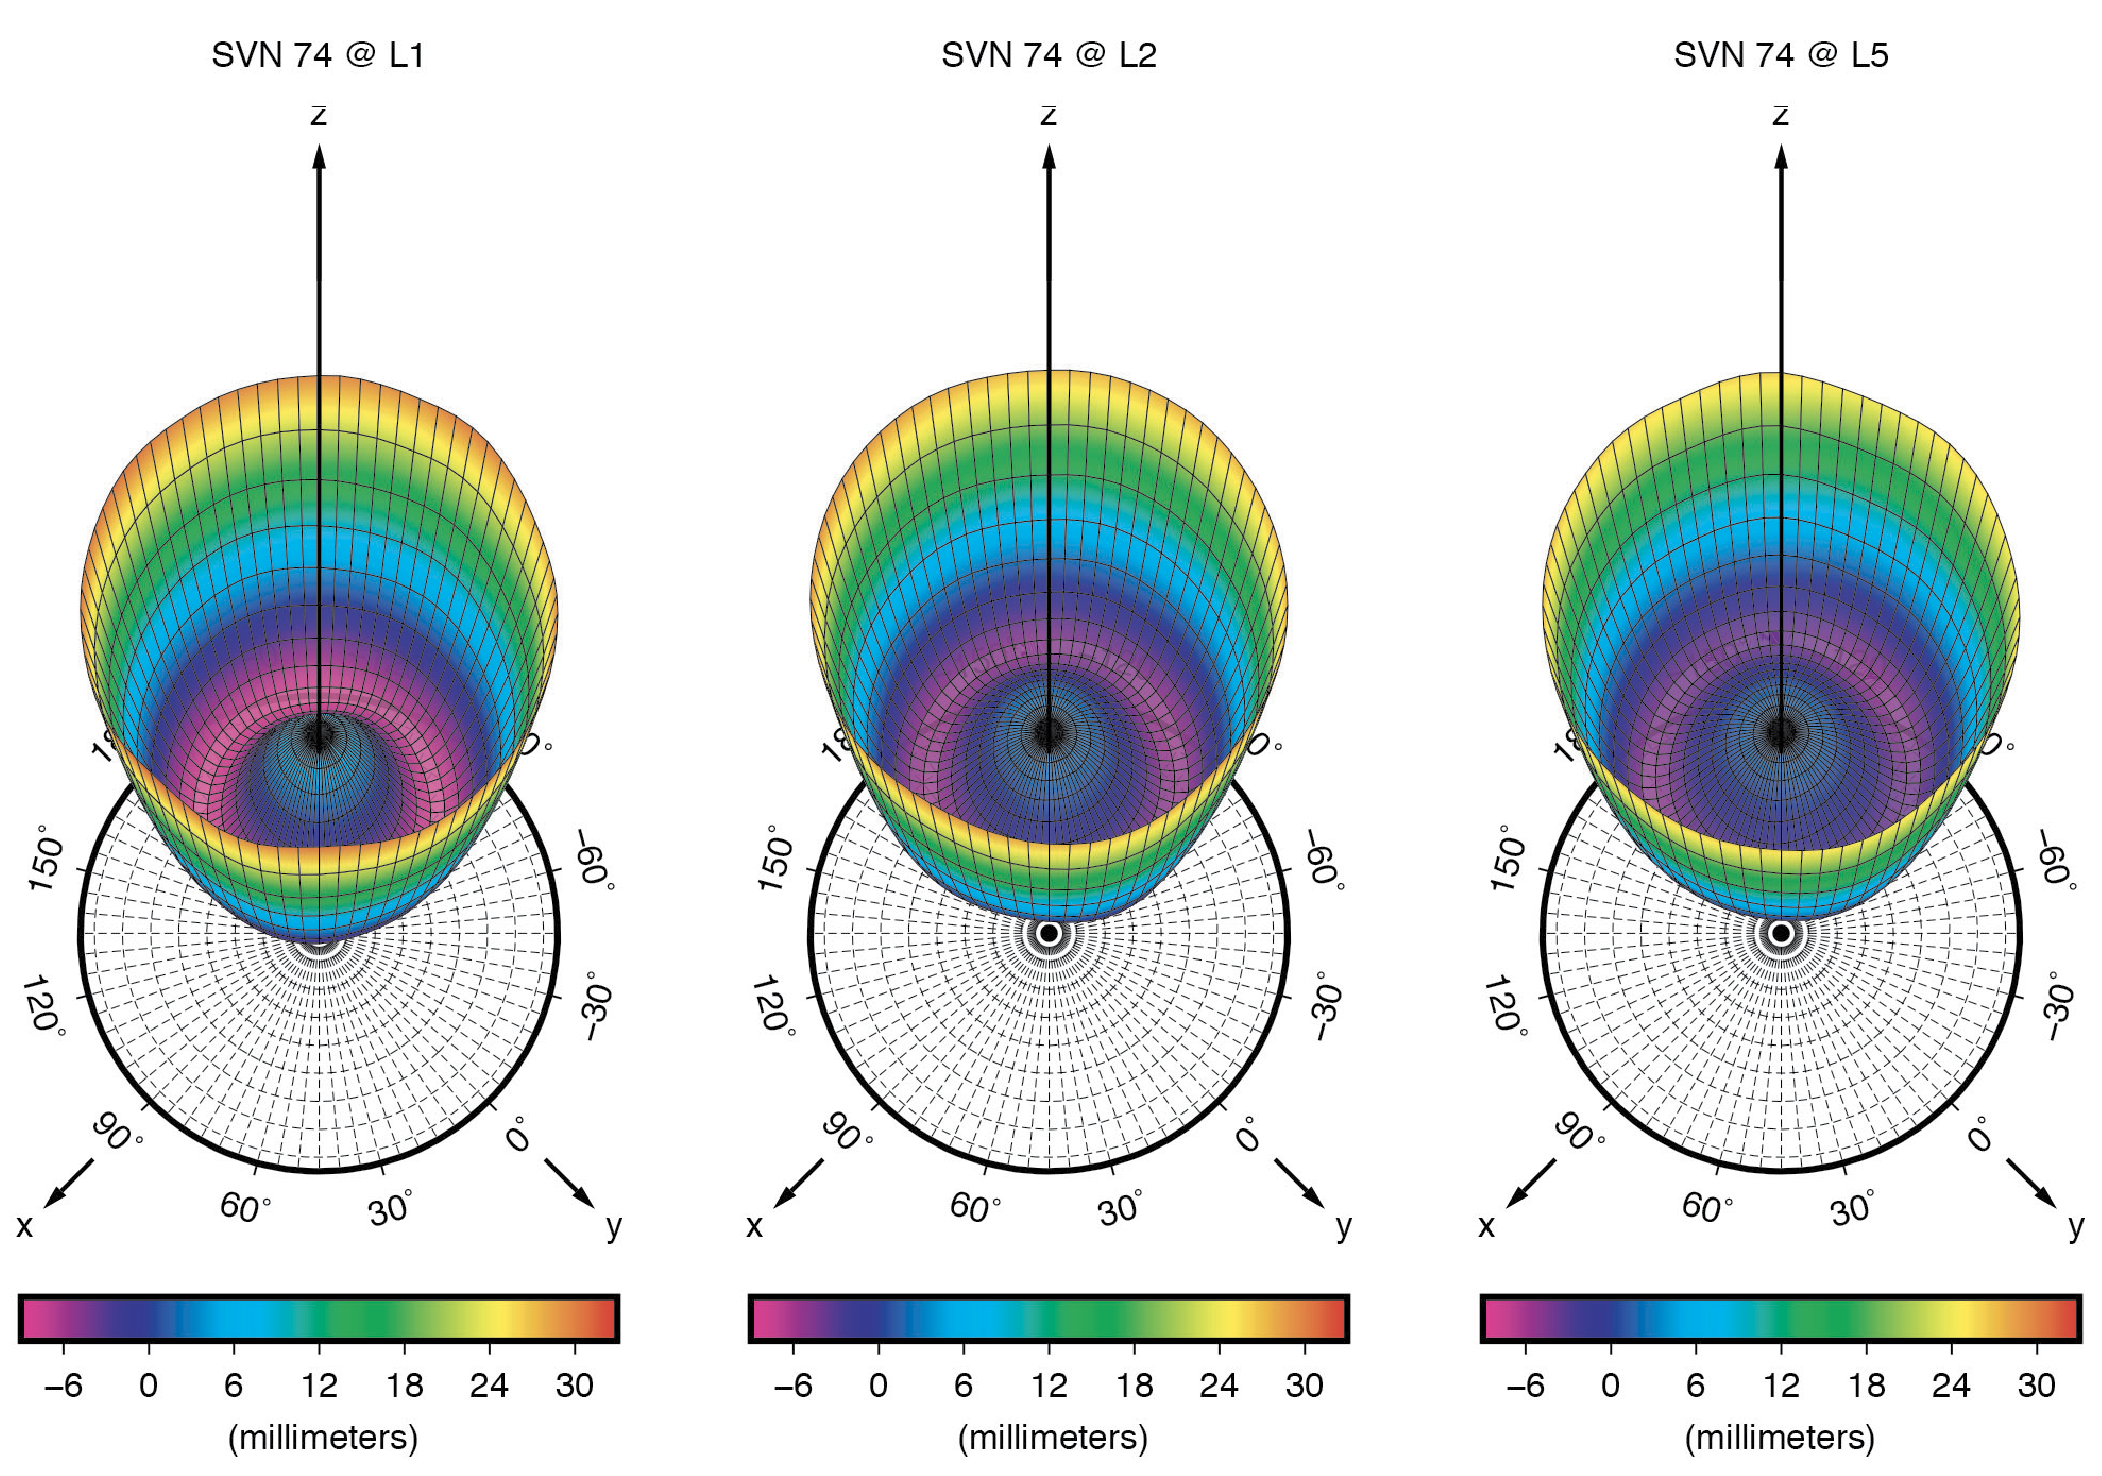
GNSS signal measurements refer to the electrical phase center of the satellite transmitting antenna, which is neither a physical nor a stable point in space. The variation of the phase center location as a function of the direction of the emitted signal on a specific frequency is what we call the phase center variation (PCV). The mean phase center is usually defined as the point for which the phase of the signal shows the smallest (in a “least-squares” sense) PCV.
Figure 1: Ground-calibrated GPS Block III transmit antenna phase center variations (PCVs). (All figures provided by the authors).
The point of reference for describing the motion of a satellite, however, is typically the spacecraft center of mass (CoM). The difference between the position of the mean phase center and the CoM is what we typically refer to as the satellite’s antenna phase center offset (PCO). Both PCO and PCV parameters must be precisely known — from either a dedicated on-ground calibration or one performed in flight — so that we can tie our GNSS carrier-phase measurements consistently to the satellites’ CoM.
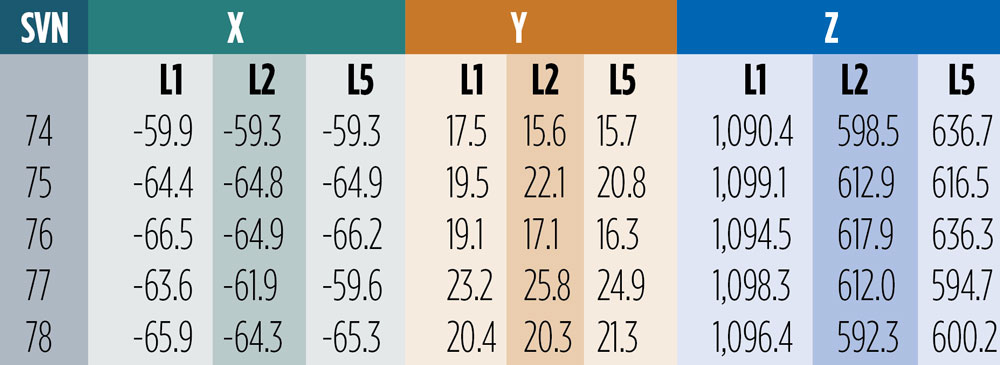
On-Ground Calibrations. Like for previous GPS vehicles, the Block IIR and Block IIR-M satellites, LM has fully calibrated the GPS III transmit antennas prior to launch at their ground test facilities. Antenna offset parameters for all three carrier signals (L1, L2 and L5) were posted on the U.S. Coast Guard Navigation Center (NAVCEN) website (www.navcen.uscg.gov) shortly after each satellite launch. In December 2021, NAVCEN released the PCOs for SV number (SVN) 78, along with updates to the first four satellites (see Table 1). About ten months later, in October 2022, the antenna pattern for each satellite and signal frequency were published (see Figure 1).
Table 1: Ground-calibrated GPS Block III transmit antenna PCOs in millimeters. (Image: GPS World staff)
The December 2021 offsets are referred to as predicted values at the end of year one on orbit. They differ from the previous ones by several centimeters in both vertical (Z) and horizontal (X and Y) directions. Particularly surprising are the X- and Y-PCOs, which were initially reported to be close to zero. The differences in the horizontal PCOs have generated uncertainty and debate, especially within the International GNSS Service (IGS) about which values to adopt for the new antenna model release (igs20.atx). Testing of the two different PCO datasets in our software demonstrated that the non-zero values as given in Table 1 are the significantly more accurate ones. We will return to this later in this article.
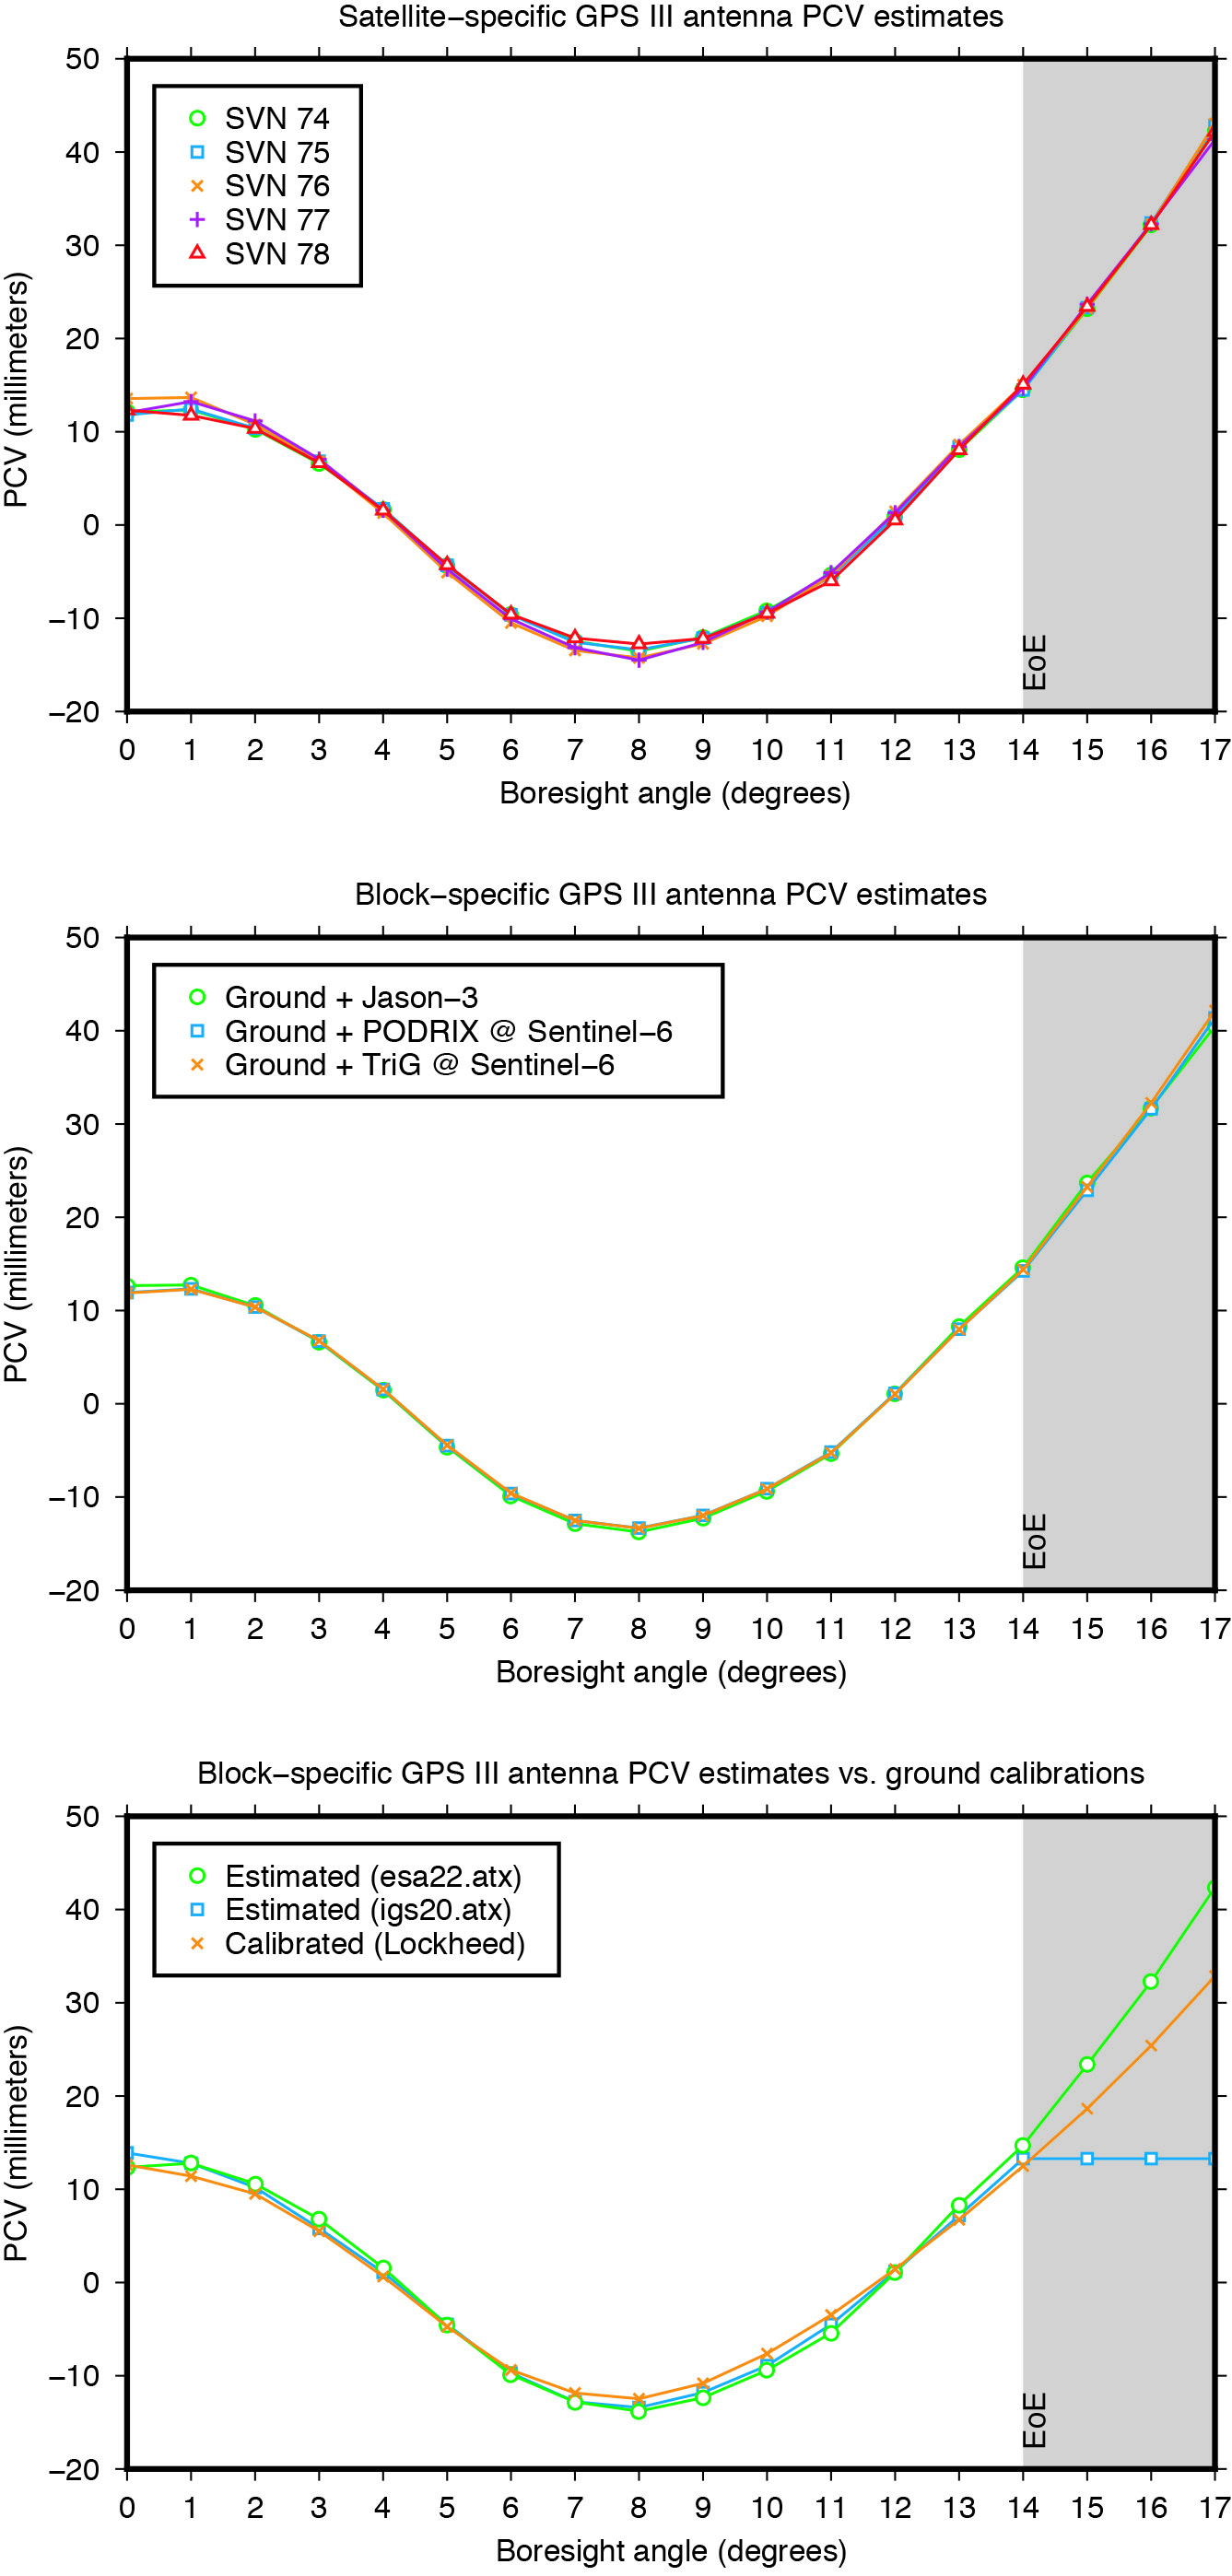
Combined Ground- and Space-Based Tracking. In this part of this article, we discuss the combination of dual-frequency tracking data from geodetic-quality GPS receivers in low Earth orbit (LEO) with those from a global receiver network on the ground to determine the phase center parameters of the GPS Block III transmit antennas. The LEO-based measurements were taken by the GNSS receivers on board the ocean altimetry satellites Sentinel-6 Michael Freilich and Jason-3. The 1,336-km altitude of both of these missions enables the estimation of the GPS satellite antenna PCVs from 0 up to 17 degrees from boresight while GPS receivers on Earth can only see the satellites up to a maximum angle of 14 degrees. The 14-degree limit is also referred to as the GPS satellites’ edge of Earth (EoE) angle.
For the modeling of the PCVs we follow the approach of the IGS using piece-wise linear functions of the boresight angle and constraining the PCV values to between 0 and 14 degrees to have zero mean. Furthermore, we employ fully normalized spherical harmonic expansions of degree 8 and order 5 to solve for the azimuth- and elevation-angle-dependent PCVs of the orbiting receiver antennas. The IGS standard antenna phase center corrections from igs20.atx are applied to all terrestrial receiver and GPS Block II transmit antennas.
Figure 2: GPS Block III transmit antenna PCVs as a function of boresight angle. The gray shaded area indicates the angular range that is inaccessible from the ground but relevant to high altitude LEO missions such as Sentinel-6 Michael Freilich or Jason-3.
The estimated Block III antenna PCVs are depicted in Figure 2. The estimates for the five individual antennas match each other to within 0.4 millimeters root-mean-square (RMS) (see Figure 2, top). The agreement among the PCVs that we get when processing the tracking data from each LEO receiver’s antenna separately is at the sub-millimeter level, too (see Figure 2, middle). Overall, the level of consistency suggests that the PCVs are of very good quality and that a block-specific representation is sufficient for precise applications. Comparison of the final block-specific PCV estimates against the values from the current IGS antenna model and from the ground calibrations shows strong agreement (RMS = 0.7 millimeters) between 0 and 14 degrees from boresight (see Figure 2, bottom). Beyond the 14-degree limit, the differences compared to the IGS standard are up to three centimeters, underlying the urgent need for an update of the igs20.atx file.
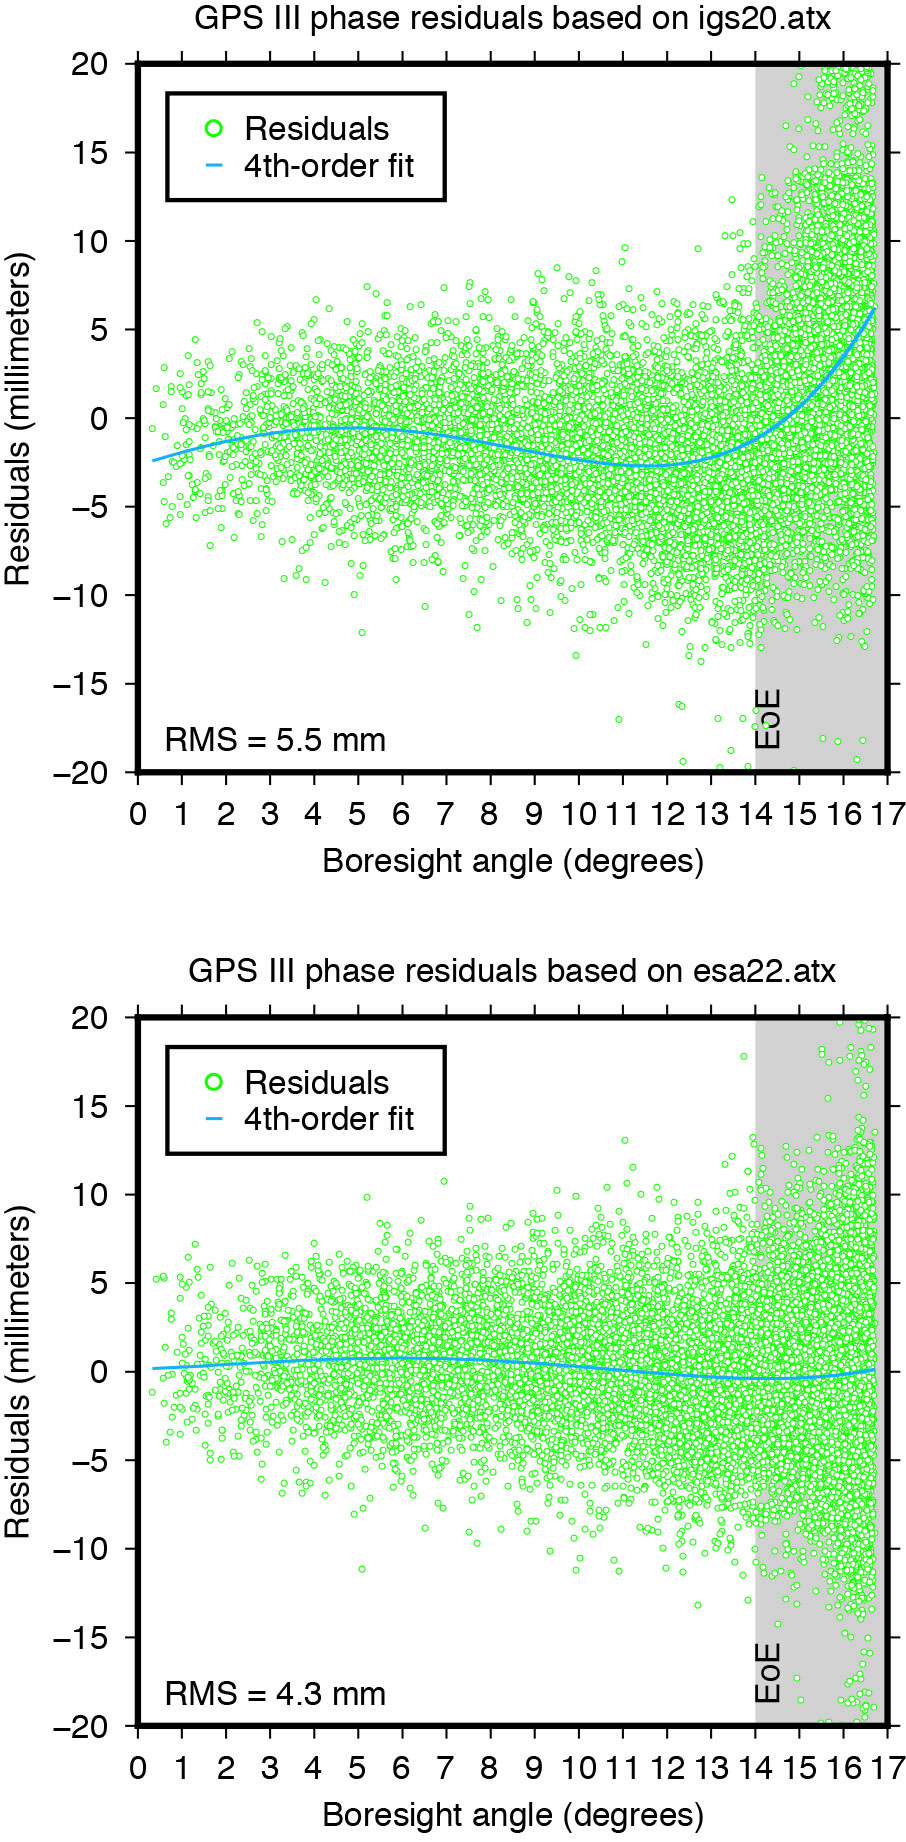
Applying the extended PCV corrections as part of the POD process to the GPS LEO receiver data shows significant improvement in the post-fit carrier-phase residuals when compared to the PCV corrections from the IGS legacy model. It removes a previously existing boresight angle-dependent trend and leads to a more than 20% reduction in the computed residual RMS (see Figure 3).
Figure 3: Post-fit residuals of GPS III carrier-phase data from Sentinel-6 Michael Freilich when using igs20.atx (top) and esa22.atx (bottom), respectively.
YAW MODELING
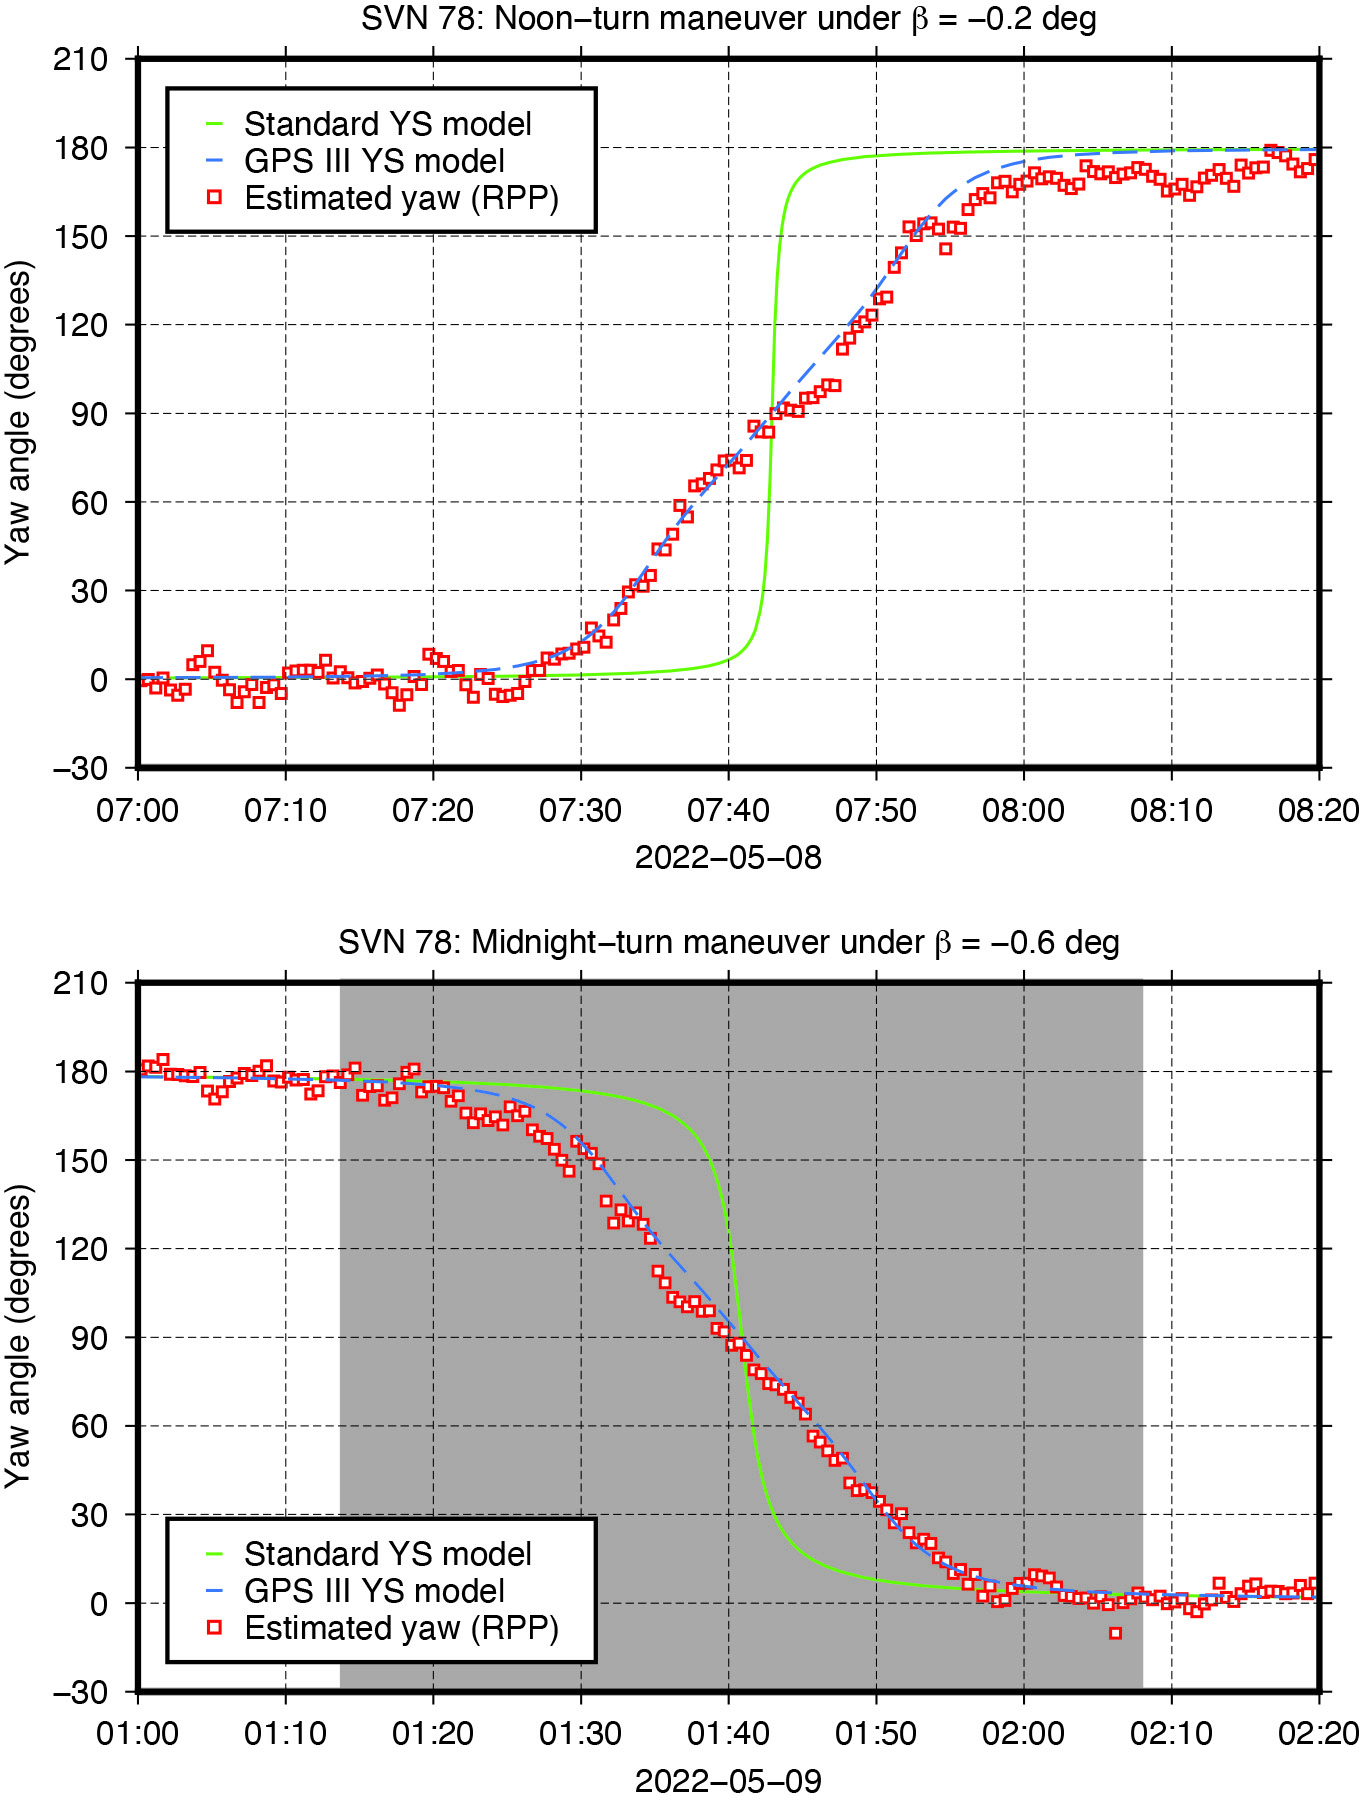
Figure 4: Yaw turn maneuver of GPS Block III satellite SVN 78 near orbit noon (top) and orbit midnight (bottom), respectively.
GNSS satellites cannot follow an ideal yaw-steering whenever the Sun elevation angle relative to the orbital plane (the so-called beta angle) gets too low and the yaw rate required to keep the satellite solar panels pointing towards the Sun exceeds the maximum satellite yaw rate. The strategies on how GNSS satellites perform rate-limited yaw-steering are different for each type of spacecraft and only partly documented for public users. Continuous knowledge of GNSS spacecraft yaw attitude, however, is important for kinematic and dynamic reasons. Errors in yaw are known to affect the modeling of transmit antenna phase center’s position, carrier-phase wind-up, and radiation pressure forces. On the other hand, when the mean antenna phase center location is offset from the spacecraft’s Z-axis, the satellite yaw state can be estimated instantaneously from the tracking data of a global receiver network. The approach behind this is commonly referred to as “upside down” or “reverse kinematic precise point positioning” (RPP). The horizontal antenna offset vector can be viewed here as a kind of rotating lever arm whose length determines the accuracy of the yaw angle estimates. Since the Block III X-offset is just 7 centimeters, one should not expect the same RPP accuracy as for other GNSS satellites like those of the GPS IIF or GLONASS-M series, which have an X-offset that is six (GPS IIF) or even eight (GLONASS-M) times larger.
Nonetheless, with more than three hundred ground stations, kinematic RPP works reasonably well even for GPS III as we can see from Figure 4, which shows the estimated yaw angle of SVN 78 while passing orbit noon and orbit midnight with a Sun elevation angle of almost zero degrees. The plots suggests that Block III satellites — unlike previous Block IIA and IIF SVs — perform their yaw slews near noon and near midnight in the same way and at the same yaw rate. In this respect, the yaw turn behavior is similar to that of the IIR/IIR-M satellites. However, with a maximum yaw rate of 0.10 degrees per second, the Block III satellites rotate only half as fast as those of the IIR/IIR-M family. What is also different is the start time of the yaw maneuver. As can be seen from Figure4, the maneuver does not start when the required yaw rate exceeds the physical limit but already a couple of minutes before.
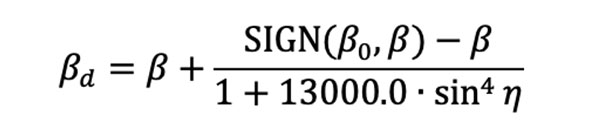
The RPP analysis has led to the development of a simple yaw model for the Block III satellites. For a Sun elevation angle β below β0 = 4.780 degrees, the yaw angle can be approximated with an RMS accuracy of about 8 degrees by the following formula: whereas
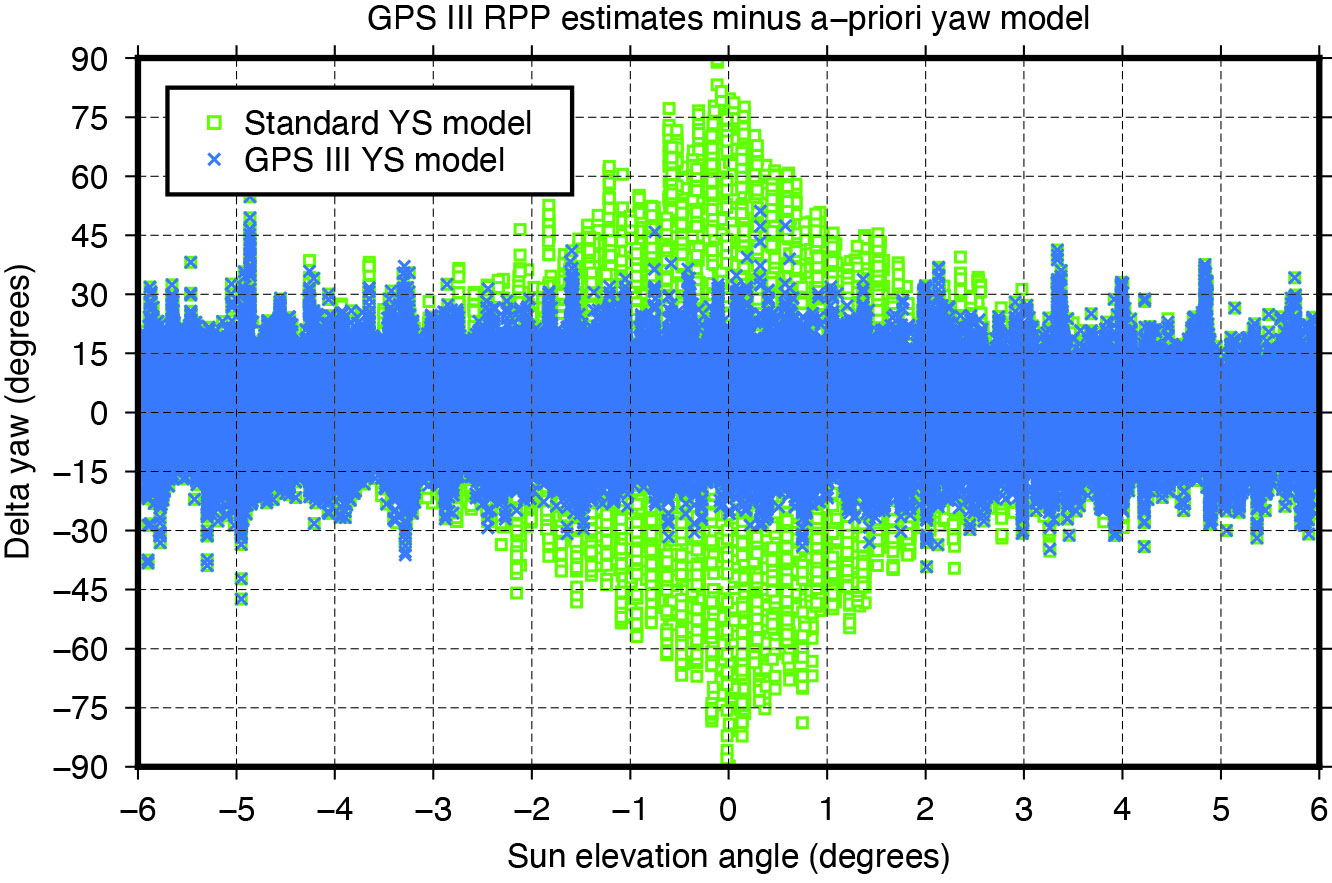
is a modified Sun elevation angle, SIGN(β0, β) a FORTRAN function returning the value of β0 with the sign of β, and η is the satellite’s argument of latitude with respect to orbit midnight. The agreement between estimated and modelled yaw angles is illustrated in Figure 5.
Figure 5: Differences between yaw angle estimates and yaw angle models.
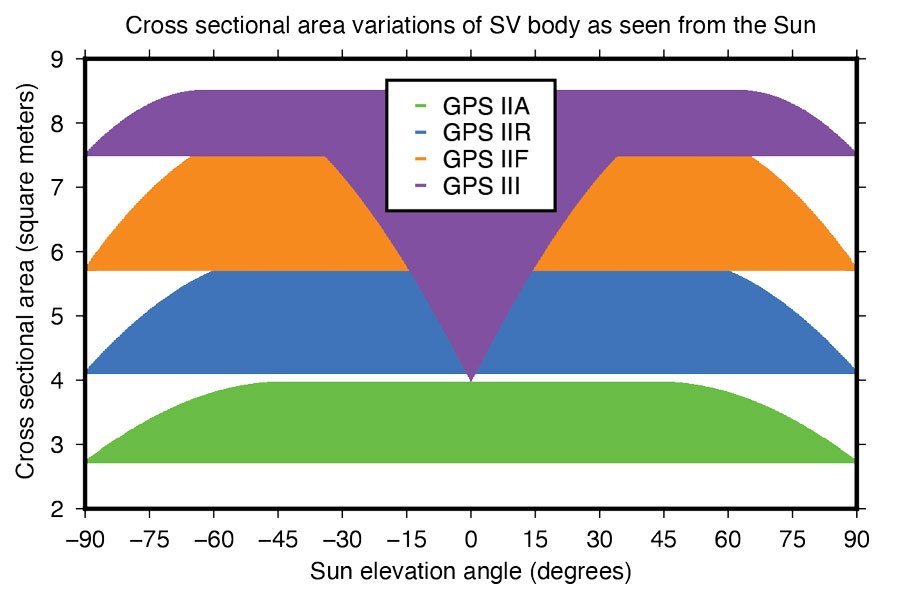
Fourier Series for Radiation Force Modeling. The most critical component determining the shape of a GNSS satellite’s trajectory is SRP – the force caused by the impact of solar photons hitting the satellite’s surfaces. A satellite’s sensitivity to SRP can be characterized by the variation of the cross-sectional area to mass ratio (A/M) of the satellite body as it orbits Earth and the Sun. The greater the change in A/M, the higher the sensitivity. From this perspective, the Block III spacecraft can be considered the most sensitive in GPS history.
Based upon LM’s tried-and-true A2100 bus, the satellite is much more elongated than previous generations. With an estimated size of 7.5 meters squared, the X-side is almost twice as large as the Z-side. Depending on the elevation angle of the Sun relative to the orbital plane, the body’s cross-sectional area exposed to sunlight varies between 4.0 and 8.5 meters squared (See Figure 6). With a nominal on-orbit weight of approximately 2,160 kilograms, this results in a change of A/M of 0.0021 meters squared per kilogram. For comparison, the corresponding values for the previous GPS SVs are 0.0015 (IIF), 0.0017 (IIR), and 0.0013 (IIA) meters squared per kilogram.
Figure 6: Size of GPS satellite body’s cross-sectional area exposed to sunlight.
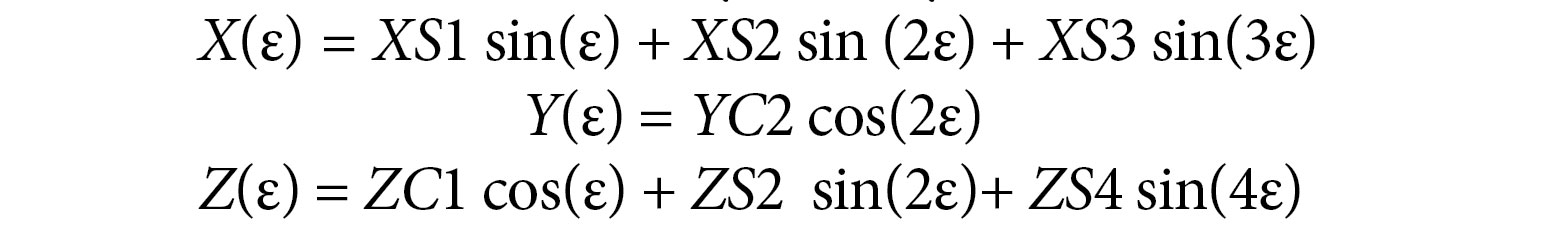
Given the size and shape of Block III spacecraft, an appropriate radiation force model is considered mandatory to achieve the highest orbit accuracy possible. With that said, we empirically derived a set of background force models for the first five GPS III satellites. Our approach rests on dynamical long-arc (9-day) fitting to precise orbit data spanning up to three years and the following low-order Fourier functions of the Earth-spacecraft-Sun angle ε to represent the radiation force in the satellite body-fixed system:
The Fourier coefficients (XS1, XS2, XS3, YC2, ZC1, ZS2 and ZS4) are iteratively adjusted together with initial epoch state, a constant Y-axis bias, and 1‐cycle per revolution along‐track parameters to best fit the orbit data in a least-squares sense. All individual 9-day arc solutions are rigorously combined on a normal equations level to form a robust set of Fourier model coefficients for each satellite or group of satellites.
ORBIT OVERLAP TESTS
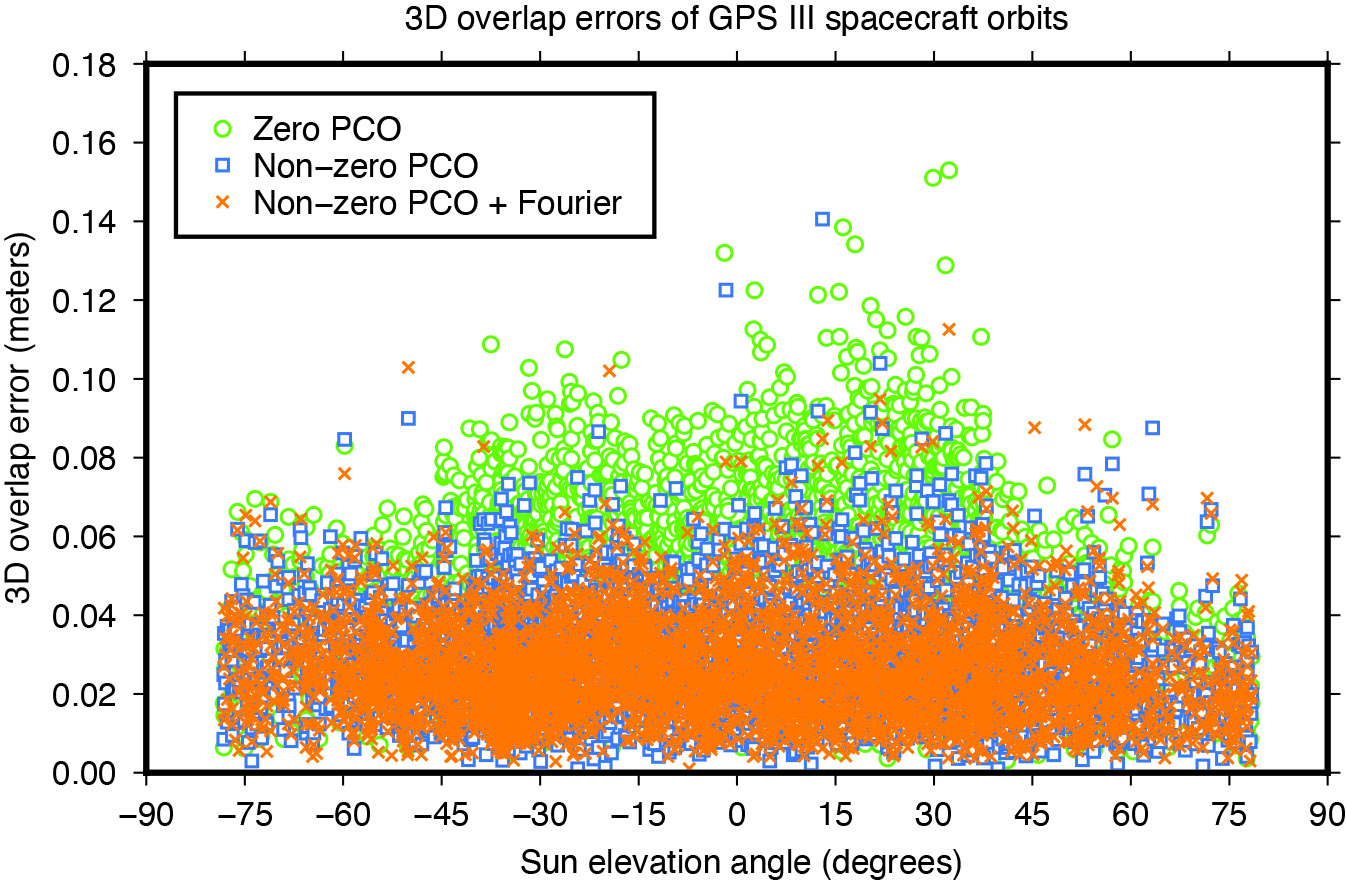
Figure 7: Impact of horizontal antenna PCOs and Fourier force model on day-boundary orbit overlap errors.
To investigate the effect of the transmit antenna PCOs and the Fourier force models on the satellite orbits, we use our ESA/IGS processing strategy to generate dynamic 24-hour-arc solutions spanning January 2020 to December 2022, first with zero PCO and the non-zero horizontal offsets from Table 1 and no a-priori radiation force model, then with the non-zero offsets and the additional Fourier model in the background. The direct comparison of the generated orbits reveals significant differences for the Block III satellites of about 0.1 meters (3D).
To demonstrate the improved performance of the non-zero offsets and the Fourier model, we take the orbits for successive days and look at the midnight epoch where they overlap. The difference in the orbit position, subsequently referred to as “overlap error,” gives us a worst case estimate of the satellite orbit accuracy. Comparison of the overlap errors provides evidence that the Block III orbits are much more accurate when using the non-zero rather than the zero X and Y PCOs. The overall 3D overlap RMS reduces from 49.5 millimeters (with zero PCOs) down to 32.3 millimeters (with non-zero PCOs). Results for the Sun elevation regions below 45 degrees, in particular, show significant improvement (see Figure 7).
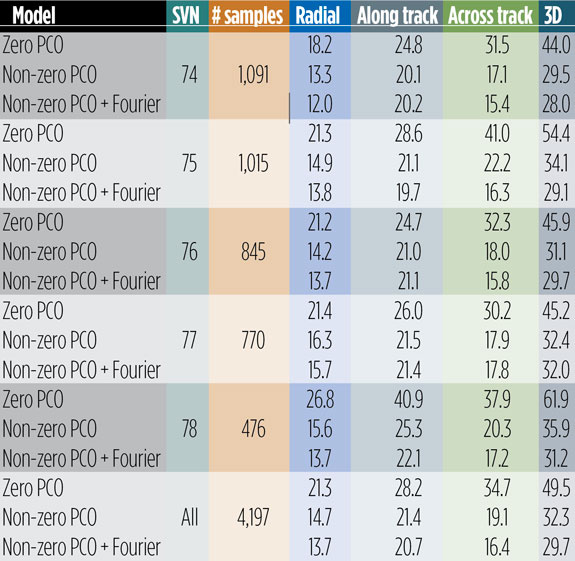
Use of the Fourier model has additional positive impact on the overlaps. Comparing the orbits produced with and without the a-priori radiation force model, we see a decrease in the 3D overlap error RMS from 32.3 to 29.7 millimeters averaged over all satellites. The orbit component that benefits most from both the improved antenna phase and the advanced force modeling is the one normal to the satellite orbital plane (across track). The SVs improving the most are SVN 75 and SVN 78, though significant improvements can be seen for all other satellites too (see Table 2).
Table 2: Day-boundary overlap RMS errors of GPS III spacecraft orbits in millimeters.
EMPIRICAL PARAMETER ESTIMATES
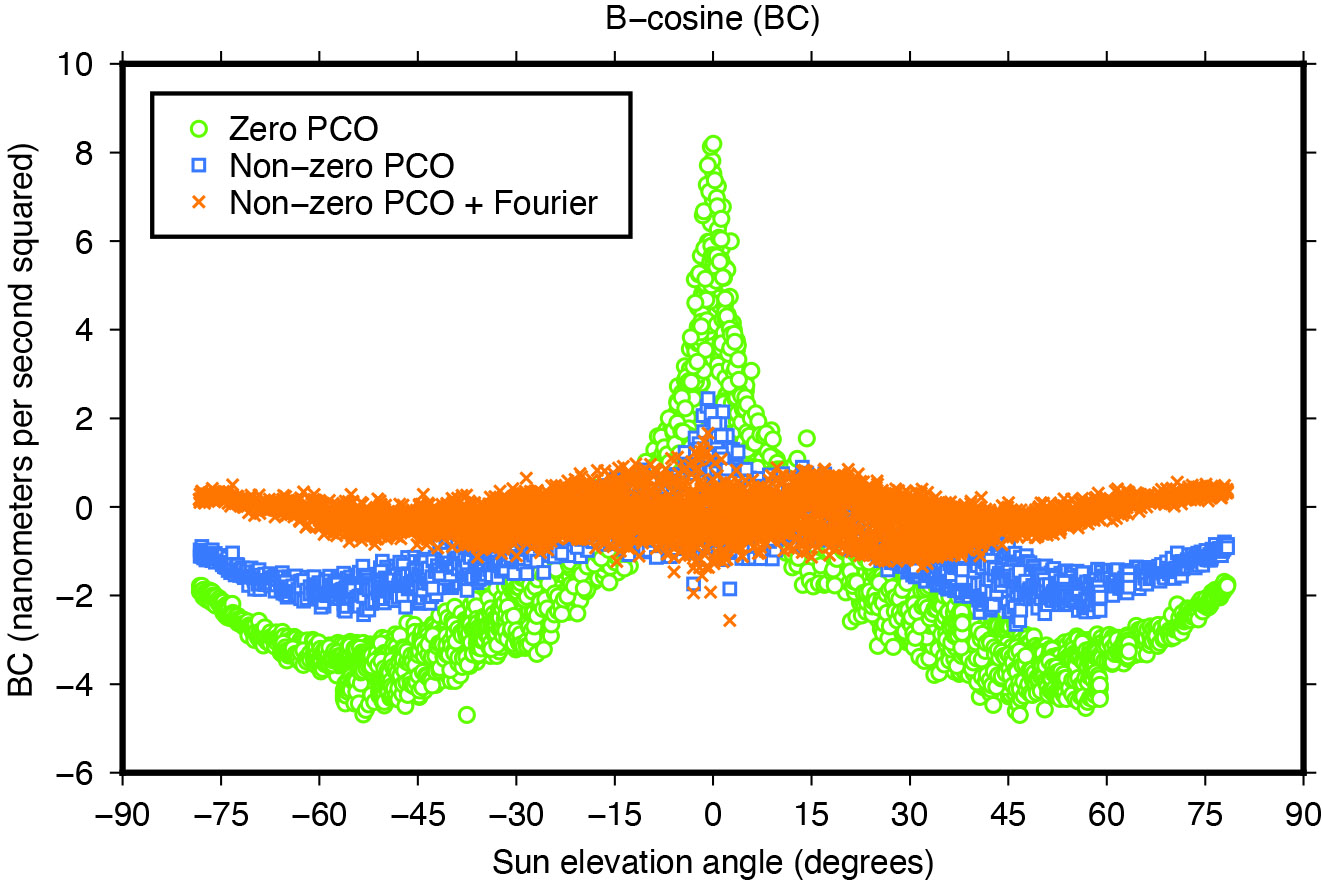
Another means of assessing the quality of spacecraft models is the size and variability of the five-plus-three empirical dynamic radiation pressure parameters that we still estimate on a daily basis for each GNSS satellite in addition to its a-priori force model. Introducing the non-zero PCO and Fourier models into the POD turned out to reduce the size of the empirical parameters and their dependency on the satellite-Sun geometry to a great extent as the example in Figure 8 demonstrates.
Figure 8: Impact of horizontal antenna PCOs and Fourier force model on empirical once-per-revolution acceleration term BC.
NARROW-LANE AMBIGUITY FRACTIONALS
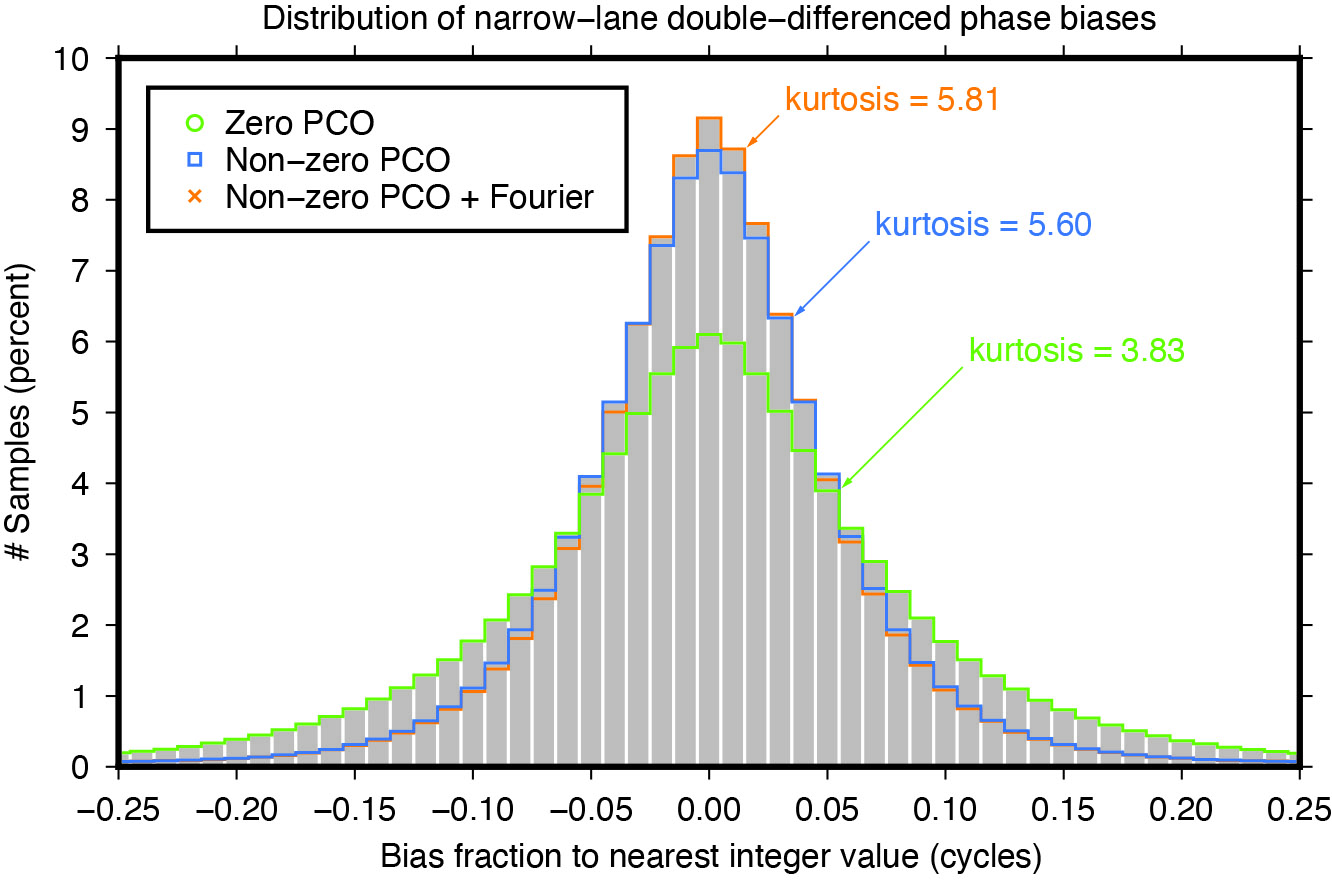
Integer ambiguity resolution — that is, resolving the unknown cycle ambiguities of double-differenced carrier-phase data to integer values — is considered indispensable to GNSS satellite POD and commonly results in a factor of two improvement in orbit precision. Of particular importance is the narrow-lane ambiguity that results from combining the carrier-phase measurements from a pair of GNSS frequencies. One of the intermediate steps in the ambiguity resolution algorithm is the fixing of the double-differenced narrow-lane ambiguities to integer values. For reliable fixing, the fractional part of the difference between the integer and decimal (float) values should be as close as possible to zero and follow a symmetrical distribution. The “tailedness” of the distribution curve may be characterized by its kurtosis — the larger the kurtosis, the fewer values are in the tails of the distribution and the more peaked is the distribution. In other words, the larger the kurtosis, the closer the “fractionals” cluster around zero, the more ambiguities can be resolved with higher confidence, and the more accurate the resolved solution. Moreover, as satellite orbit and antenna phase center errors do not cancel out completely through double-differencing, the narrow-lane kurtosis may also be considered as an indicator for the accuracy of the satellite force and phase center models that were used. The results in Figure 9 show that the non-zero horizontal PCOs bring a major improvement and that the Fourier force model does give some additional benefit.
Figure 9: Impact of horizontal antenna PCOs and Fourier force model on fractional part of double-differenced narrow-lane ambiguities.
CONCLUSIONS
Adding a new GNSS satellite type to high-precision multi-GNSS solutions requires detailed knowledge and understanding of the satellite type. Key issues are the transmit antenna phase center parameters, the satellite’s attitude, and the radiation pressure forces acting on its surfaces.
In this article, improved antenna phase center, attitude, and radiation pressure models for the current series of GPS Block III spacecraft have been developed using multiple years of in-flight orbit and tracking data. A number of internal metrics such as post-fit carrier-phase residuals, day-boundary orbit differences (overlaps), empirical acceleration parameters, and carrier phase ambiguity statistics have been used to gauge the models’ performances. Overall, the results underscore the importance of the models for GPS III orbit determination. This applies primarily to the radiation force and the antenna phase center model, or more precisely, the horizontal (X and Y) offsets of the phase center model whose existence has been neglected for years in the analysis of GPS III data.
Comparison of the overlap statistics suggest that orbits generated based upon updated (non-zero) phase center corrections and ESA/ESOC’s new (Fourier-based) radiation pressure model in the background are better by almost a factor of two. The average overlap RMS errors calculated across all current Block III SVs and for each orbital component (radial, along track and across track) dropped from 21 , 28 and 35 millimeters down to 14, 21 and 16 millimeters, respectively.
More relevant when it comes to processing GPS data recorded on board low-flying satellites such as Sentinel-6 Michael Freilich or Jason-3, is the extension of the current IGS Block III antenna PCV model beyond a 14-degree boresight angle. After applying the extended PCV corrections, we reduced Block III carrier-phase residuals by 20% with no or few systematic signatures remaining, unlike the residuals produced with the current IGS antenna model. The IGS is strongly encouraged to adopt the Block III PCV extension into their antenna model to continue to support GPS-based POD of low-Earth-orbiting satellites.
For further details on ESA/ESOC’s solar radiation pressure modeling approach, see our paper “GPS III Radiation Force Modeling” presented at the IGS 2022 Virtual Workshop: click here.
FLORIAN DILSSNER is a satellite navigation engineer in the Navigation Support Office at the European Space Operations Centre (ESOC) of the European Space Agency (ESA), Darmstadt, Germany. He earned his Dipl.-Ing. and Dr.- Ing. degrees in geodesy from the University of Hannover, Germany.
TIM SPRINGER has been working for the Navigation Support Office at ESA/ESOC since 2004. He received his Ph.D. in physics from the Astronomical Institute of the University of Bern in 1999.
FRANCESCO GINI is a satellite navigation engineer in the Navigation Support Office at ESA/ESOC. He received his Ph.D. in astronautics and space sciences from the Centro di Ateneo di Studi e Attività Spaziali at the University of Padova in 2014.
ERIK SCHÖNEMANN is a satellite navigation engineer in the Navigation Support Office at ESA/ESOC. He earned his Dipl.-Ing. and Dr.- Ing. degrees in geodesy from the University of Darmstadt, Germany.
WERNER ENDERLE is head of the Navigation Support Office at ESA/ESOC. He holds a doctoral degree in aerospace engineering from the Technical University of Berlin, Germany.
“Seen & Heard” is a monthly feature of GPS World magazine, traveling the world to capture interesting and unusual news stories involving the GNSS/PNT industry.
Image: Apple
Apple Products Meet Accuracy with GPS
Apple launched the Ultra Watch, which contains a dual-frequency GPS antenna that can receive L5 signals, as well as the iPhone 14, which features a dual-band GPS receiver combining the L1 and L5 signals. The company is also harnessing signals from more than 70 satellites to boost the accuracy of its services such as SOS alerts and alerting emergency responders, per The National News. The dual-frequency abilities of the new products provide accurate location for calculating distance, pace and routes. The L5 signals also are a critical component of Apple’s health and safety features, providing more accuracy than in previous products.
Wildlife researchers in Key Largo, Florida, accidently discovered a way to locate and eradicate invasive Burmese pythons, per WFLA News Channel 8. The team of researchers were observing racoons and possums that were fitted with tracking collars to note their behavior. After months of observation, a possum collar sent a mortality signal due to lack of movement. To the researchers’ surprise, the collar then started moving again. They later discovered the possum had been eaten by a python. While this was not the intent of the team’s research, they proved this could be an effective way to lower the increasing population of the invasive python species.
Scientist Liu Shaochuang and his team have used satellite remote-sensing technology to study and track wild camels. Shaochuang studies the interrelationship between endangered animals and their environments, which may help protect the species against climate change. To track a camel, Shaochuang attaches a GNSS-enabled collar, which transmits the camel’s location every day. The short message function is provided by China’s BeiDou satellite system, which transmits and receives signals in real time. Based on the data, Shaochuang and his team can observe migratory paths, living environments and possible threats.
Image: Screenshot of CNN video
Former South Carolina Attorney Convicted with Location Data
On March 3, Alex Murdaugh was convicted of killing his son Paul Murdaugh and wife Maggie Murdaugh. With limited evidence, the prosecution used a phone video and vehicle navigation data to prove Alex’s guilt. During the trial, Alex claimed he was visiting his mother during the time the murders took place. However, General Motors OnStar data accessed by investigators from his Chevrolet Suburban contradicted the alibi, putting Alex at the scene of the crime during the time of the murders. Plus, in a smartphone video taken by Paul that night, Alex’s voice could be heard, placing him at the scene.
On March 20, 2023, I wrote a short announcement about a funding opportunity by the National Geodetic Survey (NGS) to support the science of geodesy.
As mentioned in previous columns, Everett Hinkley wrote about the geodesy crisis in an ION article. Hinkley’s article summarized several action items that could help improve the lack of trained geodesists in the United States. One action was to encourage U.S. government support in the form of grants, professional development of staff, and research collaborations/affiliations. A pilot PhD geodesy educational program with three National Geospatial-Intelligence Agency (NGA) and one NGS employee is in place. He stated that the NGA expects to continue growing this program. Click here for more information on NGA’s academic research program.
NGS’ geospatial modeling grant is another example of this action item. There needs to be more funds added to this task, but it is a start. The program priorities under NGS’ grant program include: research and develop new methodologies for defining and applications for working with the NSRS; develop and evaluate tools, models, and guidelines to access, analyze, and manipulate geodetic data; enhance infrastructure of geodetic control, coastal remote sensing data, survey measurements, and other physical datasets that comprise the NSRS; support education, capacity building, and technology transfer for the future of geodesy; coordinate through partnerships with local, state, and regional users such as state and local governments, universities, and/or the public sector.
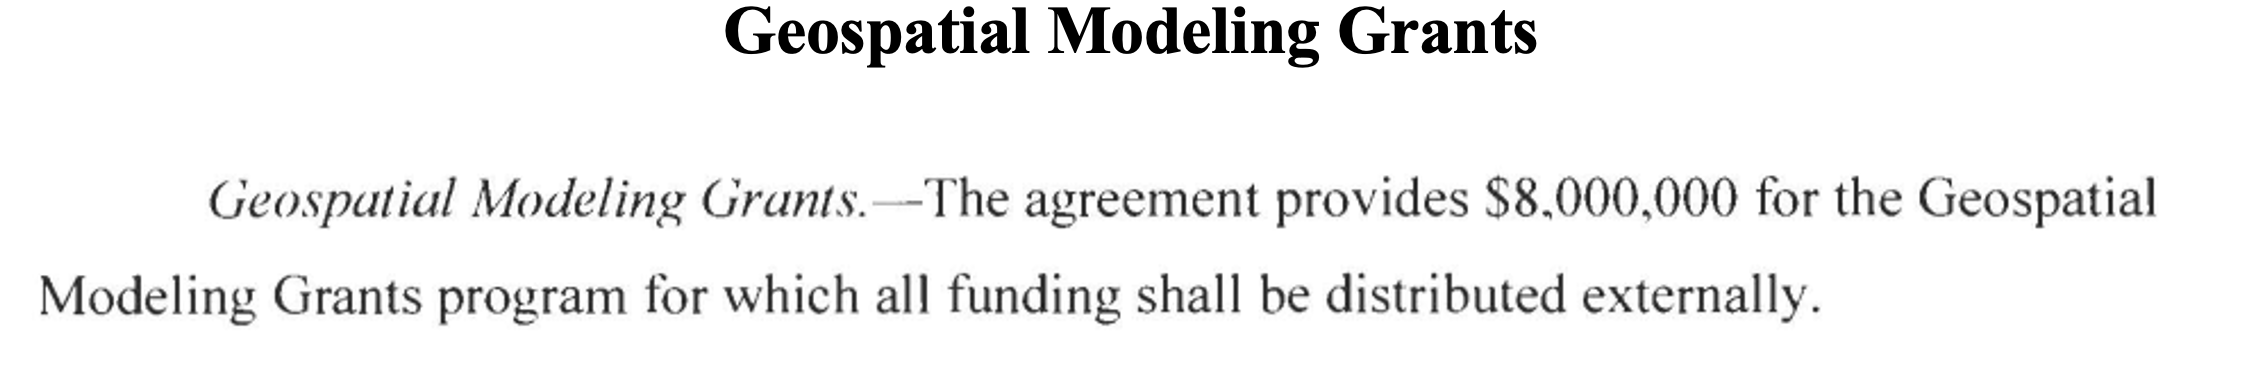
The geospatial modeling grant was included in the 2023 Omnibus Appropriations Bill. The agreement provides $8,000,000 for the program and states that all funding shall be distributed externally. Hopefully, the same amount or more will be in FY 24 appropriations. Additional information about NOAA’s appropriations can be found in the 2023 Omnibus Appropriation Bill under the explanatory statement for Commerce, Justice, Science and related agencies. The bill can be found here. To find the language in the bill click here, then search the document for “geospatial.” See the image below for the language in the bill.
Image: Senate.gov website
For those that are interested in the appropriation process, the image below provides a list of the senators that work on these agencies’ appropriations. If you are interested in learning more about the appropriation process and the geospatial modeling grants, contact your senator. The more congressional representatives know about the geodesy crisis — which includes the lack of trained geodesist as well as surveyors — the sooner they will support funds to help correct the problem. Click here for a list of senators on the Commerce, Justice, Science and Related Agencies Appropriation Committee.
Advancing geodesy with conferences
Another activity that promotes the advancement of geodesy and surveying are national and international surveying and mapping conferences. Before the American Congress on Surveying and Mapping (ACSM) disbanded, the four-member organization collaborated to convene annual surveying and mapping conferences in the United States. Topics like those presented at a FIG Working Week were presented at these conferences.
Since these ACSM conferences are no longer being held, I encourage users of geospatial data and GNSS technology to attend conferences like FIG Working Week 2023. I have participated in several FIG meetings and learned a lot from presentations as well as holding hallway meetings with experts from the international surveying and mapping community. In the March column, I highlighted that FIG Working Week 2023 is going to be held in Orlando, Florida, on May 28 – June 1. NGS will be presenting a full-day worth of content on NSRS modernization during the conference. I want to highlight some presentations that may be of interest to readers. Register for FIG Working Week 2023 here.
The image below provides a list of NGS presentations with scheduled times. There will be a panel session in the beginning of the day to set the context for the day.
Agenda of NGS DAY at FIG Meeting (Image: FIG website)
As in most conferences there are several ways participants can register, one day to the entire conference. This is a great opportunity to have discussions with the leadership of the National Geodetic Survey and individuals working on the development of the new, modernized NSRS.
Image: FIG website
There are a lot of presentations on various topics so, I would encourage readers to look through the entire agenda. FIG’s technical work is led by ten commissions. The August 2021 column provided information about the FIG commissions. See the list of commission below:
Commission 1 – Professional Standards and Practice Commission 2 – Professional Education Commission 3 – Spatial Information Management Commission 4 – Hydrography Commission 5 – Positioning and Measurement Commission 6 – Engineering Surveys Commission 7 – Cadastre and Land Management Commission 8 – Spatial Planning and Development Commission 9 – Valuation and the Management of Real Estate Commission 10 – Construction Economics and Management
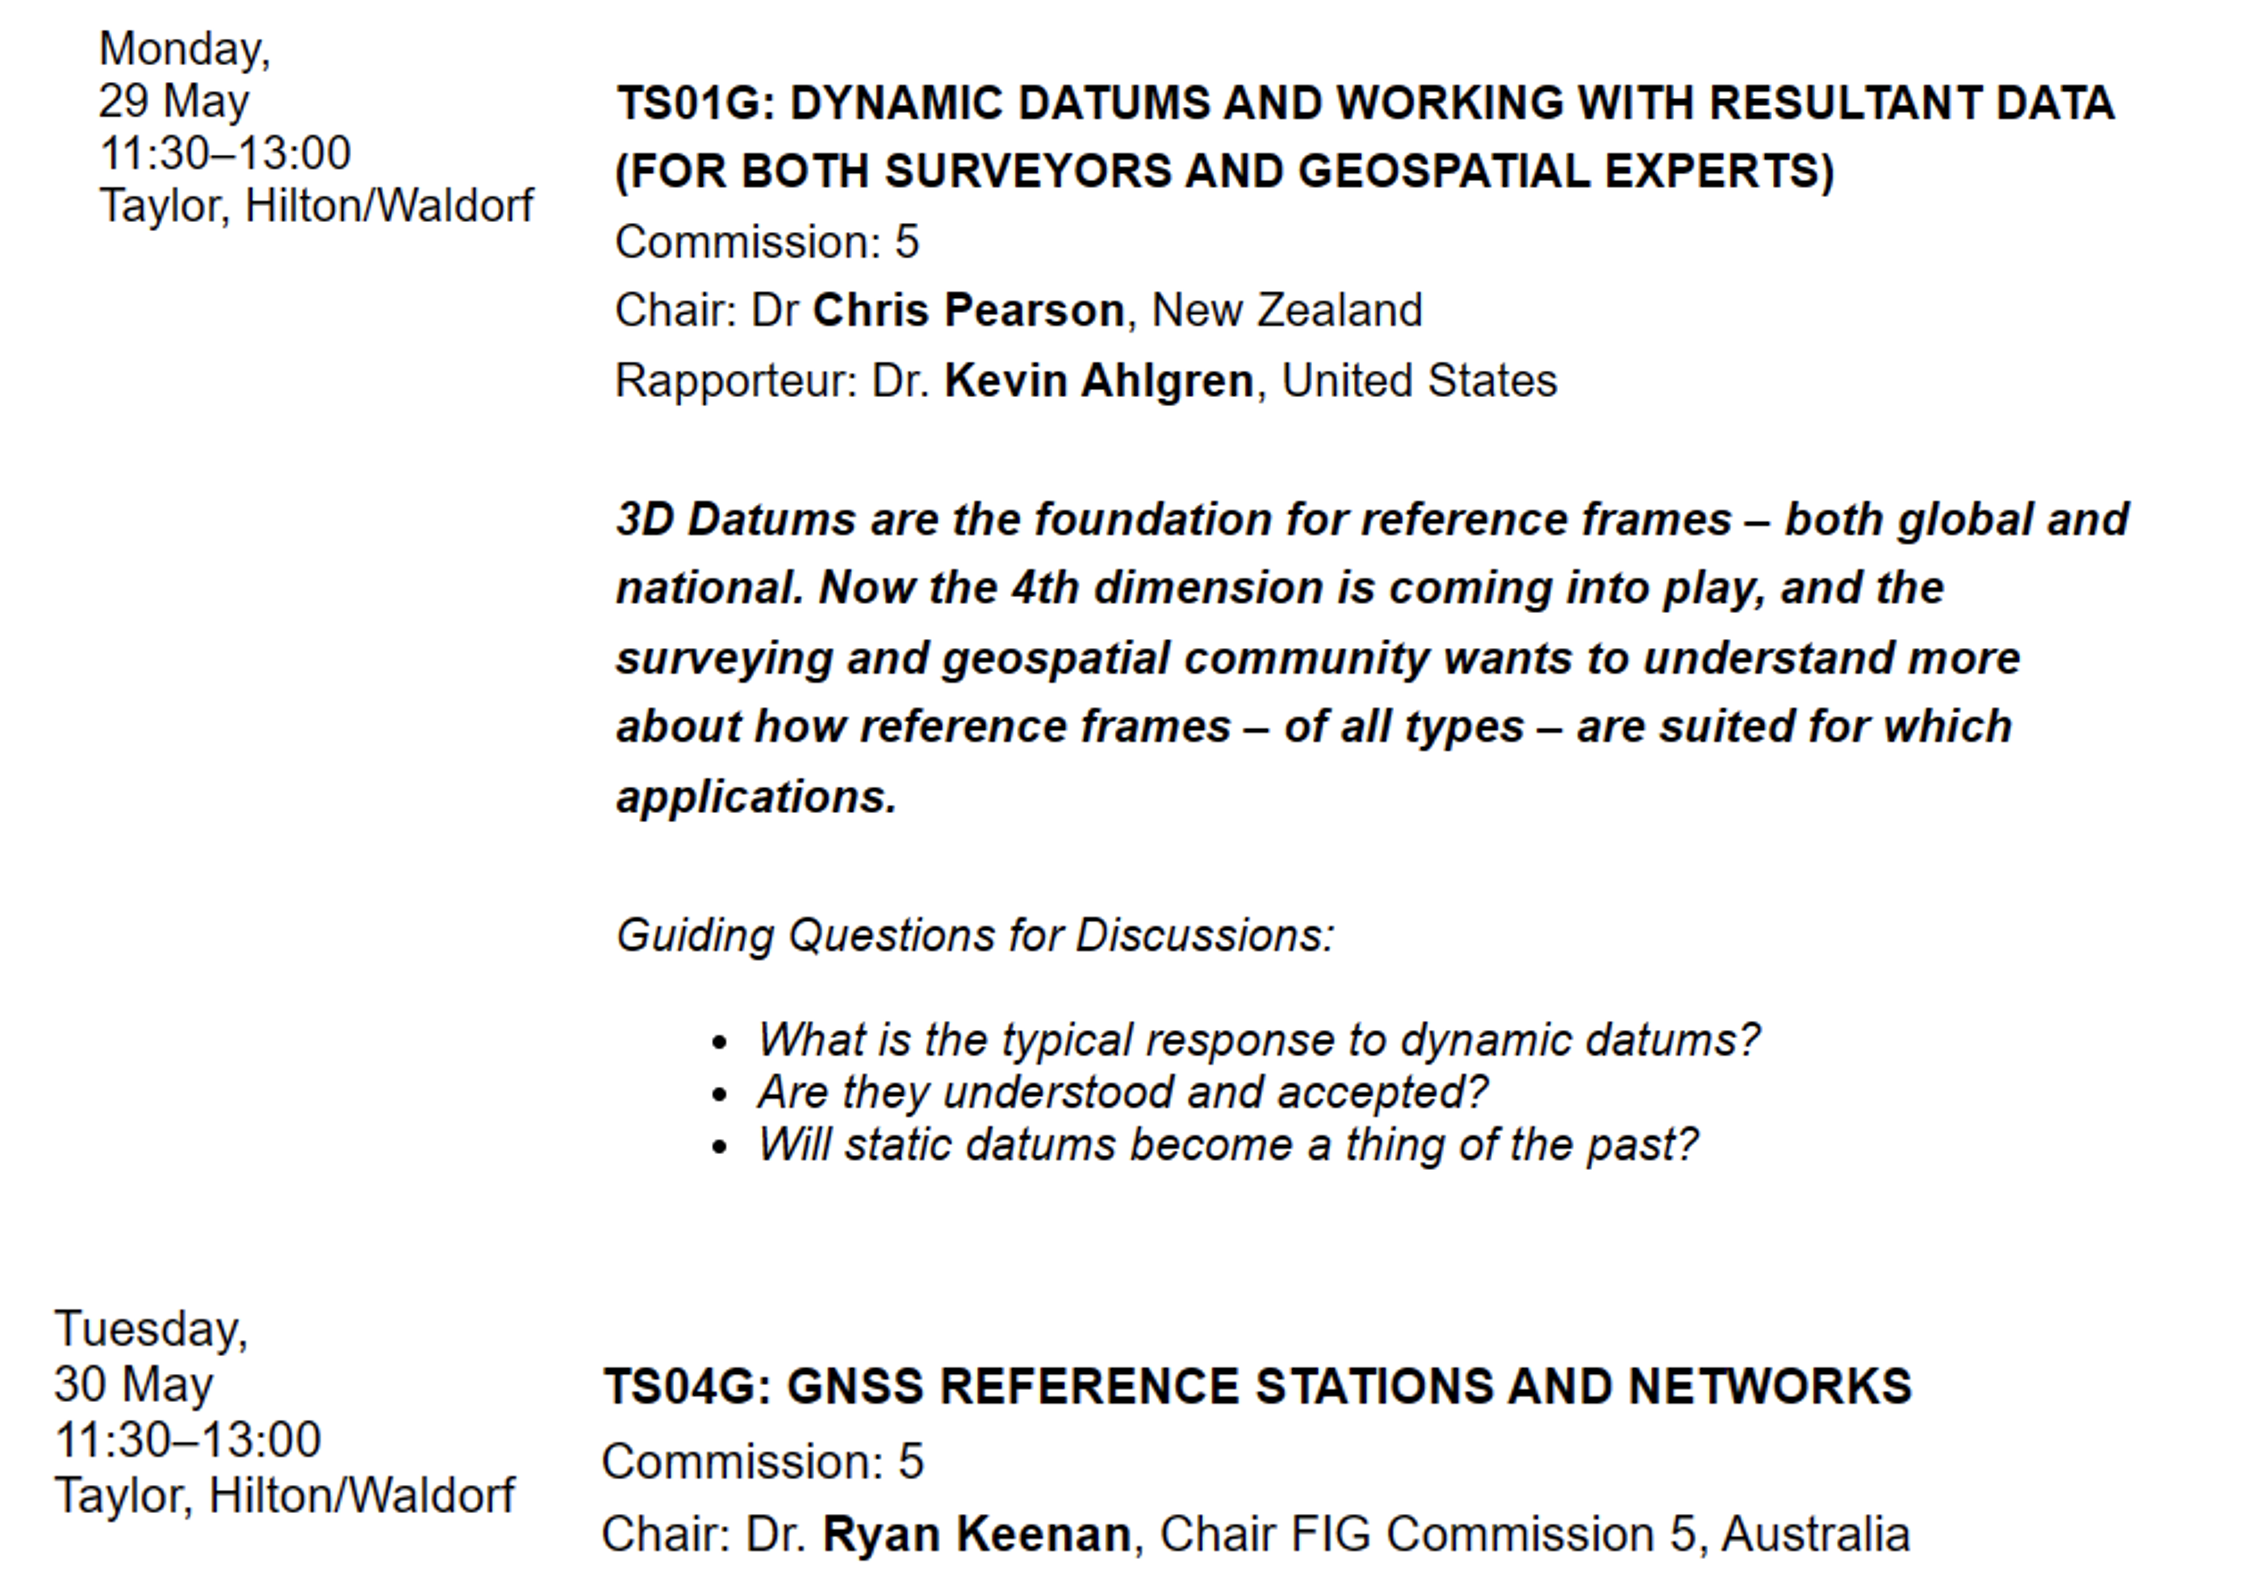
The full technical program lists the topics by date and time. I highlighted sessions by commission 5 and 6 that I think would be interested to the surveying and mapping community. See the image below.
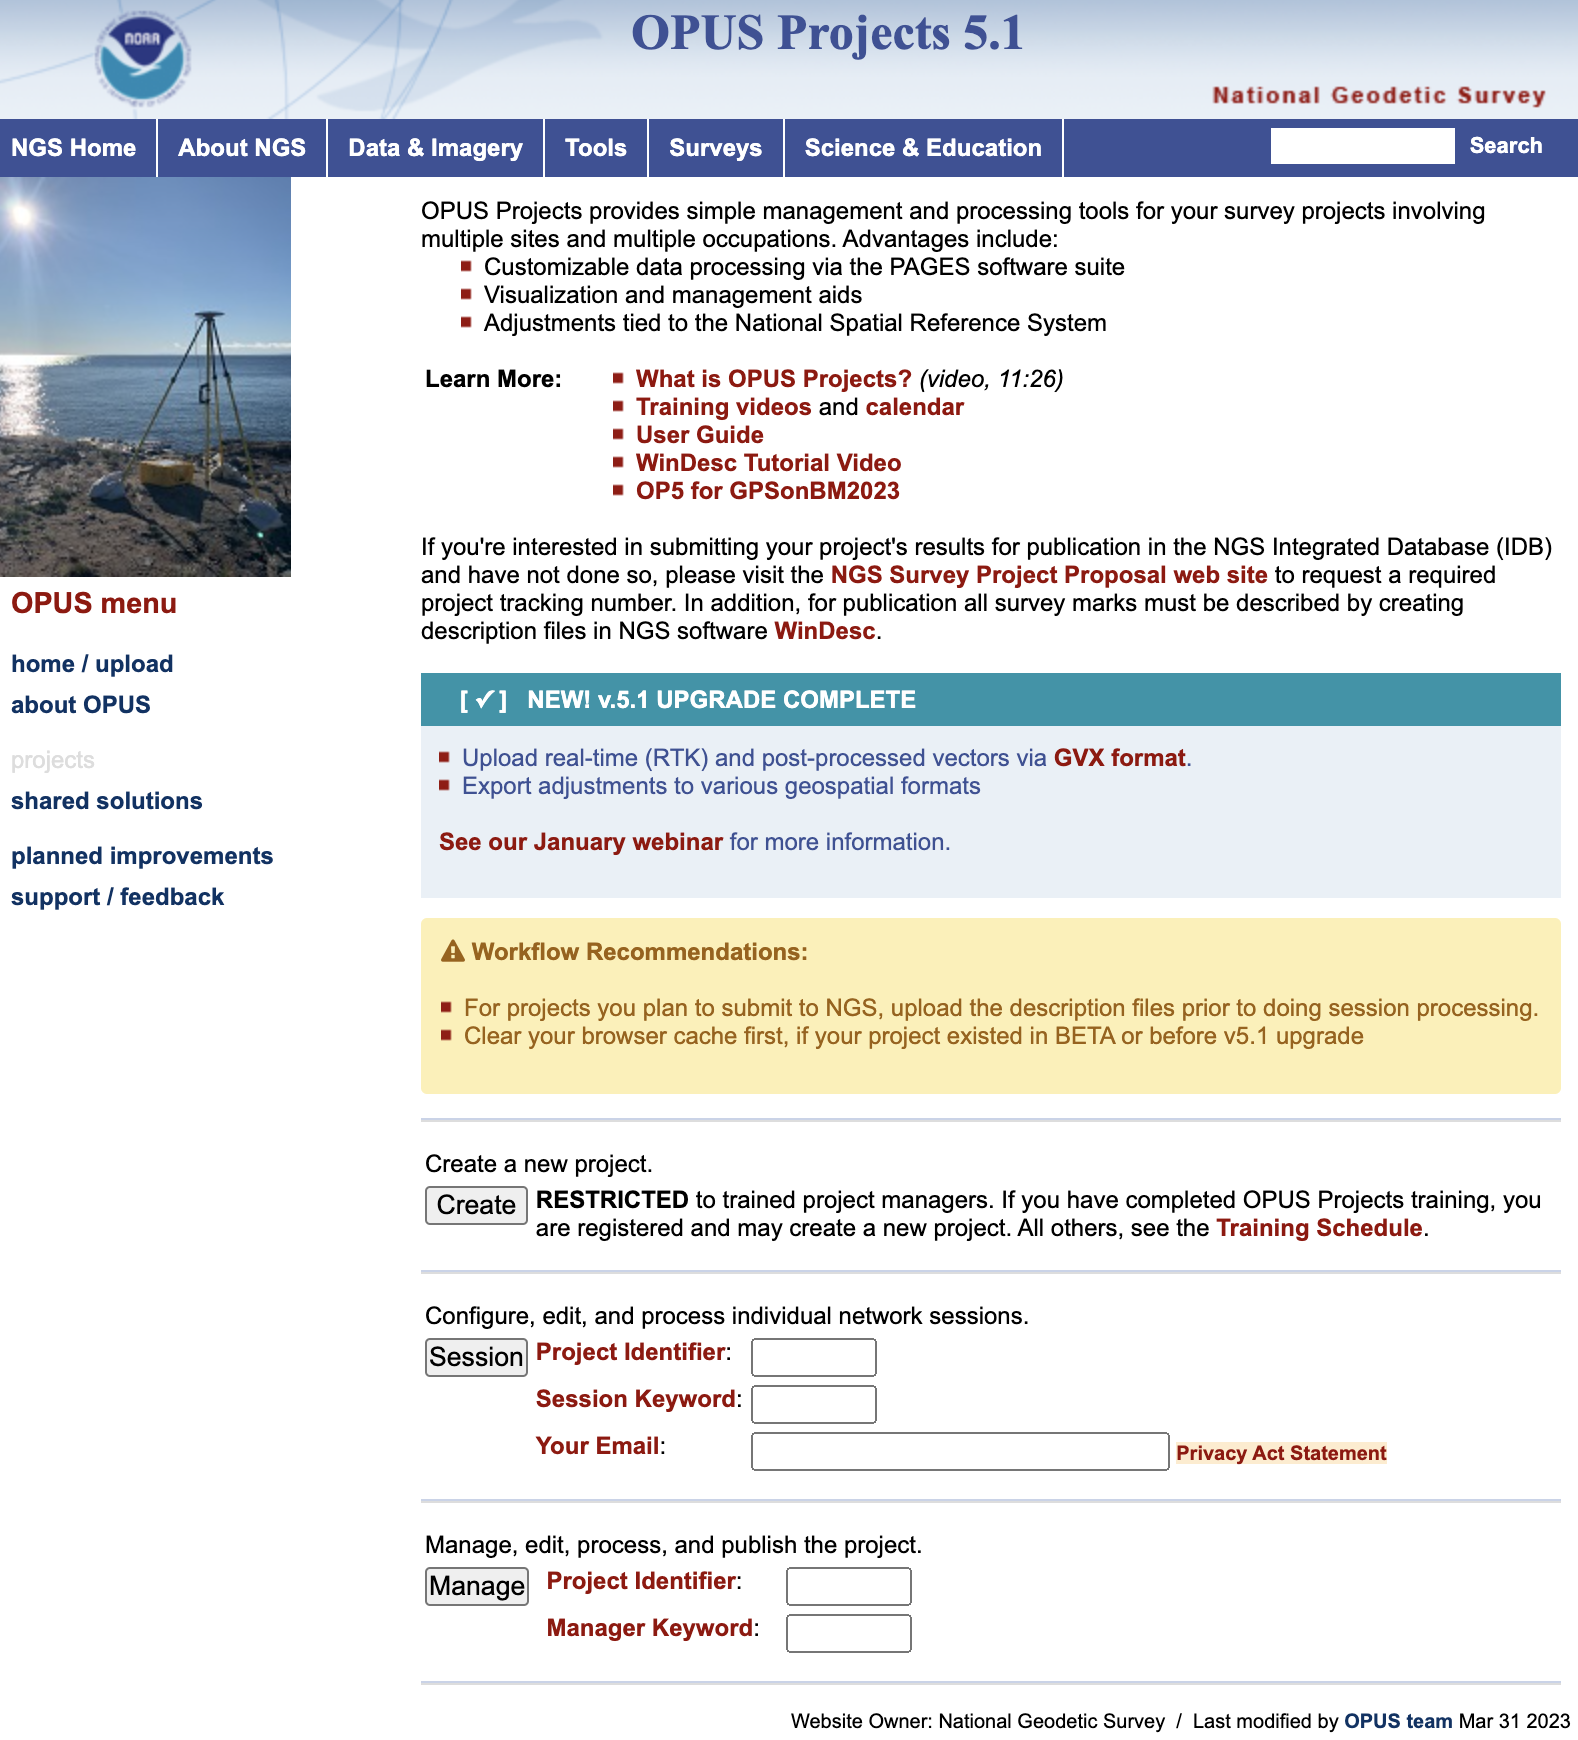
Finally, I would like to highlight a NGS product that is now in production mode. That is, OPUS Project 5.1 is now a production product. *NGS did not make an official announcement about this change, but if you access OPUS Project the new version comes up. As described in the March column, OPUS Project 5.1 routine allows the use of RTN vectors and post-processed vectors from vender software.
Clicking the “projects” icon on the OPUS page connects you to the latest version of OPUS Project 5.1. See image below. Please see the March column or NGS’ January webinar to learn more about OPUS Project 5.1.
Image: NGS Website
*Note: As of the writing of this column, March 29, it is still listed on the beta release section of NGS website. If you click on OPUS Project 5.1 in the Beta Release section, it will link to the production version of the routine.
Raytheon Intelligence and Space has been awarded a contract from the United States Navy’s Naval Air Traffic Management Systems Program Office to deliver the Joint Precision Approach and Landing Systems (JPALS) to the Japan Maritime Self-Defense Force (JMSDF). The GPS navigation and precision landing system will be deployed on the JMSDF JS Izumo carrier.
The JPALS system guides aircraft onto carriers and assault ships in all weather and surface conditions and is integrated on all F-35 aircraft. JPALS is also being deployed on all U.S. Navy aircraft and assault ships.
In addition, JPALS will be deployed on two international platforms, including the United Kingdom Royal Navy’s HMS Queen Elizabeth, and an Italian aircraft carrier, the ITS Cavour, to support its F-35 squadron.
The primary work locations for JPALS are in Largo, Florida and Fullerton, California.
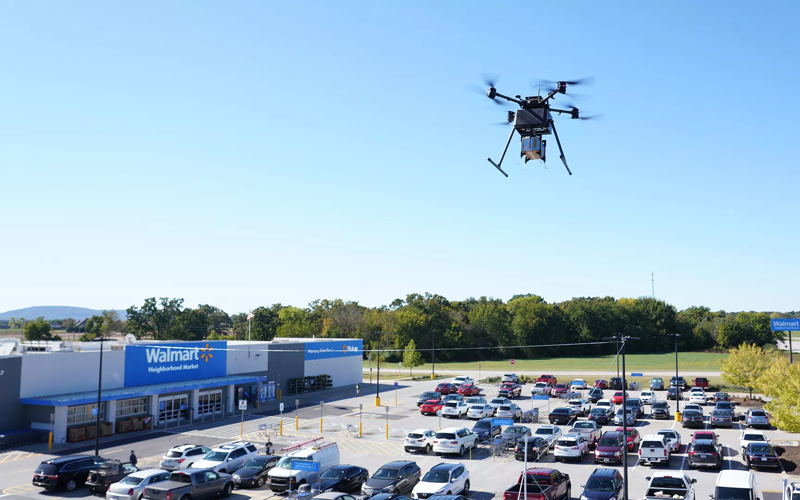
Two Walmart locations in Utah, one in Lindon and one in Herriman, are now providing UAV delivery for customers nearby. Walmart has UAV deliveries operated by DroneUp, Flytrex and Zipline at 36 stores in the United States.
For a $3.99 fee, customers within a mile of the stores can receive their groceries via UAVs. The two Walmart locations in Utah can deliver more than 120 times per day and each UAV can carry up to 10 pounds. The hubs for deliveries are in the parking lots of each Walmart location and are operated by Federal Aviation Administration-certified pilots.
Walmart is using UAV delivery in seven states, including Florida, Arizona, Texas, Utah, Virginia, North Carolina and Arkansas. The most common products delivered include ice cream, lemons, rotisserie chicken, Red Bull and paper towels, according to Walmart.
Walmart drone deliveries launched in October 2019 in Arkansas. In 2022, Walmart completed more than 6,000 deliveries across all 36 participating locations.
A photo taken in the aftermath of Hurricane Ian shows the massive destruction on Fort Myers beach. (Photo: felixmizioznikov/iStock/Getty Images Plus/Getty Images)
Not to harp on an event that’s already passed out of the headlines and national coverage, but Hurricane Ian — a Category 4 storm that hit Florida in September — was full of destructive winds and caused major damage that could be with us for years before things get fixed. One source also indicated that so far we have lost 157 people, mostly from drowning — nothing will ever fix those losses.
So harp on I will, especially about the role drones and drone pilots played in rescuing survivors, and determining and mitigating effects of the storm.
The place that took the hurricane hardest was Fort Myers on the southwest Florida coast. The following video is from a security camera.
While Hurricane Ian was making a mess of Cuba and crawling over the Caribbean and into the Gulf of Mexico, drones were already flying over areas where the storm could cross from the Gulf onto land — initially forecast around Tampa. But the forecast landfall continued to drift south, over where I live in Venice and 150 miles south of Tampa to Fort Myers.
Before landfall, drone operators in Fort Myers were gathering video/geolocation information on buildings and streets in the path that the forecast 14-foot storm surge might take. They identified areas of potential damage and places people might need rescue.
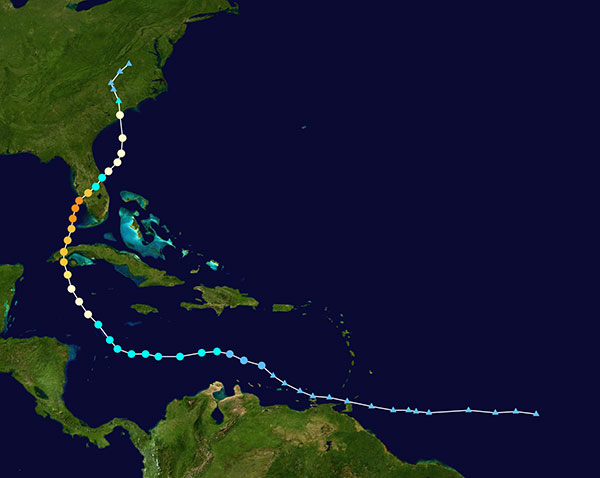
Map plotting the storm’s track and intensity using data from the National Hurricane Center and a NASA image. (Image: public domain/FleurDeOdile/Wikipedia)/
After the storm hit, first responders began searching more than 400 destroyed houses in Fort Myers, some using the pre-storm drone video to rescue any trapped survivors.
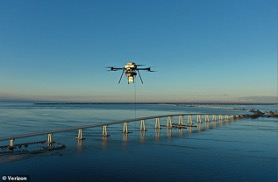
The need was not only for access in difficult conditions, but also for communications. AT&T reportedly got cell coverage up quickly in a couple of areas, and Verizon flew tethered drones (capable of flying for up to 1,000 hours) to restore phone coverage over a circular radius area of five to seven miles. Verizon also hooked up generators and engaged satellite internet coverage for local use, and took a portable cell-site on a barge out to Sanabel Island, which had been cut off from the mainland. T-Mobile put generators at cell-sites that lost power and deployed satellite and ground-based portable cell coverage.
Verizon tethered drones provided cellular service for first responders. (Photo: Verizon)
Powerful Drone
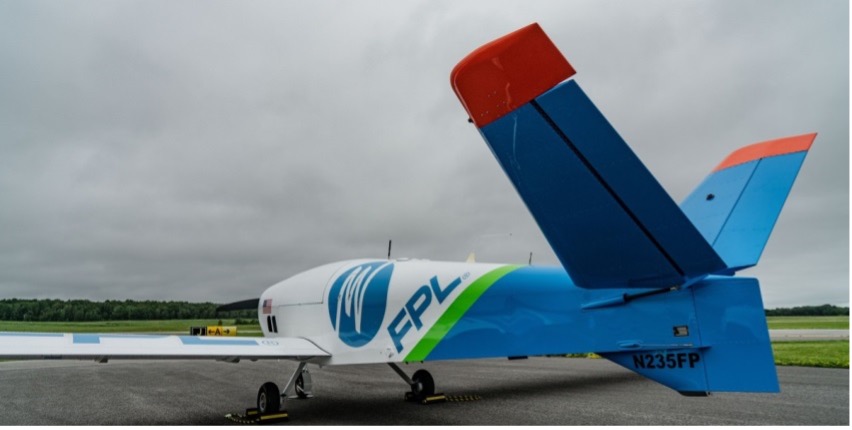
Loss of power was another issue. Florida Power and Light (FPL) flew its recently acquired fixed-wing FPLAir One drone to assess damage to its power distribution infrastructure, which supplies about 12 million people on Florida’s west coast.
FPL drone used in power loss assessment. (Photo: FPL)
Using the drone in damage assessment efforts enabled FPL to get suitable crews to the right places early in the recovery effort.
FPLAir One is a group 4/5 large UAV. It appears to be a Navmar Applied Sciences Corporation (NASC)/Sonex Aerospace TEROS unmanned aircraft, which is based on an earlier Sonex-powered glider design introduced in 2003. Because of this heritage and its rugged airframe, the TEROS is ideally suited for flights in high wind conditions — great for FPL’s long-range pre- and post-storm assessment application using FLIR and video cameras.
The drone’s extensive prior airframe proving is assisting NASC/Sonex in its quest for certification of TEROS by the Federal Aviation Administration (FAA). FAA certification will ultimately support its integration into the National Airspace System (NAS) and allow operators to move on from the individual FAA approvals required for each operational drone scenario.
Drones to the Rescue
The principal application for hundreds of drone flights by several organizations was search and rescue for missing residents, mostly in the flooded area in and around Fort Myers. Drones also helped rescue people in North Port, where floodwater was as high as four feet, collapsing roofs and trapping people in their homes.
Skydio provided drones for several search-and-rescue programs by police and other agencies, as well as coaching personnel who might lack experience in flying them. More than 500 drone flights were accomplished in the first days after the storm, a large number using autonomous flight capability, greatly assisting rescue efforts to locate trapped people. First responders were also able to determine whether access was possible, or what steps were initially needed to even enable access.
Insurance companies are also using drone assessment video, determining the level of damage to homes and vehicles, in an effort to put assistance where it was most needed early on. Using artificial intelligence to align food-stamp users with badly damaged homes identified on satellite images in Lee, Collier and Charlotte counties, GiveDirectly offered immediate $700-assistance to many survivors. If all these offers were accepted, the cost could be as much as $2.4 million in no-strings-attached immediate aid for those worst hit.
In the aftermath of the largest, most damaging hurricane to hit the United States since 1935, volunteers, first responders, drone pilots, aid agencies, and power, communication and insurance companies all made use of drones. These agencies and companies are still helping many thousands of people to survive and start the long task of picking up the pieces of their lives.


