The media is buzzing about the Great American Solar Eclipse that takes place Monday, Aug. 21.
It’s a historic event that last occurred 99 years ago. To be clear, 99 years ago is when the last total solar eclipse traversed the entire continental United States (lower 48 states).
To put that timeline in perspective, only one of the following inventions existed 99 years ago: FM radio, electric hair dryer, electric washing machine, frozen food, folding wheelchair and “talky” movies. Read further for the answer.
The last total eclipse that traversed part of the United States was 38 years ago, but in 1979 the total eclipse was only visible in five U.S. states (Washington, Oregon, Idaho, Montana, North Dakota). Have a look at the following map of the 1979 total eclipse path through the United States.
Figure 1- 1979 total eclipse path through the US. Source: NASA
It’s painful to think that in February 1979, when this eclipse occurred, I was a junior in high school in Oregon, living right in the path of the umbra (the moon’s shadow). I don’t recall the 1979 solar eclipse, but that doesn’t surprise me given the mind of a 16-year-old, at least mine.
Or, it could be the fact that was about 8:15 a.m. in February. Februaries in Oregon can be depressing due to the lack of sunlight. Anyway, it’s painful because today there are 37-year-old adults who were born after I graduated from high school. Time has flown by.
One of the points I was going to make in this article is how much GIS technology has improved since the last total solar eclipse in 1979, but that was 38 years ago. Given Moore’s Law, it should have improved exponentially in the past 38 years, and it has.
One way the evolution of GIS is displayed are the maps of the Great American Solar Eclipse of 2017. Let’s start with this basic one illustrating the path of the moon’s shadow as it traverses the United States:
My office is in Lake Oswego, and my house is just east of Lake Oswego, as illustrated here:
Figure 3- Solar Eclipse 2017 Oregon path. Source: eclipse2017.org
As you can see in the above map, my house and office are really close to the 100 percent eclipse path. In fact, using the following interactive map, I determined that from my house the sun will be 99.77 percent eclipsed.
Figure 4- Interactive 2017 Eclipse Map. Source: NASA
Now, for some cool animations. Back in 1979 (even 2000), animations were tough to produce. With today’s computing power and software, it’s quite straight-forward and quick to produce high-quality animations. The following is a screenshot from a 48-second animation from NASA’s YouTube channel showing the path of the total eclipse.
Figure 5- 2017 Solar Eclipse animation. Source: NASA
As GISers, you know that software is the engine. Engines need fuel to run. With GIS, fuel is data. For this next animation, two key pieces of data enable a new level of accuracy in plotting the umbra.
The first is the topography (surface map) of the moon. It’s not as round as it appears from Earth. Its surface has jagged edges from varied terrain just like the Earth.
The second is the vantage point on the Earth. In producing the following animation, NASA used SRTM elevation data collected from the Space Shuttle Endeavor mission in 2000. In 2014, the U.S. government released high-resolution SRTM data (30-meter) to the public. As a result, the following animation incorporates high-resolution data with unprecedented accuracy.
Figure 6 – 2017 Solar Eclipse animation using high-accuracy topo and SRTM data. Source: NASA
Where are you going to be on August 21st?
The fascinating part of this event is that no matter where you are located in the continental United States, you’re going to experience the effect of the solar eclipse.
As I mentioned above, at my house and office, I’ll experience about 99.77 percent eclipse. If I drive 15 miles south, I can experience 100 percent eclipse. The challenge is going to be traffic. It is expected that a few hundred thousand tourists will visit Oregon for this experience.
Traffic is already heating up. Gas stations may run out of fuel. Grocery stores may run low on food. I have no idea what to expect for traffic if I decide to make the 15-mile drive. I assume country roads as well as I-5, Oregon’s major interstate road, will be jammed and everyone will be driving at a snail’s pace and when the actual event is in progress, stop on the side of the road.
If I was a betting man, I’d say I’ll make the trek with a tank full of fuel and a sack lunch (~10:15am is go-time in Western Oregon). I’ll take one piece of equipment to document the event, my drone. If I plan it right, I should be able to grab some incredible images, not necessarily of the solar eclipse itself, but of the crowds of people mesmerized by the event. Follow my Twitter for updates.
Lastly, it was the electric washing machine. That’s the only invention listed in the opening paragraph that existed in 1918, when the last event like this occurred. The next one won’t be until 2045. I think I’ll make the 15-mile drive on Monday.
NASA and a team of Brazilian space researchers have announced a joint CubeSat mission to study phenomena in Earth’s upper atmosphere — a region of charged particles called the ionosphere — capable of disrupting communications and navigation systems on the ground and potentially impacting satellites and human explorers in space.
Two phenomena in the ionosphere — equatorial plasma bubbles and scintillation — have impacted GPS signals, radio communication systems and satellite technologies for decades, said Jim Spann, chief scientist for the Science and Technology Directorate at NASA’s Marshall Space Flight Center in Huntsville, Alabama.
Equatorial plasma bubbles are regions of comparatively low density which may elongate into towering plumes during high-intensity periods.
Scintillation is a unique type of atmospheric fluctuation that can interrupt radio frequencies, much like the “twinkling” effect seen in starlight when optical frequencies are disrupted.
The Scintillation Prediction Observations Research Task (SPORT) mission, funded by NASA’s Science Mission Directorate in Washington, will observe these peculiar structures in order to understand what causes them, determine how to predict their behavior and assess ways to mitigate their effects.
The joint U.S.-Brazilian team, led by Spann as principal investigator, will design and launch SPORT as a CubeSat, a compact satellite about the size of two loaves of bread. It will be launched in 2019 to an Earth orbit 217-248 miles high (350-400 km). Its operational phase is expected to last at least a year.
“Degraded communications and GPS signals are known to be closely linked to these phenomena,” Spann said. It’s his goal to shed new light on these phenomena and inspire new operational solutions to contend with the disturbed conditions.
Protecting Brazil’s aviation, agriculture
The Brazilian SPORT team seeks targeted solutions as well. Otavio Durão, project manager for the team at Instituto Nacional de Pesquisas Espaciais (INPE) in São Jose dos Campos, a São Paulo municipality, said ionospheric responses to a space phenomenon called the South Atlantic Anomaly or the South American Magnetic Anomaly — where space radiation dips close to Earth — negatively impacts Brazil’s busy airports.
“Our country is interested in refining GPS signal processing, making takeoffs and landings safer and more precise,” he said. “Because so many international flights come to and through Brazil, this should be a matter of concern for all countries.”
Brazil’s strong agricultural industry also is concerned about the anomaly’s effects on GPS, said Durão’s colleague Luís Loures, the SPORT spacecraft manager at the Instituto Tecnológico da Aeronáutica in São Jose dos Campos.
“Our agribusiness is always trying to increase crop productivity,” he said. “One way to accomplish this is by using automated tools. But being able to precisely position those automated tractors and field sprayers, without disruption from solar phenomena, is crucial.”
“As society becomes more dependent every day on space-based technology — cell phones, self-driving cars, secure military communications — it’s critically important we first understand the environment in which our technology resides, then learn how to operate through and preserve it from potentially disruptive or damaging interference,” Spann said.
Understanding the phenomena
Building on decades of previous ground-based studies of plasma bubbles over equatorial regions, especially intensive research in Brazil and Peru, SPORT will help researchers determine what’s happening in the ionosphere to stir up the bubbles, why they form along the equator and what causes them to appear at night.
Plasma bubbles and scintillation are global equatorial and mid-latitude phenomena, made worse by the South American Magnetic Anomaly, where Earth’s magnetic equator dips close to Earth.
“Many of the discoveries to date have been confined to a limited number of longitudinal sectors,” Spann said. “SPORT will make a systematic study of the ionosphere at all longitudes around the planet, documenting the conditions that trigger formation of the bubbles, with particular focus on the South American sector.”
As multiple instruments on the ground also record data, Spann said, SPORT will probe the ionosphere from above. During subsequent passes, it will study specific sectors to identify conditions favorable for developing plasma bubbles and ionospheric scintillations.
These simultaneous satellite and ground-based studies will help researchers identify how the observations are related, providing a better understanding of the results at all longitudes.
The team is confident the findings will enable researchers to use physics-based models to determine the physics of plasma bubble triggers, and thus identify the resulting scintillation of radio signals that propagate throughout the turbulent region.
More about SPORT
SPORT science mission data will be distributed from and archived at the EMBRACE space-weather forecasting center in Brazil’s National Institute for Space Research (INPE) and mirrored at the Space Physics Data Facility at NASA’s Goddard Space Flight Center in Greenbelt, Maryland.
The SPORT mission management team is led by Marshall alongside its international partners, the Brazilian Space Agency in Brasília, and the National Institute for Space Research and Technical Aeronautics Institute, both in São Jose dos Campos, São Paulo.
Spann’s team, which oversees the mission science, flight instruments and the CubeSat launch, includes researchers at Marshall; Goddard; Utah State University in Logan, Utah; The Aerospace Corporation in El Segundo, California; the University of Texas at Dallas; and the University of Alabama in Huntsville.
NASA’s Brazilian partners are overseeing the development of the spacecraft; integration and testing; mission operations; data management and dissemination; and the ground observation network. The science analysis will be conducted by the entire team.
NASA has issued a statement to let the GPS community know what to expect when the total solar eclipse takes place across America on Aug. 21.
On Aug. 21, the eclipse will cross all of North America. Anyone within the path of totality will see the moon completely cover the sun, and the sun’s tenuous atmosphere — the corona — can be seen.
Observers outside this path will still see a partial solar eclipse where the moon covers part of the sun’s disk.
A map of the United States showing the path of totality for the August 21, 2017 total solar eclipse. (Image: NASA)
For NASA, the eclipse provides a unique opportunity to study the sun, Earth, moon and their interaction because of the eclipse’s long path over land and coast to coast. Eleven NASA and NOAA satellites, as well as the International Space Station, more than 50 high-altitude balloons and hundreds of ground-based assets, will take advantage of this rare event over 90 minutes, sharing the science and the beauty of a total solar eclipse with all.
Via live streams and a NASA TV broadcast, NASA will bring the Aug. 21 eclipse live to viewers everywhere in the world.
Below is the statement from NASA regarding GPS.
NASA Note on the Aug. 21 Solar Eclipse and Its Effect on GPS Users
FOR THE GPS COMMUNITY
From ionospheric point of view, the expected effect of solar eclipse is a significant reduction in solar EUV ionization (solar EUV radiation is blocked) and thus in the amount of ionospheric total electron content (TEC) with respect to nominal conditions along the eclipse path.
Some observations also show wave-like TEC perturbations in small magnitude (~1 TECU) during eclipse as shown in the attached reference. The wave-like perturbations appear to be the effect of atmospheric gravity waves or traveling ionospheric disturbances (TIDs) that might be triggered during eclipse.
The TEC decrease would reduce ionospheric-induced delay of GPS signals. The small-magnitude TIDs won’t cause any major effects on GPS signals. These should not cause loss of GPS signals.
I have not seen any reports about ionospheric scintillation observations during eclipse (I might have missed them). It would be interesting to analyze GPS data along the path of upcoming August eclipse to see if any scintillation events could be triggered.
We have some GPS data processing tools at JPL and can contribute to this analysis.
FOR THE GENERAL PUBLIC
A solar eclipse occurs when the Moon passes between the Sun and the Earth, thereby totally or partly obscuring the image of the sun for a viewer on Earth. There is a region of Earth’s upper atmosphere, called the ionosphere which affects radio waves, including GPS.
The ionosphere consists of “ions,” a shell of electrons and electrically charged atoms and molecules. Because ions are created through sunlight interacting with the atoms and molecules in the very thin upper atmosphere, the density (thickness and consistency) of the ionosphere varies from day to night.
The ionosphere bends radio signals, similar to the way water will bend light signals. That is why you can hear AM radio broadcasts from far away at night. Also, ham radio operators rely on the ionosphere to bounce their signals from their station to the far reaches of the globe.
Since GPS is a radio signal, its measurements are slightly impacted by ionosphere changes, resulting in small increases in position error. For all except very precise GPS users, these changes are negligible.
Note that a total eclipse of the Sun is similar to our day-night cycle, only much faster. So, while the ionosphere will be more dynamic during an eclipse, it will not cause a loss of the GPS signal.
In summary, while any effects from the eclipse are of scientific interest, GPS service should not be adversely affected by the Aug. 21 solar eclipse.
Ionospheric effects should not be confused with those from solar flares (a brief eruption of intense high-energy radiation from the sun’s surface) that can cause significant electromagnetic disturbances on the earth, impacting radio frequency communications/transmissions (including GPS signals) and power line transmissions. Solar flares are not produced because of an eclipse.
(NASA acknowledges the expertise of Larry Young and Xiaoqing Pi of NASA’s Jet Propulsion Laboratory for content, and AJ Oria of Overlook Systems Technologies for the coordination and editing of these statements.)
The European Space Agency (ESA) and the U.S. National Aeronautics and Space Administration (NASA) are conducting a joint GPS/Galileo space receiver experiment onboard the International Space Station (ISS). This will be the first time that a combined GPS/Galileo receiver will operate in space.
The project aims to demonstrate the robustness of a combined GPS/Galileo waveform uploaded to NfASA hardware already operating in the challenging space environment: the Space Communications and Navigation (SCaN) software-defined radio testbed.
Testing activities include analysis of the GPS/Galileo signal and onboard position/velocity/time (PVT) performance; processing of code- and carrier-phase GPS/Galileo raw data for precise orbit determination (POD); and validating the added value of a space-borne dual-GNSS receiver compared to a single-system receiver under the same conditions.
This collaboration was initiated in 2014 and a Technical Understanding was signed in 2016.
Many new space applications may not be possible if constrained to using the limited signal availability associated with any single constellation of GNSS satellites.
This research therefore seeks to demonstrate the enhanced capabilities brought by the use of satellites from two or more GNSS constellations in the space domain. The net result will be more resilient space operations, greater mission flexibility, and enhanced PVT performance.
The project is currently in the testing and verification phase, and it is expected that the final implementation of the combined GPS/Galileo waveform on NASA’s SCaN Testbed on-board the ISS will be completed in September/October 2017, so that the initial operations of the first combined GPS/Galileo receiver in space can start in the October/November 2017 timeframe.
The researchers plan to present preliminary results at the UN International Committee on GNSS (ICG)-12 in Kyoto, Japan in December.
From ESA’s side, ESOC’s Navigation Support Office (NavSO) and ESTEC Experts for Radio Navigation Systems and Techniques (TEC-ESN) are involved in this project.
The overall project management from ESA’s side and POD aspects are covered by NavSO, and ESTEC’s Technical Directorate is in charge of the Galileo waveform development and implementation of the SW on the FPGA in cooperation with NASA. This activity is done with technical support from industry participants such as Qascom. Industry participation is a vital component as new markets for multi-GNSS receivers and complex space applications continue to emerge.
From NASA’s side, the project is sponsored by the Space Communications and Navigation (SCaN) Program within the Human Exploration and Operations Mission Directorate (HEOMD) at NASA Headquarters in Washington D.C. Integration and experimentation activities are being performed by the NASA Glenn Research Center.
NASA has initiated an international effort within the ICG to develop a fully interoperable multi-GNSS Space Service Volume (SSV), where a combination of constellation services will be available well above low-Earth orbit (LEO) to support newly emerging geostationary Earth orbit (GEO) and high-Earth orbit (HEO) missions — ranging from more precise station keeping to extend GEO belt capacity and maneuver recovery to enabling formation flyers and satellite servicing operations.
WERNER ENDERLE is head of Navigation Office, Ground Systems Engineering Department at the European Space Operations Centre of the European Space Agency.
JAMES J. MILLER is deputy director, Policy & Strategic Communications – Space Communications and Navigation in the Human Exploration and Operations Mission Directorate at NASA headquarters.
Anomalous GPS Signals from SVN49
By Fabio Dovis, Nicola Linty, Mattia Berardo, Calogero Cristodaro, Alex Minetto, Lam Nguyen Hong, Marco Pini, Gianluca Falco, Emanuela Falletti, Davide Margaria, Gianluca Marucco, Beatrice Motella, Mario Nicola and Micaela Troglia Gamba
Researchers at the Navigation Signal Analysis and Simulation (NavSAS) Group of the Politecnico di Torino detected in mid-May the presence of anomalous spikes in the L1 signal spectrum. The origin of the spikes was identified to be transmission of a non-standard code from a non-operational GPS satellite (GPS IIF-9, SVN49). Here we report on signal observations and address possible impacts on GNSS signal processing.
On May 17, 2017, during outdoor data collection, NavSAS researchers detected two spikes in the L1 spectrum, with sufficient power to be clearly visible on a display processing raw digital samples at the receiver’s intermediate frequency.
An initial check looked for a possible interfering source in the experimental set-up, since it was quite complex with multiple pieces of electronic equipment. The likelihood of this source was soon dispelled as the same kind of spectrum was visible on a spectrum analyzer (SA) connected to an active survey-grade GNSS antenna on the lab roof; results shown in FIGURE 1.
The spectrum is centered at 1575.42 MHz, with the SA set to a frequency span of 5 MHz. Connecting the SA to different survey-grade antennas on the roof, we found no remarkable differences. The spikes continued to appear on subsequent days, becoming clearly visible around 13:00 UTC and disappearing around 19:00 UTC.
Figure 1. L1 Spectrum of the received signal at 16:51 (Central European Summer Time; 14:51 UTC) on May 19, 2017, at the NavSAS Lab, Torino (located at 45°03’54.98767″ N, 7°39’32.28920″ E, 311.9667 meters).
Exclusion of Terrestrial Sources. The 24-hour repetition period of the phenomenon, along with the shape of the spectrum, could indicate the presence of a signal anomaly from a GNSS satellite. In a battery of tests, we probed the L1 spectrum in a wider area using assorted equipment.
For various reasons, we ended up focusing on a non-operational satellite: SVN49, launched March 24, 2009. We concluded that transmission of a non-standard code (NSC) from this satellite was the origin of the problem in the L1 spectrum.
Transmission of NSCs for testing purposes is foreseen in the GPS Interface Specification, IS-GPS-200. GPS satellites can switch off regular broadcasts of C/A code and P/Y code and transmit a non-standard C/A code and non-standard Y code.
Such operation is intended to protect users from receiving and utilizing erroneous satellite signals in case of unhealthy conditions on the spacecraft. Strictly speaking, this case cannot be formally considered as an “anomaly,” because the transmission of non-standard codes is documented in the IS-GPS-200.
Therefore, the transmission of an NSC can be considered a normal operation in itself, though it may reflect a problem with the transmitting satellite.
In this case the choice of the spreading sequence, which is likely a square wave, allowed the total power of the signal to be concentrated in just a few spectral components, thus originating continuous-wave-like in-band signals.
The distribution of the harmonics, the main components of which are at ±500 kHz, and the presence of the odd harmonics only, matches an earlier case in 2006 of a transmission of an NSC modulated as a binary-phase-shift-keying (BPSK) sequence with alternating logical 0s and 1s, transmitted at the C/A code chipping rate (Rc=1.023 megachips per second). The hypothesis of the BPSK with Rc=1.023 megachips per second spreading signal has been verified by simulation.
However, the NSC is designed to have negligible effect on tracking other healthy GPS satellite signals. Nonetheless, an NSC transmission can have a non-negligible impact in performance of user equipment.
When a GPS satellite is switched to NSC mode, a receiver immediately loses its capability to track that satellite signal. This is not the case with SVN49, as it is currently declared non-operational. However, due to the modified code sequence, a further effect is possible: the NSC introduces irregular components at a sustained level in the GPS signal spectrum.
According to Notice Advisory to Navstar Users (NANU) 2017001, SVN49 was broadcasting standard signals as PRN04 (though set unhealthy) since the beginning of the year; NANU 2017042 announced that PRN04 was to be re-allocated to SVN38 on May 18.
This switch matches the dates when we started to see the spikes, since, probably, SVN49 started that day to use the “square wave” for the spreading.
Implementing the square wave local code, it has been possible to successfully acquire and track the NSC.
The real-time software receiver N-Gene has been forced to acquire and track in real time the signal coming from SVN49. The receiver decoded the navigation message transmitted by SVN49, which exhibits a regular format, even if marked with an unhealthy flag.
Impact on Receiver Processing. Interference with harmonic components such as those generated by the use of a square wave could strongly impact a GNSS receiver in the acquisition and tracking blocks, because the interference power is dispersed over the whole search space by the correlation with the local code, compromising the acquisition accuracy and impacting other functional blocks.
The impact of interference spectral lines depends on their location within the frequency band. This is due to the almost periodic nature of the GNSS signals. The spectrum of a GNSS signal has components spaced at multiples of the inverse of the code period (for example, 1 kHz for GPS C/A code) with different power allocated to each component depending on the shape of the code spectrum.
The effect is larger in the case of matching of the interference spectral components with the ones of the GNSS signal. Furthermore, in this case, the strongest harmonics are close to the L1 carrier frequency and are not mitigated by the front-end filter since they fall within its narrow bandwidth.
The overall GNSS scenario has changed a lot recently. Galileo and BeiDou are also present, and Galileo signals, due to the different structure and code periods, have spectral lines spaced at 0.25 kHz. The frequency modulation of the interfering signal due to the variable Doppler shift is thus even more likely to hit some of the spectral components of these signals.
We are investigating further to assess the impact of the interfering signal from SVN49 on Galileo-based high accuracy applications.
U.S. Air Force Response
The 2nd Space Operations Squadron is performing maintenance on a presently non-operational satellite. SVN49 is broadcasting non-standard C/A and non-standard Y codes as described in IS-GPS-200. Space professionals continue to conduct safe and responsible command and control of the constellation to continue to provide accuracy that exceeds established system requirements.
As always, GPS users who experience issues should address them through the appropriate channels: military users should contact DSN 560-2541, commercial 719-567-2541 while civilian users should contact the U.S. Coast Guard Navigation Center at 703-313-5900.
Very Respectfully,
Nicholas J. Mercurio, Capt., USAF Director, 14th Air Force/JFCC SPACE Public Affairs
NASA’s UTM. On May 25, the Federal Aviation Administration (FAA)-designated Nevada UAS Test Site and its NASA partners flew five different unmanned aerial vehicles (UAVs) to test NASA’s Unmanned Aircraft System Traffic Management (UTM).
The flights demonstrated multiple operational scenarios, including parachute-initiated emergency supply deliveries and aerial survey operations.
The UAVs were flown beyond the pilot’s visual line of sight (BVLOS) using strategically placed visual observers and sophisticated command and control, communication and detect-and-avoid technologies.
The test is part of a three-week national campaign, which NASA is leading in close collaboration with the FAA and industry partners on a more complex version of its UTM technologies at six different UAS Test Sites around the nation.
Demonstration in France. In France, Delair-Tech flew a UAV for 30 miles, simulating powerline inspection. Delair used a regular, commercial 3G cellphone network to control the drone for the test — an innovative demonstration that long-distance drone operations can be safe and simple to achieve.
Canadian Deliveries.Drone Delivery Canada Corp. (DDC) hit a pivotal milestone toward commercializing its drone logistics platform after achieving BVLOS in test flights. Systems tested include DDC’s FLYTE management system, avoidance technology and communications platform.
During flights in Alberta, DDC’s Mission Control Centre in Toronto, 2,500 kilometers away, successfully monitored and record telemetry in real time. DDC could become the first drone logistics-compliant operator approved by Transport Canada.
NASA’s UAS Traffic Management System was tested May 25 at the Nevada UAS Test Site. (Credit: Drone America)
On May 25, the Federal Aviation Administration (FAA)-designated Nevada UAS Test Site and its NASA partners flew five different unmanned aerial vehicles (UAVs) to test NASA’s Unmanned Aircraft System Traffic Management (UTM).
The flights demonstrated multiple operational scenarios, including parachute-initiated emergency supply deliveries and aerial survey operations.
The UAVs were flown beyond the pilot’s visual line of sight using strategically placed visual observers and sophisticated command and control, communication and detect-and-avoid technologies.
The test is part of a three-week national campaign, which NASA is leading in close collaboration with the FAA and industry partners on a more complex version of its UTM technologies at six different UAS Test Sites around the nation.
The Technology Capability Level 2 (TCL2) National Campaign began May 9 with the Nevada UAS Test Site as the first of six UAS Test Site to begin UTM operations this year.
The partners not only demonstrated drone flight capability, but also tested UAS traffic mapping, sensor and radar technology, all of which were connected through a NASA UAS service supplier network to NASA Ames Research Laboratory.
Six FAA UAS Test sites and industry partners integrate their technologies with NASA’s UTM research platform and test the UTM concept in a range of conditions representative of those in the U.S. Airspace, explaind Tom Prevot, UTM project manager.
“For the Nevada NASA Team, we flew the longest multi-faceted NASA UTM flights to date in Nevada,” Prevot said. “The beyond-line-of-sight missions we completed over a distance of 13 miles north of Reno, Nevada, and the multiple aerial parachute package-delivery missions performed were a first in the National Airspace System under the NASA UTM.”
Current testing of the UTM TCL2 Test marks the second year in a row NASA has taken its UTM technologies on the road to further assess and refine their capabilities. During April 2016, NASA and its partners tested TCL1, which involved line-of-sight operations, and then began the first phase of TCL2 demonstrations in October 2016.
Two more phases, TCL3 and TCL4, each progressively more complex and involving flying drones with specific tasks over increasingly populated areas, are scheduled for 2018 and beyond.
The aerial parachute package-delivery missions performed were a first in the National Airspace System under the NASA UTM. (Credit: Drone America)
“Our Nevada NASA partners did an amazing job in extending the body of airspace management and sense-and-avoid knowledge under the UTM and across the UAS Industry,” said Chris Walach, director of the Nevada UAS Test Site. “The National Campaign data provided to NASA from our two-week operation will go a long way toward advancing the UTM for the FAA and the UAS Industry.”
“At AirMap, we consider UTM to be a critical ingredient for a thriving drone ecosystem,” said Steve Willer, business development manager for AirMap. “The TCL 2 trials demonstrate that technologies for geofencing, data exchange, and more can enable safe and sophisticated drone operations, even beyond line of sight. Along with NASA, the FAA, and NIAS we’re excited to show how UTM can chart a safe course for the drone ecosystem.”
“Drone America is a proud participant in a Nevada Institute for Autonomous Systems (NIAS) led NASA Unmanned Traffic Management (UTM) program at the Reno Stead Airport,” said Mike Richards, president and CEO of Drone America. “The safe integration of Unmanned Aerial Systems (UAS) into the National Airspace System (NAS) is critical to the future of this industry. Drone America is fortunate to call Nevada our home. Working in a state that is very supportive and business friendly makes a tremendous difference to our future sustainability. Our partnership with NIAS and NASA will not only contribute to successful testing, this partnership will pave the way for future generations to experience the true value of autonomous systems.”
“Carbon Autonomous Systems of Reno, in conjunction with their partner SmartPlanes of Skellefteå, Sweden, successfully took part in the planning, coordination, and flying in the most recent TCL2 NASA / NIAS UAS/UTM exercises conducted at the Reno Stead Airport UAS Test Range of the Nevada FAA UAS statewide test complex,” said John Hammond, chief pilot for Carbon Autonomous.
NIAS was also supported by Delair-Tech and SensoFusion who provided UAS and drone detection UAS technologies, which were also tested during this NASA UTM TCL 2 Test.
“We have been designing, manufacturing, and operating UAVs in the civilian airspace for almost 10 years in 100 countries,” said Benjamin Benharrosh, co-founder and head of Delair Tech North America. “This landmark agreement with NIAS, and the associated data collected for the UTM system designed by NASA at the Reno UAS Test Site will push our traffic management technology to a new level of precision and insight. We are thrilled to collaborate with NIAS on solutions that represent a new era for the commercial UAV market and a better presence of Delair-Tech in the U.S.”
“We’re excited to be shaping the future of air traffic management as an official partner of the NIAS by providing our counter-UAS solution, AIRFENCE, in the ongoing NASA UTM project. AIRFENCE is playing an active role in detecting, locating, and tracking UAS as part of the project, providing rich data to NASA as they develop their UTM system,” said Kaveh H. Mahdavi, Sensofusion VP of operations.
“NASA is one of Nevada’s most valuable partners. We appreciate the opportunity to support NASA’s UTM development. It is truly cutting-edge technology and will be instrumental in integrating UAS into the national airspace,” said Tom Wilczek, Aerospace & Defense Industry Representative for the Nevada Governor’s Office of Economic Development.
The app provides a new way to measure marine environments on a 3D interactive map for more cost-effective fishery planning and informed conservation.
Esri has released an Ecological Marine Units (EMU) app for mobile devices. The app is a resource for scientists, educators, governments and industries seeking accessible information and imagery about the ocean’s long-term physical and nutrient properties.
The EMU app puts data such as temperature, salinity and dissolved oxygen from 52 million locations throughout the world’s oceans at any user’s fingertips. This data informs how livable marine environments are for ocean-dwelling species as well as the overall health of the ecosystem.
Organizations involved in fishery planning, for instance, can use the EMU mobile app to review proposed boundaries with a better understanding of which habitats will likely harbor certain species and manage fisheries more cost-effectively.
By using the EMU mobile app, industries that depend on fishing yields can spend less time and money on areas that are less profitable. Conservation groups that need easy access to information on the environments of marine protected areas (MPA) to more effectively regulate them now also have a mobile tool for understanding the chemical makeup of these areas.
“The EMU mobile app will serve as a fresh, widely available resource for professionals who benefit from a deeper understanding of the ocean’s structure — its salinity, temperature, oxygen levels and nutrients,” said Dawn Wright, Esri chief scientist. “Scientists and nonscientists alike who must study and understand the ocean now have the freedom of a convenient mobile interface with this vast wealth of environmental data.”
The primary data source for the EMU mobile app is the National Oceanic and Atmospheric Administration’s (NOAA) authoritative World Ocean Atlas, with marine chemistry information from the National Aeronautics and Space Administration (NASA) and topographic data from GRID-Arendal.
The app provides access to this globally comprehensive, data-driven 2D and 3D data and serves as an educational tool for easily understanding marine environments and how they are affected by climate change.
The EMU mobile app is free from the App Store and Google Play.
With a legacy of delivering reliable, robust, and highly accurate small Unmanned Aircraft Systems (sUAS), NASA has awarded Black Swift Technologies (BST), a specialized engineering firm based in Boulder, Colorado, the contract to develop and deliver a purpose-built scientific platform to explore volcanoes in order to improve air traffic management systems and the accuracy of ashfall measurements.
BST will deliver to NASA a tightly integrated sUAS solution consisting of an airframe, avionics, and sensors specifically designed to measure selected gases and atmospheric parameters including, temperature, pressure, humidity, and 3D winds as well as more advanced measurements such as particle sizing and trace gases.
Based on BST’s commercially available SuperSwift airframe and SwiftCore Flight Management System—which have been proven in the field to provide a cost-effective, powerful, and easy-to-operate—the SuperSwift XT [figure 1] is specifically engineered to meet the demands of high altitude flights through strong winds and damaging airborne particulates typical of nomadic scientific field campaigns in harsh environments.
“NASA and similar scientific agencies require deliverables with a high degree of accuracy and reliability,” emphasizes Jack Elston, Ph.D., CEO of Black Swift Technologies. “The SuperSwift XT will be designed to collect data in harsh environments and will enhance the performance and utility of NASA’s Airborne Science fleet.”
Member organizations of NASA’s Airborne Science Program can all benefit from the measurements provided by this system in various atmospheric conditions using different sensor payloads which, by design, are easily interchangeable. The sUAS will provide targeted, in situ observations from previously inaccessible regions that can significantly advance NASA’s goal of safe, efficient growth in global aviation by aiding in the collection of scientific data from which predictive Volcanic Ash Transport and Dispersion models (VATD) can be used to inform air traffic management systems.
Leveraging BST’s proprietary Mission Planning Software, scientists can program the SuperSwift in minutes to calculate the area under review and then begin collecting data for immediate analysis and decision making. With its intuitive tab-driven interface, flight planning is simple and easy to accomplish.
Mission monitoring and mapping is all done from a handheld Android Tablet loaded with BST’s SwiftTab software. Gesture-based controls enable users to confidently deploy their SuperSwift with minimal training while being able to collect data over geography that is topically diverse with confidence.
The existence of a sUAS capable of carrying the necessary instruments routinely through harsh environments adds an invaluable contribution to the calibration and validation of data collected from ground- and satellite-based methods. The flight envelope, concept of operations (CONOPS), and rugged nature of the SuperSwift XT will permit researchers to collect data previously unobtainable through traditional data collection methods or existing sUAS.
This includes gathering difficult to obtain data sets such as from volcanic plumes shortly after eruption (i.e., particle size-frequency distribution, vertical ash concentration distribution, SO₂ flux, etc.).
The innovations of the SuperSwift XT, including the total sensor suite, can be utilized for scientific research by federal and state public agencies and other state-funded laboratories to collect data on coherent atmospheric structures such as smog, volcano plumes, wildfire smoke, chemical fires, forest humidity, etc.
Commercial applications for private industry exist as well, such as utilizing the SuperSwift XT to assess the composition, and relative danger, of chemical fires at refineries or the chemical composition of smokestack exhaust.
CAD model of the antenna system: The antennas will be arranged so that the center of mass is at the center of the tube. Each antenna will be counterbalanced. (NASA)
Researchers at NASA’s Armstrong Flight Research Center have designed an antenna-mounting platform to provide users satellite-based tracking functions for unmanned aerial vehicles. The platform integrates multiple capabilities onto one low-cost platform.
In August 2016, NASA signed a license agreement with Mobile Antenna Platform Systems Inc. to commercialize the portable antenna platform.
The platform is built to rotate 60 pounds of antennas, transmitters and receivers and eliminate the need for additional load-balancing hardware. A smaller version can be flown on a plane, greatly extending the telemetry link range without requiring more power from the aircraft.
Auto tracking software uses the target’s GPS location to coordinate and maintain a line-of-sight link as great as what the telemetry system can support.
NASA researchers originally developed the technology for use with research UAVs, which often involve multiple transmitters and receivers on the aircraft and on the ground, with multiple antennas that must be pointed at a single UAV.
The platform is a middle ground between the low-end tracking platforms that support only one antenna and expensive, high-end options designed for military use.
Besides research, the platform could be used in marine communications, satellite tracking in multiple frequencies and weather balloon tracking, NASA said.
Powered by 120 VAC, the platform moves all of the antennas simultaneously in continuous rotation in azimuth and vertical ±180°, effectively tracking a line-of-sight object up to 20 miles away or further, limited by transmit power and antenna configuration.
It is designed for use with any moving system needing to transmit large quantities of data over one or more RF links. RF signals can include video, command and control, and signals to and from the UAV as well as the research data of interest.
The platform design includes:
a horizontal bar with antenna mounts
a platform head containing the motors and gears
an antenna stand containing electrical slip rings and cables to connect to the radios, motors and external computer
a microcontroller interface to drive the motors and receive antenna commands from the software
Its user interface runs on Microsoft Windows and enables the tracking antenna to be interfaced to any ground station that can provide the GPS coordinates of the target being tracked in real time and the GPS coordinates of the tracking antenna.
Platform benefits
According to NASA, the antenna platform offers these benefits:
Portability. Lightweight components and a small profile allow the platform to be carried by a single person.
Simplicity. Its unique design eliminates the need for additional load-balancing hardware, simplifying setup.
Versatility. Up to 58 pounds (26 kg) of multiple antennas from various manufacturers in any combination (including Yagi-Uda, dish/parabolic, omnidirectional, patch/microstrip) under 10 W can be accommodated
Low Power Use: Using a smaller motor that is faster than those on other platforms requires less power to achieve continuous rotation.
Low Cost: The overall system is estimated to cost less than $5,000.
OCO-3 will collect spaced-based measurements of atmospheric carbon dioxide and solar-induced fluorescence.
Once launched, OCO-3 will be installed and operated on the International Space Station (ISS) Japanese Experiment Module-Exposed Facility (JEM-EF).
Surrey’s SGR-20 is a single-frequency, multiple antenna GPS receiver designed as a spacecraft orbit determination subsystem for small satellite low-Earth orbit applications. The OCO-3 mission will use the Surrey SGR-20 for positioning information (to an accuracy of better than 20 meters) and velocity data (to an accuracy of better than 0.25 meters per second). The SGR-20 features four front ends with antennas, allowing more flexibility and redundancy for the selected mission.
According to Eugene Hockenberry, project manager at Surrey Satellite, “The SGR-20 receiver is part of a highly proven range of GPS receivers that Surrey Satellite offers. Our receivers are currently active on twenty-four Surrey satellites and have accumulated over 700 years of on-orbit experience. With this mission we will see another first for Surrey: this receiver will be our first space hardware onboard the ISS.”
Surrey Satellite delivered the receiver to JPL three months ahead of schedule. OCO-3 is scheduled to launch in 2018.
The National Aeronautics and Space Administration (NASA) published a notice Jan. 26 in the Federal Register on a planned space navigation workshop.
The Workshop on Emerging Technologies for Autonomous Space Navigation is sponsored by NASA Space Communication and Navigations (SCaN) Program. The Feb. 17 workshop is intended to inform industry on evolving positioning, navigation and timing (PNT) technologies and techniques being developed to enhance the operational efficiency and flexibility of future missions.
The workshop will include optional one-on-one discussions with industry participants on a space-available basis on Friday, Feb. 17. NASA is soliciting information from all interested U.S. private sector enterprises only.
Navigation topics to be discussed during the workshop include:
Emerging GNSS applications, including the development and use of GNSS in high-altitude applications in the Space Service Volume (SSV), protecting and enhancing the GPS SSV, developing a multi-GNSS SSV, NASA’s current and future missions employing GNSS in the SSV, and GNSS receiver developments within NASA.
Emerging navigation technologies, including PNT capabilities envisioned for the Next Generation Broadcast Service (NGBS), innovative timing system developments and techniques such as the Deep Space Atomic Clock (DSAC), optical navigation capabilities and techniques that support rendezvous, landing on objects (near Earth or solar system objects) or docking to vehicles, and navigation and PNT capabilities supporting proximity operations, satellite servicing and formation flying.
Other advanced topics to be addressed include the use of optimetrics from laser communications systems to support precise PNT solutions, on-board navigation software and filters, such as the Goddard Enhanced Onboard Navigation System (GEONS), and x-ray navigation capabilities and techniques.
Registration
The workshop will be held at NASA Headquarters Auditorium (west lobby) 300 E Street SW., Washington, D.C. 20546.
U.S. participants will register for the navigation workshop at the door on Feb. 16. To RSVP for the follow-on one-on-one meetings scheduled for Feb. 17, RSVP to James J. Miller by Feb. 8 at [email protected] or 202-358-4417.
Reservations must be received no later than 5:00 p.m. EST on Wednesday, Feb. 8. A confirmation email will be sent to acknowledge your requested participation. Companies will be notified on or before Friday, Feb. 10 of their assigned one-on-one meeting time.
Agenda
The agenda for the workshop and industry meetings is as follows:
Workshop, Thursday, Feb. 16
8:30 a.m. to 9:30 a.m., Networking Opportunity
9:30 a.m. to 12:30 p.m., Introductions & Emerging GNSS Applications
12:30 p.m. to 1:30 p.m., Lunch Break
1:30 p.m. to 3:30 p.m., Next-Generation Developing Technologies
3:30 p.m. to 5:30 p.m., Game-Changing Initiatives
5:30 p.m. to 6:00 p.m., Wrap-Up
6:00 p.m. to 8:00 p.m., Networking Opportunity
One-on-One Industry Meetings with NASA, Feb. 17
9:00 a.m. to 5:00 p.m., 45-minute information-exchange/discussion
Attendance limitations: The Navigation Workshop and One-on-One Meeting attendees is strictly limited to four (4) persons per company.
One-on-One Meeting Description
To facilitate interactive communication with industry, NASA SCaN representatives will be available for one-on-on emeetings to exchange ideas on areas of synergy and potential collaboration. NASA will hold one-on-one meetings with industry on Friday, Feb. 17, 2016, from 9 a.m. to 5 p.m. EST, to discuss space navigation technologies and techniques as related to Nav Workshop presentations. The meetings will be held with interested parties at scheduled times provided in response to the RSVP on a space available basis. NASA will attempt to prioritize non-local companies with One-on-One meeting times.
The one-on-one meetings are intended to be private question-and-answer and information-gathering sessions based on industry developments that align with NASA investments for enhanced autonomous space navigation capabilities. Industry presentation packages are acceptable and will be held in accordance with any proprietary or business confidential markings as annotated on the chart package. Meetings will not exceed 45 minutes in length. One appointment per hour will be scheduled. Additional separate meetings can be scheduled later if demand exceeds capacity.
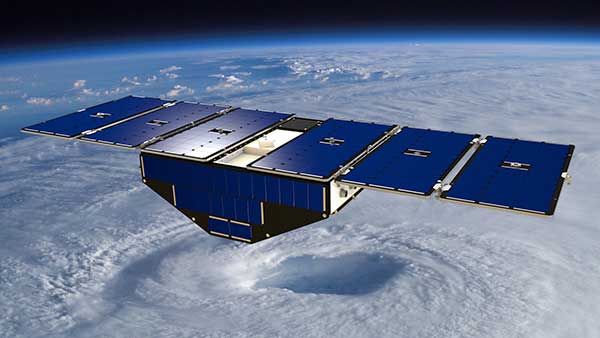
Surrey Satellite Technology’s Space GNSS Receiver Remote Sensing Instrument (SGR-ReSI) is the primary payload onboard NASA’s CYGNSS constellation, launched today, Dec. 15, from Cape Canaveral Air Force Station in Florida.
The Cyclone Global Navigation Satellite System (CYGNSS) mission is part of the NASA Earth System Science Pathfinder Program that aims to improve extreme weather prediction by studying how tropical cyclones form.
Artist’s concept of one of the eight CYGNSS satellites in orbit. (Image: NASA/University of Michigan)
The CYGNSS space segment consists of a constellation of eight micro satellites, each carrying the Surrey SGR-ReSI as the observatory payload in the form of a delay Doppler mapping instrument (DDMI). Making use of reflected global positioning signals, the DDMI collects ocean surface roughness data using a technique called GNSS reflectometry, providing CYGNSS with a new method for looking inside hurricanes. Wind speed will be estimated from this reflectometry data.
“At the end of last year, we delivered the SGR-ReSI flight models, low-noise amplifiers, and antennas to Southwest Research Institute for final integration into the CYGNSS observatories — marking a significant hardware shipment out of our Englewood, Colorado, manufacturing facility,” said Clare Martin, vice president of programs at Surrey Satellite Technology U.S.. “All of us at Surrey are proud that our instrument is playing an integral role in this mission, and we will watch with great interest as the satellites are put to work.”
The CYGNSS team is made up of the University of Michigan Department of Climate and Space Sciences and Engineering, Southwest Research Institute (SwRI), Surrey Satellite Technology and Sierra Nevada Corporation.
Surrey Satellite Technology demonstrated the concept of GNSS reflectometry for the first time on its UK-DMC mission launched in 2003, and subsequently developed the SGR-ReSI, which is currently flying on Surrey’s TechDemoSat-1 mission.
CYGNSS is NASA’s first Earth science small satellite constellation, designed to help improve forecasting hurricane intensity, hurricane tracks and storm surges.
CYGNSS will measure previously unknown details crucial to accurately understanding the formation and intensity of tropical cyclones and hurricanes.
“This is a first-of-its-kind mission,” said Thomas Zurbuchen, associate administrator for NASA’s Science Mission Directorate at the agency’s headquarters in Washington. “As a constellation of eight spacecraft, CYGNSS will do what a single craft can’t in terms of measuring surface wind speeds inside hurricanes and tropical cyclones at high time-resolution, to improve our ability to understand and predict how these deadly storms develop.”
The CYGNSS mission is expected to lead to more accurate weather forecasts of wind speeds and storm surges — the walls of water that do the most damage when hurricanes make landfall.
Using the same GPS technology that allows drivers to navigate streets, CYGNSS will use a constellation of eight micro satellite observatories to measure the surface roughness of the world’s oceans. Mission scientists will use the data collected to calculate surface wind speeds, providing a better picture of a storm’s strength and intensity.
Unlike existing operational weather satellites, CYGNSS can penetrate the heavy rain of a hurricane’s eyewall to gather data about a storm’s intense inner core. The eyewall is the thick ring of thunderstorm clouds and rain that surrounds the calm eye of a hurricane. The inner core region acts like the engine of the storm by extracting energy from the warm surface water via evaporation into the atmosphere.
The latent heat contained in the water vapor is then released into the atmosphere by condensation and precipitation. The intense rain in eyewalls blocks the view of the inner core by conventional satellites, however, preventing scientists from gathering much information about this key region of a developing hurricane.
“Today, we can’t see what’s happening under the rain,” said Chris Ruf, professor in the University of Michigan’s Department of Climate and Space Sciences and Engineering and principal investigator for the CYGNSS mission. “We can measure the wind outside of the storm cell with present systems. But there’s a gap in our knowledge of cyclone processes in the critical eyewall region of the storm — a gap that will be filled by the CYGNSS data. The models try to predict what is happening under the rain, but they are much less accurate without continuous experimental validation.”
The CYGNSS small satellite observatories will continuously monitor surface winds over the oceans across Earth’s tropical hurricane-belt latitudes. Each satellite is capable of capturing four wind measurements per second, adding as many as 32 wind measurements per second for the entire constellation.
CYGNSS is the first complete orbital mission competitively selected by NASA’s Earth Venture program. Earth Venture focuses on low-cost, rapidly developed, science-driven missions to enhance our understanding of the current state of Earth and its complex, dynamic system and enable continual improvement in the prediction of future changes.