NASA has awarded PlanetiQ an expanded contract through its Commercial Smallsat Data Acquisition (CSDA) program, broadening access to commercial satellite data for the scientific community.
The contract expands PlanetiQ’s CSDA portfolio to add high-SNR GNSS polarimetric radio-occultation data to PlanetiQ’s existing NASA CSDA offerings of ionospheric scintillation, ionospheric total electron content, and high-SNR GNSS radio-occultation data.
The expanded data offering will provide government researchers with access to advanced GNSS observations that can help improve the understanding of precipitation processes, atmospheric structure, and Earth system dynamics.
Polarized radio occultation (PRO) measurements have demonstrated the ability to characterize precipitation, detect rain and snowfall structure, identify melting layers, and observe variations in storm intensity. PlanetiQ uses a unique receiver to collect data with a high signal-to-noise ratio (SNR). High-SNR measurements are particularly important for precipitation applications because increased SNR improves sensitivity to lighter precipitation and certain cloud structures.
“By making polarized radio occultation data available through the CSDA program, NASA is enabling a broader research community to investigate new applications for these observations,” said E. Robert Kursinski, chief scientist, PlanetiQ. “As more researchers gain access to high-SNR PRO data, we expect both the scientific understanding and the potential operational uses of the technology for precipitation and severe weather monitoring to expand.”
PlanetiQ’s GNSS-PRO measurements are acquired using high-rate, high-SNR receivers that enhance the detection of precipitation signatures and cloud structures. In addition to supporting atmospheric science research, these measurements are critical for operational applications related to rainfall characterization, snowfall detection, storm monitoring, and weather forecasting.
Researchers interested in learning more about GNSS-PRO and precipitation sensing can watch PlanetiQ’s recent webinar.
The addition of 44 antennas to Intuitive Machines’ network is expected to enhance support for customers’ GEO missions and accelerate progress toward Moon base and deep-space operations.
Intuitive Machines Inc. has entered into a definitive agreement to acquire Goonhilly Earth Station Ltd., a deep-space communications provider with major ground station assets in the United Kingdom and Goonhilly USA Inc. (dba COMSAT).
Goonhilly is a provider of lunar and deep space communications services. Since becoming the first commercial provider of these services in 2021, Goonhilly has supported more than 20 missions for space agencies NASA and ESA and private exploration companies, including Intuitive Machines and ispace, representing a vital UK contribution to the international space sector.
In 2024 and 2025, the company played a critical role in Intuitive Machines’ IM-1 and IM-2 lunar missions.
The acquisition will include the Goonhilly Lunar and Deep Space Communications, Commercial Satcom and Defense and Security divisions. It significantly expands global ground-station resources and capacity on Intuitive Machines’ integrated space-to-ground network.
Upon completion of the proposed acquisition, the expanded network is expected to deliver communications, data transport and position, navigation and timing (PNT) capabilities for sustained lunar and cislunar operations.
Goonhilly’s and COMSAT’s civil, commercial and government customers are expected to complement Intuitive Machines’ existing customer base and broaden the Company’s reach into adjacent industries. Upon completion of the acquisition, its strategic UK location will expand visibility across major Earth‑viewing arcs, increasing contact opportunities for lunar and deep‑space missions. With deep expertise in antenna planning, scheduling and station maintenance, Goonhilly’s ground station assets and competencies strengthen Intuitive Machines’ ability to deliver end‑to‑end mission support.
“Customers have been clear that they want a single, integrated, and resilient solution for their communications and PNT needs as they accelerate missions at an unprecedented pace,” said Steve Altemus, co‑founder and CEO of Intuitive Machines. “Our partners of integrated space‑to‑ground network are configured to support missions across LEO, lunar and cislunar environments through a single source for communications, PNT and data transport. Goonhilly will provide the backbone for this network, scales our global ground presence and will bring a strategic core competency to the Intuitive Machines team.”
The Intuitive Machines space-to-ground network combines a lunar data-relay constellation with a global ground segment to maintain persistent line-of-sight communications with the Moon. Goonhilly is expected to enhance this architecture with deep space assets, including the GHY6 32-meter antenna, the cryogenically cooled GHY3 30-meter antenna, and multiband support across X-band, S-band, and Ka-/Ku-band. This will give customers greater flexibility in mission design and more options for communicating with spacecraft throughout lunar and deep space operations.
“Goonhilly has spent years building a world class deep space communications capability,” said Kenn Herskind. Executive Chairman of Goonhilly. “Joining Intuitive Machines will allow us to scale that capability globally and directly support the next era of lunar exploration. Together, we will be creating a commercial lunar communications network that is interoperable, resilient, and ready to support Artemis and international missions.”
The transaction is expected to close in the third quarter of 2026, subject to customary closing conditions, including the receipt of applicable regulatory approvals, including under the UK National Security and Investment Act 2021 and from the U.S. Federal Communications Commission.
On a January morning in 2026, a GPS jammer powered up near Shiraz, Iran. It was not the first, and it would not be the last. The Strait of Hormuz corridor has become one of the most persistently jammed airspaces on Earth. But this time, two satellites were watching from very different vantage points, and together they would demonstrate something new: that spaceborne sensors can localize a terrestrial GPS jammer to within a few kilometers, using physics alone.
This article presents the first direct comparison of Cyclone Global Navigation Satellite System (CYGNSS) — a NASA GNSS reflectometry constellation — and NASA-ISRO Synthetic Aperture Radar (NISAR) — an L-band synthetic aperture radar for GPS jammer localization. The results challenge assumptions about which modality performs better and reveal that the answer depends on a question most analysts forget to ask.
The setup: Known jammer, known position
Validation requires ground truth. With help from the PNT community, we identified a GPS jammer operating near 27.32°N, 52.87°E (approximately 50 km southwest of Shiraz) that was active on Jan. 8 and Jan. 20, 2026, with confirmed quiet periods on Dec. 15 and Dec. 27, 2025. The jammer’s position was established through independent signals intelligence.
This gave us a controlled experiment: two “jammer ON” dates and two “jammer OFF” baseline dates, with satellite coverage from both CYGNSS and NISAR spanning the full period.
Two satellites, two physics
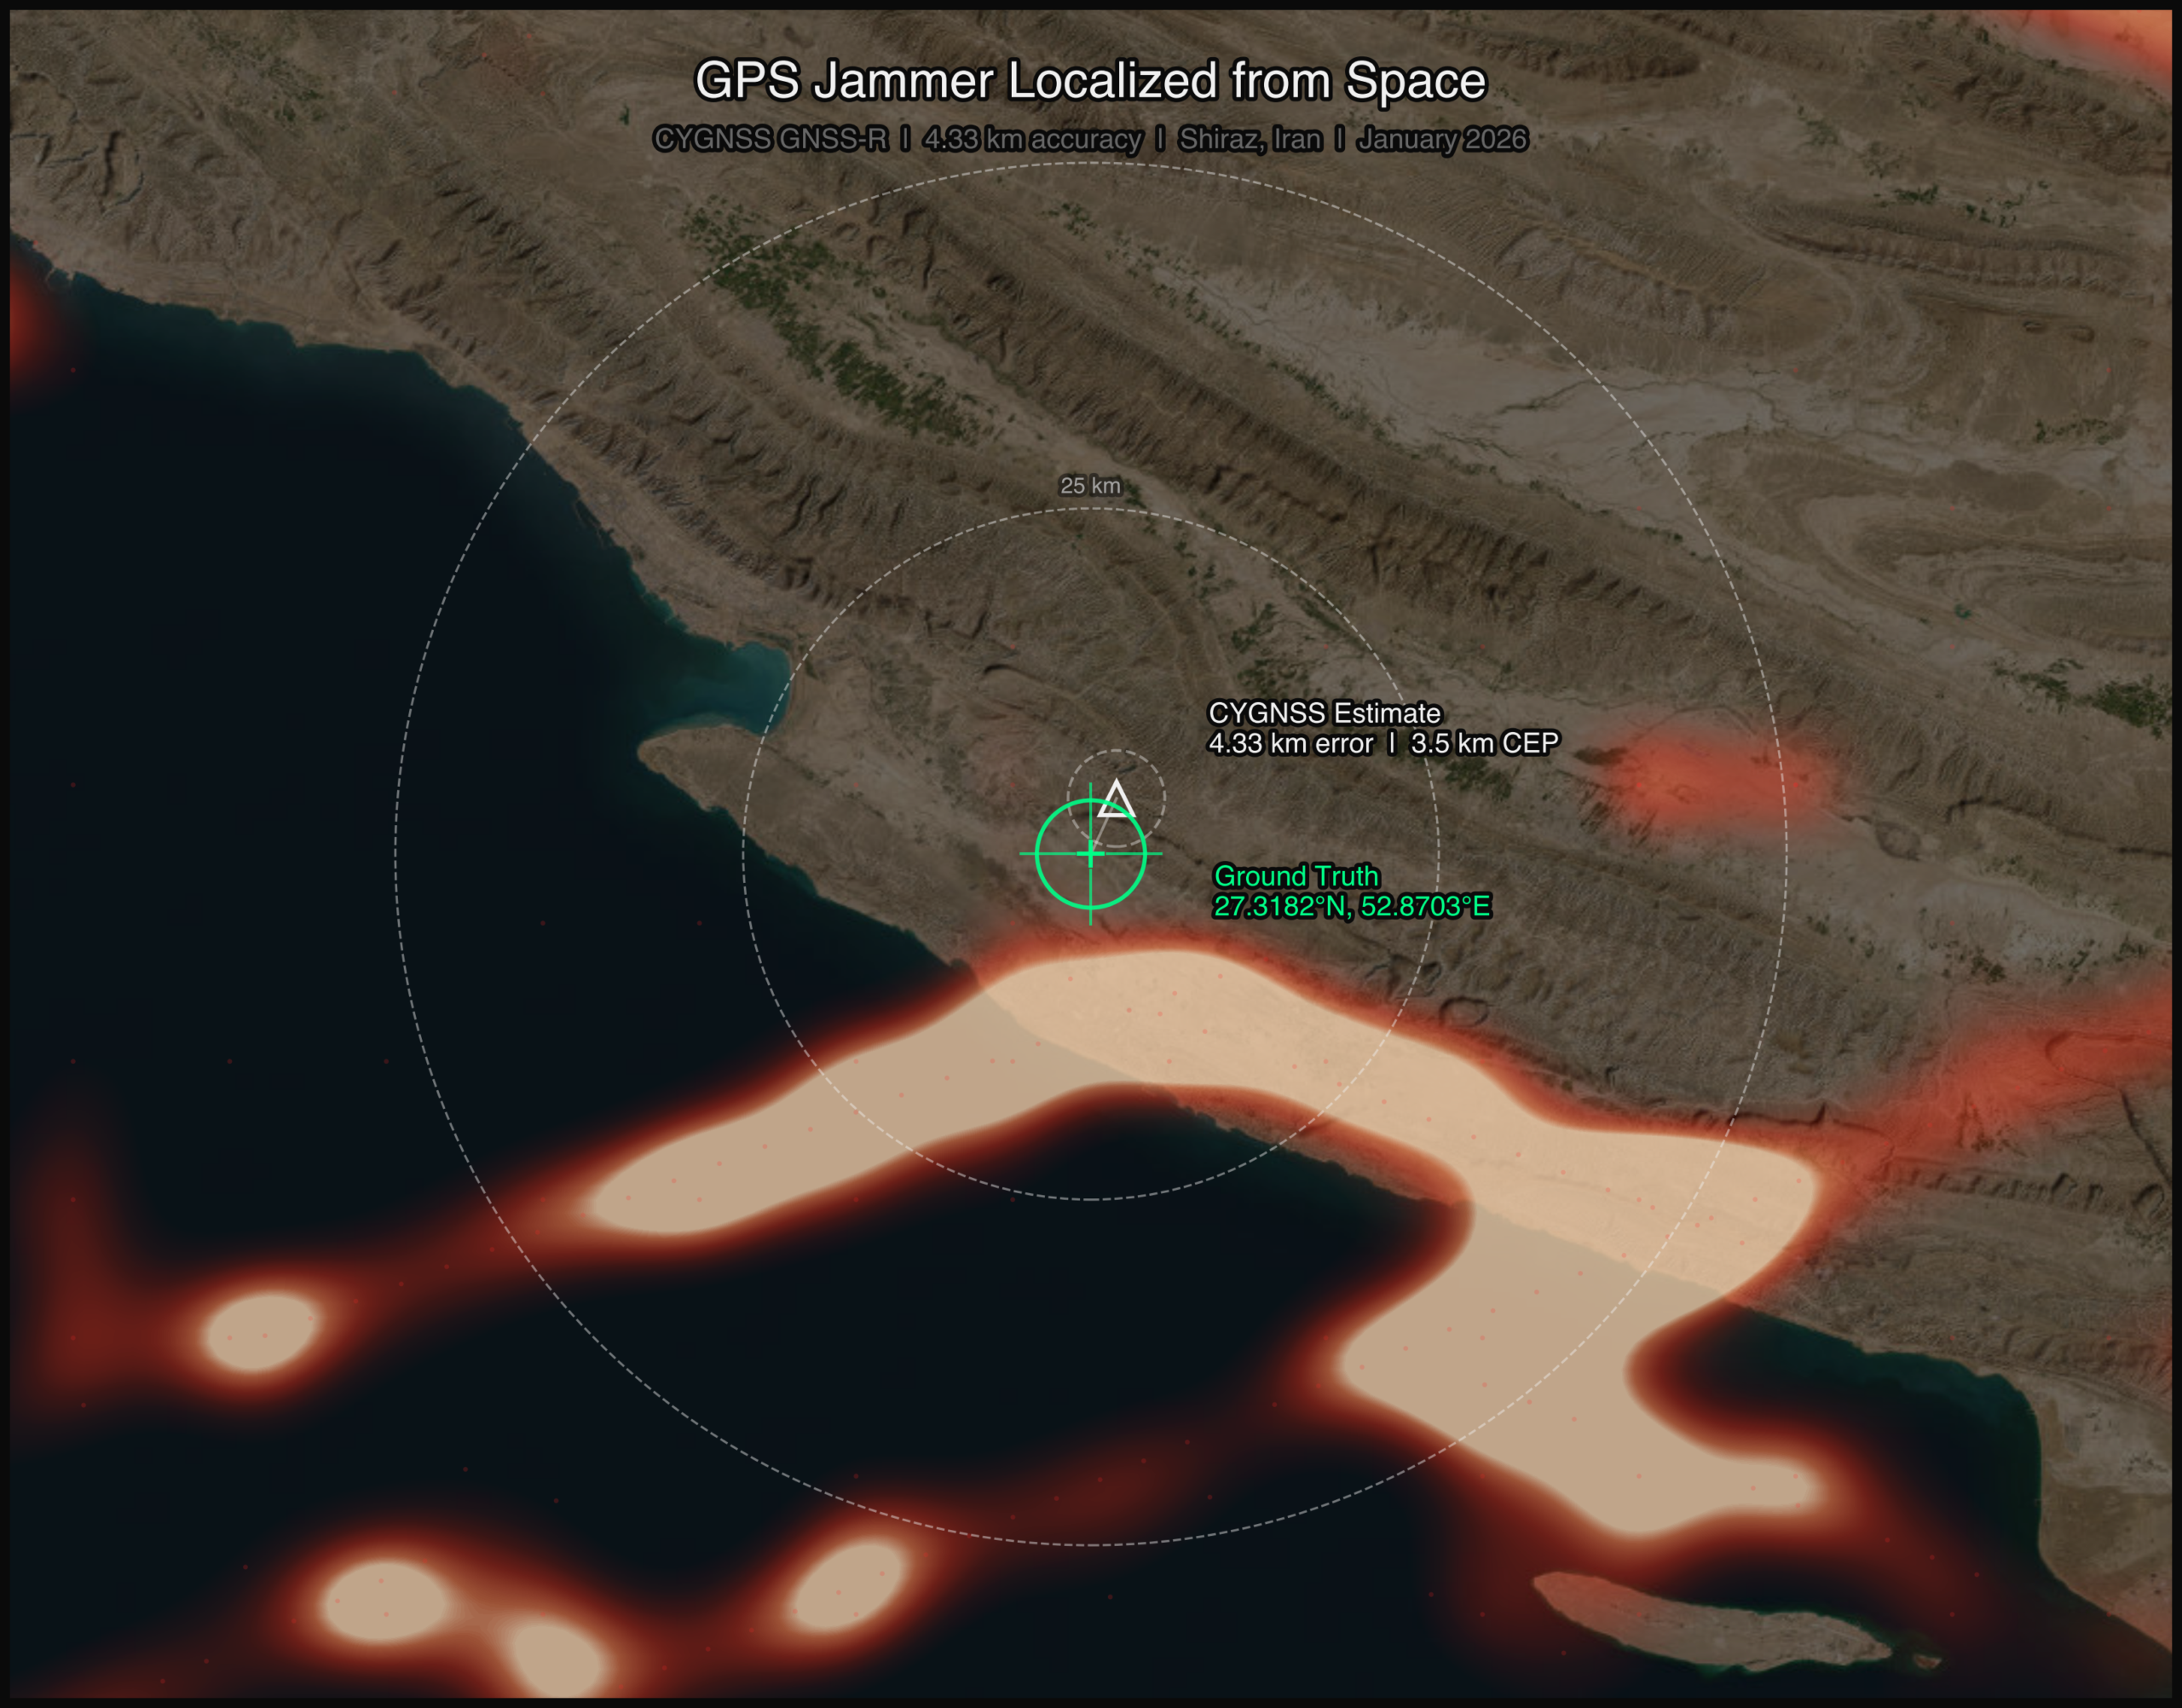
CYGNSS is a constellation of eight microsatellites that measure GPS signals reflected off Earth’s surface. Each spacecraft carries a delay-Doppler receiver that maps reflected signal power across a grid of delay and Doppler bins, known as the delay-Doppler map, or DDM. When a terrestrial jammer is active, it floods the GPS band with noise, elevating the DDM noise floor and suppressing the coherent surface reflection. The effect is detectable hundreds of kilometers from the jammer, creating a wide-area footprint in the reflected signal data.
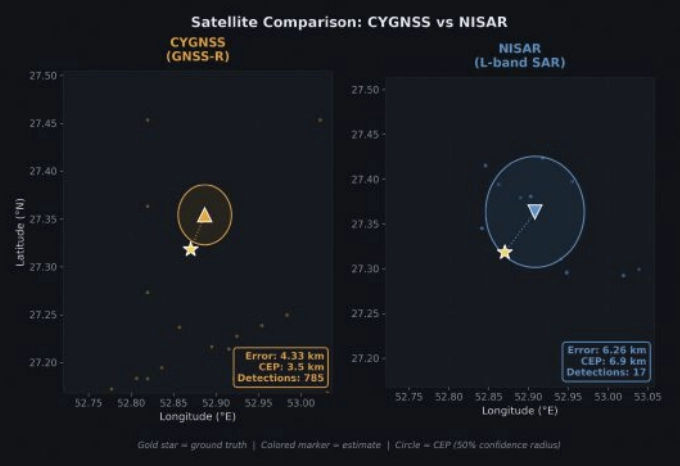
FIGURE 1 Jammer localization tracks from both CYGNSS and NISAR satellite constellations. (All figures by Sean Gorman)
NISAR operates an L-band SAR at 1.257 GHz, just 30 MHz from the GPS L2 frequency at 1.2276 GHz. When a GPS jammer’s broadband emissions leak into NISAR’s receive band, they create characteristic streaks in the SAR imagery. The streaks are elongated in the cross-track (range) direction, not along-track, a counterintuitive result that follows directly from SAR signal processing. In azimuth (along-track), the jammer is a fixed-point source with a valid Doppler history, so the SAR azimuth processor focuses it correctly, similar to any ground target. But in range (cross-track), the jammer’s broadband noise does not match the SAR’s chirp waveform, so range compression smears the energy across many range bins rather than compressing to a point. The result is a streak perpendicular to the flight direction, whose along-track centroid encodes the jammer’s latitude and whose cross-track extent encodes a range arc, which is the distance from the orbit ground track (FIGURE 1). The bearing of each streak encodes the jammer’s direction relative to the satellite’s ground track.
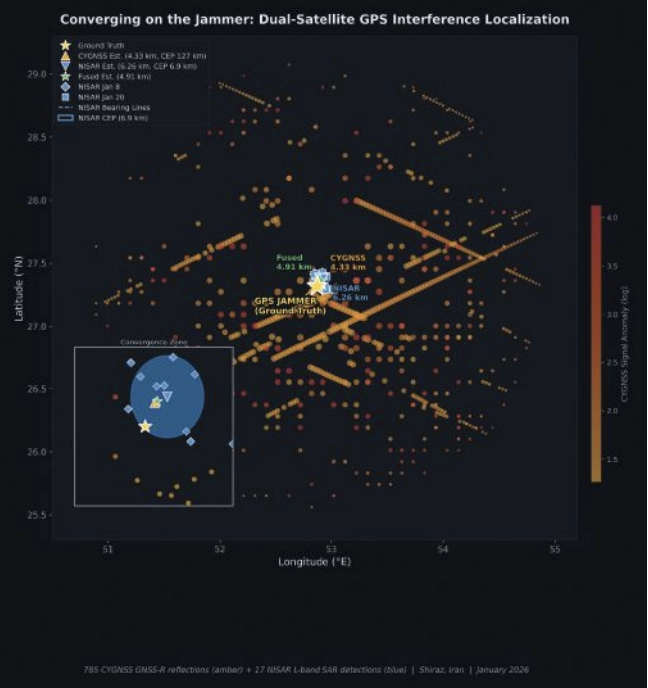
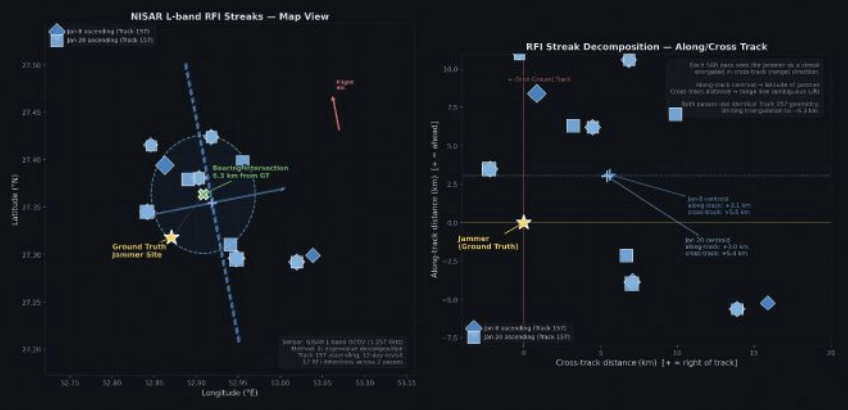
FIGURE 2 Crosstrack visualization for NISAR RFI streaks.
The two sensors could hardly be more different. CYGNSS sees the jammer’s effect on reflected GPS signals, offering an indirect measurement spread across hundreds of specular reflection points. NISAR sees the jammer’s emissions directly in its own receiver, which is a more precise measurement, but only along the satellite’s narrow ground track. FIGURE 2 shows both detection sets converging on the jammer location.
CYGNSS: 785 Detections, 4.33 km Error
We processed all CYGNSS Level 1 data within 200 km of the jammer location on both ON and OFF dates. Four detection methods contributed observations:
■ DDM noise floor (419 detections): The pre-computed ddm_noise_floor variable, calibrated against the thermal noise reference, proved the strongest discriminator. Near-jammer values exceeded 15,000 counts against a ~10,000 mean background.
■ Spatial noise grid (299):A 10 km gridded analysis identified cells with anomalously elevated noise relative to adjacent cells.
■ SNR hole detection (66): Coherent surface reflections were suppressed near the jammer, creating spatial “holes” in the SNR field.
■ NBRCS drop (1): Surface reflectivity dropped approximately 16% near the jammer, though this method produced few threshold exceedances.
Across four DDM channels per spacecraft and multiple passes, this yielded 785 total anomalous observations on the jammer-ON dates.
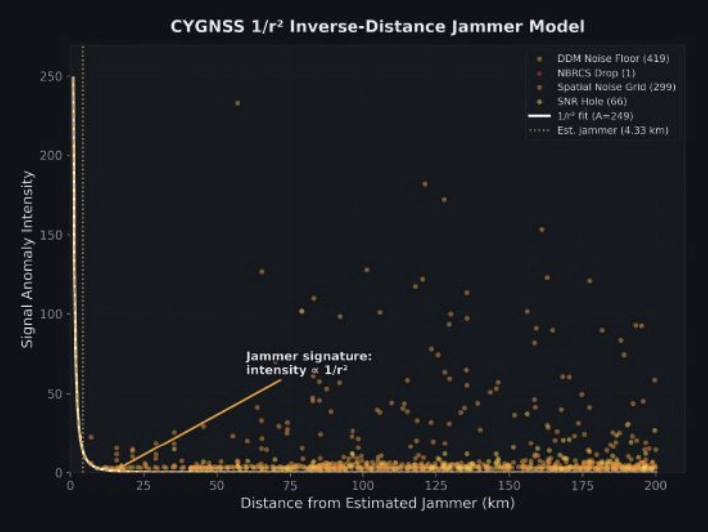
FIGURE 3 Scatterplot of interference insensity versus distance for CYGNSS.
Localizing using a simple centroid of all 785 detection positions placed the jammer 32.1 km from truth, with too many distant, low-SNR detections diluting the estimate.
Instead, we fit a parametric 1/r² inverse-distance model:
I(r)=Ar2
where A is a free amplitude parameter and r is the distance from a candidate jammer position. We jointly optimized the jammer position and amplitude using SciPy’s Nelder-Mead optimizer across all 785 observations, weighted by intensity. The optimizer converged on a position 4.33 km from ground truth, providing a 27.7 km improvement over the centroid (FIGURE 3).
The baseline: Zero false positives
On the jammer-OFF dates (Dec. 15 and Dec. 27, 2025), the pipeline produced exactly zero detections using the same thresholds, geographic area and satellites: a completely clean result. This suggests that the 785 detections are unlikely to be sensor artifacts or geographic anomalies. They disappear when the jammer turns off.
NISAR: 17 Detections, 6.26 km Error
NISAR’s approach is fundamentally different. Rather than measuring hundreds of reflected signals across a wide area, it captures direct emissions in a narrow swath, but with far greater geometric precision.
We processed NISAR L2 GCOV (geocoded covariance) products from Track 157, Frame 15 (ascending) for three dates: the Dec. 27 baseline and the Jan. 8 and Jan. 20 jammer-ON passes. The detection pipeline used eigenvalue decomposition of the polarimetric covariance matrix:
λ₁ ratio thresholding: In jammer-contaminated pixels, the dominant eigenvalue λ₁ of the 2×2 [HH, HV] covariance matrix rises sharply relative to the scene mean, indicating an unpolarized additive source.
Cross-polarization ratio (HV/HH): GPS jammer emissions are unpolarized, disproportionately elevating the HV channel. Anomalous HV/HH ratios flag contaminated azimuth lines.
Iterative outlier trimming: Three rounds of 1.5σ clipping removed scattered false detections, leaving 17 high-confidence streak centroids.
FIGURE 4 Error and CEP Metrics Comparison for CYGNSS and NISAR.
With detections from two passes on different dates, we had two independent bearing lines. Each pass’s streak centroids defined an azimuth aligned cluster whose major axis pointed toward the jammer. A PCA fit to the two clusters extracted the bearing: 308.1° from the Jan. 8 pass and 316.2° from Jan. 20. Their intersection — computed via scipy optimization of the angular residual — landed 6.26 km from ground truth (FIGURE 4).
The along-track/cross-track decomposition reveals why the 6.26 km error is a geometric ceiling for this dataset, not a processing limitation. Both passes come from the same Track 157 ascending orbit on a 12-day repeat cycle. The intensity-weighted along-track centroids land at +3.0 km and +3.1 km north of the jammer, a direct stable latitude measurement. The cross-track centroids land at +5.4 km and +5.6 km east of the orbit ground track, a range measurement. But because both passes share identical orbit geometry, the two range arcs are nearly parallel. The bearing difference between passes (308.1° vs 316.2°) is only 8.1°, producing a shallow intersection angle and poor cross-range resolution. A single descending pass, which would cross the ascending track at approximately 60-70°, would transform the geometry from two near-parallel lines to a genuine triangulation, potentially reducing the localization error to sub-2 km. Unfortunately, no descending NISAR pass covering this jammer site was available in the beta archive, which ends on Jan. 20, 2026.
The CEP (circular error probable, the radius containing 50% of repeated estimates) was 6.88 km, meaning if we ran this analysis on many similar jammers, half our estimates would fall within ~7 km.
Who wins?
CYGNSS wins, and not just on accuracy.
A naive confidence metric for the 1/r² fit would be the scatter of the 785 input detections (CEP = 127 km). But the detections are not the estimate; they are the inputs to a model fit. The relevant confidence question is: How stable is the fitted position?
We answered this with a 500-iteration bootstrap: resample the 785 detections with replacement, re-run the 1/r² optimizer each time and measure the spread of the resulting position estimates. The bootstrap CEP, the median radial distance across 500 fitted positions, was 3.48 km. The optimizer converges stably to within a few kilometers of the same location regardless of which detections are included.
This means CYGNSS achieves 4.33 km error with 3.48 km confidence, both better than NISAR’s 6.26 km error and 6.88 km confidence.
The bootstrap CEP also reveals what the raw scatter obscures: the 1/r² fit is constrained primarily by the ~80 high-intensity detections within 30 km of the jammer. The remaining 700 distant, low-intensity detections contribute little to the position estimate — they are correctly downweighted by the intensity-weighted least squares. The fit’s stability comes from the physics: a 1/r² signal has steep gradients near the source, providing strong positional constraints where it matters most.
Bayesian fusion: Can we get both?
The obvious next question: Can we combine CYGNSS’s wide-area sensitivity with NISAR’s geometric precision? We implemented four fusion strategies, all designed to work without ground truth:
■ Bayesian Gaussian posterior: Model each sensor’s estimate as a 2D isotropic Gaussian with σ = CEP/1.1774. The posterior is the product of the two Gaussians: an analytical precision-weighted mean.
■ NISAR-prior constrained 1/r²: Re-run the CYGNSS optimizer with a Gaussian regularization term pulling toward the NISAR estimate, sweeping the regularization weight λ from 0.01 to 10.
■ NISAR-proximity re-weighted 1/r²: Apply a Gaussian kernel centered on the NISAR estimate to the CYGNSS detections before fitting, effectively upweighting observations consistent with the SAR result.
■ Joint CEP-balanced: Combine the CYGNSS gradient signal with NISAR cluster proximity, weighted by (σ_CYGNSS/σ_NISAR)².
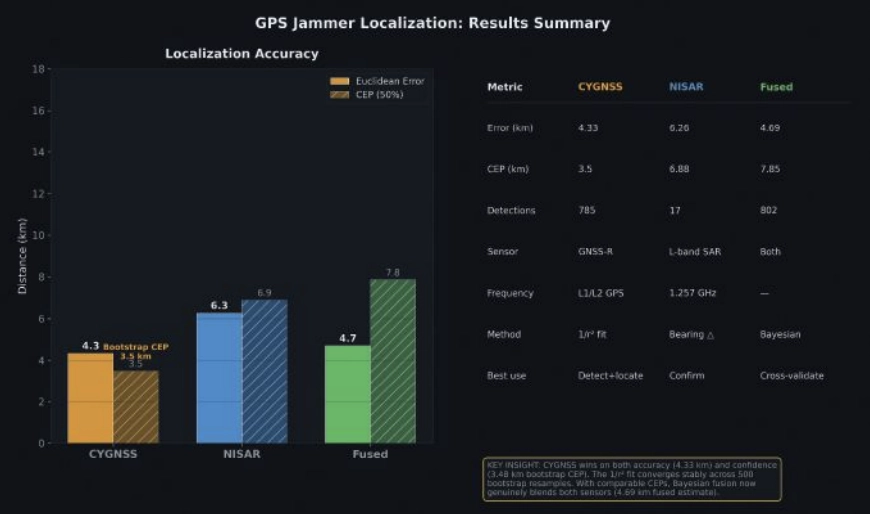
FIGURE 5 Summary statistics for jammer localization with CYGNSS, NISAR and fused approach.
With the bootstrap CEP, the precision ratio flips. The CYGNSS Gaussian (σ = 2.95 km) is now 2× tighter than NISAR (σ = 5.84 km). The Bayesian posterior, the precision-weighted mean, lands at 4.69 km, pulling toward CYGNSS’s better estimate while incorporating NISAR’s independent geometric constraint. FIGURE 5 shows the fusion: two comparable Gaussians whose product is tighter than either alone.
The fused result (4.69 km error, 7.85 km CEP) is not quite as accurate as CYGNSS alone (4.33 km), because NISAR’s 6.26 km estimate pulls it slightly away from truth. But operationally, the fusion provides a cross-validated answer: two independent physics arriving at similar locations builds confidence that neither sensor is producing an artifact.
The key insight is that the bootstrap CEP unlocked meaningful fusion. When the raw scatter CEP (127 km) was used, NISAR dominated the posterior 343:1 and fusion added nothing. With the fit-based CEP (3.48 km), both sensors contribute, and the posterior reflects genuine multi-modal evidence.
Operational implications
For CYGNSS: CYGNSS excels at both detection and localization. Its 785 detections across a 200 km radius, with zero false positives on baseline dates, provide unambiguous jammer detection. The 1/r² fit achieves 4.33 km accuracy with a bootstrap-verified 3.48 km CEP, meaning an analyst can trust the result to single-digit kilometer precision without ground truth. CYGNSS’s eight-satellite constellation also provides sub-daily revisit, enabling near-real-time monitoring.
For NISAR: NISAR provides independent geometric confirmation. With just two passes over an active jammer, the bearing intersection achieved 6.26 km accuracy with a 6.88 km CEP. The 6.26 km result is constrained by orbit geometry, not by detection sensitivity. Our two ascending passes from Track 157 produced nearly parallel range arcs with only 8.1° of bearing separation. Adding a single descending pass would provide a crossing angle of 60° to 70° and could reduce localization error to sub-2 km — transforming NISAR from a confirming sensor into a precision localization tool in its own right. The limitation in this study was data availability: The NISAR beta archive contained only ascending Track 157 passes over the jammer site. NISAR’s 12-day repeat cycle and fixed ground track also mean the jammer must be active when the satellite passes overhead. NISAR’s current value is as a confirming sensor — when both modalities converge on the same location, confidence increases beyond what either achieves alone.
For Fusion: With comparable CEPs (3.48 km vs 6.88 km), fusion now produces genuinely blended estimates. The Bayesian posterior at 4.69 km reflects real multi-sensor information. Future improvements, such as more NISAR passes with diverse bearings or CYGNSS multi-week accumulation, would tighten both estimates further.
For the Adversary: These results demonstrate that GPS jammers operating in contested airspace are observable and localizable from orbit using openly available civilian satellite data. The 4.33 km CYGNSS result is approximately 2× better than the published state of the art for GNSS-R jammer localization (~9 km grid resolution, Chew et al., 2023) and the NISAR bearing intersection approach has not been previously demonstrated for jammer geolocation.
Still broadcasting: Jammer persistence through conflict
The validation analysis used January 2026 data. But on Feb. 28, armed conflict erupted in the region. Did the jammer survive?
We ran the CYGNSS noise floor detection pipeline for each day from Feb. 28 through April 6, comparing against the December 2025 baseline. The answer is unambiguous: The jammer is not only still active — it is operating at dramatically higher power.
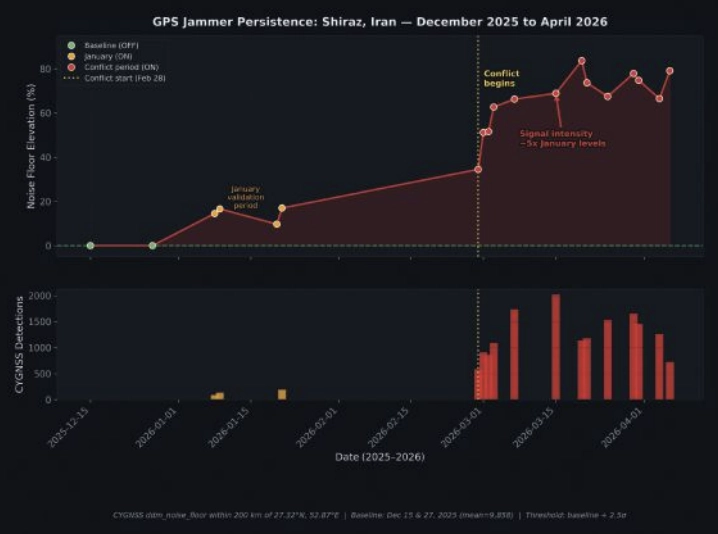
FIGURE 6 A timeline of jammer activity for Shiraz, Iran, from December 2025 to April 2026.
In January, the jammer elevated the CYGNSS noise floor by approximately 15% above baseline. By early March, days after the conflict began, noise elevation had jumped to 50% to 60%. By mid-March, it reached 70% to 84%, where it remained through early April. Detection counts tell the same story: 89 to 192 per day in January, rising to 1,000 to 2,000 per day during the conflict (FIGURE 6).
The escalation was immediate. On Feb. 28, noise elevation was +34.5%, already double the January level. By March 3, it had reached +62.7%, and by April 6, it peaked at +79.1%. The signal has remained at 5× the January intensity through the most recent available data (April 6, 2026).
Several interpretations are consistent with this pattern:
■ Power increase: The operator increased jammer output power, perhaps in response to the conflict or as a defensive posture against GPS-guided munitions.
■ Additional jammers: Multiple units may have been co-located or deployed nearby, creating an aggregate signature larger than any single device.
■ Duty cycle change: The jammer may have shifted from intermittent to continuous operation.
What is clear is that the jammer we localized in January was not incapacitated by the conflict. It was amplified. CYGNSS’s sub-daily revisit capability makes this kind of persistent monitoring possible using entirely passive, civilian satellite data — no tasking, no cooperation with the target state and no risk to reconnaissance assets.
Context and prior work
CYGNSS-based RFI detection builds on work by Chew et al., 2023, who demonstrated grid-level jammer detection at approximately 9 km resolution using DDM noise floor anomalies. Our 1/r² parametric fit extends this from detection to localization, achieving sub-5 km accuracy by exploiting the physics of signal power decay.
At the other end of the precision spectrum, Murrian et al., 2021, demonstrated ~220 m jammer localization using ISS-mounted Doppler measurements of raw intermediate-frequency (IF) data. This approach achieves an order of magnitude better precision than our methods but requires specialized hardware and raw signal access not available on current operational satellites.
The NISAR bearing intersection approach demonstrated here is, to our knowledge, the first published use of L-band SAR RFI streaks for jammer triangulation. The key insight is that NISAR’s proximity to GPS L2 (just 30 MHz separation) makes it an unintentional but effective GPS interference sensor.
Summary
Two satellites, two physics, one jammer. CYGNSS sees the interference footprint across hundreds of kilometers and localizes the source through inverse-distance physics. NISAR sees the emissions directly in its SAR receiver and triangulates through bearing intersection. Both achieve sub-7 km accuracy independently; together, they cross-validate and build the confidence that operational use demands.
The jammer near Shiraz is still there — louder than ever. The satellites are still watching.
Chew, C., Shah, R., Zuffada, C., et al. (2023). “Demonstrating CYGNSS as a Tool for Detecting GNSS Interference on a Global Scale.” IEEE Journal of Selected Topics in Applied Earth Observations and Remote Sensing.
Murrian, M.J., Narula, L., Iannucci, P.A., et al. (2021). “GNSS Interference Monitoring from Low Earth Orbit.” Navigation: Journal of the Institute of Navigation, 68(1).
NASA JPL. (2024). “NISAR L-band SAR Technical Specifications.” NASA/ ISRO SAR Mission Documentation. Closas, P., Fernández-Prades, C. (2023). “GNSS Interference Detection and Mitigation: A Survey.” Signal Processing, 206.
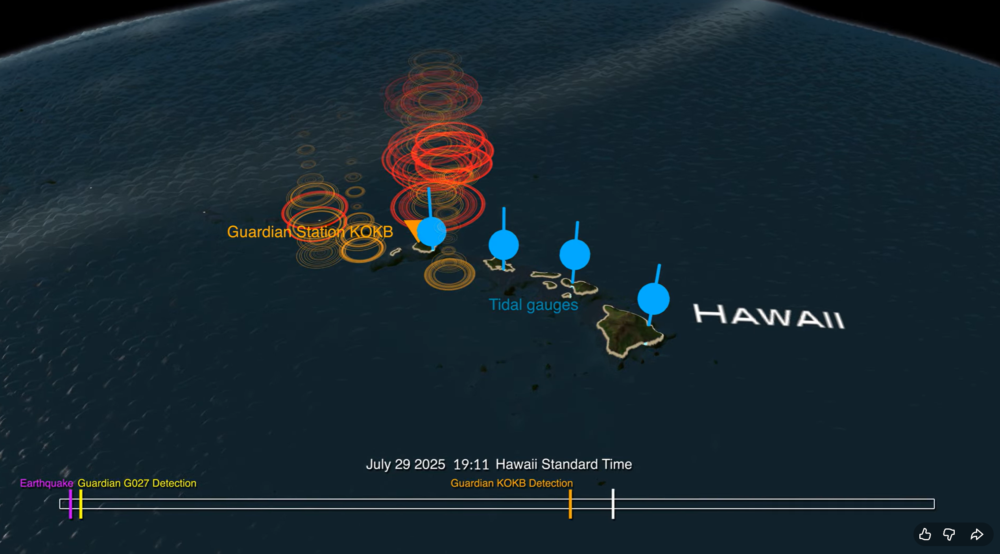
A new data visualization illustrates how an experimental NASA technology can provide extra lead time to communities in the path of a tsunami. Called GUARDIAN (GNSS Upper Atmospheric Real-time Disaster Information and Alert Network), the software detects slight distortions in satellite navigation signals to spot hazards on the move.
The animation breaks down a real-life case study: 2025’s massive Kamchatka earthquake and the tsunami that it sent racing across the Pacific and towards Hawaii at more than 500 mph (805 kph).
The visualization shows the magnitude 8.8 earthquake (seen in purple) strike off the Russian coast on July 29, 2025, triggering the tsunami. The red, orange, yellow, and green ringlets represent real-time readings from ground stations tracking GPS and other navigational satellite signals. The disturbances were spotted by GUARDIAN’s artificial intelligence-powered detection algorithms as soon as eight minutes after the earthquake.
For the next several hours, signs of the tsunami were picked up by GUARDIAN across the Pacific Ocean in near real time. The system flagged an incoming wave off the coast of Kauai some 32 minutes before it made landfall and was detected by tide gauges (shown in blue).
The results highlight GUARDIAN’s potential to augment existing early warning systems, said Camille Martire, one of its developers at NASA’s Jet Propulsion Laboratory in Southern California.
Currently, determining whether an earthquake generated a tsunami remains a challenge. Forecasters rely on seismic data and computer simulations to make their best prediction, then wait for pressure sensors attached to the ocean floor to confirm a passing wave. Those sensors work well but are expensive and thinly dispersed. Gaps in coverage remain. And in those gaps, warning time disappears.
The GUARDIAN approach is complementary and cost effective because it monitors existing data from GPS and other constellations that make up the Global Navigation Satellite System. It’s also free to access, though for now best suited to analysts trained to interpret its findings.
How GUARDIAN works
All day, every day, geopositioning constellations transmit radio signals to ground stations around the globe. On the ground, the data is refined to sub-decimeter (less than 10 centimeters) positioning accuracy by JPL’s Global Differential GPS System. Before the signals get there, however, they must travel through an electrically charged skin of plasma called the ionosphere.
Solar storms and other space weather can wreak electrical mayhem in the ionosphere, and so can events on Earth. Tsunamis and earthquakes, by displacing large amount of air at Earth’s surface, unleash pressure waves that can slightly perturb the radio signals coming down from satellites. While systems are in place to correct for this “noise,” GUARDIAN considers it a useful signal.
Currently, GUARDIAN scours data from more than 350 GNSS ground stations around the Pacific Ring of Fire, a hotbed for the ocean’s deadliest waves. And the system is not confined to tsunamis. Earthquakes, volcanic eruptions, missile tests, spacecraft reentries, meteoroid splashdowns — anything that produces a large rumble on Earth is potentially fair game. While the Kamchatka event didn’t cause widespread damage to people or property, it showed how the next time disaster strikes, NASA science could give communities a few more minutes to act.
GUARDIAN is being developed at JPL by the GDGPS project, which is partially supported by NASA’s Space Geodesy Project.
The NASA Goddard Earth Sciences Data and Information Services Center (GES DISC) and principal investigator Stephen Leroy of JANUS Research Group have released GNSS Radio Occultation (GNSS-RO) datasets.
The data release includes 72 different products from 15 different GNSS-RO receivers (or constellations of receivers) processed at four different GNSS-RO retrieval/processing centers. The data from different processing centers have been reformatted to have a common Climate and Forecast Metadata Conventions (CF) compliant format.
The algorithm was developed with funding from the NASA ACCESS 2019 program and the NASA Supplements for Open Science Support. These are the version 2.0 GNSS-RO products; version 1.1 is available through the AWS Registry of Open Data.
GNSS-RO data undergoes processing that is radically different from that of most atmospheric sounders, but it can still be categorized by its processing step:
uncalibrated data, as provided by the satellite instrument with communication information stripped, are Level 1a (not part of this release);
calibrated data, wherein the clock biases of the transmitters and receivers are removed and precise orbits determined are Level 1b;
extremely high vertical-resolution profiles of RO bending angle and microwave refractivity are Level 2a; and
profiles of temperature, pressure, and specific humidity on a coarser vertical grid are Level 2b.
Products are still being added to the archive. This initial release is complete for all processing levels of the COSMIC-1 data sets from four different processing centers. After all of the products in the initial release are complete for available data through July 2025, the project will bebegin forward processing for missions still actively producing data.
For more information about these products please see the README document and the Algorithm Theoretical Basis Document (ATBD).
It’s always good news when we hear about NASA’s “out-of-this-world” next steps toward building a replacement for Ingenuity, the small Mars helicopter-drone. With 72 flights over 1,004 days, Ingenuity outlived NASA’s expectation of just 30 operational days on Mars. It ended up serving as a trailblazer for the SUV-sized Perseverance rover as it worked its way around Jezero Crater. Built with a large number of smartphone components, it’s actually amazing that this thing survived for so long, given the radiation environment on the surface of Mars, along with the harsh temperature extremes of daytime 32°F to nighttime minus 130°F. How a Samsung S5 phone battery survived, operating so far outside its design temperature range, is hard to fathom.
NASA’s 20-year plan for future Mars exploration now looks to take advantage of the huge expansion of the envelope for exploration that the small 30-day Mars helicopter brought to the Perseverance mission: “Enhanced mobility systems will enable exploration of challenging terrains and increased operational range. Aerial mobility technologies will facilitate access to previously unreachable areas on Mars.”
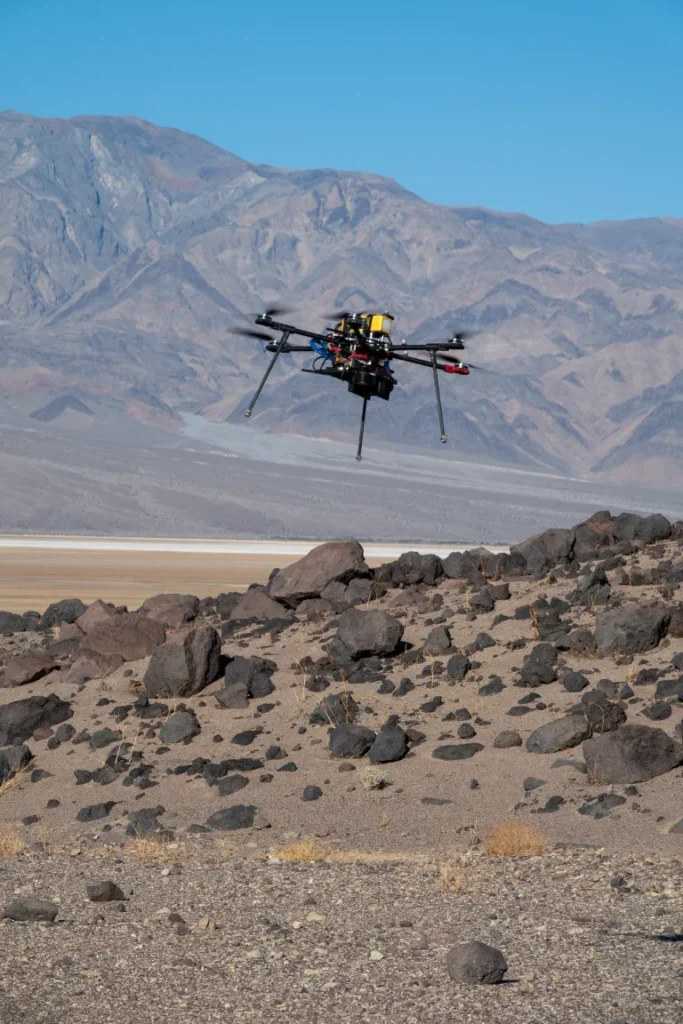
NASA drone flies over Mars Hill in Death Valley during recent navigation tests. (Photo: NASA/JPL)
So now NASA is working on the next Mars rover mission and on improvements for its accompanying airborne support. A team recently took three commercial drones into Death Valley to work on overcoming navigation problems that Ingenuity encountered on Mars flying over “bland” terrain with few visual features for its optical navigation system. Sand dunes without features on Mars messed with Ingenuity’s navigation solution, including on its 72nd flight.
Death Valley and Mesquite Flats Sand Dunes were two places the NASA team visited to test improved navigation algorithms installed on existing commercial drones, and they found some improvements by adding camera filters. The new software helped find landing spots in cluttered terrain.
But now new initiatives are seeking ways to get crewed flights to Mars in the next couple of years, well ahead of NASA’s timetable, which doesn’t move to anything crewed until around 2030. NASA still seems to prefer to pursue landers to gather much more data on Mars before risking crewed flights. Robotic dogs are also being investigated that can traverse rugged uphill areas that landers cannot access, as well as a winged glider the size of a small school bus.
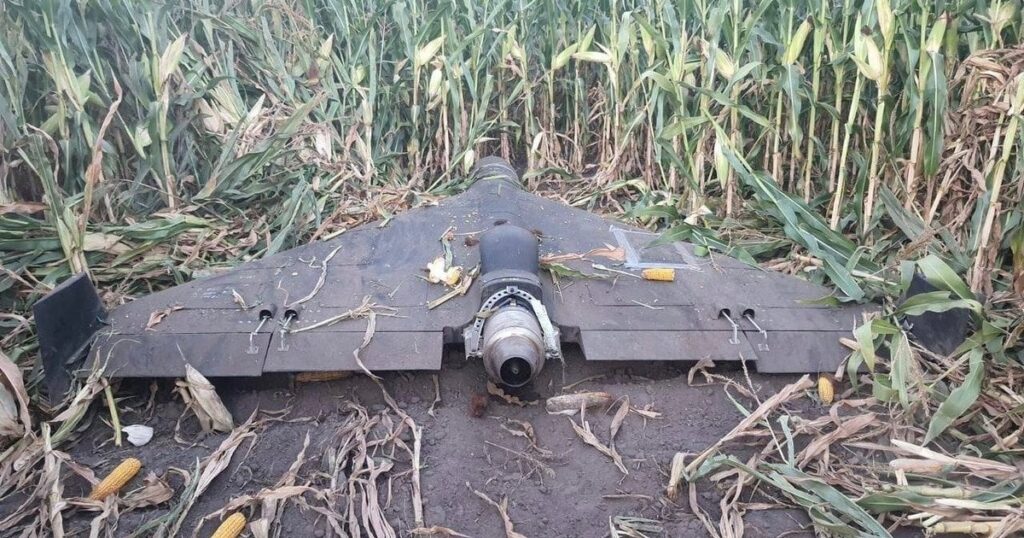
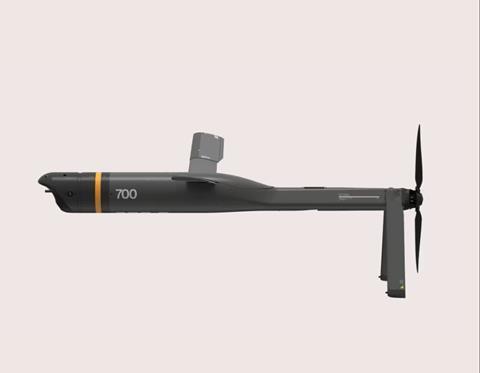
Meanwhile, the never-ending Russia-Ukraine war rages on, dominated by drone attacks from both sides. Russia is increasingly using Iranian Shahed or the equivalent Russian-produced Geran-2 one-way drones, while Ukraine intercepts them with low-end modified commercial drones. This stalemate has $20,000 Geran-2 drones being brought down by high-speed interceptor drones built for $2,000 to $6,000 — in other words, the cost of attrition might determine the victor.
Russian Geran-3 jet-powered drone downed by Ukraine. (Photo: DIU)
However, Russia has now introduced a jet-powered Geran-3 model that flies at up to 230 mph, which Ukraine has apparently been able to bring down.
As we well know, Ukraine not only regularly receives Western military equipment but also civilian drones in large numbers. But an industrial capability has also been created in Ukraine to design, develop and build high volumes of drones. So it’s not surprising that Ukraine has revealed its own interceptor drone known as Sting.
STING interceptor drone and imagery striking a Shahed drone. (Photo: Wild Hornets Group)
Nevertheless, Sting has four rotor props and should be no match for a Geran-3 flying at top speed, even though Sting is claimed to be capable of 215 mph. The Russian jet-powered drone also apparently comes with anti-jam capabilities and a satellite navigation system, but Russia has yet to field these new drones in large numbers. Of course, Ukraine says it has already developed jet-powered interceptor drones — so the step up to the next level of technology should happen for both sides, but of course, costs increase for both sides, which neither can really afford.
Defense has always affected the speed of development for any technology — government funding and oversight are major incentives for new companies to emerge and for new technologies to be developed. Anduril Industries has recently emerged as a new entrant to the U.S. industrial defense complex, specializing in autonomous systems. Anduril’s products include unmanned aircraft systems and counter-UAS, and they have made big strides in both areas.
Anduril is a relatively new company, initially founded in 2017, so its products are fresh off the drawing board and its product improvement experience is at best eight years. The big U.S. defense contractors have fielded and corrected decades of problems in their high-tech systems, so new generations come with hard-learned design and build understanding. The advantage for Anduril is that they are not bound by the restrictions of a long-established industrial heritage, but this can also mean they may still have a way to go in learned experience.
Nevertheless, in high technology, much is new technology and new software and new approaches to build. So it takes effort to not only make this stuff work but also to make it work reliably.
Anduril builds lots of test articles and rapidly evolves the design through rigorous internal and real-world testing. So it’s not uncommon to see test failures — this is how improvements are developed.
Recent U.S. defense tests that saw crashes at Eglin Air Force Base in Florida drew a lot of bad press, given that the Altius drone had already been battle-tested in Ukraine. However, if the approach of lower cost, high volume and attritable drones is the one we have chosen, it may take a little more time to get maturity into the beast.
Navigation testing for NASA’s next Mars drone, jet-powered attack drones, and evolving interceptor defenses and drones from a new player on the U.S. defense scene — a pretty wide range of unmanned aircraft applications.
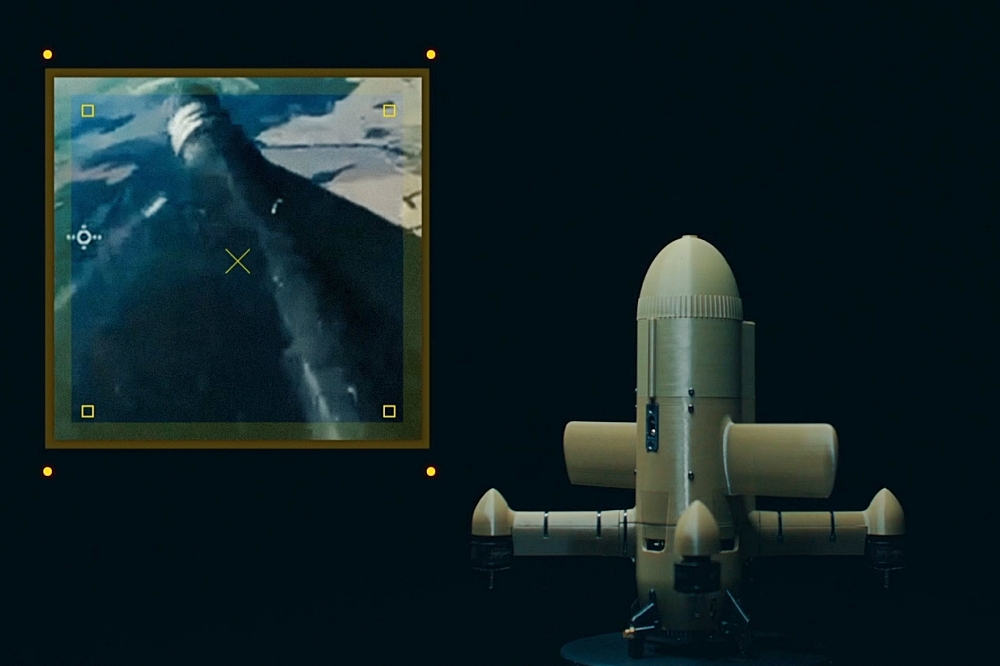
During a public workshop at the Italian Space Agency on Oct. 14-15, the Lunar GNSS Receiver Experiment (LuGRE) project team celebrated the closure of the project and released the data collected to the scientific community.
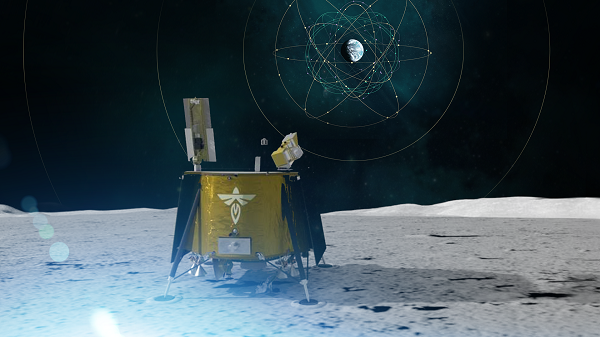
LuGRE, developed in partnership by NASA and the Italian Space Agency (ASI), flew to the Moon a GNSS receiver manufactured by the Italian company Qascom. The receiver was hosted aboard the Firefly BGM1 mission.
LuGRE demonstrated that signals from GNSS satellite constellations can also be used for positioning, navigation and timing (PNT) on the Moon.
The Navigation Signal Analysis and Simulation of the Dept. of Electroncis and Telecommunications of Polytechnic University of Turin processed the data received during the mission and contributed to all the science team activities, including the validation of the data and the processing of the initial set of scientific results.
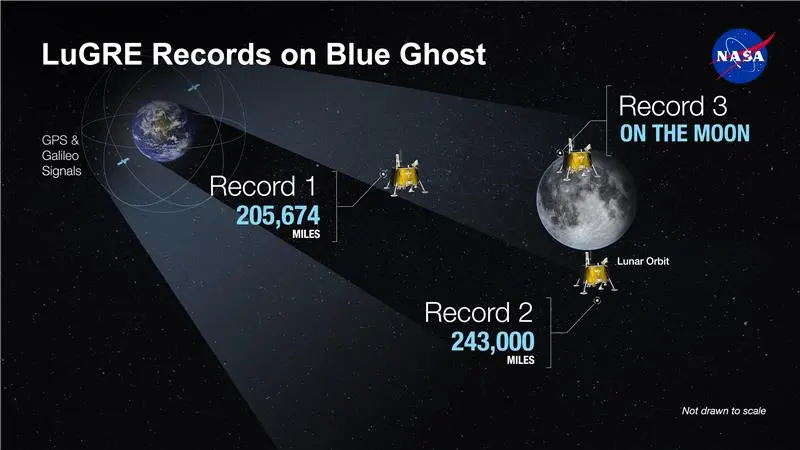
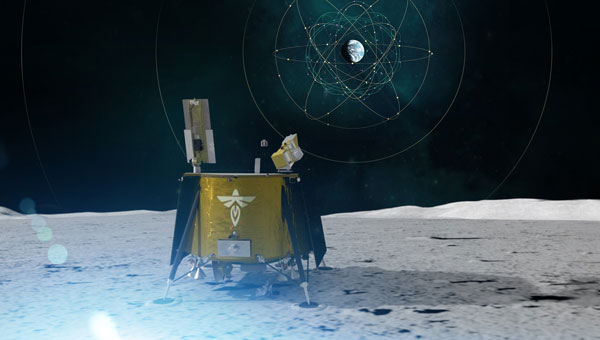
An artist’s concept of the LuGRE payload on Blue Ghost and its three main records in transit to the Moon, in lunar orbit and on the Moon’s surface. (Image: NASA/Dave Ryan)
Launched on Firefly Aerospace’s Blue Ghost lander in January, LuGRE became the first payload to use Earth’s GNSS to calculate a navigation fix on the lunar surface and in lunar orbit. The experiment set a series of distance records on its journey to the Moon, demonstrating that GNSS technology can complement other navigation tools as far as 247,520 miles (398,350 km) from Earth.
These results point to a future where lunar astronauts, rovers and spacecraft can rely on the same satellite-based navigation systems we use every day to augment their navigation capabilities.
“It is a very important milestone for the satellite navigation community,” said Fabio Dovis, Politecnico di Torino, Italian Space Agency, of the project. “For the first time we have the recording of signal of the GPS and Galileo constellation collected in space and on the Moon surface. Already during the LuGRE mission we proved the feasibility of using satellite systems originally designed to be used on Earth up to lunar distances. Now the entire scientific community can use them to ‘re-play’ the space environment as well as analyze them in depth, for example, to retrieve information about the Earth atmosphere crossed by the signal themselves.”
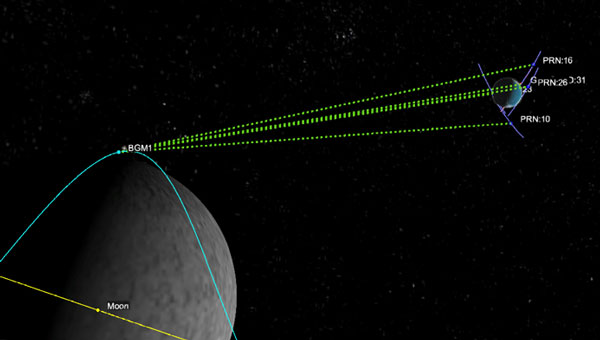
Artistic rendering of LuGRE and the GNSS constellations. In reality, the Earth-based GNSS constellations take up less than 10 degrees in the sky, as seen from the Moon. (Image: NASA/Dave Ryan)
The data release includes the actual GPS and Galileo radio signals LuGRE captured during its journey and on the lunar surface. The raw recordings — called in-phase and quadrature (I/Q) samples — allow researchers to analyze GNSS signal strength, noise and interference under lunar conditions for the first time. Engineers and scientists will use these results to model and refine the next generation of GNSS-based signal receivers and improve our understanding of how navigation signals operate at the Moon.
Graphic representation of the relative geometry of Earth-Moon-acquired GNSS satellites. (Image: Agenzia Sapaziale Italiana)
A massive earthquake and subsequent tsunami off Russia in late July tested an experimental detection system that had deployed a critical component just the day before.
A recent tsunami triggered by a magnitude 8.8 earthquake off Russia’s Kamchatka Peninsula sent pressure waves to the upper layer of the atmosphere, NASA scientists have reported. While the tsunami did not wreak widespread damage, it was an early test for a detection system being developed at the agency’s Jet Propulsion Laboratory in Southern California.
Called GUARDIAN (GNSS Upper Atmospheric Real-time Disaster Information and Alert Network), the experimental technology “functioned to its full extent,” said Camille Martire, one of its developers at JPL. The system flagged distortions in the atmosphere and issued notifications to subscribed subject matter experts in as little as 20 minutes after the quake. It confirmed signs of the approaching tsunami about 30 to 40 minutes before waves made landfall in Hawaii and sites across the Pacific on July 29 (local time).
“Those extra minutes of knowing something is coming could make a real difference when it comes to warning communities in the path,” said JPL scientist Siddharth Krishnamoorthy.
Near-real-time outputs from GUARDIAN must be interpreted by experts trained to identify the signs of tsunamis. But already it’s one of the fastest monitoring tools of its kind: Within about 10 minutes of receiving data, it can produce a snapshot of a tsunami’s rumble reaching the upper atmosphere.
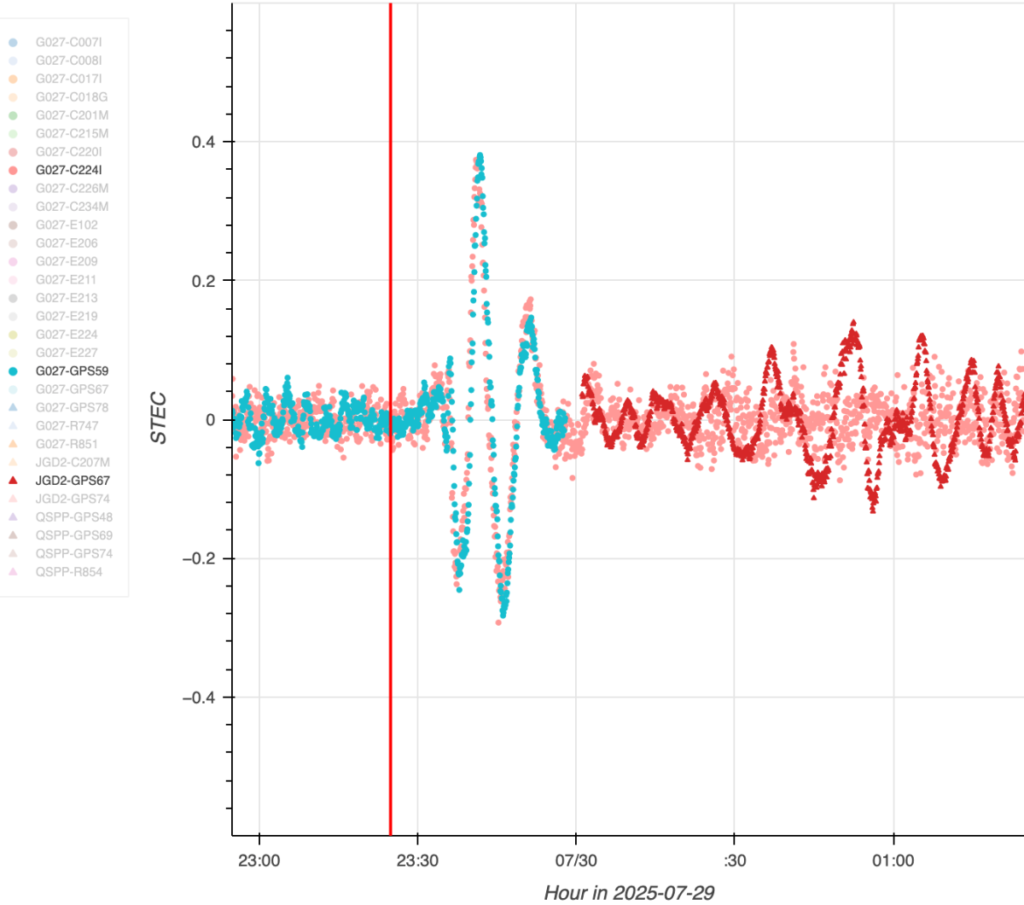
The dots in this graph indicate wave disturbances in the ionosphere as measured between ground stations and navigation satellites. The initial spike shows the acoustic wave coming from the epicenter of the July 29 quake that caused the tsunami; the red squiggle shows the gravity wave the tsunami generated. (Image: NASA/JPL-Caltech)
The dots in this graph indicate wave disturbances in the ionosphere as measured between ground stations and navigation satellites. The initial spike shows the acoustic wave coming from the epicenter of the July 29 quake that caused the tsunami; the red squiggle shows the gravity wave the tsunami generated.
The goal of GUARDIAN is to augment existing early warning systems. A key question after a major undersea earthquake is whether a tsunami was generated. Today, forecasters use seismic data as a proxy to predict if and where a tsunami could occur, and they rely on sea-based instruments to confirm that a tsunami is passing by. Deep-ocean pressure sensors remain the gold standard when it comes to sizing up waves, but they are expensive and sparse in locations.
“NASA’s GUARDIAN can help fill the gaps,” said Christopher Moore, director of the National Oceanic and Atmospheric Administration Center for Tsunami Research. “It provides one more piece of information, one more valuable data point, that can help us determine, yes, we need to make the call to evacuate.”
Moore noted that GUARDIAN adds a unique perspective: It’s able to sense sea surface motion from high above Earth, globally and in near-real-time.
Bill Fry, chair of the United Nations technical working group responsible for tsunami early warning in the Pacific, said GUARDIAN is part of a technological “paradigm shift.” By directly observing ocean dynamics from space, “GUARDIAN is absolutely something that we in the early warning community are looking for to help underpin next generation forecasting.”
How GUARDIAN works
GUARDIAN takes advantage of tsunami physics. During a tsunami, many square miles of the ocean surface can rise and fall nearly in unison. This displaces a significant amount of air above it, sending low-frequency sound and gravity waves speeding upwards toward space. The waves interact with the charged particles of the upper atmosphere — the ionosphere — where they slightly distort the radio signals coming down to scientific ground stations of GPS and other positioning and timing satellites. These satellites are known collectively as the Global Navigation Satellite System (GNSS).
While GNSS processing methods on Earth correct for such distortions, GUARDIAN uses them as clues. The software scours a trove of data transmitted to more than 350 continuously operating GNSS ground stations around the world. It can potentially identify evidence of a tsunami up to about 745 miles (1,200 kilometers) from a given station. In ideal situations, vulnerable coastal communities near a GNSS station could know when a tsunami was heading their way and authorities would have as much as 1 hour and 20 minutes to evacuate the low-lying areas, thereby saving countless lives and property.
Key to this effort is the network of GNSS stations around the world supported by NASA’s Space Geodesy Project and Global GNSS Network, as well as JPL’s Global Differential GPS network that transmits the data in real time.
The Kamchatka event offered a timely case study for GUARDIAN. A day before the quake off Russia’s northeast coast, the team had deployed two new elements that were years in the making: an artificial intelligence to mine signals of interest and an accompanying prototype messaging system.
Both were put to the test when one of the strongest earthquakes ever recorded spawned a tsunami traveling hundreds of miles per hour across the Pacific Ocean. Having been trained to spot the kinds of atmospheric distortions caused by a tsunami, GUARDIAN flagged the signals for human review and notified subscribed subject matter experts.
Notably, tsunamis are most often caused by large undersea earthquakes, but not always. Volcanic eruptions, underwater landslides, and certain weather conditions in some geographic locations can all produce dangerous waves. An advantage of GUARDIAN is that it doesn’t require information on what caused a tsunami; rather, it can detect that one was generated and then can alert the authorities to help minimize the loss of life and property.
While there’s no silver bullet to stop a tsunami from making landfall, “GUARDIAN has real potential to help by providing open access to this data,” said Adrienne Moseley, co-director of the Joint Australian Tsunami Warning Centre. “Tsunamis don’t respect national boundaries. We need to be able to share data around the whole region to be able to make assessments about the threat for all exposed coastlines.
Alpha Unmanned Systems (Alpha) in Madrid, Spain, has been developing and building helicopter UAVs for 10 years and has successfully employed them with defense departments in 10 countries. Its UAVs are ruggedized and qualified for the harsh conditions encountered at sea. The fully autonomous A800 and more recent A900 model UAVs have been used in military applications such as border patrol, situation awareness, intelligence gathering, coast guard support and aerial helicopter target simulation. Commercial applications include fishing fleets and oil rig support.
Alpha A900 approaches for deck landing. (Credit: Alpha)
The helicopter UAVs are equipped with a GNSS/MEMS autopilot system that maintains navigation if GNSS is jammed. MEMS sensors, however, can experience significant drift over time. The Alpha model offers two additional backup solutions. With an advanced air data system and pitot sensors, the aircraft can estimate airspeed and wind velocity to help maintain its flight path. If attitude estimation degrades further, remote pilot judgment may be required to recover control. For ground operations, a visual navigation system with a downward-looking camera can record terrain during overflights, building a database that enables navigation in GNSS-denied environments.
One of the newer capabilities Alpha has added includes an Automatic Identification System (AIS) receiver. AIS is a primary radar transponder system used by ships around the world to provide each other with tracking information on other ships that are within about a 30-mile range. With an AIS receiver onboard the UAS surveillance helicopter, ships that are out of visual range, maybe out close to the horizon, now become trackable.
Alpha is a small company that has been in operation since 2014, and it is one of the first to design helicopter UAVs for rough weather and at-sea environments. It’s good to see a focused, supportive outfit gradually succeed, not only with European defense organizations, but also in the U.S. and around the world.
Meanwhile, in a universe that’s not far, far away — in fact, in our solar system — plans are moving forward at NASA to visit Titan with a UAV. Titan is a moon of Saturn that is most favored to have the capability to start, and maybe support, life. Numerous organic compounds have been detected during earlier satellite visits. But this is no ordinary UAV, quite unlike Ingenuity, the solar-powered hopper that NASA flew 72 times on Mars.
Ingenuity, a UAV that flew 72 times on Mars. (Credit: NASA)
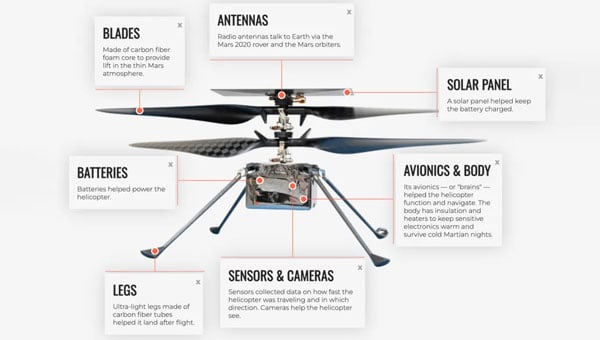
NASA’s Ingenuity helicopter, which traveled to Mars attached to the Perseverance rover, was designed to demonstrate powered flight in the Red Planet’s thin atmosphere. Ingenuity featured oversized rotor blades to generate enough lift and was built to be as lightweight as possible. Its only equipment was a camera and speed sensors, with no scientific instruments aboard.
The helicopter performed flights over Jezero Crater, ultimately spending about 130 minutes aloft and covering 11 miles during 72 flights. Ingenuity’s mission came to an end after it sustained damage to a rotor during a hard landing, grounding the aircraft and concluding its operations on Mars.
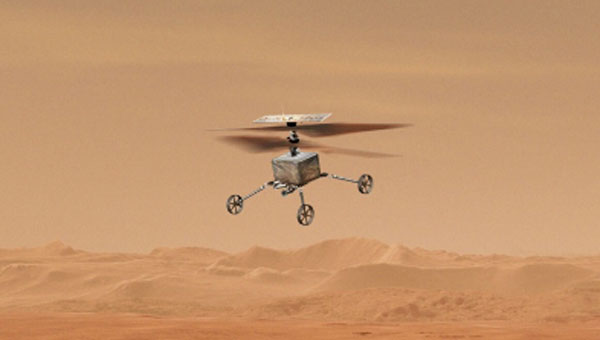
The next interplanetary unmanned flying system is significantly more complex, replacing the lander and drone approach used on the Red Planet with a complete vehicle capable of flying and conducting the necessary investigative science. With a budget of $3.35 billion, NASA’s work has been underway since 2024, led by John Hopkins Applied Physics Lab, and a host of main and supporting organizations, including Lockheed Martin Space, Malin Space Science Systems (cameras), Honeybee Robotics (Blue Origin subsidiary, moon lander development) and participation by agencies in France, Germany and Japan. While Ingenuity was developed and built by UAV manufacturer AeroVironment with management/support from NASA/Jet Propulsion Labs (JPL), the team for Dragonfly appears to have a few industrial partners and extensive government support – hopefully, this works out!
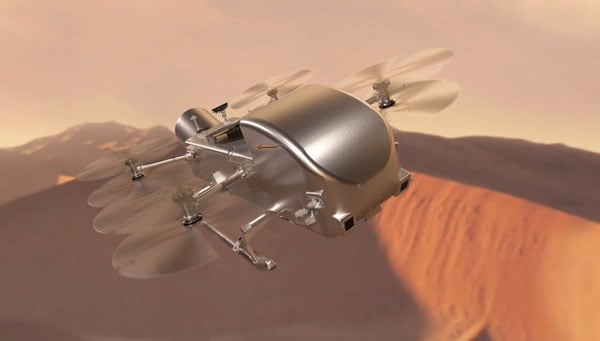
Powered by a Radioisotope Thermoelectric Generator (RTG), Dragonfly has four sets of double rotors, landing skids, and, of course, has to be fully autonomous – the radio transit time between Titan and Earth is between 1 hour 10 minutes and 1 hour 40 minutes. Titan’s night is eight Earth days long, so the idea is to fly during the day (throughout 15 Earth days), then land and recharge batteries, and receive NASA’s instructions for the following day’s activities during the long night. The atmosphere is thought to be substantially composed of nitrogen and methane, four times thicker than Earth’s, and gravity is about 1/7, so 4 ft props with enough lift and power could carry the 880 lb to 990 lb UAV up to 10 miles for each flight at altitudes of up to 12,000 ft. But when observing and imaging the terrain, we might guess it would probably mean mostly low-level flights.
Dragonfly Titan UAV explorer (Credit: NASA/Johns Hopkins APL/Steve Gribben)
At this weight, we are looking at something quite substantial to be flying around the anticipated sand dunes and frozen methane surface of Titan. Autonomous operations will need to be tight and safe for this big vehicle to operate and survive; it’s not exactly a small car, but quite substantial. Not to mention that landing will need to be somewhat delicate to protect the sensitive onboard instrumentation.
A spacecraft is scheduled to launch aboard a SpaceX Falcon Heavy in 2028, embarking on a complex journey that includes a flyby of Venus and a gravity-assist maneuver past Earth to set a direct course for Saturn’s moon Titan. The probe is set to enter Titan’s dense atmosphere directly, protected by a heat shield. After initial deceleration from atmospheric drag, two drogue parachutes will deploy, followed by a powered descent to the equatorial region known as the Shangri-La dune fields.
The voyage is expected to take six years, with arrival at Titan in 2038. Once on the surface, the Dragonfly mission will begin a 2.7-year exploration of the moon.
An interesting initial glimpse into a future, really advanced drone are undertaking. Hopefully, NASA will keep to its schedule, the budget holds up, and we start to see hardware in the next few years. Meanwhile, Alpha could be on version 16 of its UAV helicopter by then and achieve massive success with its multi-mission UAV applications.
NASA and the Italian Space Agency (ASI) are collaborating on the Lunar GNSS Receiver Experiment (LuGRE), which seeks to demonstrate the viability of providing positioning, navigation and timing capabilities on the moon using GPS and Galileo signals.
LuGRE’s payload consists of a weak-signal GNSS receiver, a high-gain L-band patch antenna, a low-noise amplifier and an RF filter. The receiver is designed to track GPS L1 C/A and L5 signals, as well as Galileo E1 and E5a signals. It will collect pseudorange, carrier phase and Doppler measurements, calculate onboard navigation solutions, and have the capability to record raw I/Q baseband samples for ground processing.
NASA‘s Space Communications and Navigation (SCaN) Program office funded and oversaw the experiment. It was selected as one of ten research and technology demonstrations for lunar surface delivery by Firefly Aerospace, under NASA’s Commercial Lunar Payload Services (CLPS) initiative.
LuGRE builds upon previous missions in the Space Service Volume, including experiments by AMSAT-OSCAR 40, GOES-R series satellites and the NASA Magnetospheric Multiscale mission. It aims to be one of the first demonstrations of GNSS signal reception and navigation in the lunar environment, potentially paving the way for operational use in future lunar missions.
The target launch date for the Blue Ghost 1 mission carrying LuGRE is Jan. 15, 2025. Upon completion, all LuGRE science data will be made available to the public for the benefit of the GNSS and space communities.
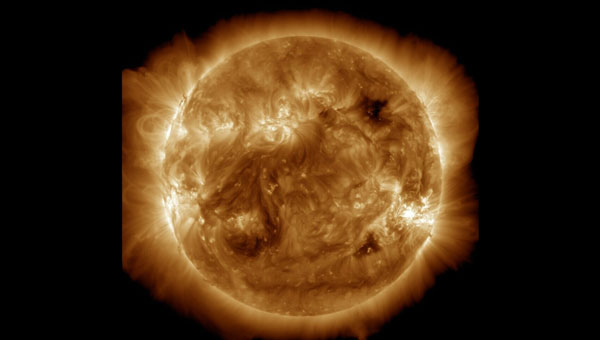
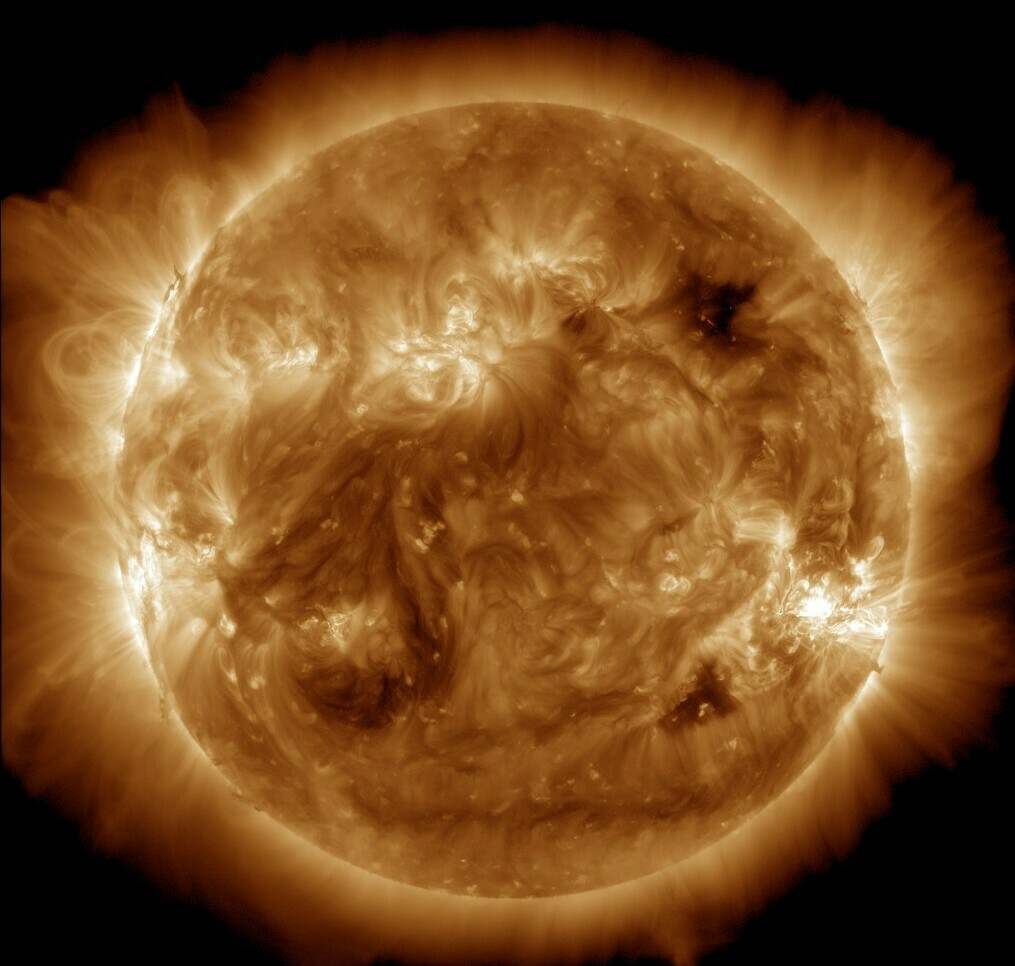
NASA’s Solar Dynamics Observatory captured this image of solar flares on May 11, 2024. The NOAA says there have been measurable effects and impacts from the geomagnetic storm. (Photo: Solar Dynamics Observatory)
Earth is experiencing a severe solar storm causing concern for those responsible for power grids, communication systems and satellites.
The National Oceanic and Atmospheric Administration (NOAA) has reported measurable effects and impacts from the geomagnetic storm that has been visible as aurora across vast swathes of the Northern Hemisphere. As of May 12, 2024, NOAA had seen no reports of major damage.
There has been some degradation and loss to communication systems that rely on high-frequency radio waves, NOAA told NPR, as well as some preliminary indications of irregularities in power systems.
“Simply put, the power grid operators have been busy since yesterday working to keep proper, regulated current flowing without disruption,” said Shawn Dahl, service coordinator for the Space Weather Prediction Center at NOAA.
“Satellite operators are also busy monitoring spacecraft health due to the S1-S2 storm taking place along with the severe-extreme geomagnetic storm that continues even now,” Dahl added, saying some GPS receivers have struggled to lock locations and offered incorrect positions.
As NOAA warned, the Earth has been experiencing a G5, or “extreme,” geomagnetic storm. It is the first G5 storm to hit the planet since 2003, when a similar event temporarily knocked out power in part of Sweden and damaged electrical transformers in South Africa.
As of May 13, NOAA’s Space Weather Prediction Center said that a G3, or “strong,” geomagnetic storm warning was in effect until 2 a.m. ET. While stronger storms are no longer likely and conditions are expected to “gradually wane” throughout the day, the center said in its forecast that moderate to strong geomagnetic storms are “likely” on May 13, as are minor storms on May 14.
The center also said that “solar activity is expected to be at high levels” with a possibility of more solar flares, or bursts of electromagnetic radiation from the sun.
The update came as another X-class solar flare was recorded. X-class flares are the strongest class of these solar bursts, and the latest was recorded as “moderate.”
Flares of this magnitude are not frequent,” the center said. “…Users of high frequency (HF) radio signals may experience temporary degradation or complete loss of signal on much of the sunlit side of Earth.”
Northern lights in unusual places
On May 12, people from all around the world shared photos of a dazzling display of the Northern Lights, which were visible in Russia, Scandinavia, the United Kingdom, continental Europe and some even reported seeing the aura as far south as Mallorca, Spain.
In the United States, the NOAA center shared that the storm-induced auroras were visible as far south as Northern California and Alabama.
The source of the solar storm is a cluster of sunspots on the sun’s surface that is 17 times the diameter of Earth. The spots are filled with tangled magnetic fields that can act as slingshots, throwing huge quantities of charged particles toward our planet. These events, known as coronal mass ejections, become more common during the peak of the Sun’s 11-year solar cycle.
While the storm has proven to be large, predicting the effects of such incidents can be difficult, Dahl said.
The world has grown more reliant on electronics and electrical systems. Depending on the orientation of the storm’s magnetic field, it could induce unexpected electrical currents in long-distance power lines. Those currents could cause safety systems to flip and trigger temporary power outages in some areas.
I took these photos near Ranfurly in Central Otago, New Zealand. Anyone can use them please spread far and wide. :-) https://t.co/NUWpLiqY2S
— Dr Andrew Dickson reform/ACC (@AndrewDickson13) May 10, 2024
The storm caused some navigational systems in tractors and other farming equipment to break down, suppliers and farmers told the New York Times.
Farmers have become dependent on equipment that utilizes GNSS and other navigation technology to help them plant more effectively — a practice known as precision agriculture. However, some of these operations in the Midwest, as well as in other parts of the United States and Canada, came to a temporary halt.
How it affects the ionosphere
The storm will also likely disrupt the ionosphere, a section of Earth’s atmosphere filled with charged particles. Some long-distance radio transmissions use the ionosphere to “bounce” signals around the globe, and those signals can be disrupted.
The particles may also refract and otherwise scramble GNSS signals, according to Rob Steenburgh, a space scientist with NOAA. Those effects can linger for a few days after the storm.
The storms can bring on ionospheric scintillation, which refers to rapid fluctuations in GNSS signal strength and phase due to localized irregularities in the electron density of the ionosphere resulting from solar activity. Scintillation adversely affects GNSS positioning, particularly around the geomagnetic equator after local sunset.
Similarly to Dahl, Steenburgh said that it is unclear just how bad the disruptions will be. While we still depend on GNSS, there are also more satellites in orbit. Moreover, the anomalies from the storm are constantly shifting through the ionosphere like ripples in a pool. “Outages, with any luck, should not be prolonged,” Steenburgh said.
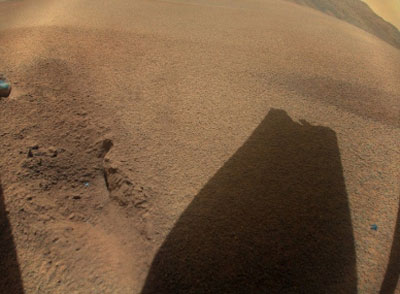
NASA’s Ingenuity took this picture on Jan. 18, 2024. The sand-dune, rock-less area where Ingenuity last showing the shadow of its damaged rotor blade. (Image: NASA)
It appears that the little extraterrestrial drone that could has come a cropper on Mars and now will not be flying again – it is permanently grounded. The Jet Propulsion Lab (JPL) crew managing Ingenuity was running a regular scouting trip over a featureless sand-dune area on Dec. 22, 2023. Suddenly, the UAV’s visual navigation system malfunctioned, which led to a hard emergency landing.
When the autonomous navigation system did not have any landmarks to match its digital reference map, it reverted to an emergency landing. Maybe the poor guy should have had a few moments to gather its airborne wits and to come down softly, but alas at the same time the connection with the rover was lost, he dove for cover and broke a chunk off at least one of the counter-rotating blades. This now apparently prevents further take-offs. Mars’ atmosphere is only 1% as dense as Earth’s, so those rotors need all their designed lift capabilities to grab enough ‘air’ and get the 4 lb helicopter airborne. The flight control system may be unable to cope with the resulting compromised lift profile. Either way Ingenuity’s flying days are over, according to NASA.
Conceptual design for the Sample Recovery Helicopters (Image: Aerovironment/ NASA/ JPL)
Ingenuity completed 72 flights over the course of three years, surpassing its original 30-day mission to prove the possibility of a miniature, autonomous helicopter flight on Mars. After its initial four flights, NASA and JPL chose the UAV to scout out safe paths for the Perseverance rover from an airborne perspective.
All is not lost for Ingenuity, however. AeroVironment, the UAV manufacturer that co-developed Ingenuity with NASA/JPL, has been awarded another contract to design and develop two prototype ‘sample-return’ helicopters for NASA’s next major Mars expedition.
Building on Ingenuity’s design, the new UAV will have wheels and a grappling contraption to pick up sample tubes, which could assist in the Mars sample recovery mission. Perseverance is currently expected to be the lead in transferring cached sample tubes to the new Sample Retrieval Lander for return to Earth, but the new helicopters provide a different backup option on Mars for pick-up and transport of the tubes.
Back here on Earth, the latest tragic news from the Middle East — the UAV attack on the US Tower 22 military outpost in Jordan which cost three soldiers their lives and injured at least 34 others — appears to have been due to a lack of defensive capability. Earlier news releases indicated that the kamikaze UAV had arrived at the same time as the expected return of a U.S. UAV from the base, implying that defenses may have been taken down temporarily. It now seems that there was little active defense to prevent the attack.
The attacking UAV reportedly came in very low, and the base was unable to track its approach. The base is said to have defensive signal jamming capabilities, but without radar visibility of the UAV and knowing an attack was in progress, the jammers may have been ineffective or inactive.
Tower 22 was thought of as a low-risk-of-attack U.S. base, perhaps supporting another U.S. base in Syria with logistics, so no active drone suppression system had been provisioned. This assessment, and those for similar bases in the area and around the world, may perhaps have to be revised and sufficient active defenses may need to be installed.
While U.S. and Ukrainian forces deal with attacking drones, Iran has unveiled its latest addition to its arsenal of one-way killer unmanned aircraft.
Image: Iranian Military Media
Iran displayed the Shahed-238 in public in November 2023, so there may have already been enough time to get some of these very fast-flying vehicles through the manufacturing process and begin deliveries to Russia and Iranian proxy agents. The advantage of jet-power is of course significant speed over propeller-driven variants, while the range may be significantly less for the same fuel capacity. The disadvantage for the United States and Ukraine is that most fielded conventional UAV detection radars have difficulty seeing fast targets in time to activate and aim defensive weapons.
The situation for Ukraine and the United States in the Middle East appears to be worsening as large numbers of Iranian-supplied and locally manufactured kamikaze UAVs are pumped into the war zone and ‘hot spots’ in the Middle East.
It is sad that Mars aerial views may be limited as Ingenuity seems to be permanently grounded, and the Middle East doesn’t sound too safe to be hanging around in either! Further escalation of prices might be expected, too, as a good part of the volume of cargo ships settle into sailing around Africa. Let’s look for better news in the coming months.