“Seen & Heard” is a monthly feature of GPS World magazine, traveling the world to capture interesting and unusual news stories involving the GNSS/PNT industry.
Photo: NOAA Ocean Exploration
Exploring the Largest Deep-Sea Coral Reef
Scientists have mapped the largest deep-sea coral reef, stretching hundreds of miles off the U.S. Atlantic Coast. While researchers have known since the 1960s that some corals were present off the Atlantic Coast, the reef’s size remained a mystery until new underwater mapping technology made it possible to construct 3D images of the ocean floor. The National Oceanic and Atmospheric Administration (NOAA) and a team of scientists recently published maps of the reef in the journal Geomatics. The reef extends for about 310 miles from Florida to South Carolina. The total area is nearly three times the size of Yellowstone National Park.
Photo: ESA
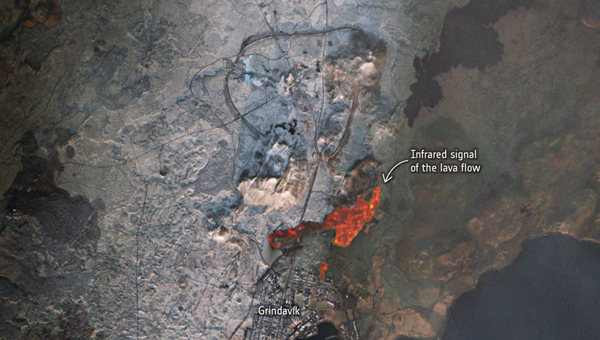
Lava in Iceland
Grindavík, a tiny town in Iceland, stands on the brink of volcanic lava flow in images captured by the European Space Agency (ESA). The lava originates beneath the Svartsengi volcano system — roughly 2.5 miles north of the town — which erupted on December 18 and January 14. ESA’s Sentinel2 satellite revealed the glow of the lava flow’s heat, not far from houses and other infrastructure within Grindavík. The town, with just 3,800 residents, has faced constant evacuations, as well as mini-earthquakes as a result, The Guardian reported.
Photo: Maris Maskalans / iStock / Getty Images Plus / Getty Images
Lidar Reveals Lost Cities in the Amazon
In the Amazon rainforest, archeologists have discovered a vast and highly complex system of ancient cities dating back nearly 3,000 years. Located in Ecuador’s Upano Valley, the structures lie in the eastern foothills of the Andes mountains, according to a study published in the journal Science. After more than 20 years of research, the ancient urban centers were only discovered when the Ecuadorean government employed lidar technology. Researchers from France, Germany, Ecuador and Puerto Rico conducted a lidar survey that covered roughly 300 km2, which revealed a landscape full of organized human activities, including more than 6,000 rectangular earthen platforms, as well as agricultural terraces and drainage systems. According to the study, these structures formed at least 15 distinct settlements, which were connected by a system of wide, straight roads.
Australian scientists are attempting to track 1,000 cattle and buffalo using artificial intelligence (AI), and GPS satellites, reported euronews.next. An estimated 22,000 cattle and buffalo roam free in a remote area of Arnhem Land, Australia, though the exact number is unknown. Scientists are now collaborating with stockmen and indigenous rangers in a four-year program that involves monitoring feral animals from space. Titled SpaceCows, the remote herd management system is backed by the Australian government’s Smart Farming Partnership initiative. Local rangers and stockmen are chasing and catching animals to attach solar-powered tags with GPS receivers.
“Seen & Heard” is a monthly feature of GPS World magazine, traveling the world to capture interesting and unusual news stories involving the GNSS/PNT industry.
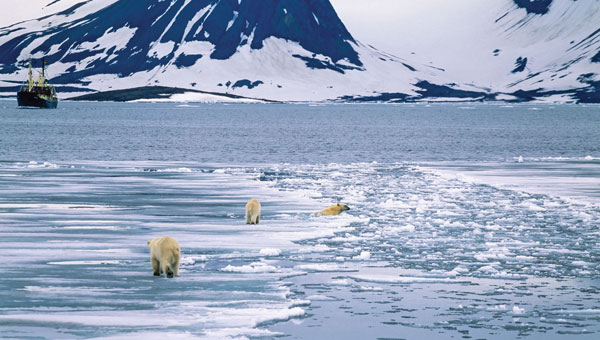
According to the 2023 Arctic Report Card by the National Oceanic and Atmospheric Administration (NOAA), new records have been documented showing that human-induced warming of the atmosphere, ocean and land is creating adverse impacts on people, ecosystems and communities across the Arctic region. The report states the Arctic is experiencing a faster rate of warming than any other part of the world. Overall, it was the Arctic’s sixth-warmest year on record. Sea ice extent continued to decline, with the past 17 Septembers now registering as the lowest on record.
Researchers from Chang’an University in China have developed a new method of tracking landslides. The team combined GNSS precise point positioning (PPP) techniques with a cumulative sum control chart (CUSUM) method. Conducted at the Tengqing landslide in Liupanshui, Guizhou Province, Southwest China, the study aims to enhance the precision in tracking the movements of the landslides and improve the overall reliability of the monitoring results.
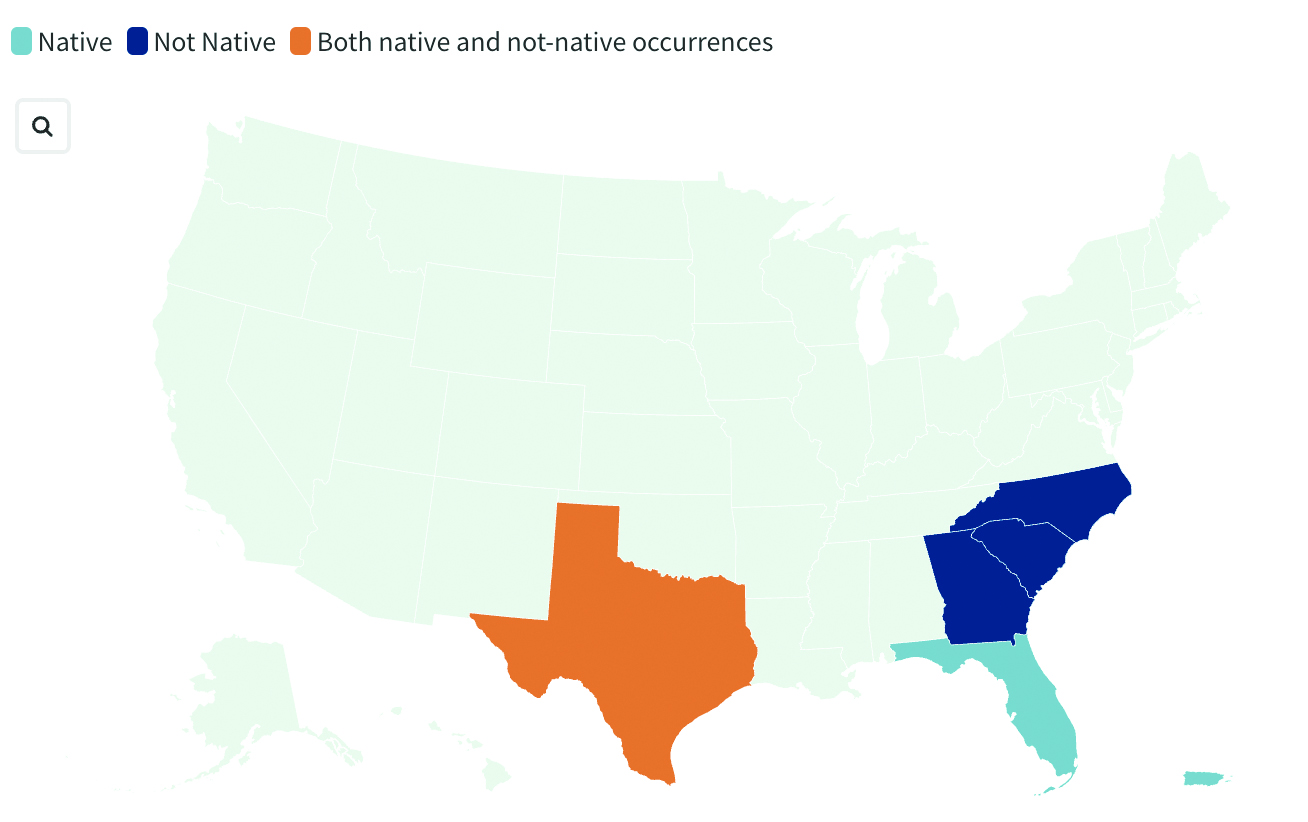
Crabs on the move
Image: United States Geological Survey (USGS)
Georgia officials are asking the public for help in spotting non-native blue land crabs as they appear to be moving north in recent years, according to data collected by the United States Geological Survey (USGS). According to USGS, it is unclear whether this movement is driven by humans or by the crabs themselves, or if the crabs are breeding in their non-native homes. Officials worry about the damage caused by the crabs’ burrowing behavior. While scientists learn about how the species interacts with its new environment, several states are asking residents to report sightings.
India’s war on drugs
Image: evandrorigon / E+ / Getty Images
India’s border security force (BSF) has said it is battling an unprecedented UAV “menace” infiltrating the border with Pakistan, fueling the drug crisis in the state of Punjab and raising serious security issues, reported The Guardian. UAVs have dropped weapons such as pistols and Chinese-made assault rifles, as well as consignments of opium and heroin believed to be from Afghanistan.
In my November 2023GPS World newsletter, I highlighted the announcement made by the National Geodetic Survey (NGS) of the recipients of the National Oceanic and Atmospheric Administration (NOAA) FY 2023 Geospatial Modeling Competition Awards. As stated in the newsletter, NGS awarded the grants for projects that will research emerging problems in the field of geodesy and develop tools and models to advance the modernization of the National Spatial Reference System (NSRS). A significant improvement in the new, modernized NSRS is the time-dependent component being incorporated in the computation of reference epoch coordinates (RECs). That said, developing models that accurately capture the time-dependent component is extremely important to providing reliable, consistent, and accurate RECs. This is not a simple problem to solve. Two of the grantees, Scripps Institution of Oceanography (SIO) and The Ohio State University (OSU) include developing models to address what NGS denotes as the Intra-Frame Deformation Model (IFDM).
This newsletter is going to highlight OSU’s geospatial award and my March newsletter will highlight the SIO proposal.
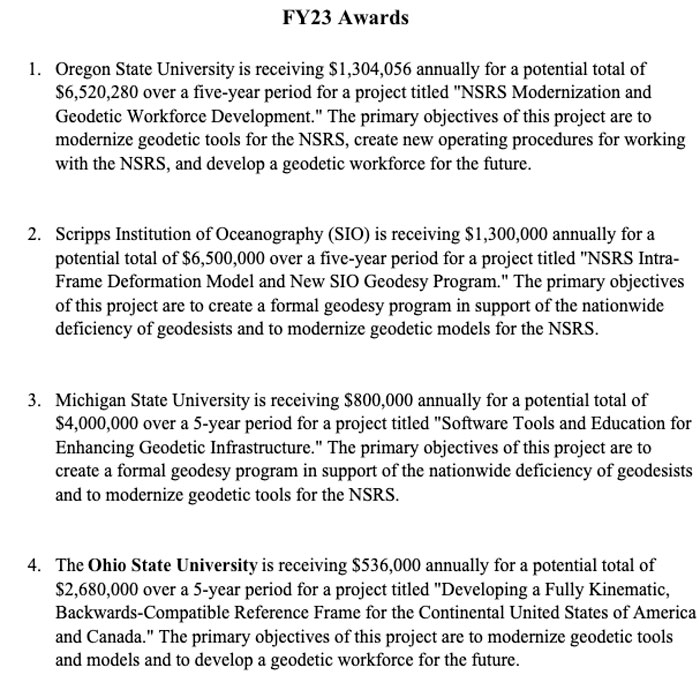
Summary of the OSU Geospatial Awards. (Image: NGS website)
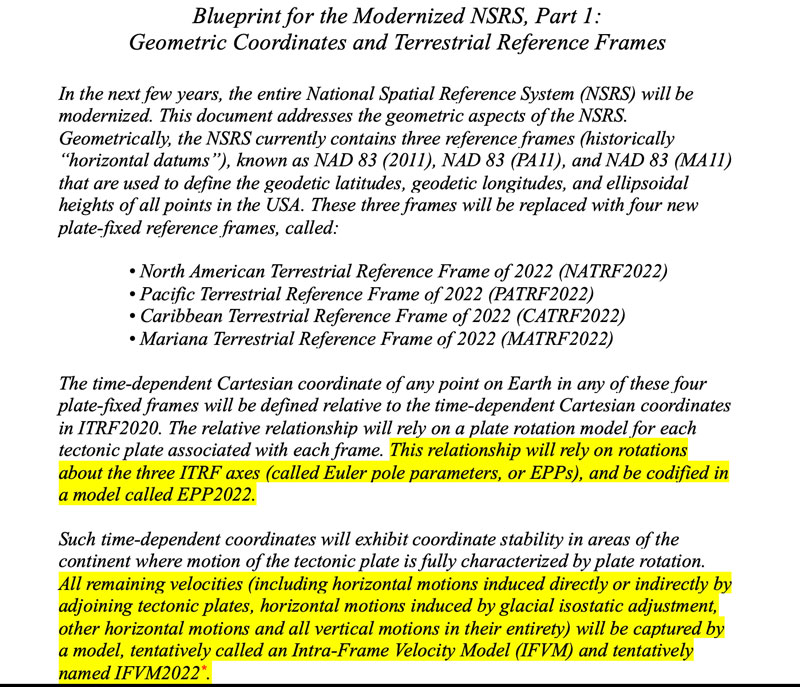
The time-dependent models for the new, modernized NSRS — that is, Euler pole parameters (EPP) and Intra-Frame Deformation Model (IFDM)] — are discussed in NOAA Technical Report NOS NGS 62, “Blueprint for the Modernized NSRS, Part 1: Geometric Coordinates and Terrestrial Reference Frames” and NOAA Technical Report NOS NGS 67, “Blueprint for the Modernized NSRS, Part 3: Working in the Modernized NSRS.” The EPP2022 and IFDM2022 models will make time-dependent geodetic control useable for most surveyors, engineers, and geospatial users.
So, what are EPP2022 and IFDM2022? What does it mean to users of the new, modernized NSRS? Basically, the EPP model changes the reference frame of the coordinates but not the epoch and the IFDM model changes the epoch of the coordinates but not the reference frame.
For the OSU grant proposal, I had the opportunity to talk with Dr. Demián Gómez, the lead principal investigator (PI) for the OSU grant. Demián has extensive experience in modeling time-dependent coordinates and is the lead author on several papers published in the Journal of Geodesy that address this topic.
Articles by Gómez in the Journal of Geodesy
Gómez, D., Piñón, D.A., Smalley, R. et al (2015) Reference frame access under the effects of great earthquakes: a least squares collocation approach for non-secular post-seismic evolution. J Geod. https://doi. org/10. 1007/s00190-015-0871-8
Gómez, D.D., Bevis, M. G. & Caccamise, D.J. Maximizing the consistency between regional and global reference frames utilizing inheritance of seasonal displacement parameters. J Geod 96, 9 (2022). https://doi. org/10. 1007/s00190-022-01594-0
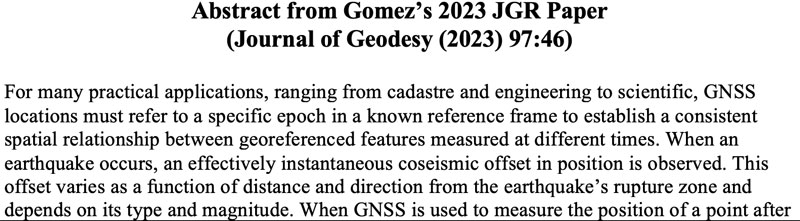
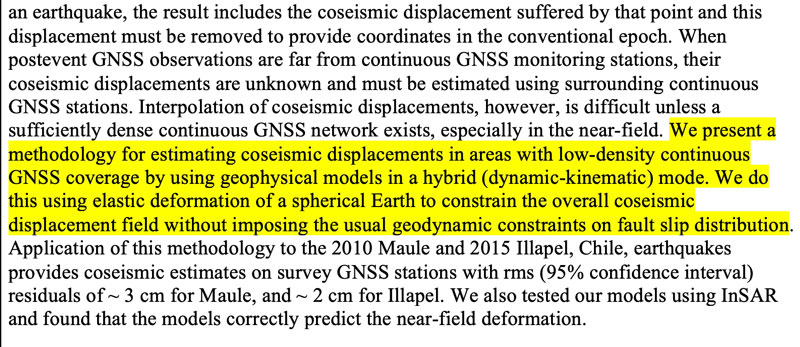
Gómez, D.D., Figueroa, M. A., Sobrero, F. S. et al. On the determination of coseismic deformation models to improve access to geodetic reference frame conventional epochs in low-density GNSS networks. J Geod 97, 46 (2023). https://doi. org/10. 1007/s00190-023-01734-0
In his latest paper, titled “On the determination of coseismic deformation models to improve access to geodetic reference frame conventional epochs in low-density GNSS networks,” the authors applied their methodology to two earthquakes in Chile: the 2010 Maule and 2015 Illapel earthquakes. The paper describes their methodology for estimating coseismic displacements in areas with low-density continuous GNSS coverage by using geophysical models in a hybrid (dynamic-kinematic) mode. Their methodology provided coseismic estimates on survey GNSS stations with rms (95% confidence interval) residuals of ~ 3 cm for Maule, and ~ 2 cm for Illapel. They also tested their models using InSAR and found that the models correctly predicted the near-field deformation. The authors believe that their methodology to obtain coseismic surface displacement models, based on a spherical layered Earth, for GNSS trajectory prediction models (TPMs) using sparse GNSS data represents a major improvement relative to coseismic models incorporated in TPMs, such as NGS’s Horizontal Time-Dependent Positioning model (HTDP) and Transformations in Four Dimensions (TRANS4D). This is important to users of the new, modernized NSRS because the accuracy of the IFDM2022 model is important to providing accurate RECs in the new, modernized NSRS.
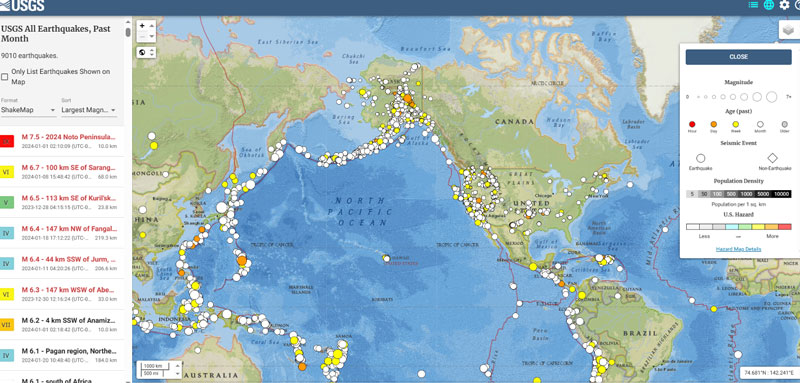
Most individuals in the United States associate earthquakes with California, but earthquakes occur every day in NGS’s area of responsibility. The USGS has a website that lists the location and magnitude of earthquakes.
Plot of earthquakes — 12/21/2023 to 01/20/2024. (Image: USGS website)
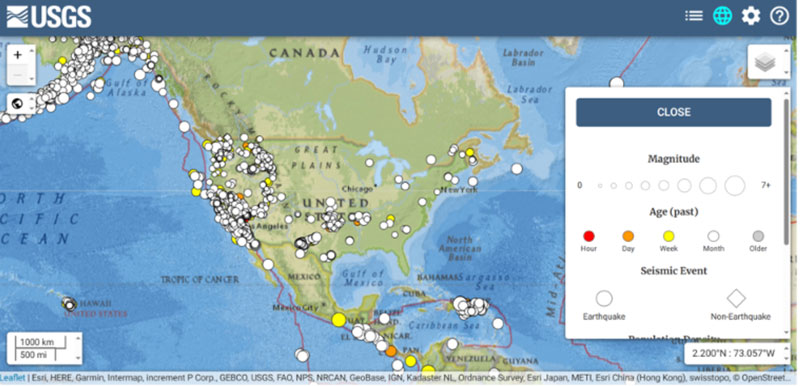
The box below highlights the earthquakes in the conterminous United States during a 30-day period. Most of these earthquakes have small magnitudes. The question is, what effects do these earthquakes have on nearby published marks in the NSRS?
Plot of earthquakes in CONUS — 12/21/2023 to 01/20/2024. (Image: USGS website)
The website provides information on both earthquake and non-earthquake events.
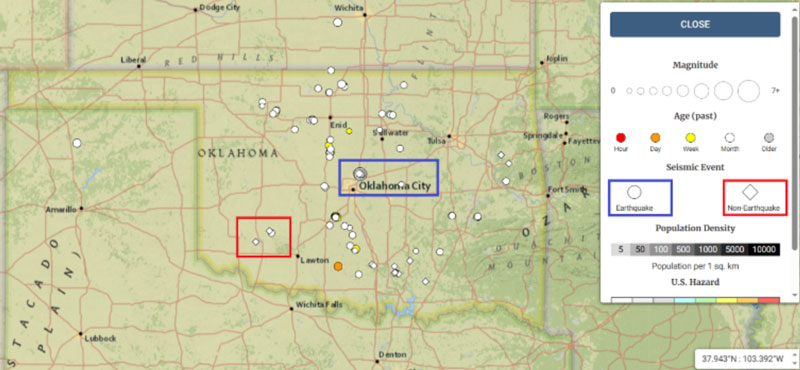
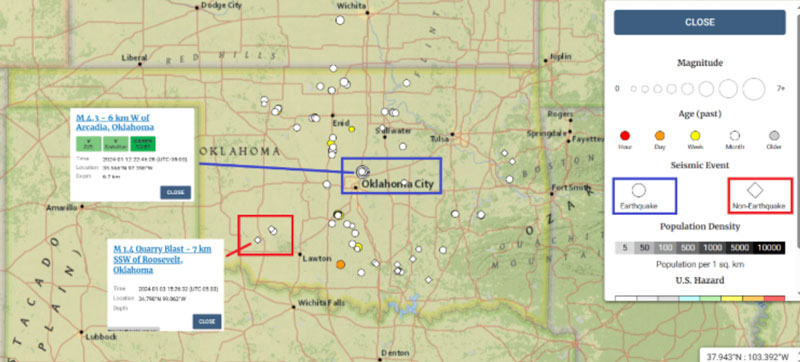
Plot of earthquakes in Oklahoma — 12/21/2023 to 01/20/2024. (Image: USGS website)
I was wondering what it meant by non-earthquake events, so I clicked on some of the icons. As indicated on the plot, a quarry blast registered on the USGS system. Again, the question is, do these earthquakes and non-earthquake events affect the coordinates of marks in the ground?
Plot of non-earthquakes in Oklahoma. (Image: USGS website)
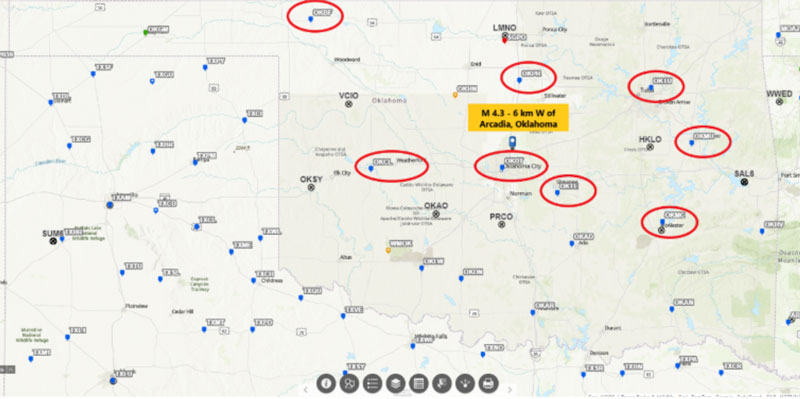
Something to note in the plots of Oklahoma is the large number of earthquakes around Oklahoma City during a 30-day period.
Plot of earthquakes north of Oklahoma City. (Image: USGS website)
Notice that there are several CORSs that surround the location of the earthquakes but only one CORS is close to the area. The box below shows a plot of CORS surrounding the area of earthquakes.
Demián’s latest paper describes their methodology for estimating coseismic displacements in areas with low-density continuous GNSS coverage by using geophysical models in a hybrid (dynamic-kinematic) mode. Since many earthquakes occur throughout the United States, it will be interesting to see how well this approach will work in the development of an Intra-Frame Deformation Model.
Earthquake M 4. 3 – 6 km W of Arcadia, Oklahoma. (Image: NGS website)
As previously stated, outside of California, most of these earthquakes have small magnitudes. That said, on August 9, 2020, a magnitude 5.1 earthquake occurred in Sparta, North Carolina. There were reports of damage to roads, water mains, and structures, but what were the effects on nearby published marks in the NSRS?
Widespread damage occurred in Sparta, which had already been debilitated by the COVID-19 pandemic in North Carolina. [23] Damages include collapsed ceilings, chimneys, and masonry; damaged water mains; cracked and deformed roads; uprooted headstones; and displaced appliances and items. [24][23][25] Wes Brinegar, the town’s mayor, issued a state of emergency to apply for FEMA and state financial aid. [25][23] Damage was worse than initially thought, with at least 525 structures being damaged, and 60 with major damage, meaning at least 40% of the structure was a total loss. Nineteen people lost their homes, 25 were declared uninhabitable, and scammers took advantage of the damage, charging people up to $500 USD for repairs, but never showing up.[26]
Governor of North Carolina, Roy Cooper, toured the damage in Sparta, releasing a statement later, stating “We’ve dealt with a hurricane, a violent tornado, and now an earthquake all in the middle of a pandemic: North Carolinians are resilient.”[27]
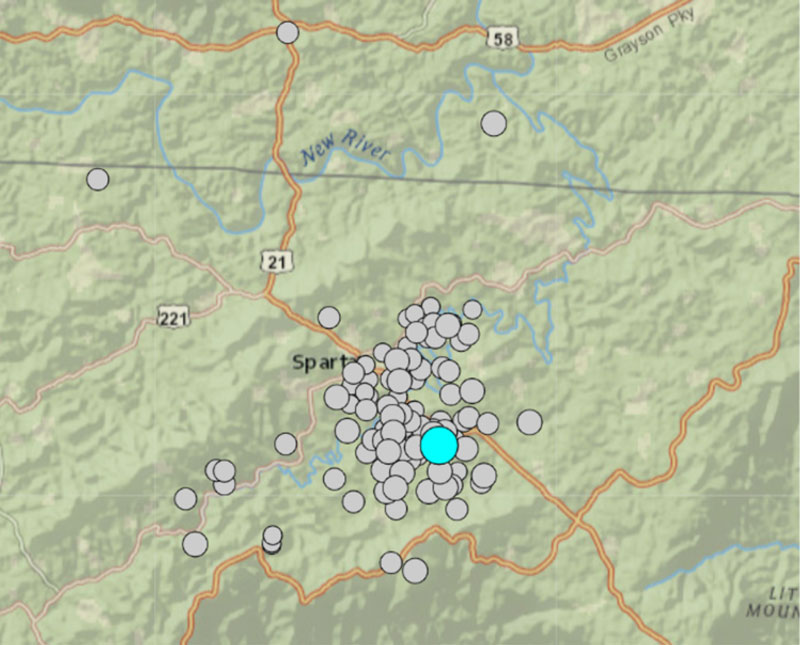
The box below shows the locations of earthquakes that occurred near Sparta, North Carolina. The plot indicates that there was not just one earthquake in the area, but many that may have affected the coordinates of monuments in the region.
Plot of earthquakes near Sparta, North Carolina. (Image: USGS website)
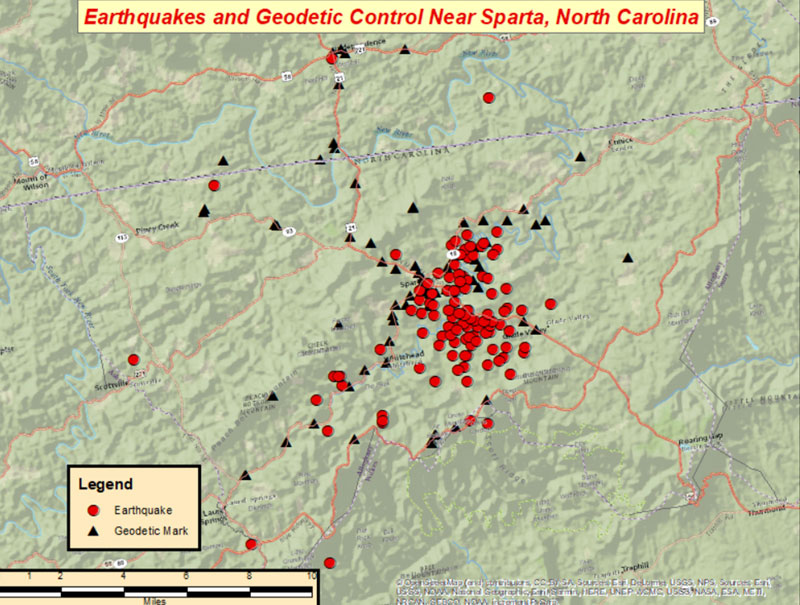
The image below shows the locations of earthquakes and NGS published geodetic marks in the Sparta region.
Image: Dave Zilkoski
Again, the real issue that needs to be addressed is what effect do these earthquakes and other geophysical activities such as subsidence have on the coordinates of geodetic marks in the region?
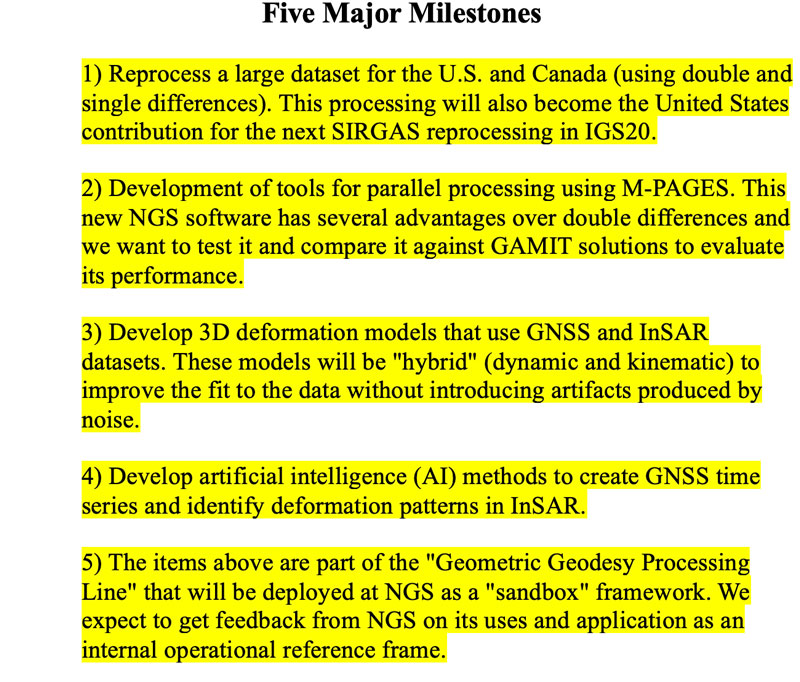
OSU’s grant proposal includes merging GNSS and InSAR using deep learning to better estimate the Intra-Frame Deformation Model. Obviously, developing time-dependent models for the new, modernized NSRS is very complex and technical. I contacted Demián and asked him for a list of his major milestones associated with his project.
Based on Demián’s major milestones, I had a few follow-up questions.
1) Reprocess a large dataset for the U.S. and Canada using double and single differences. This processing will also become the United States’ contribution for the next SIRGAS reprocessing in IGS20.
I asked Demián if he had an estimate of the amount of data he was talking about?
He told me that he did not have an exact number yet because they are still adding data. He said that, at this time, they have 878 stations in the US and Canada which amounts to 4,648,269 station days (i.e., 4. 6M RINEX files, just in the US and Canada). This is the latest number he retrieved from his database but this number increases every day (January 16, 2024).
2) Development of tools for parallel processing using M-PAGES. This new NGS software has several advantages over double differences and we want to test it and compare it against GAMIT solutions to evaluate its performance.
Demián stated that M-PAGES has several advantages so I asked him to explain what he meant.
He told me that one advantage is that it can process all constellations at once using single differences which allows processing of more stations simultaneously. Another advantage is because single differences produce “lighter” systems of equations (compared to double differences), they can process more stations simultaneously.
3) Develop 3D deformation models that use GNSS and InSAR datasets. These models will be “hybrid” (dynamic and kinematic) to improve the fit to the data without introducing artifacts produced by noise.
[Note: this approach is described in the paper titled “On the determination of coseismic deformation models to improve access to geodetic reference frame conventional epochs in low-density GNSS networks,” J Geod 97, 46 (2023).]
Demián said“they are in the process of collecting all the GNSS data that they can to process and then they will identify which gaps can be filled with InSAR data.”
I wanted to better understand what Demián meant by “hybrid” model. So, I asked him about his “hybrid” approach and he provided the following explanation:
When we say “kinematic” we refer to a model that does not consider the underlying mechanism to explain the observed effect. A good example are the trajectory models of GNSS stations that describe their motions as a sum of mathematical functions (there are no physics in them). A dynamic model does use the underlying physics to explain the observations. A “hybrid” model is in the middle: it uses a dynamic model but allows some unrealistic model parameters to improve the data fit.
I mentioned to Demián that users would be very interested in the spatiotemporal uncertainties of the intra-frame deformation model. I asked him if, at this time, he had any idea of the size or range of uncertainties.
Demián said “that it will be variable and very dependent on the density of the input data. He said that they are aiming for cm-level uncertainties. Our experience in Argentina tells us that a 5 mm uncertainty level can be achieved on stable regions while about 2 to 3 cm is expected on high deformation areas. We will have to wait and see to understand the model’s performance. ”
I told Demián that the Houston-Galveston, Texas region of the United States is an area of subsidence that would benefit with an accurate Intra-Frame Deformation Model. The Harris-Galveston Subsidence District has a variety of GNSS CORS and PAMS that are not part of NGS’s CORS. My April 2022 GPS World Newsletter, which included the HGSD CORS and PAMS, described the effects of vertical movement on NGS’s modernized 2022 NSRS. I also asked if he was willing to use this data
He had a very simple answer: “Absolutely!” He said “The more data we incorporate, the better the models will describe reality. Part of the project is related to providing a processing line that can handle large amounts of data. The issue with some data is metadata. Metadata and how we collect it is what really prevents us from reaching that “final mm” uncertainty level we are all looking for. We should be pushing very hard on metadata standardization. In my opinion, the biggest problem is twofold: 1) incorrect antenna identification in RINEX files (due to improper data curation) and 2) lack of a unified/globally accessible database of metadata that is adequately cured.”
4) Develop AI methods to create GNSS time series and identify deformation patterns in InSAR.
Part of the OSU project is to use ML to improve the development of the IFDM.
Excerpt from OSU Proposal on trajectory modeling
Trajectory modeling
For each station, we will obtain KTM parameters, including their uncertainties, for
stations velocities (and acceleration if needed), mechanical and/or geophysical jumps (earthquakes), logarithmic transients after earthquakes (following recommendations from Sobrero et al., 2020), and seasonal coordinate variations. Other parameters for stations affected by volcanic activity, episodic subsidence, etc will also be added when needed. We routinely generate these KTMs for thousands of GNSS stations (for the definition of our in-house geodetic RF) using software developed within the Division of Geodetic Science at OSU. Earthquake detection is performed automatically following formulations also developed by the project’s PIs.
Trajectory modeling enhancement using machine learning
We will enhance the capabilities of the KTMs by including a physics-based machine
learning (ML) component to the model that automatically detects, e. g., discontinuities in the time series. Detecting and mitigating the effects of mechanical jumps (those generated by unreported equipment changes and other effects) will increase the overall reliability of the GGPL. ML is well suited for this task and indeed ML algorithms like Random Forests have been explored in a recent work (e. g., Crocetti et al., 2021). We will test a similar approach, as well as more sophisticated convolutional neural networks to automatically detect discontinuities in coordinate trajectories. These ML algorithms will be trained on OSU’s database of trajectory models (~4000 stations). Using this ML algorithm we will also automatically detect other ‘harmful’ residuals in the time series. For example, large residuals can appear right after an earthquake if the postseismic transient does not have the appropriate relaxation time, or if two transients are needed to model the event.
I find AI and ML fascinating. Basically, machine learning is a field of study in artificial intelligence.
[As a side note: According to Wikipedia, Alan Turing, a mathematician, was the first person to conduct substantial research in the field that he called machine intelligence. Mr. Turing was considered the father of modern computer science. He was famous for his work in decoding the encryption of German Enigma machines during the second world war, and documenting a procedure, known as the Turing Test, that formed the basis for artificial intelligence. Turing was not directly involved with the successful breaking of these more complex codes, but his ideas proved of the greatest importance in this work.]
5) The items above are part of the “Geometric Geodesy Processing Line” that will be deployed at NGS as a “sandbox” framework. We expect to get feedback from NGS on its uses and application as an internal operational reference frame.
The fifth milestone includes developing what Demián calls a “Geometric Geodesy Processing Line (GGPL).” GGPL has three phases, but I am very interested in the first phase. The first phase will begin by analyzing the different components of the GGPL, including the interactions with various geospatial stakeholders, both within and outside of the United States. The plan includes developing a workflow that involves data curation, processing, and analysis to create an operational, fully kinematic reference frame (KRF) for CONUS and Canada. The KRF, once implemented, would at first constitute an experimental or ‘sandbox’ frame executed jointly with NGS’s Geosciences Research Division.
I asked Demián what plans he has for involving users. Especially, how is he going to include surveyors, engineers, photogrammetrists, and spatial data managers?
“My goal is to bring some of the lessons learned in Argentina when we implemented the kinematic reference frame in 2019,” Demián said. Back then, we had discussions with small groups of people in industry to know what their needs were. For example, surveyors will probably need to deal with epoch transformations in a different way than engineers or spatial data managers. The GGPL should facilitate the products that will help these stakeholders. In my experience, the issue is how the data (or model) is accessed so I do not foresee any major issues with users.”
He said that he is open to any suggestions others might have about this.
In phase two, OSU will augment the KRF with locally ‘dynamic’ densifications, which allow
the reference frame to be ‘interpolated’ to locations between the reference stations. Using advanced techniques, such as deep learning, complementary datasets, such as GNSS and InSAR, will be combined and assimilated leading to a kinematic/dynamic reference frame. During phase two, NGS would be assessing the utility and performance of the sandbox GGPL, while OSU works on its dynamic extensions.
In a third phase, the GGPL and the associated KRF and models would undergo any necessary modifications and adaptations, all guided by NGS. By the end of the proposed project, NGS will have a sandbox frame that can implement any new International Terrestrial Reference Frame (ITRF) in a manner that is completely transparent to NSRS users, including all associated models to operate continuously and without interruption.
This newsletter highlighted NGS’s grant to OSU for developing a fully kinematic reference frame for the Continental United States of America and Canada. The primary objectives of this project are to modernize geodetic tools and models and to develop a geodetic workforce for the future. The OSU project will include interactions with various geospatial stakeholders, both within and outside of the United States. In my opinion, it is very important to engage the geospatial user community when developing these new tools so the tools will be useful during the implementation of the new NSRS. A significant improvement in the new, modernized NSRS is the time-dependent component being incorporated in the computation of reference epoch coordinates (RECs). That said, developing models that accurately capture the time-dependent component is extremely important to providing reliable, consistent, and accurate RECs. The goal of the OSU project is to provide an accurate Intra-Frame Deformation Model which will provide reliable, consistent, and accurate reference epoch coordinates (RECs). Throughout the project, OSU would train M.S. and Ph.D. students, and postdocs, providing a source of trained new employees for governmental agencies as well as private industry. Future newsletters will address other NGS recipients of the NOAA FY 23 Geospatial Modeling Competition Awards.
In my last column, I highlighted the announcement made by the National Geodetic Survey (NGS) of the recipients of the NOAA FY 23 Geospatial Modeling Competition Awards. As shown in the image below, NGS awarded approximately $4 million in grant funding to four institutions for projects that will research emerging problems in the field of geodesy, develop tools and models to advance the modernization of the National Spatial Reference System (NSRS), and help address a nationwide deficiency of geodesists.
Image: NGS
I had the opportunity to speak with Juliana Blackwell, director of the NGS, about the geospatial awards. I asked her how the grants will help NGS in its development of products and services as well as the implementation of the modernized NSRS.
“The geospatial modeling grant is an opportunity to expand our abilities within NGS to address research challenges, diversify the tools we provide, and multiply our future workforce,” Blackwell said. “I’m excited about the competitive and collaborative nature of the grant and the chance for NGS to work with a variety of academic institutions.”
NGS awarded the grant funding to four institutions including Oregon State University, Scripps Institute of Oceanography, Michigan State University, and the Ohio State University. Looking at the summary of the awards, there appears to be some overlapping interest between grantees that could lead to a diverse set of solutions to a problem or task. I will report on specific tasks and outcomes as more details become available.
I was pleased to see that grant proposals included developing new geodetic tools and operating procedures for working with the new, modernized NSRS. Hopefully, these universities will engage the geospatial user community when developing new tools so the tools will be useful during the implementation of the new NSRS.
Summary of the Geospatial Awards (Image: NGS)
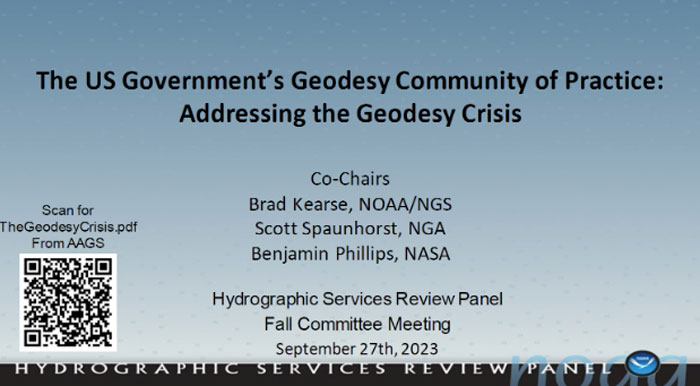
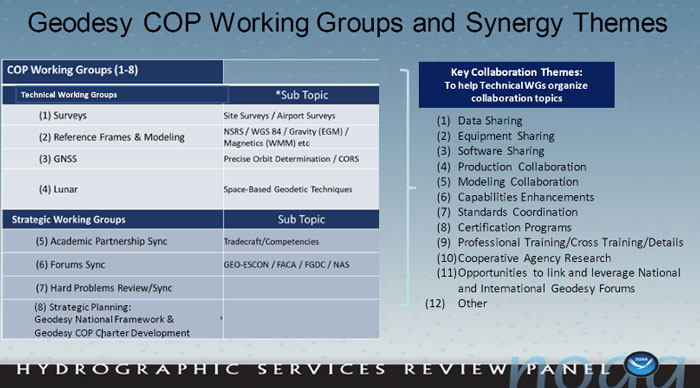
Besides providing funds for the geospatial grants, NGS is collaborating with other federal agencies to address the geodesy crisis. This collaboration, denoted as the “Geodesy Community of Practice (COP),” includes four agencies — NGS, National Geospatial-Intelligence Agency (NGA), National Aeronautics and Space Administration (NASA), and United States Geological Survey (USGS). The co-chairs of the group discussed the group’s actions and goals at the Hydrographic Services Review Panel (HSRP) fall committee meeting held in Silver Spring, Maryland, on Sept. 27-29.
Geodesy Community of Practice. (Image: NOAA’s Hydrographic Services Review Panel)
The HSRP involves four NOAA offices: three National Ocean Service (NOS) program offices -NGS, the Center for Operational Oceanographic Products and Services (CO-OPS), the Office of Coast Survey (CS), and the University of New Hampshire’s Joint Hydrographic Center and Center for Coastal and Ocean Mapping. More information and the presentations from the HSRP meeting can be obtained here. The purpose of the committee is to review and provide NOAA with independent advice on their products and services.
I attended the three-day HRSP meeting as a virtual participant. As previously noted, NGS is one of the NOS offices that’s part of the HSRP. As the Director of NGS, Blackwell participated in the 2023 fall HSRP meeting. A majority of the meeting discussed the geodesy crisis. In my opinion, this is due to Blackwell’s efforts to highlight the importance of geodesy to NOAA products and services.
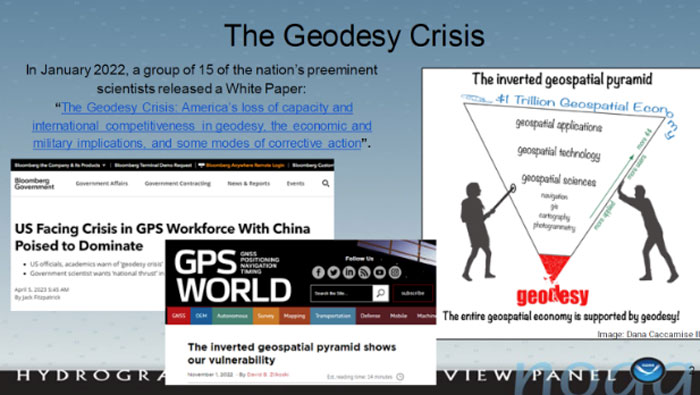
The presentation by the co-chairs of the Geodesy Community of Practice highlighted a few articles that have brought the geodesy crisis to the attention of the geospatial user community. Anyone keeping up with my columns knows that I have been highlighting the geodesy crisis and programs that advance the science of geodesy (July 2020, November 2022, December 2022, and April 2023). The geodesy crisis white paper is posted on the American Association for Geodetic Surveying (AAGS)website.
Image: NOAA’s Hydrographic Services Review Panel)
The Geodesy COP established working groups to address topics that are important to all geospatial users. All the agencies are supporting the working groups which should help create more effective and efficient solutions to technical geodetic issues.
Image: NOAA’s Hydrographic Services Review Panel
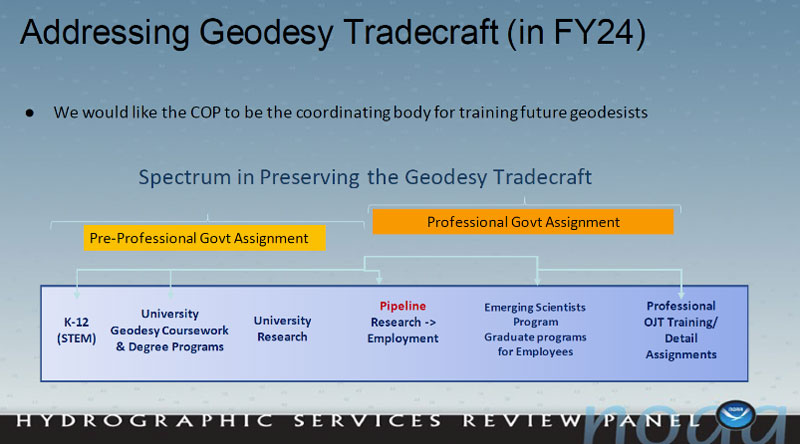
A goal of the Geodetic Community of Practice is to train future geodesists. The advancements in satellites and computers have enabled geodesy to expand into many different disciplines. Geodetic science and technology now underpin many sciences, large areas of engineering (such as driverless vehicles and UAVs), navigation, precision agriculture, smart cities, and location-based services.Major U.S. companies, such as Google and FedEx, as well as the automobile industry, precision farming companies and mining companies also need more accurate geodetic models, tools, and algorithms.Therefore, these companies also need trained geodesists to perform important research on topics that address their specific geodetic requirements.I highlighted this in my July 20, 2020, GPS World First Fix article.To address the geodesy tradecraft, the COP includes providing professional government assignments.That said, many industries that rely on accurate and consistent geodetic information should also provide professional geodetic assignments.
Training future geodesists. (Image: NOAA’s Hydrographic Services Review Panel)
I asked Blackwell how she thought the U.S. government’s Geodesy Community of Practice will help NGS and the geodesy crisis.
“The Geodesy Community of Practice is in the beginning phase right now with the collaboration among federal agencies with geodetic missions, NOAA/NGS, NGA, NASA, and USGS,” Blackwell said. “There is already a benefit in sharing research, workforce, and operational needs and leveraging our resources. I envision expanded engagement with academia, private industry, and other government agencies as the community of practice matures.”
In my opinion, the Geodesy Community of Practice’s integrated working groups consisting of individuals with different backgrounds and skills addressing geospatial problems will help to advance the field of geodesy. I believe that integrated and collaborative organizations create the best geospatial solutions; the Geodesy COP is an embodiment of this concept.
Of course, as I have stated in many of my columns, I like to remind everyone that “geodesy is the foundation for all geospatial products and services.”
“Seen & Heard” is a monthly feature of GPS World magazine, traveling the world to capture interesting and unusual news stories involving the GNSS/PNT industry.
Researchers at the University of Connecticut have conducted one of the largest understory species mapping projects using satellite data and have published the results of the study in the Remote Sensing of Environment journal. In this study, the researchers proposed an automated dense Sentinel-2 time series-based approach for understory plant communities and created maps of four understory classes that include native shrubs of greenbrier and mountain laurel, invasive shrubs of barberry, and the assemblage of mixed invasives at 10 m resolution in Connecticut’s deciduous forests. The researchers developed a strategy that distinguished plant species with an accuracy of 93% and determined that 53% of Connecticut’s understory is now comprised of invasive plant species such as barberry, bittersweet, winged euonymus (burning bush), and multi-flora rose.
Invasive Species VS. UAVs
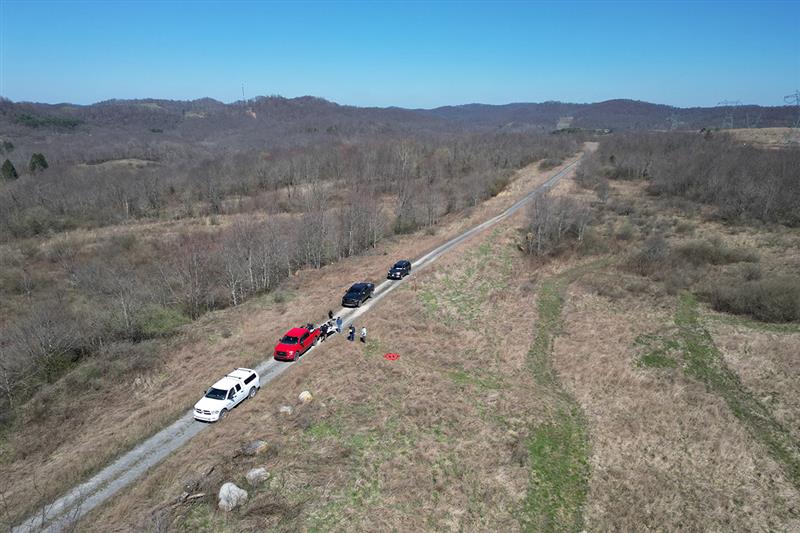
Image: Donn Bartram
Researchers at West Virginia University are using UAVs to develop tools to detect, map, treat and monitor invasive plant species with a grant from the Richard King Mellon Foundation. Multiflora rose is an invasive shrub that threatens native plants in more than 40 states, including West Virginia and Pennsylvania. This project aims to equip UAVs with sensors to collect environmental data in a designated area of southwestern Pennsylvania over multiple seasons. The research team will use that data, combined with machine learning technology, to develop software that can identify multiflora rose and, eventually, other invasive species.
Protecting Farms with GIS
Image: Daniel Balakov/E+/Getty Images
American Farmland Trust (AFT) is partnering with government agencies and advocacy groups in South Carolina to deploy GIS mapping tools to predict areas at the highest risk of development in the state. Palmetto 2040: Visioning Alternative Futures, Launching Solutions is a geospatial modeling and policy analysis tool designed to identify and model future outcomes. This mapping tool will project what land in South Carolina is at highest risk of development by 2040. The analysis will consider both rapid population growth and climate change impact on settlement patterns and agriculture, according to AFT.
USV Take Hurricanes
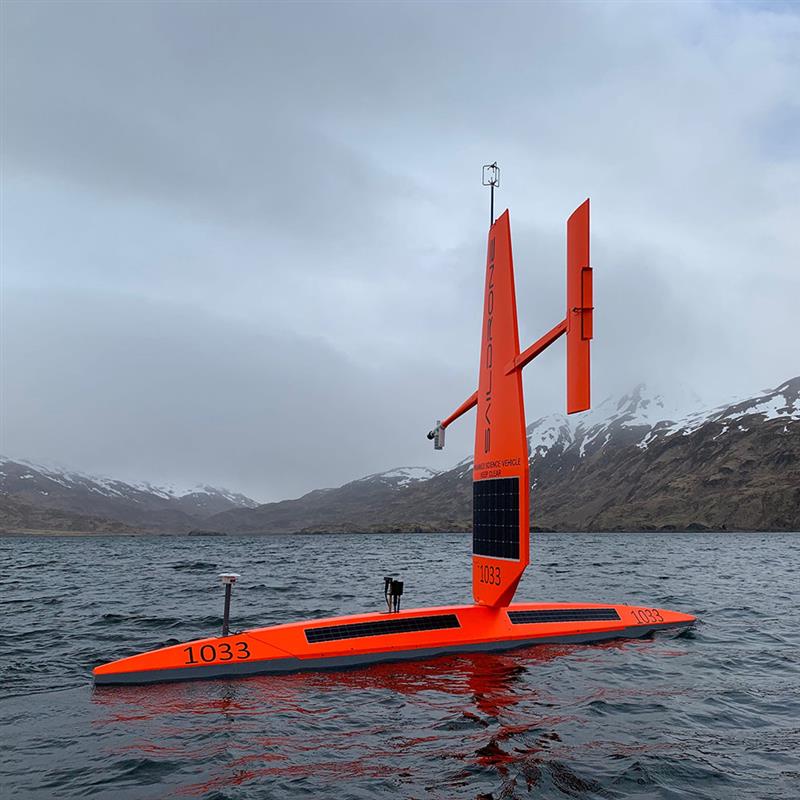
Image: SailDrone
Saildrone is deploying 12 uncrewed surface vehicles (USV) into the tropical Atlantic and Gulf of Mexico this summer, supporting research by the National Oceanic and Atmospheric Administration (NOAA) to advance hurricane forecasting. Ten USVs will be deployed from St. Thomas, U.S. Virgin Islands; St. Petersburg, Florida; and Charleston, South Carolina; to operate in areas with a high probability of intercepting a storm, as indicated by historical data. Two vehicles will remain on land, ready for quick deployment in the event of an approaching hurricane. NOAA will use the data collected by the USVs to improve hurricane forecast models.
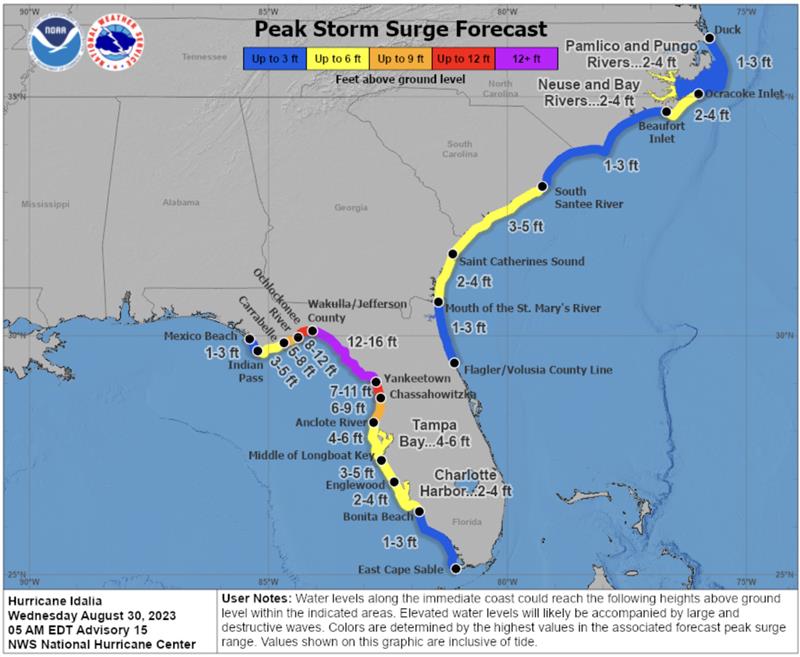
According to the U.S. National Hurricane Center (NHC), Hurricane Idalia made landfall along the Gulf Coast of Florida around 7:45 a.m. EDT on August 30 as a Category 3 hurricane. The NHC is continuing to map the storm’s path, and as of 9:00 a.m. EDT, a catastrophic storm surge was occurring with damaging winds spreading inland over Northern Florida.
Idalia is expected to bring excessive rainfall along its path from Florida through the Carolinas. The heavy rain could shift depending on the storm’s exact path.
Peak storm surge forecast in Florida. (Image: National Hurricane Center)
This hurricane and future storms this hurricane season, have the potential to become supercharged as sea surface temperatures have clocked record high temperatures.
Idalia is the ninth named storm to form in the Atlantic in 2023.
In late May, the National Oceanic and Atmospheric Administration (NOAA) predicted that there would be 12 to 17 named storms this year. However, on Aug. 10, NOAA revised its estimate to 14 to 21 storms.
There were 14 named storms last year, after two extremely busy Atlantic hurricane seasons in which forecasters ran out of names and had to resort to backup lists, reported The New York Times.
Readers can stay updated with Hurricane Idalia at the NHC website.
PlantiQ — an atmospheric observing systems company — will begin daily delivery of its signal to noise ratio GNSS-radio occultation (RO) data to the National Oceanic Atmospheric Administration (NOAA) under the NOAA’s IDIQ-2 operational Delivery Order-2.
The NOAA has allocated $59.6 million over the next five years to use commercial satellite data to achieve high-quality weather forecasting and atmospheric research.
“By incorporating PlanetiQ’s commercial high quality GNSS-RO data, coupled with our deep understanding of RO technology, NOAA will have the information to significantly improve short and medium-range weather forecasts, and provide essential insights to enhance climate change research for the government, military and the private sector,” Ira Scharf, PlanetiQ CEO, said.
PlanetiQ supplies GNSS-RO data to NOAA from its growing constellation of satellites, which has become a critical part of the global observing system.
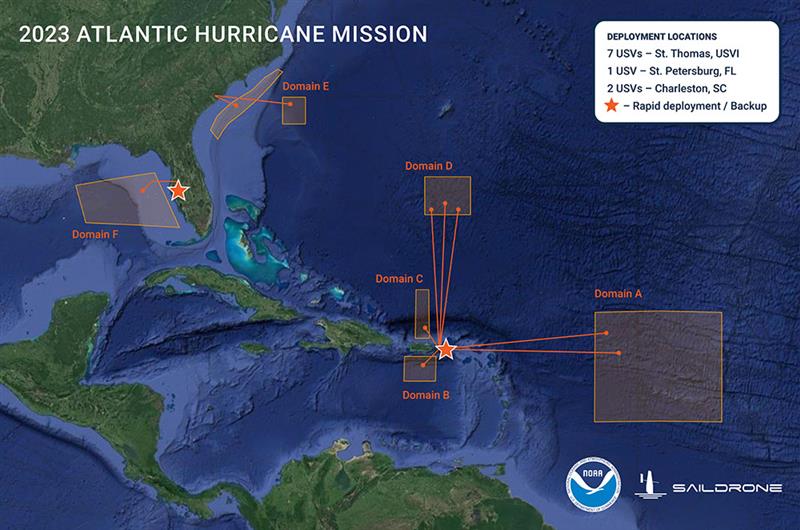
Graphic showing the USV domain areas during the 2023 Atlantic Hurricane mission. (Image: SailDrone)
Saildrone — a data solutions company for maritime security, ocean mapping, and ocean data — is deploying 12 uncrewed surface vehicles (USV) into the tropical Atlantic and Gulf of Mexico this summer, supporting the research by the National Oceanic and Atmospheric Administration (NOAA) to advance hurricane forecasting.
Saildrone is deploying 10 USVs from St. Thomas, U.S. Virgin Islands, St. Petersburg, FL, and Charleston, SC, to operate in areas with a high probability of intercepting a storm, as indicated by historical data. Two vehicles will remain on land, ready for quick deployment in the event of an approaching hurricane.
Image: SailDrone
A Saildrone Explorer is a 23-ft USV propelled by the wind and powered by solar energy. During the past two missions in 2021 and 2022, Saildrone vehicles sailed through several storms and major hurricanes, including Hurricane Sam in 2021, and Hurricane Fiona in 2022.
In addition to the Saildrone Explorers, NOAA is using a variety of aerial, surface, and sub-surface technologies, — including its Hurricane Hunter airplanes, small, uncrewed aircraft systems, gliders, drifters and floats.
The goal is to create a complete picture of the ocean-atmosphere interactions that drive hurricanes.
The USVs will transmit data, including air temperature and relative humidity, barometric pressure, wind speed and direction, water temperature and salinity, sea surface temperature, and wave height and period in near real time to scientists at NOAA’s Atlantic Oceanographic and Meteorological Laboratory and Pacific Marine Environmental Laboratory, Saildrone’s science partners for the mission.
NOAA will use the data collected by the USVs to improve hurricane forecast models. The data will also be archived by NOAA’s National Environmental Satellite, Data and Information Service and sent by NOAA to the World Meteorological Organization’s Global Telecommunication System, where it is available for the world’s major forecast centers — some 20 agencies worldwide, including NOAA.
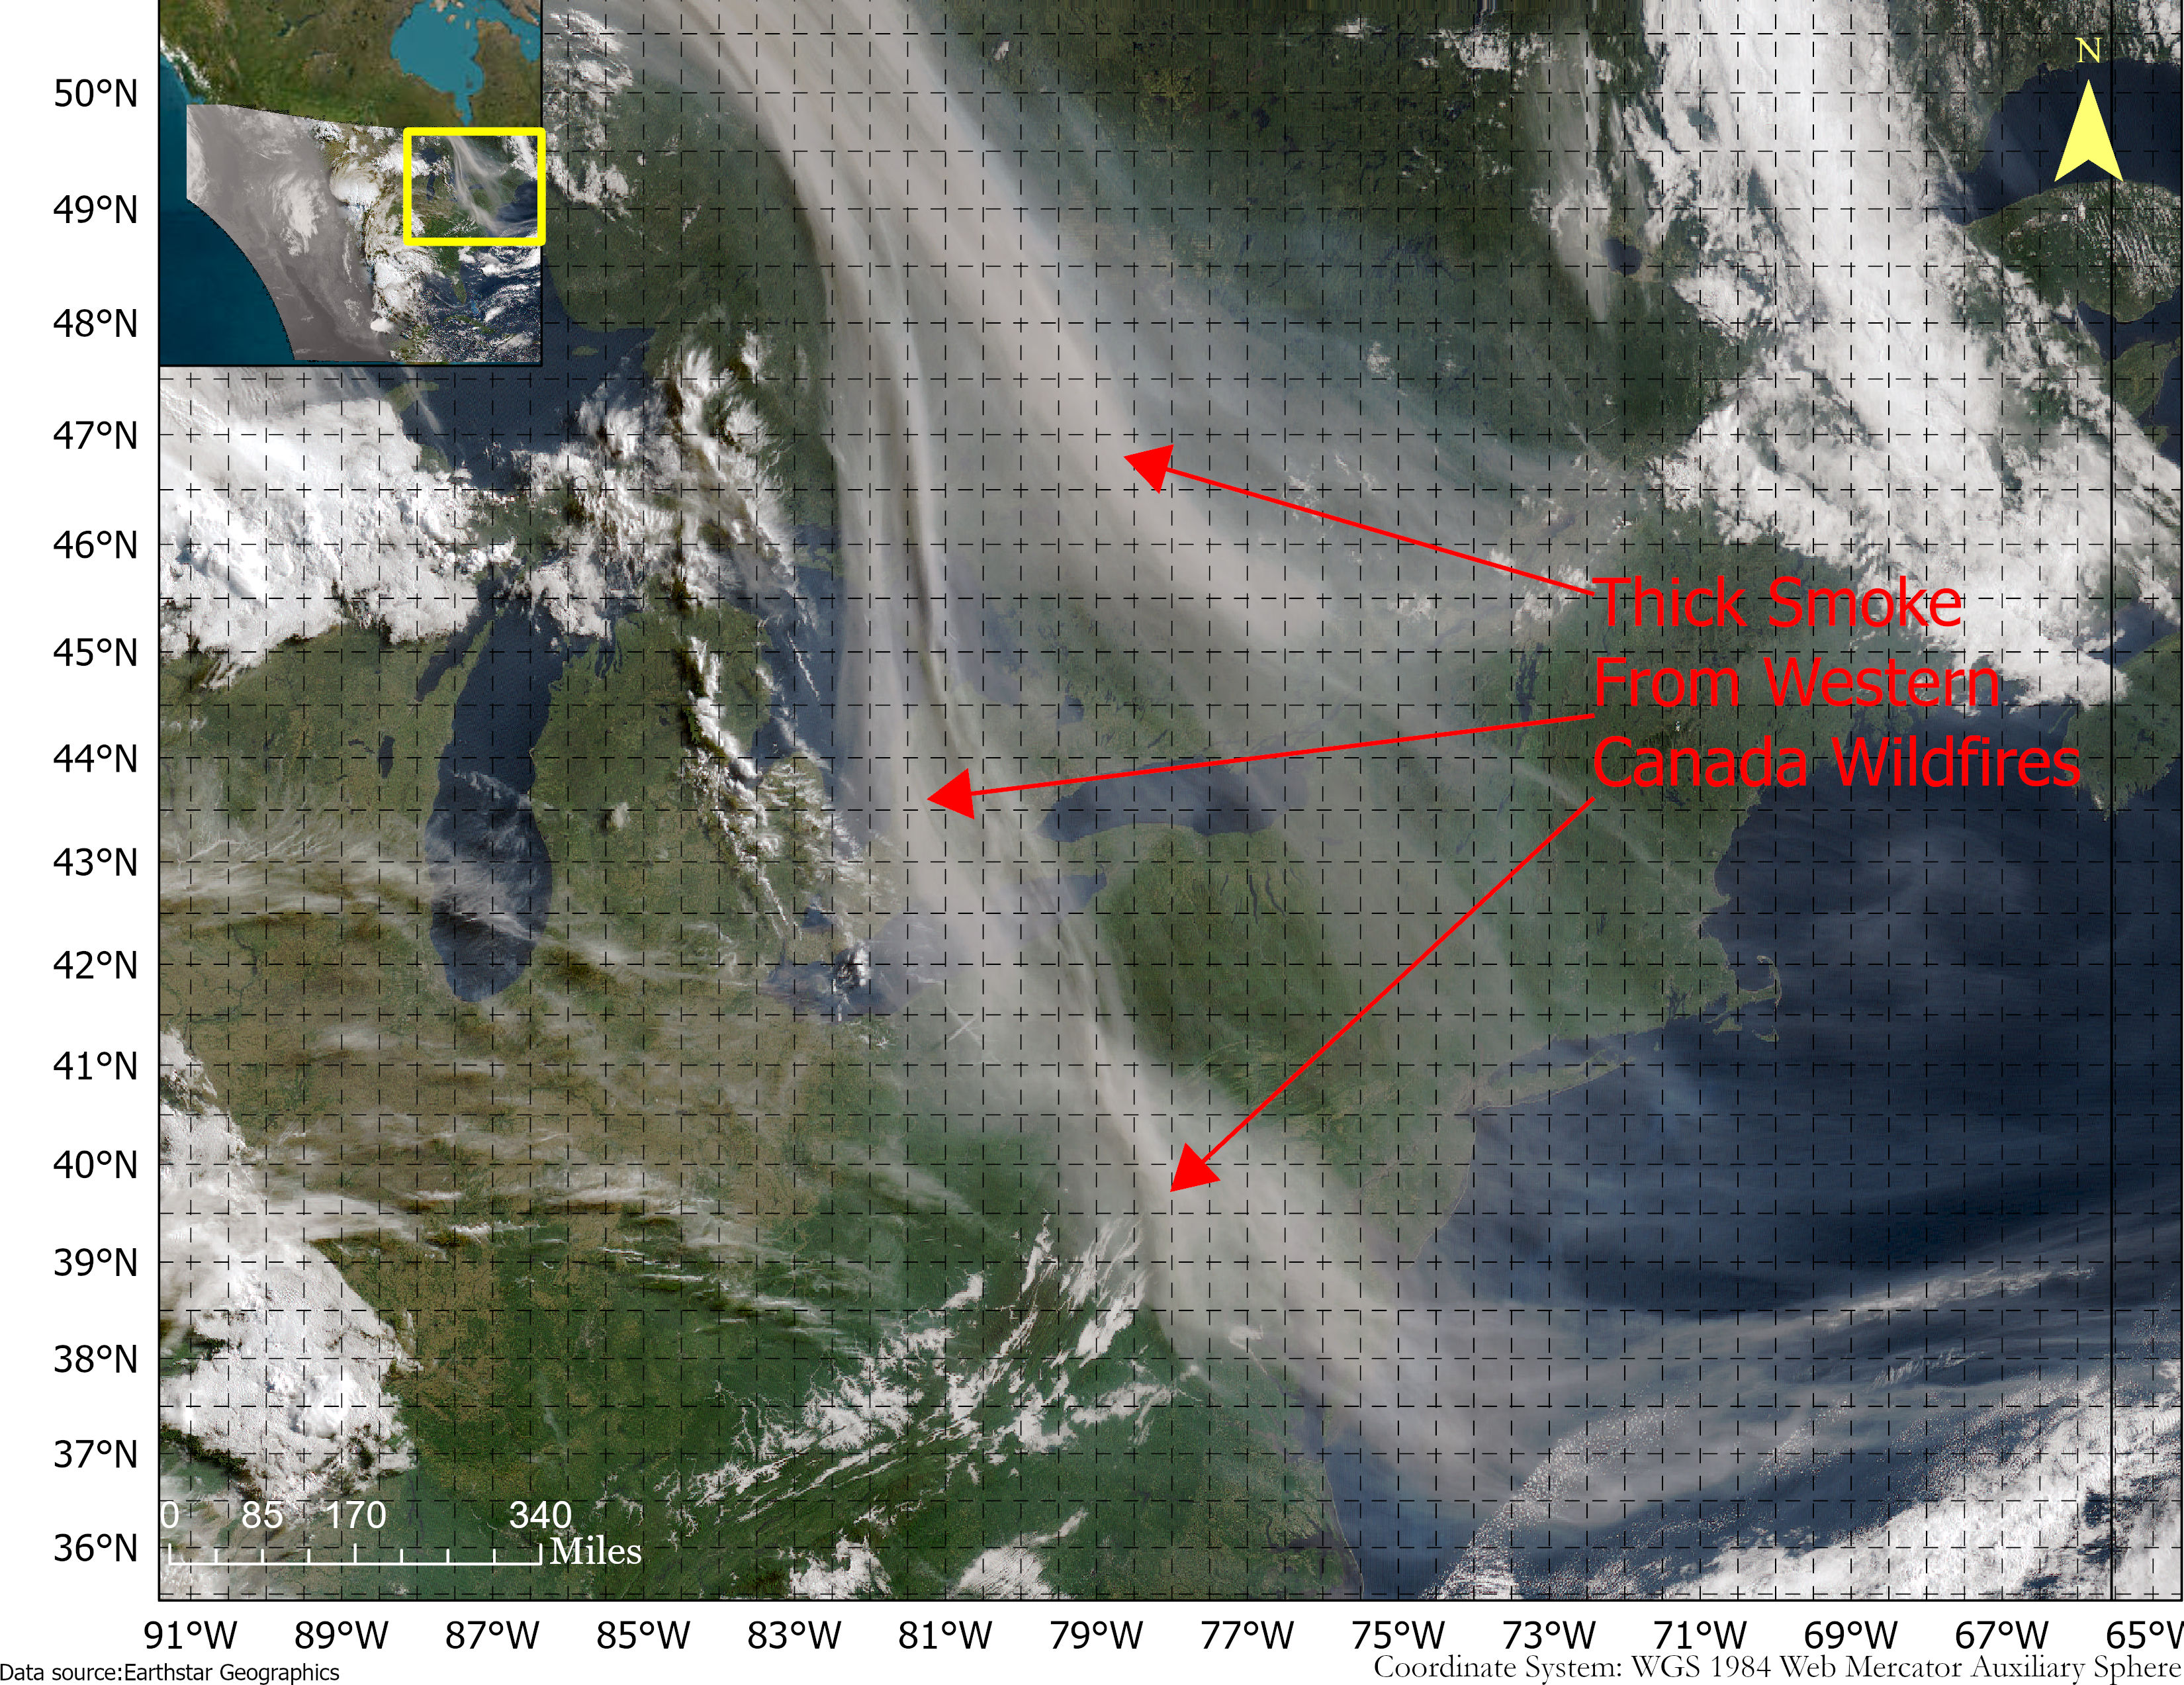
Smoke from the Canadian wildfires continues to pollute the air across the United States, mainly affecting cities in the northeast, including Pittsburgh, Chicago, Cleveland, Detroit and Buffalo.
According to the New York Times, in early June, the level of particulate matter in the air from smoke became so unhealthy that many U.S. cities set records. Visibility decreased in many cities as well, with the smoke creating an orange haze.
Most of the smoke can be attributed to several fires burning across Canada. Many of these fires were caused by lightning; however, with above-average temperatures and dry conditions, wildfires have been breaking out since May.
A storm system off the coast of Nova Scotia forced smoke from the fires southeast into the United States. (Image: NOAA)
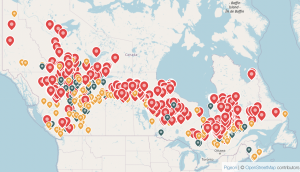
Based on data from the Canadian Interagency Forest Fire Centre, there are 480 active fires in Canada: 252 are out of control, 77 are being held in place, and 151 are under control.
The fires are mapped in the image below.
The red dots represent the out-of-control fires, the green dots are fires being held in place, and the yellow dots are fires that are under control. (Image: Screenshot of CIFFC wildfire map)
Understanding air quality importance
The Air Quality Index (AQI) measures the density of five pollutants: ground-level ozone, particulates, carbon monoxide, nitrogen dioxide, and sulfur dioxide. It was originally established by the Environmental Protection Agency to communicate the cleanliness of the air Americans are breathing every day.
The index runs from zero to 500 — the higher the number the more polluted the air is.
Effects of air pollution can range from mild symptoms, such as eye and throat irritation, to serious ones such as heart and respiratory issues. Pollution can cause inflammation of the lung tissue and increase the vulnerability to infections.
During wildfires, fine particles in the soot, ash and dust can fill the air.
The AQI identifies the concentration of particles smaller in diameter than 2.5 μM. When these particles are inhaled, the tiny specks can increase the risk of heart attacks, cancer, and respiratory infections — especially in children and older adults.
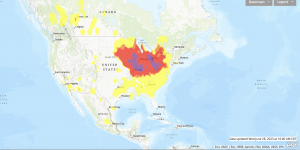
Below is an updated map of air quality from the U.S. AQI as of June 28.
The colors on the map range from yellow — which is unhealthy air quality — to purple, meaning the air quality is hazardous. (Image: AirNow.gov)
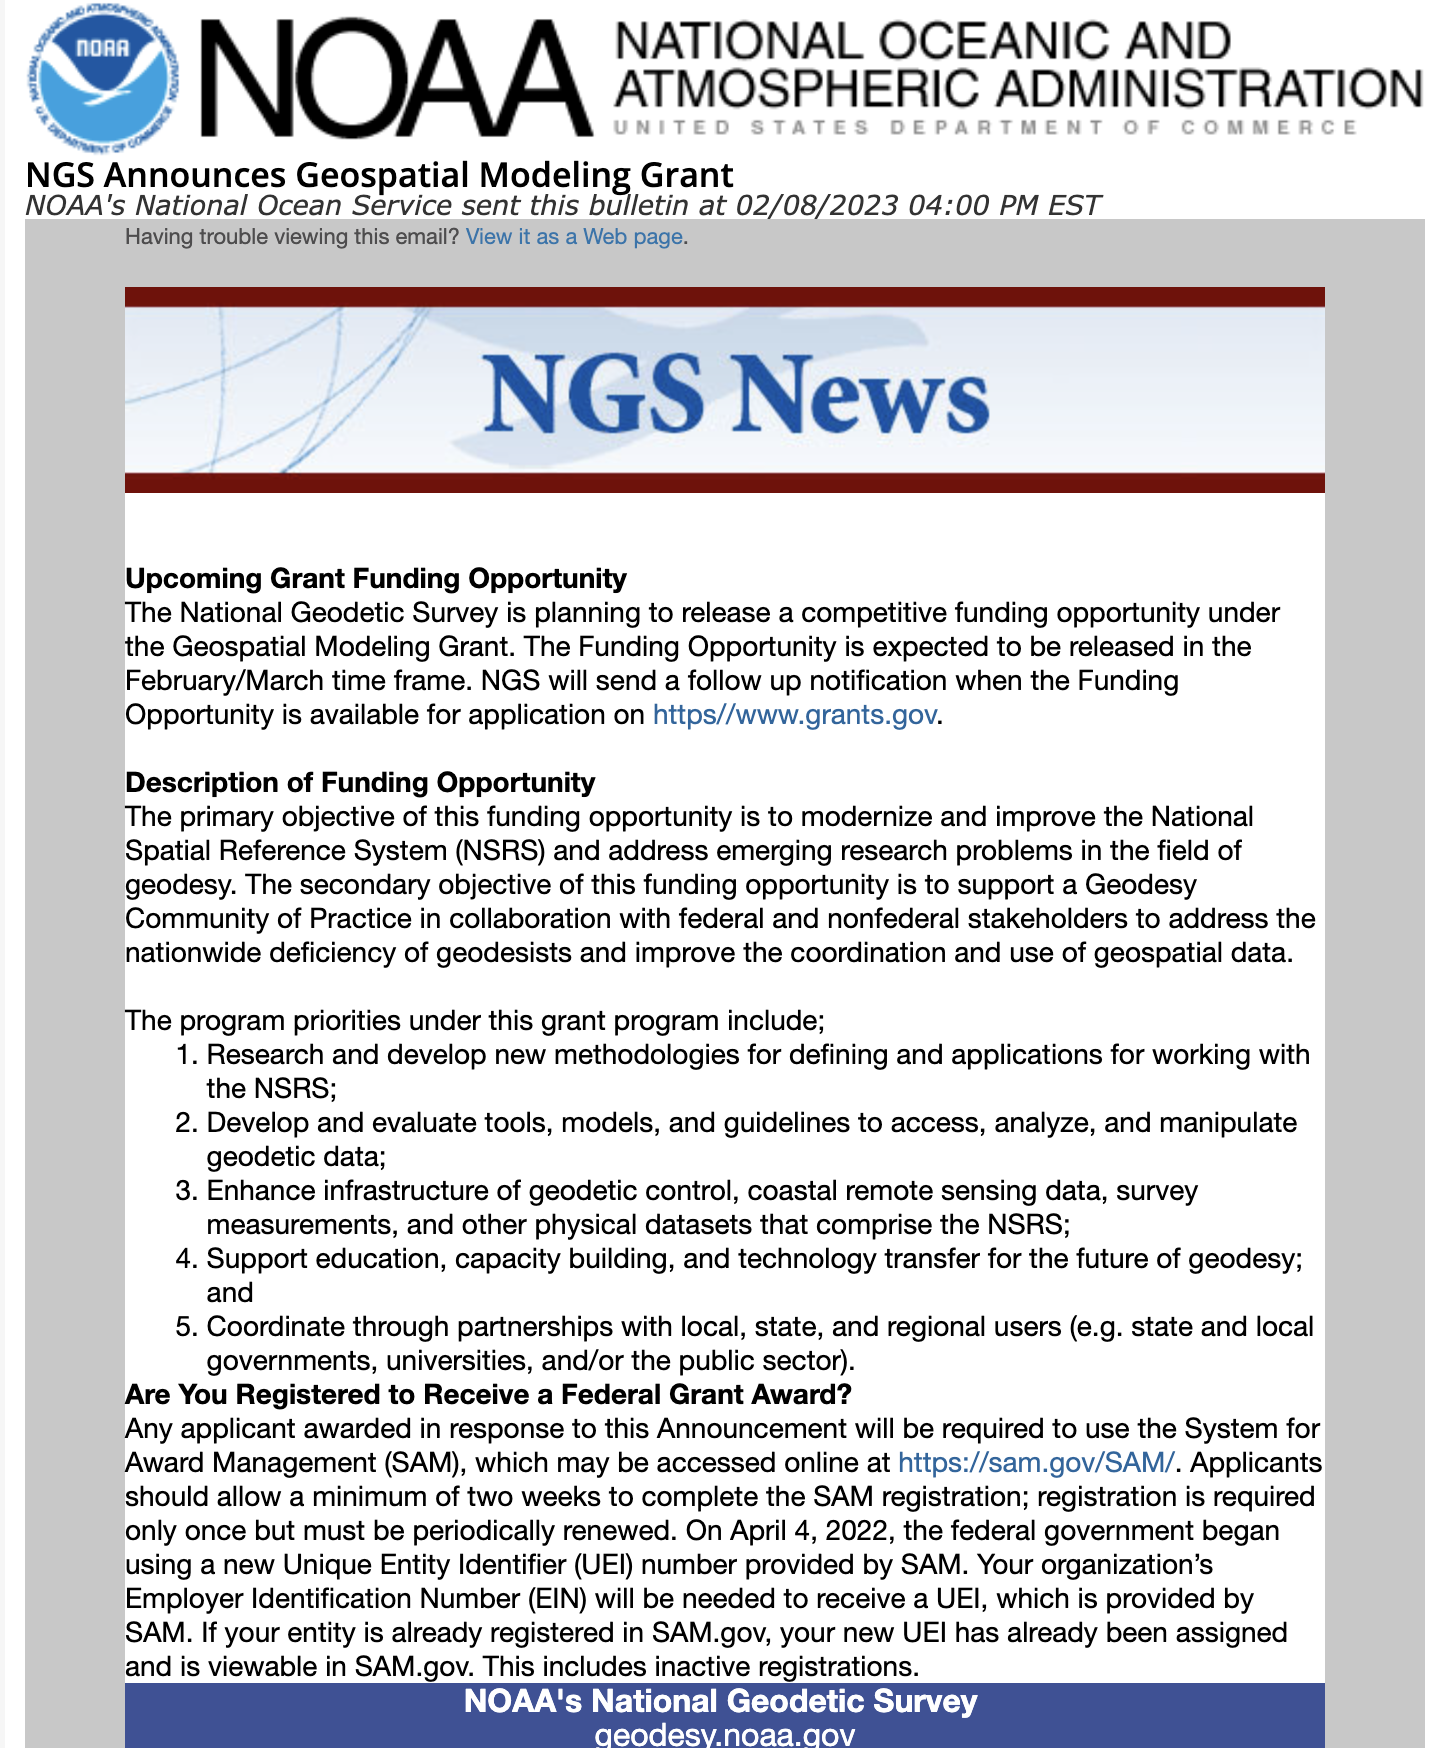
On March 20, 2023, I wrote a short announcement about a funding opportunity by the National Geodetic Survey (NGS) to support the science of geodesy.
As mentioned in previous columns, Everett Hinkley wrote about the geodesy crisis in an ION article. Hinkley’s article summarized several action items that could help improve the lack of trained geodesists in the United States. One action was to encourage U.S. government support in the form of grants, professional development of staff, and research collaborations/affiliations. A pilot PhD geodesy educational program with three National Geospatial-Intelligence Agency (NGA) and one NGS employee is in place. He stated that the NGA expects to continue growing this program. Click here for more information on NGA’s academic research program.
NGS’ geospatial modeling grant is another example of this action item. There needs to be more funds added to this task, but it is a start. The program priorities under NGS’ grant program include: research and develop new methodologies for defining and applications for working with the NSRS; develop and evaluate tools, models, and guidelines to access, analyze, and manipulate geodetic data; enhance infrastructure of geodetic control, coastal remote sensing data, survey measurements, and other physical datasets that comprise the NSRS; support education, capacity building, and technology transfer for the future of geodesy; coordinate through partnerships with local, state, and regional users such as state and local governments, universities, and/or the public sector.
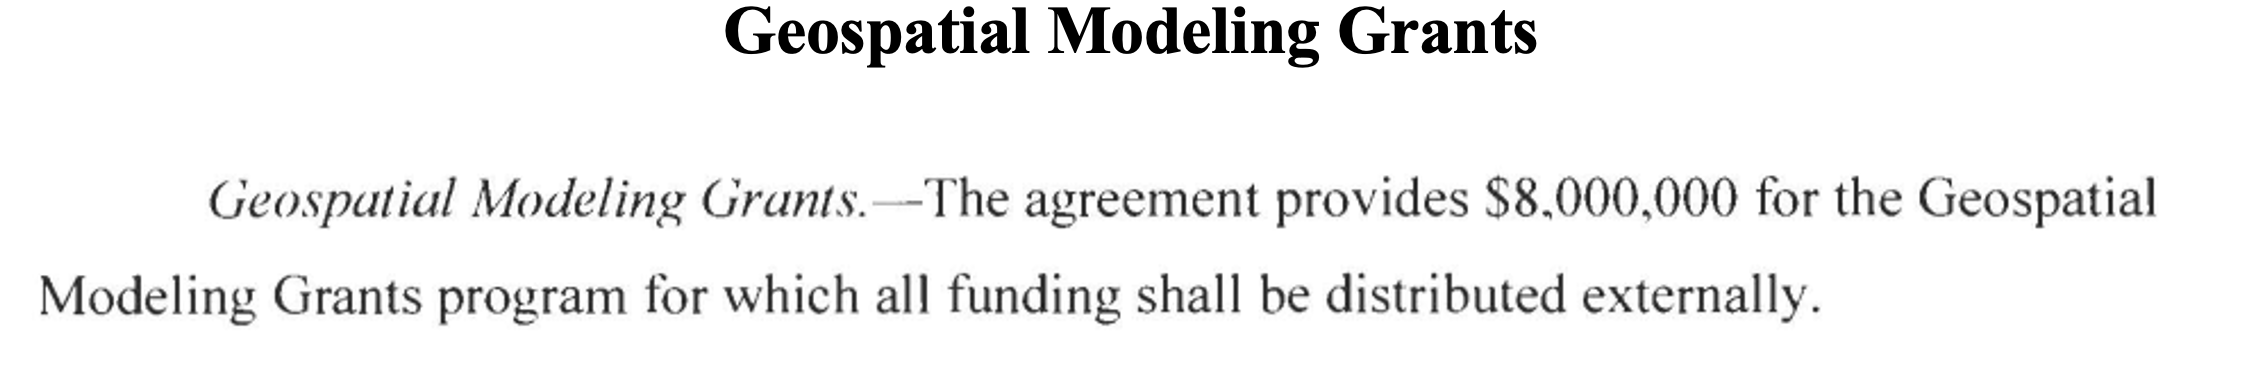
The geospatial modeling grant was included in the 2023 Omnibus Appropriations Bill. The agreement provides $8,000,000 for the program and states that all funding shall be distributed externally. Hopefully, the same amount or more will be in FY 24 appropriations. Additional information about NOAA’s appropriations can be found in the 2023 Omnibus Appropriation Bill under the explanatory statement for Commerce, Justice, Science and related agencies. The bill can be found here. To find the language in the bill click here, then search the document for “geospatial.” See the image below for the language in the bill.
Image: Senate.gov website
For those that are interested in the appropriation process, the image below provides a list of the senators that work on these agencies’ appropriations. If you are interested in learning more about the appropriation process and the geospatial modeling grants, contact your senator. The more congressional representatives know about the geodesy crisis — which includes the lack of trained geodesist as well as surveyors — the sooner they will support funds to help correct the problem. Click here for a list of senators on the Commerce, Justice, Science and Related Agencies Appropriation Committee.
Advancing geodesy with conferences
Another activity that promotes the advancement of geodesy and surveying are national and international surveying and mapping conferences. Before the American Congress on Surveying and Mapping (ACSM) disbanded, the four-member organization collaborated to convene annual surveying and mapping conferences in the United States. Topics like those presented at a FIG Working Week were presented at these conferences.
Since these ACSM conferences are no longer being held, I encourage users of geospatial data and GNSS technology to attend conferences like FIG Working Week 2023. I have participated in several FIG meetings and learned a lot from presentations as well as holding hallway meetings with experts from the international surveying and mapping community. In the March column, I highlighted that FIG Working Week 2023 is going to be held in Orlando, Florida, on May 28 – June 1. NGS will be presenting a full-day worth of content on NSRS modernization during the conference. I want to highlight some presentations that may be of interest to readers. Register for FIG Working Week 2023 here.
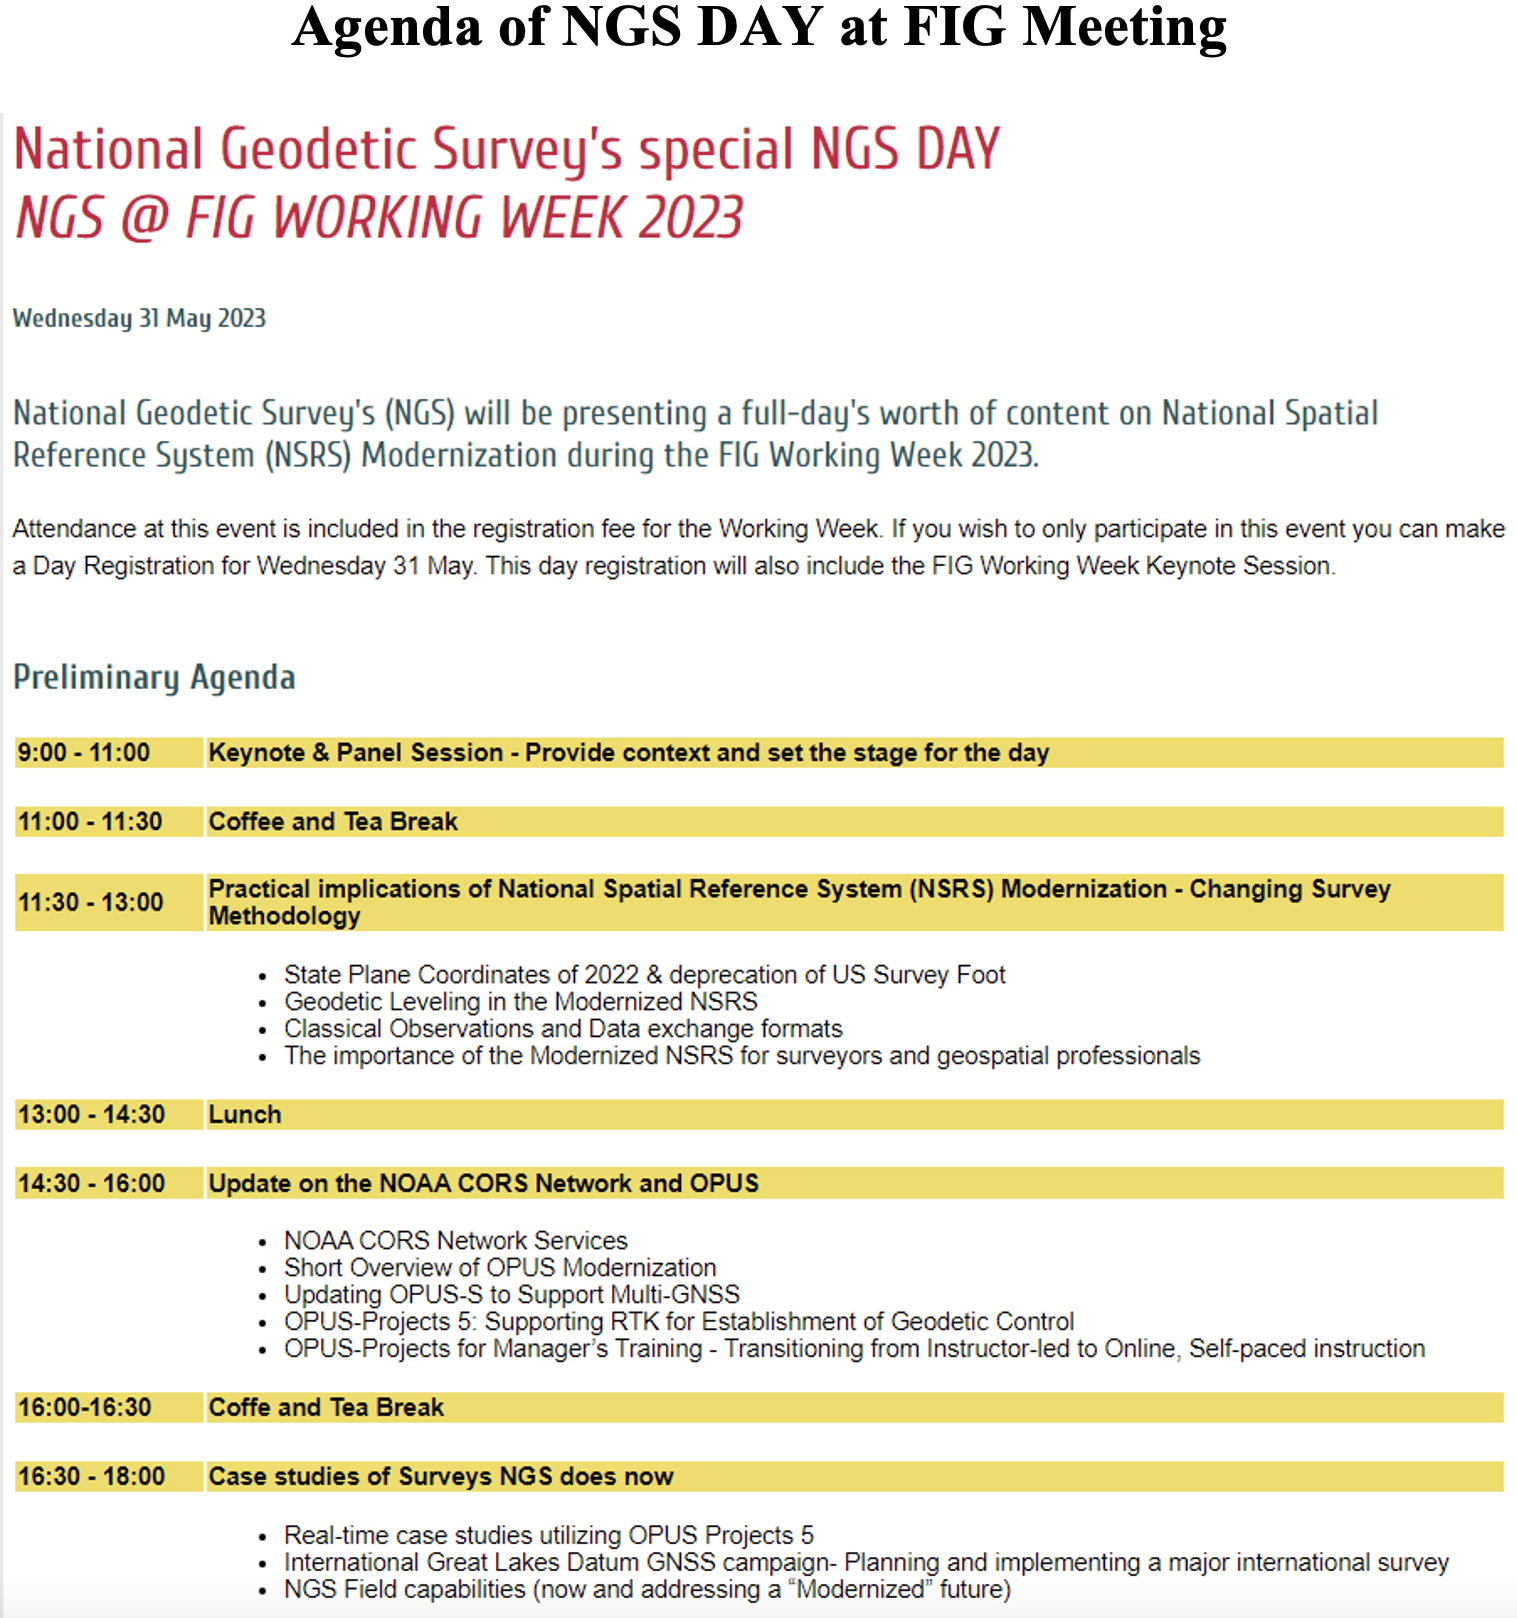
The image below provides a list of NGS presentations with scheduled times. There will be a panel session in the beginning of the day to set the context for the day.
Agenda of NGS DAY at FIG Meeting (Image: FIG website)
As in most conferences there are several ways participants can register, one day to the entire conference. This is a great opportunity to have discussions with the leadership of the National Geodetic Survey and individuals working on the development of the new, modernized NSRS.
Image: FIG website
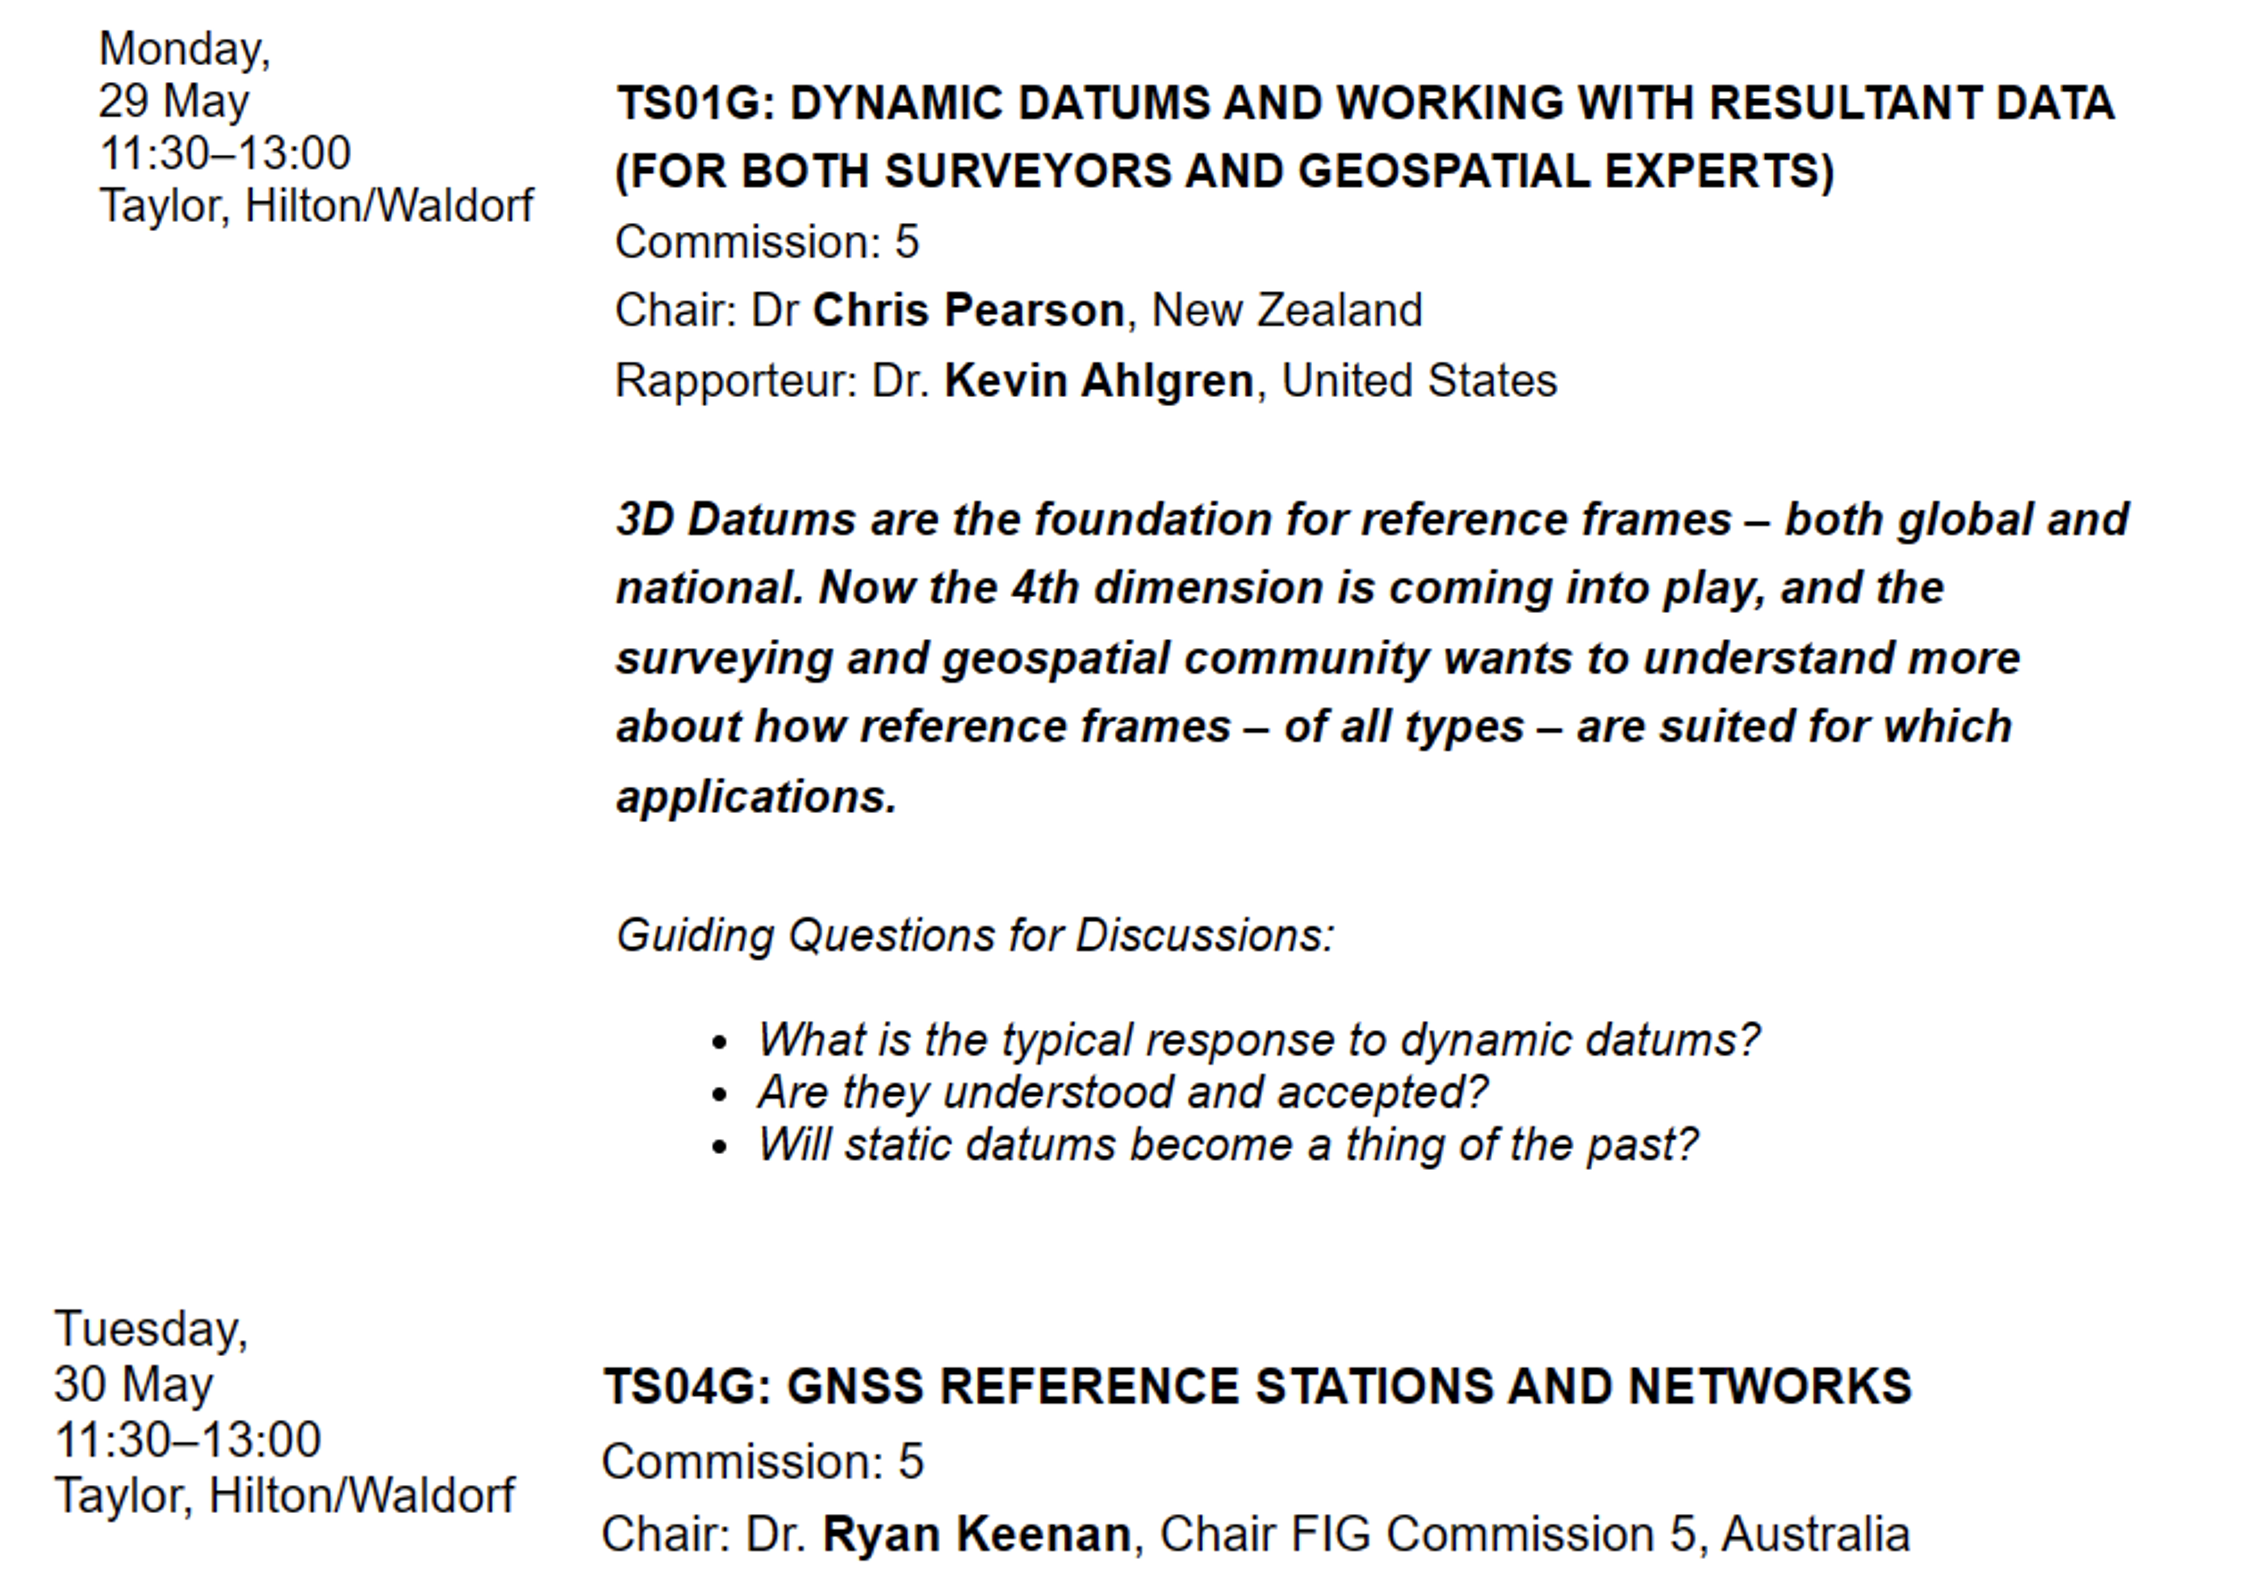
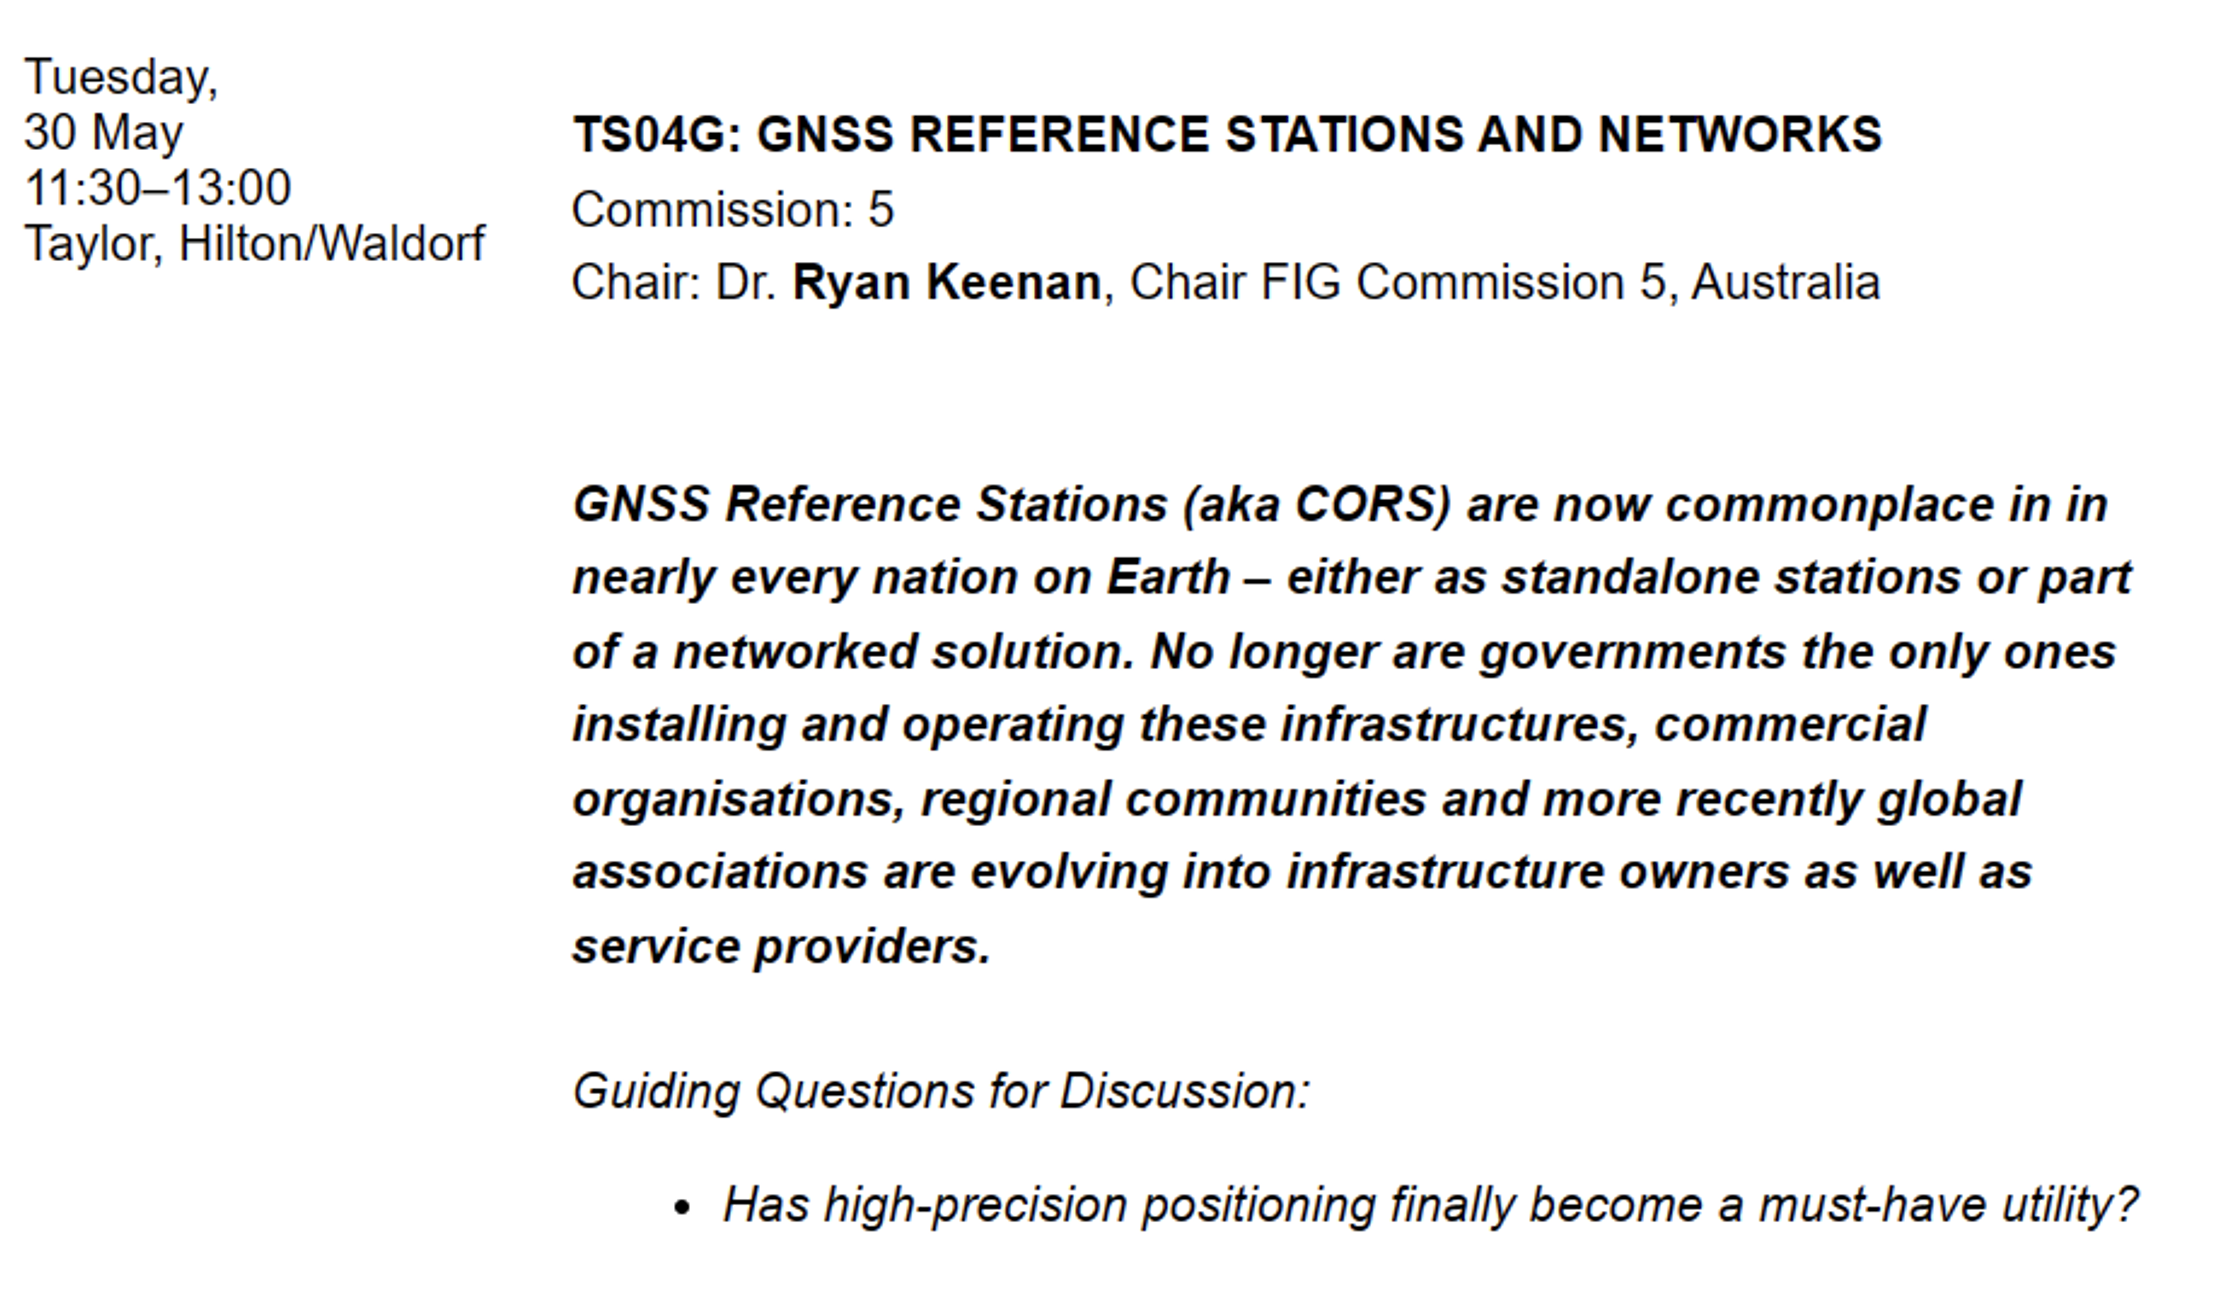
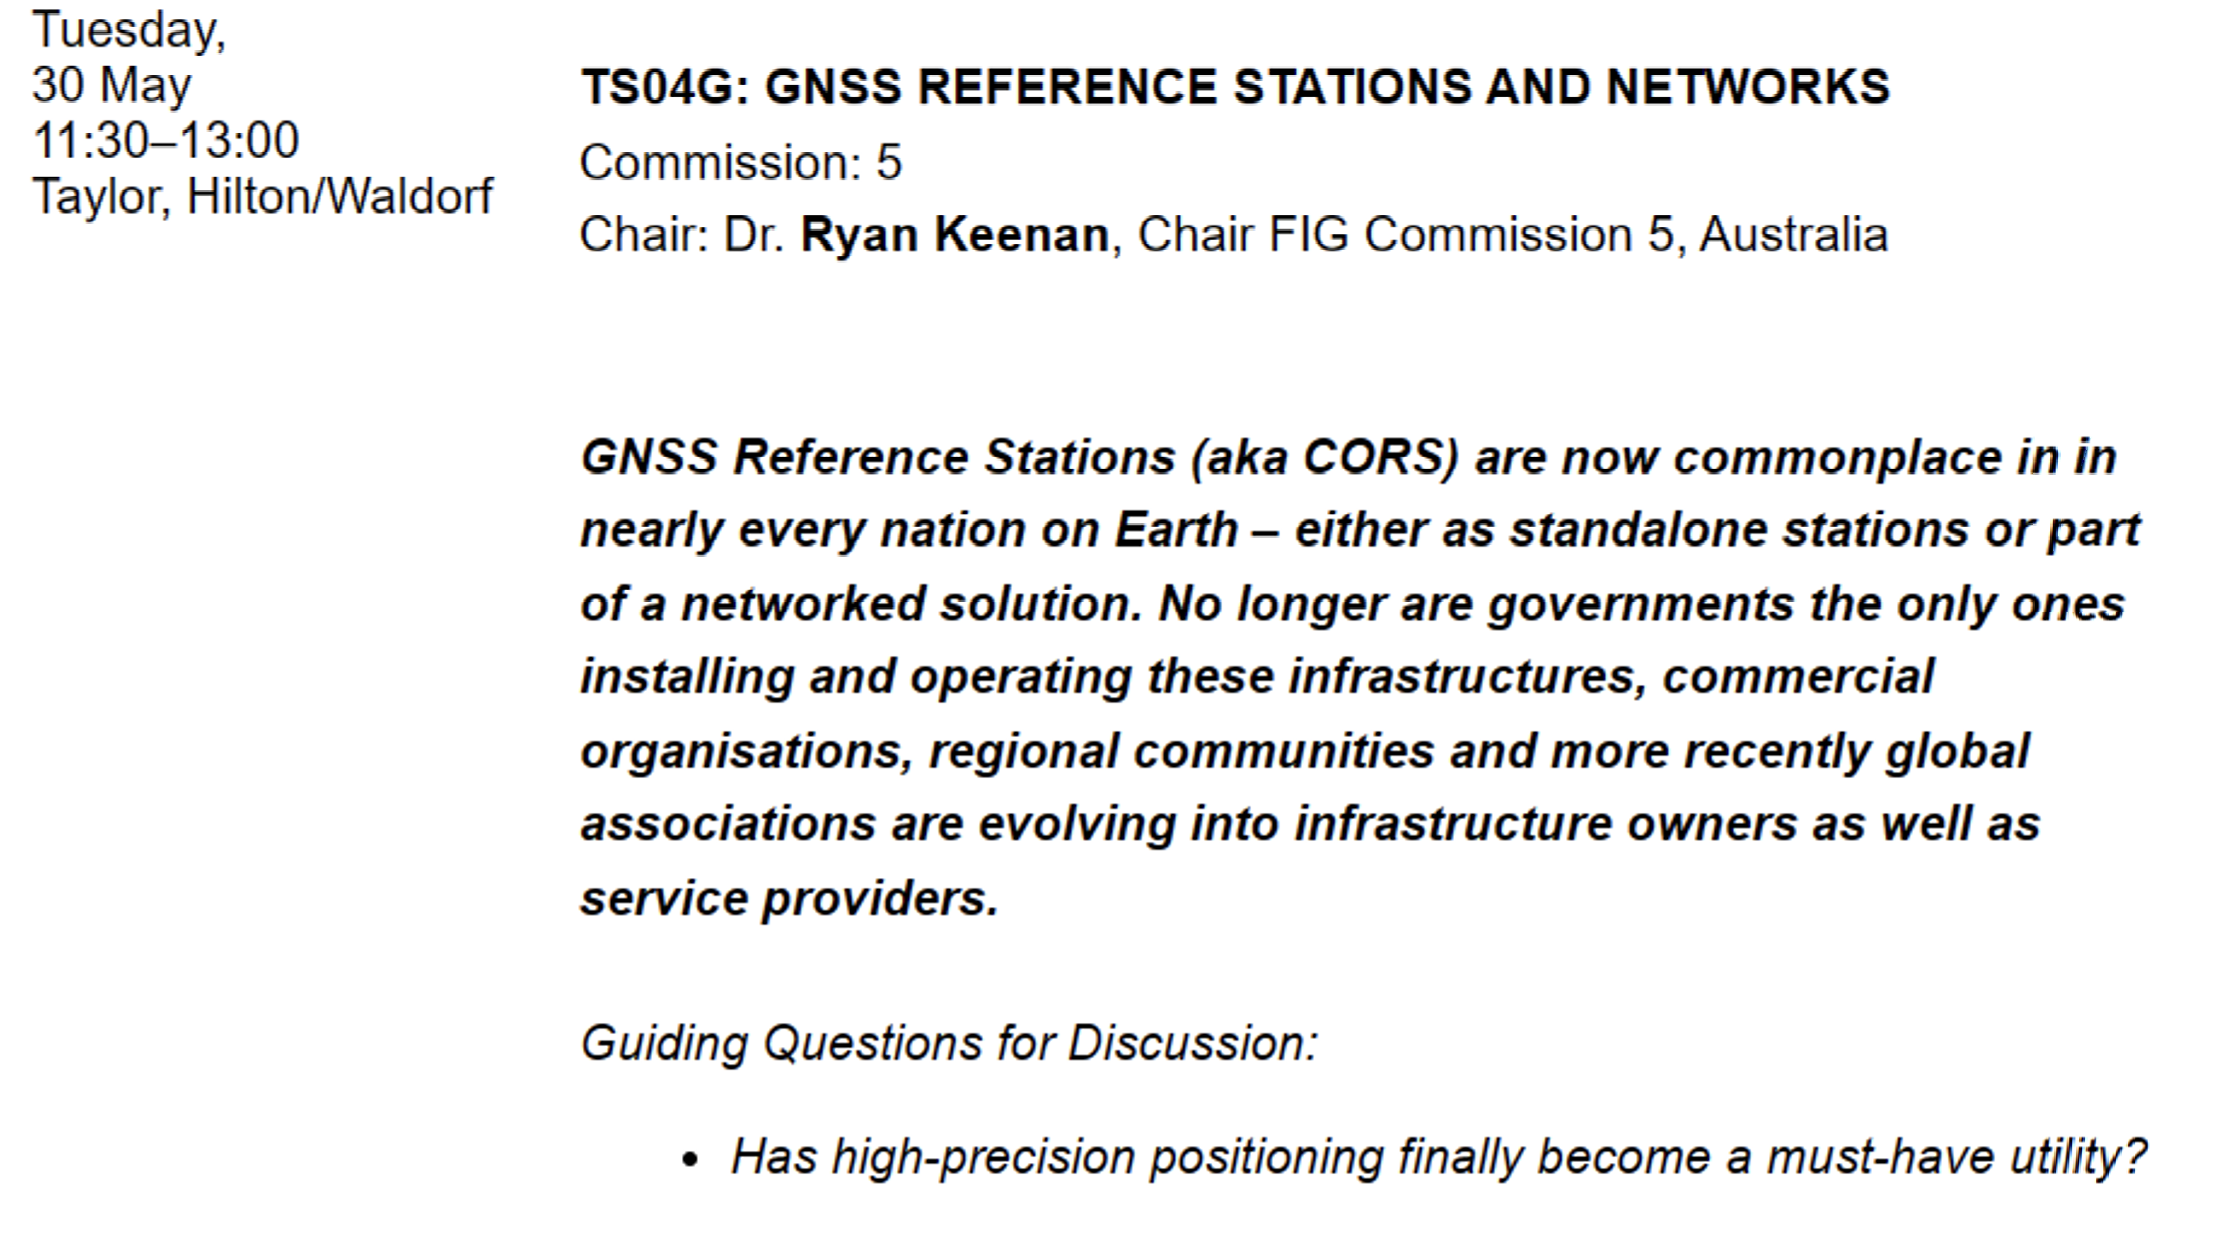
There are a lot of presentations on various topics so, I would encourage readers to look through the entire agenda. FIG’s technical work is led by ten commissions. The August 2021 column provided information about the FIG commissions. See the list of commission below:
Commission 1 – Professional Standards and Practice Commission 2 – Professional Education Commission 3 – Spatial Information Management Commission 4 – Hydrography Commission 5 – Positioning and Measurement Commission 6 – Engineering Surveys Commission 7 – Cadastre and Land Management Commission 8 – Spatial Planning and Development Commission 9 – Valuation and the Management of Real Estate Commission 10 – Construction Economics and Management
The full technical program lists the topics by date and time. I highlighted sessions by commission 5 and 6 that I think would be interested to the surveying and mapping community. See the image below.
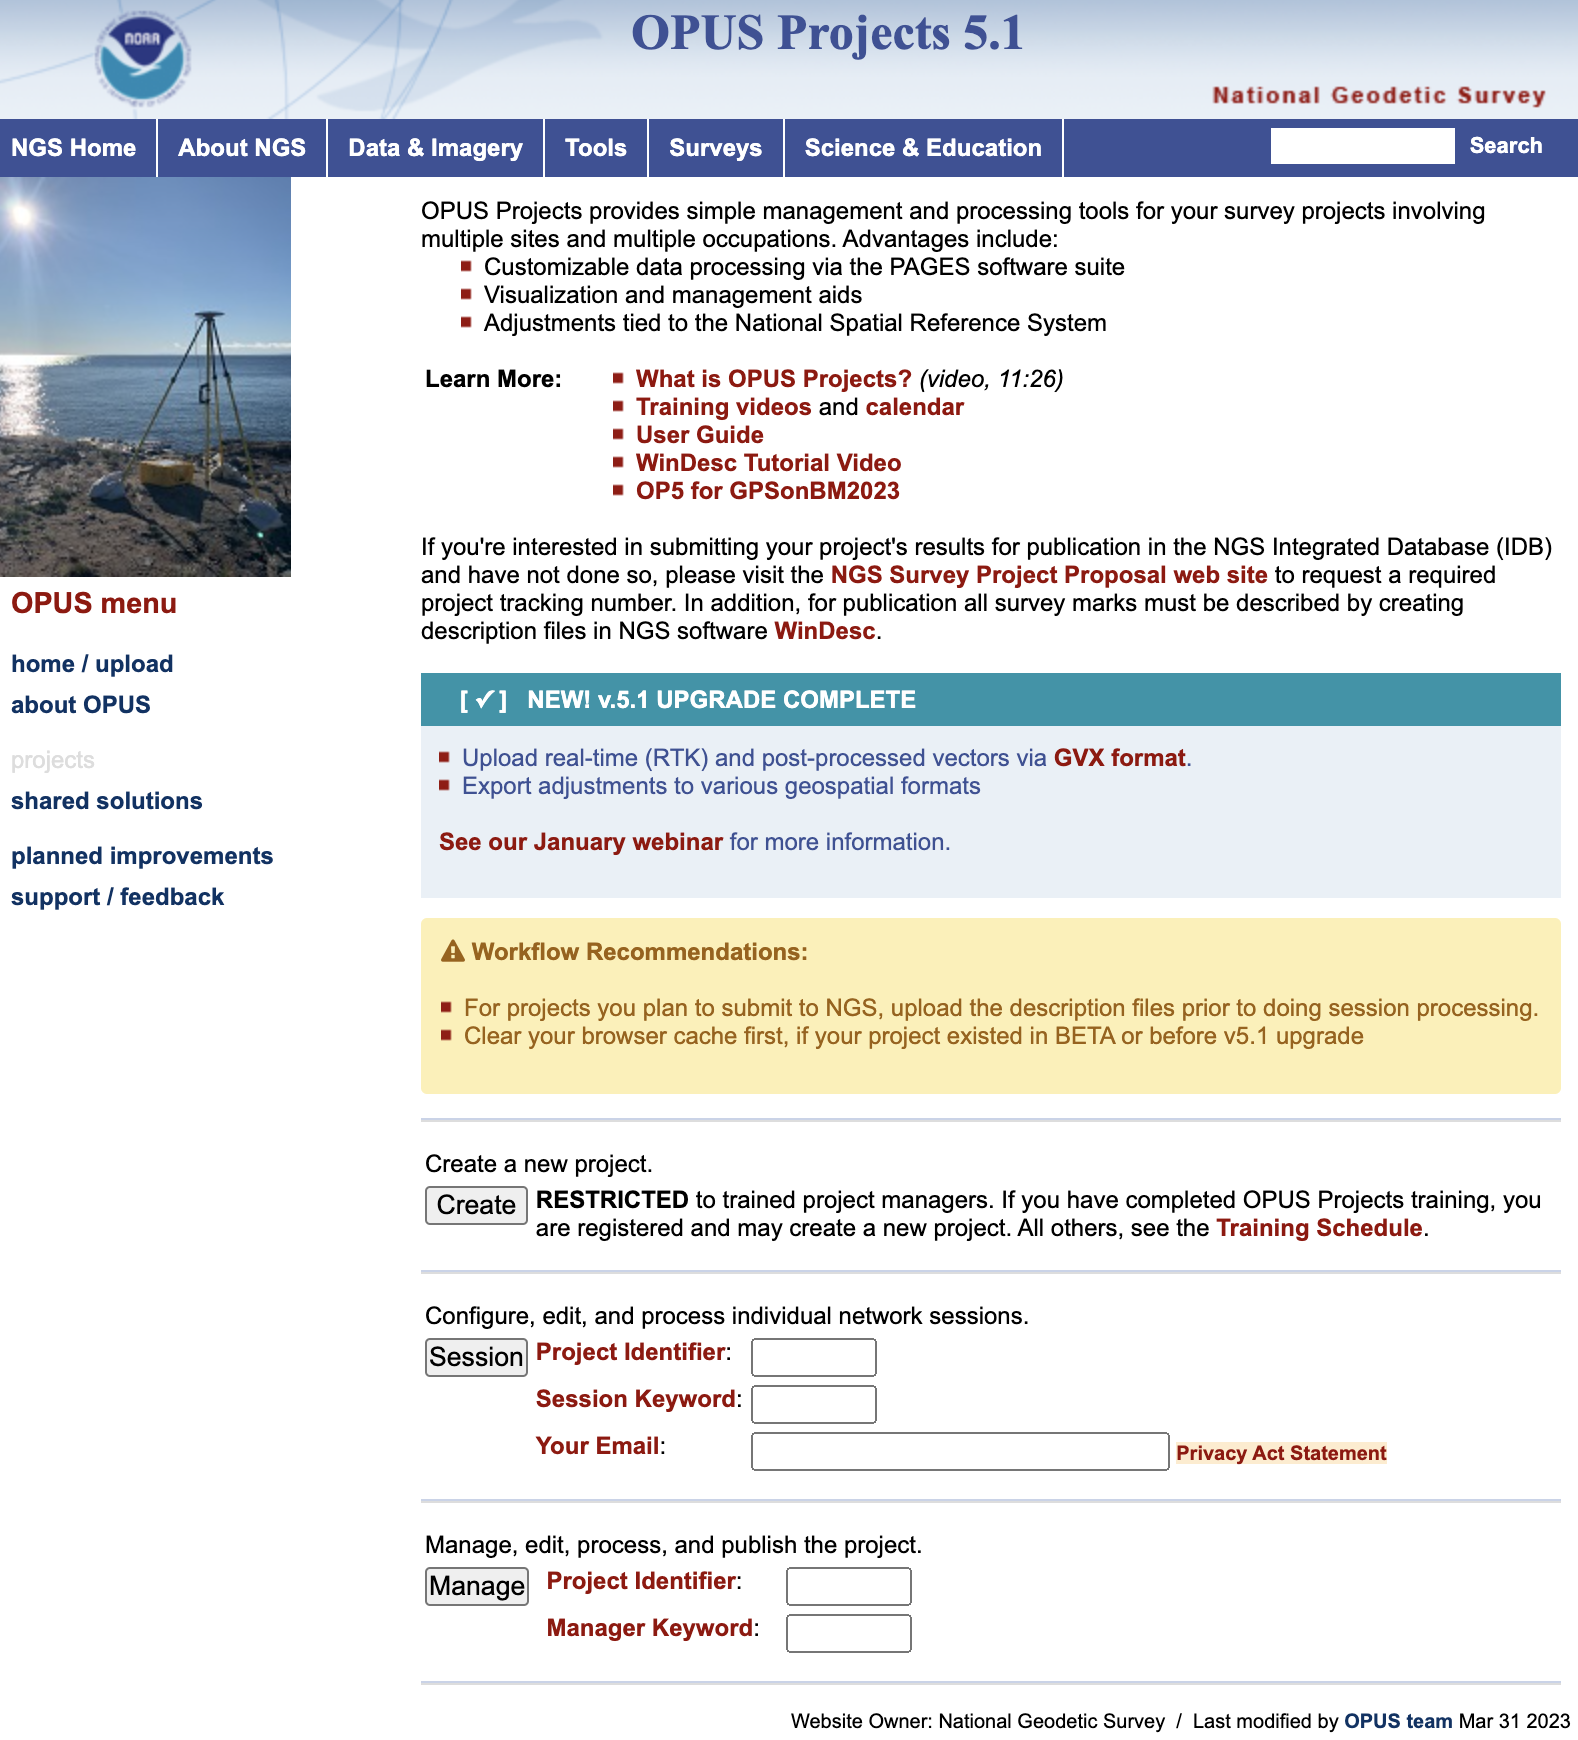
Finally, I would like to highlight a NGS product that is now in production mode. That is, OPUS Project 5.1 is now a production product. *NGS did not make an official announcement about this change, but if you access OPUS Project the new version comes up. As described in the March column, OPUS Project 5.1 routine allows the use of RTN vectors and post-processed vectors from vender software.
Clicking the “projects” icon on the OPUS page connects you to the latest version of OPUS Project 5.1. See image below. Please see the March column or NGS’ January webinar to learn more about OPUS Project 5.1.
Image: NGS Website
*Note: As of the writing of this column, March 29, it is still listed on the beta release section of NGS website. If you click on OPUS Project 5.1 in the Beta Release section, it will link to the production version of the routine.
In July 2020, my First Fix article discussed the Geodesy Crisis in the United States. In January 2022, Mike Bevis, collaborating with others, prepared a white paper titled “The Geodesy Crisis,” documenting the concern about the lack of trained geodesists in the United States. Since then, my November 2022 survey scene column highlighted that without investment in geodesy, the United States will not have the available skills and knowledge to develop new geodetic technologies and improve models to address challenges to society. In December 2022, Matteo Luccio discussed the urgent need for U.S. geodesists with Everett Hinkley, who works for the federal government, serves as a subject-matter expert on several high-level boards, and dubs himself a “concerned citizen geodesist.”
Well, things are starting to happen. NGS is soliciting grant proposals from eligible organizations to implement activities that modernize and improve the National Spatial Reference System (NSRS) and advance the science of geodesy in the United States. See the image below.
I realize that this is very short notice, but all Letters of Intent (LOIs) must be received no later than Wednesday, March 22, 2023. Full proposals do not have to be completed until April 24, 2023. The grant information and related material can be found here.
This is a great opportunity for institutions of higher education, state, local and Indian tribal governments to partner with industry and private consultants to advance the science of geodesy.
My previous column provided an update on the current set of published orthometric heights in the southeast Texas region and rules by the National Geodetic Survey (NGS) for estimating and publishing GNSS-derived orthometric heights using OPUS Projects. It also highlighted my personal crusade, that is the United States geodesy crisis. The Geodesy Crisis white paper can be downloaded from the American Association for Geodetic Surveyingwebsite.
This column focuses on potential errors in orthometric heights using a digital barcode leveling system with multi-piece leveling rods. Every business makes decisions based on expenses and ultimately on the profit margin. That said, making a business decision that results in a bad technical outcome may lead to issues that cost the company more than expected.
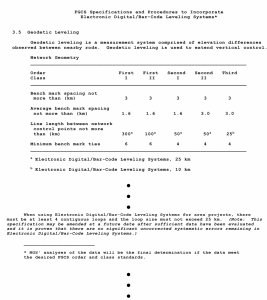
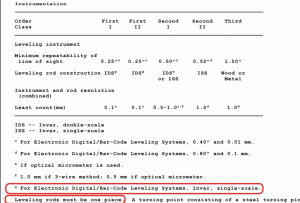
I have been involved with establishing orthometric heights, both leveling-derived heights and GNSS-derived heights, for most of my career. On a personal note, the digital bar code leveling system is important to me because I was the lead author of the document by the Federal Geodetic Control Subcommittee (FGCS) to incorporate the digital barcode leveling systems “Specifications and Procedures to Incorporate Electronic/Digital Barcode Leveling Systems (2004).” Recently, a colleague brought to my attention that many surveyors are using the digital barcode leveling system (which wasn’t a surprise to me), but they are not using the one-piece, single-scale, invar rod. They are using the multi-piece rods, either fiberglass or wooden. Surveyors can use any type of instrument to perform their project, but it will not meet the Federal Geodetic Control Subcommittee specification and procedures for leveling unless they use a one-piece leveling staff. This not a new requirement; it has been a requirement since the first publication of the FGCS specifications and procedures. Surveyors have always requested to use multi-piece rods but the potential errors associated with them were considered too large to be incorporated into the specifications and procedures to meet first-, second-, or third-order U.S. federal accuracy standards.
Excerpt from FGCS Specifications and Procedures (Image:FGDC)Excerpt from FGCS Specifications and Procedures (Image:FGDC)
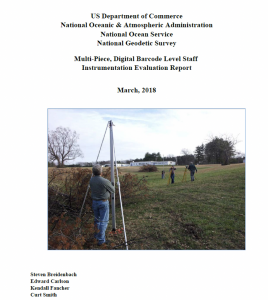
In 2018, NGS documented a study to evaluate the use of multi-piece rods using the digital barcode leveling system. I first saw a draft of this report in 2011 and forgot that it existed. A colleague of mine recently provided me with the 2018 report. In my opinion, anyone who uses the digital barcode system and multi-piece rods should read this report and, of course, the rest of this column.
NOAA Technical Memorandum NOS NGS 75. (Image: NGS)
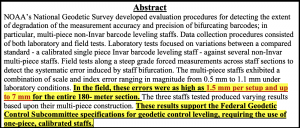
The image below provides the important summaries of the tests. I highlighted the statement “In the field, these errors were as high as 1.5 mm per setup and up to 7 mm for the entire 180-meter section.” In my opinion, an error of 7 mm in a 180-meter section is too large for any order and class of leveling. Also, the results of the study support the current FGCS specifications and procedures requirement of the use of one-piece, calibrated rods.
Image: NGS
The 2018 report states that multi-piece level staffs are popular among the surveying community because of their ability to break down into an easily transportable unit and they are relatively inexpensive and readily available. They may also be extended to reduce the number of leveling setups required over sloping terrain. This makes good business sense but surveyors should not make technical decisions based solely on business costs. That said, the FGCS “Specifications and Procedures to Incorporate Electronic/Digital Barcode Leveling Systems (2004)” prohibit the use of multi-piece rods for any order/class of leveling based on technical decisions, not on business expenses. To evaluate the multi-piece barcode rods, NGS developed and implemented laboratory and field tests designed to detect and quantify possible loss of precision in multi-piece leveling staffs. All their tests were conducted at the NGS Testing & Training Center located in Woodford, Virginia, in December 2011. The report was published in 2018.
The report did note that only a small sampling of instrumentation, three multi-piece leveling staffs comprising two separate models from two separate manufacturers, were included in the NGS study. Therefore, the results found within the report evaluate the accuracy and precision of the specific staffs tested. As the report states: “The tests are qualitative in nature with respect to bifurcation and non-Invar construction. Similar results are expected for similarly designed level staffs; nevertheless, the results should not be considered precisely valid for all types or models of multi-piece leveling staffs.”
Users should download the document and read it but I’ll highlight a few results. First, the report made the following statements about the plumbing of the rods:
“With the Leica GKNL4M level staff carefully plumbed, the section directly above the bottom section housing the level vial was visually slightly out of plumb. No correction was made for this effect in the lab or field tests. No measurements were made to the top third section of this level staff during this evaluation.”
“With the Trimble LD23 level staff carefully plumbed, the sections directly above and below the middle section housing the level vial was visually bowed and slightly out of plumb. No correction was made for this effect in the lab or field tests.”
Obviously, having a correctly plumbed rod is extremely important.
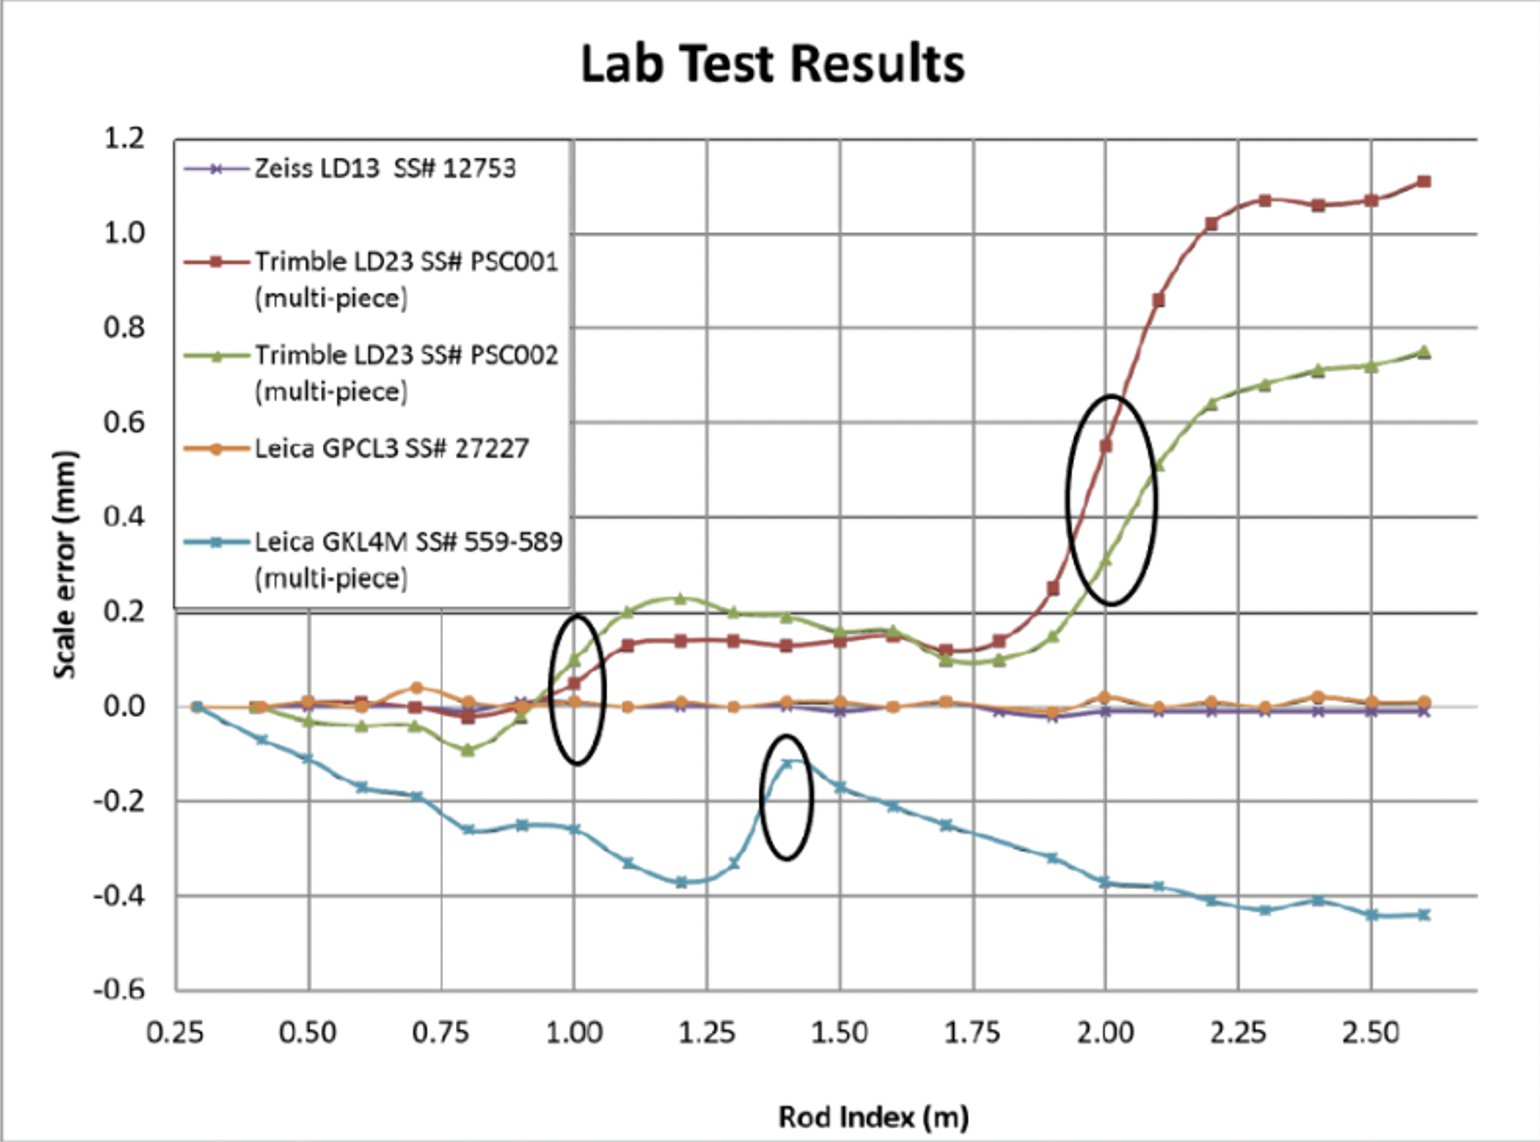
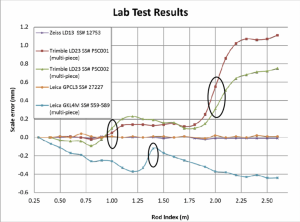
To estimate the potential scale error in a controlled environment, NGS performed a special test where they set up the level instrument 5 m from the leveling rods inside their building and made a measurement every decimeter on each rod. To perform this, the level instrument was moved upward one-decimeter after each measurement and the measurement was repeated. Figure 9 from the 2018 report depicts the results of the process. The first thing to notice is that the two calibrated, invar rods indicate very small errors. The other thing to notice is that there is a change in scale error at the section breaks of the multi-piece staffs. I highlighted the section breaks in the image below. The plots in Figure 9 indicate that the upper section of the rod is different from the lower section. This may result in a large error when going up (or down) an incline; that is, when leveling up an incline the upper section of a rod would be read in the back-sight reading and the lower section of a rod would be read in the foresight reading. The opposite would occur going down the incline.
Figure 9 from NGS 2018 report. (Image:NGS)
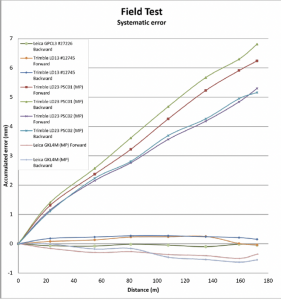
NGS also performed a small field test. The height difference was only 10 m over about 180 m distance. Figure 15 from the report provides the results of their field test. Some of the rods showed an error of almost 7 mm in the 180-meter section. Obviously, this is a significant error over such a short leveling distance, especially since it appears to be systematic. The report made a note about the systematic error; it noted that the height differences between the forward and backward runs were similar, but they were different from the standard. In other words, the forward and backward runs may meet a FGCS section misclosure but the mean difference would still have the accumulated systematic error. This means that following double-run procedures will not account for the systematic error. As a side note, according to FGCS specifications and guidelines, for establishing a height of a new bench mark, double-run procedures must be used. Single-run methods can be used to re-level existing work provided the new work meets the allowable section misclosure.
Figure 15 from NGS 2018 Report. (Image:NGS)
As stated in the 2018 report, errors as large as 6.8 mm over a 180-meter sloping section were due to using the multi-piece leveling rods. This is unacceptable for meeting FGDC specifications and procedures for leveling surveys.
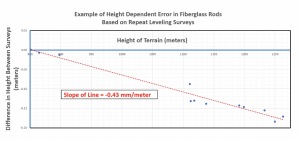
The NGS report was based on a small sample and over a very small project area. It provides a compelling argument for requiring one-piece leveling rods. Now, for a real-world example that supports the results of NGS’s study. I received a report where the results of repeat leveling surveys using the multi-piece fiberglass rods over the same basic route indicated a large systematic height error. The figure below provides the difference in heights between the two surveys. As indicated in the figure, the data indicates a height dependent error of -0.43 mm/meter between the two surveys. In this example, the difference approaches 200 mm. Clearly this type of systematic error needs to be accounted for when multi-piece barcode rods are used in a survey.
Example of Height Dependent Error in Fiberglass Rods. (Image: Dave Zilkowski)
As previously stated in the conclusion of NGS’s 2018 report, “Calibration of these type survey instruments provides a means of quantifying these type error sources, thus providing a mechanism for ‘correcting’ for them during post processing of data sets.” If a company or agency created a calibration process similar to NGS’s test site, then surveyors could use the site to evaluate their multi-piece barcode rods. In my opinion, until users account for the index and scale error in multi-piece barcode leveling rods, they should not be used to perform leveling surveys to compute orthometric heights with any expected accuracy value.
Clearly, it is more cost effective to use multi-piece rods instead of single-piece invar rods because of the increase in expenses for the single-piece invar rods. However, making a business decision that results in a bad technical outcome could lead to lawsuits, professional liability issues, and/or additional expenses for having to resurvey projects. Enough said.