DigitalGlobe, a global provider of high-resolution satellite imagery and geospatial solutions, has signed of a Memorandum of Understanding with the United Nations.
Under the agreement, DigitalGlobe and the United Nations Office for Outer Space Affairs (UNOOSA) will take stock of their combined expertise in the use of earth observation technologies for economic, social, and scientific development and improved decision-making, particularly in developing countries.
UNOOSA and DigitalGlobe will work to develop an online platform to provide easy access to imagery catalogues as well as data and analytical services specifically tailored for the needs of the United Nations. Under the agreement, DigitalGlobe will provide advisory services on remote-sensing imagery and geospatial analytics, working with UNOOSA to advance and accelerate adoption of geospatial and satellite imagery-based analytics across the entire United Nations System.
The cooperation will also extend to DigitalGlobe’s participation in relevant UNOOSA-supported events and activities, including those of the United Nations Platform for Space-based Information for Disaster Management and Emergency Response (UN-SPIDER) and of the United Nations Geographic Information Working Group (UNGIWG).
“Cooperation and collaboration in the area of geospatial information and analytics will improve how the United Nations, including its member states and its system of organizations, can address global economic, environmental, geopolitical, and societal issues,” said Simonetta Di Pippo, director of UNOOSA.
“DigitalGlobe is thrilled to partner with UNOOSA, the United Nations body that promotes international cooperation in the peaceful uses of outer space,” said Jeffrey R. Tarr, DigitalGlobe president and CEO. “The arrangement provides an ideal platform to explore how high-resolution satellite imagery and geospatial analytics can be more efficiently and effectively shared across the entire United Nations System, thus propelling us toward our purpose of ‘Seeing a Better World.”
Data Reveals Homes Most at Risk in California, Colorado and Texas
According to new data released today by CoreLogic, nearly 900,000 single-family homes across 13 states in the western U.S. are currently designated at “High” or “Very High” risk for wildfire damage, representing a combined total reconstruction value estimated at more than $237 billion. Of the total homes identified, just over 192,000 homes fall into the “Very High Risk” category alone, with total reconstruction cost valued at more than $49.6 billion.
The CoreLogic Wildfire Risk analysis designates risk levels as “Very High,” “High,” “Moderate” and “Low.”
Two additional categories, “Urban” and “Agriculture” indicate homes at even lower risk. Homes designated as “Urban” are located in areas with a dense concentration of buildings and infrastructure to such an extent that little natural vegetation exists to support a wildfire. Homes designated as “Agriculture” are located in areas comprised of row crops, orchards/vineyards or other specific land use that is typically irrigated. Even if it is not irrigated, the crops are nourished and healthy with no ground litter present, and therefore, the vegetation is unlikely to support or enhance a wildfire.
The analysis also assigns a numeric risk score to each property, ranging from 1 to 100. This separate score indicates the level of susceptibility to wildfire, as well as the risk associated with the property being located in close proximity to another high-risk property or area. The score designation is important since wildfire can easily expand to adjacent properties and cause significant damage even if that property was not originally considered high risk.
When expanding the analysis to include the numeric score, more than 1.1 million homes fall under the highest Wildfire Risk Score segment (81-100), representing a combined potential reconstruction value of more than $268.5 billion.
Total U.S. Properties at Risk and Reconstruction Values by Risk Category
Wildfire Risk Level
Total Properties
Reconstruction Cost
Very High
192,242
$49,608,484,867
High
704,860
$187,661,388,760
Moderate
1,351,313
$292,811,373,342
Low
1,378,104
$334,120,053,463
Agriculture
993,580
$244,167,729,666
Urban
23,778,799
$6,094,873,170,789
Total:
28,398,898
$7,203,242,200,887
Total U.S. Properties at Risk and Reconstruction Values by Numeric Risk Score
Wildfire Risk Score (1-100)
Total Properties
Reconstruction Cost
81-100
1,101,131
$268,549,008,333
61-80
1,193,814
$338,395,410,748
51-60
487,013
$131,081,392,801
1-50
25,616,940
$6,465,216,389,005
Total:
28,398,898
$7,203,242,200,887
The states most commonly associated with wildfires also contain the most properties at risk — California, Colorado and Texas have the largest number of residential properties categorized as “Very High Risk,” with a combined reconstruction value exceeding $36 billion. Including homes located in the “High Risk” category, the reconstruction value is more than $188 billion for these three states. When analyzed by risk score, 816,515 homes with reconstruction costs valued at more than $206.5 billion fall into the highest risk segment of 81-100.
Limiting the evaluation to property-level risk strictly in the “Very High” category, California tops the list of states analyzed with a total of 50,905 homes falling into that group. Comparatively, when assigning the Wildfire Risk Score, Texas takes the top spot with 451,848 homes scoring in the 81-100 highest-risk range.
Total Properties at Risk by State and Risk Category
State
Low
Moderate
High
Very High
Agriculture
Urban
Total
AZ
43,273
4,443
8,488
8,089
5,332
1,910,771
1,980,396
CA
221,104
169,468
255,023
50,905
146,013
8,208,625
9,051,138
CO
70,935
38,628
50,009
49,667
66,876
1,482,352
1,758,467
ID
37,352
22,968
15,197
11,078
86,542
384,018
557,155
MT
60,588
18,903
9,601
10,218
22,516
194,927
316,753
NV
17,845
20,520
8,653
281
3,166
816,975
867,440
NM
55,969
19,554
25,766
9,481
16,200
483,282
610,252
OK
165,009
88,642
187
0
33,225
968,210
1,255,273
OR
37,137
41,160
51,872
13,788
157,749
938,664
1,240,370
TX
332,766
829,457
261,855
35,016
175,691
5,960,221
7,595,006
UT
11,185
13,590
3,441
68
31,825
681,016
741,125
WA
308,066
72,069
12,509
1,997
219,334
1,625,394
2,239,369
WY
16,875
11,911
2,259
1,654
29,111
124,344
186,154
Total
1,378,104
1,351,313
704,860
192,242
993,580
23,778,799
28,398,898
Reconstruction Values by State and Risk Category
State
Low
Moderate
High
Very High
Agriculture
Urban
Total
AZ
$9,641,256,308
$976,410,271
$1,758,550,435
$1,572,563,175
$1,143,819,360
$366,495,664,312
$381,588,263,861
CA
$75,842,726,208
$61,916,244,431
$89,354,295,530
$16,103,052,587
$49,993,071,641
$2,787,437,974,226
$3,080,650,364,623
CO
$18,625,174,701
$11,531,765,722
$14,580,510,822
$13,914,663,160
$17,325,198,320
$341,298,432,193
$417,275,744,918
ID
$9,201,487,848
$5,563,694,301
$3,712,505,829
$2,620,564,770
$19,821,299,748
$81,602,075,191
$122,521,627,687
MT
$14,629,451,956
$4,430,244,606
$2,287,179,138
$2,395,322,719
$5,408,564,612
$40,511,274,596
$69,662,037,627
NV
$4,236,711,357
$5,193,363,455
$4,565,346,511
$164,097,900
$804,282,891
$209,146,367,671
$224,110,169,785
NM
$11,654,726,259
$4,622,802,292
$7,067,786,311
$2,461,741,365
$3,238,850,020
$98,567,625,878
$127,613,532,125
OK
$31,924,967,489
$16,773,531,745
$32,840,233
$0
$6,781,088,763
$175,933,722,480
$231,446,150,710
OR
$8,237,043,811
$9,489,672,570
$11,913,602,274
$3,198,334,352
$37,257,178,708
$213,002,484,645
$283,095,316,360
TX
$59,531,714,789
$147,682,544,644
$48,259,080,738
$6,333,237,927
$32,857,921,476
$1,201,265,765,342
$1,495,930,264,916
UT
$2,849,584,240
$3,928,155,203
$768,151,716
$14,155,093
$8,343,607,261
$157,244,129,873
$173,147,783,386
WA
$84,067,607,674
$18,078,389,368
$2,876,053,207
$505,435,568
$54,701,823,116
$397,645,668,540
$557,874,977,473
WY
$3,677,600,823
$2,624,554,734
$485,486,016
$325,316,251
$6,491,023,750
$24,721,985,842
$38,325,967,416
Total
$334,120,053,463
$292,811,373,342
$187,661,388,760
$49,608,484,867
$244,167,729,666
$6,094,873,170,789
$7,203,242,200,887
Total Properties at Risk by State and Numerical Risk Score
State
1-50
51-60
61-80
81-100
Total
AZ
1,919,351
14,308
27,159
19,578
1,980,396
CA
8,286,708
133,654
367,457
263,319
9,051,138
CO
1,454,787
52,823
122,509
128,348
1,758,467
ID
476,310
9,554
27,868
43,423
557,155
MT
243,990
13,114
27,301
32,348
316,753
NV
848,682
2,337
9,184
7,237
867,440
NM
523,755
14,487
32,139
39,871
610,252
OK
1,250,888
1,431
2,219
735
1,255,273
OR
1,091,300
22,616
46,655
79,799
1,240,370
TX
6,458,363
197,548
487,247
451,848
7,595,006
UT
693,256
14,713
24,311
8,845
741,125
WA
2,192,567
8,662
17,001
21,139
2,239,369
WY
176,983
1,766
2,764
4,641
186,154
Total
25,616,940
487,013
1,193,814
1,101,131
28,398,898
Reconstruction Values by State and Numerical Risk Score
State
1-50
51-60
61-80
81-100
Total
AZ
$369,191,090,202
$2,781,562,044
$5,612,822,008
$4,002,789,607
$381,588,263,861
CA
$2,785,871,424,591
$53,258,974,686
$153,067,995,013
$88,448,970,333
$3,080,647,364,623
CO
$333,552,521,110
$13,769,558,737
$33,846,313,158
$36,107,351,913
$417,275,744,918
ID
$102,894,072,845
$2,426,687,082
$6,899,872,812
$10,300,994,948
$122,521,627,687
MT
$52,685,950,526
$2,997,541,855
$6,338,603,322
$7,639,941,924
$69,662,037,627
NV
$216,436,292,731
$624,126,373
$3,860,921,144
$3,188,829,537
$224,110,169,785
NM
$105,891,175,664
$3,334,262,905
$7,919,619,903
$10,468,473,653
$127,613,532,125
OK
$230,716,181,496
$235,452,854
$370,084,424
$124,431,936
$231,446,150,710
OR
$248,596,738,298
$5,247,235,235
$11,061,921,922
$18,192,420,905
$283,098,316,360
TX
$1,276,614,038,497
$39,753,699,730
$97,535,512,589
$82,027,014,100
$1,495,930,264,916
UT
$159,359,659,455
$4,309,214,977
$7,363,299,947
$2,115,609,007
$173,147,783,386
WA
$547,066,785,312
$1,964,631,216
$3,905,374,051
$4,938,186,894
$557,874,977,473
WY
$36,340,458,278
$378,445,107
$613,070,455
$993,993,576
$38,325,967,416
Total
$6,465,216,389,005
$131,081,392,801
$338,395,410,748
$268,549,008,333
$7,203,242,200,887
At the CBSA (Core Based Statistical Area) level, Denver-Aurora-Lakewood, Colo. ranks first for the most number of homes at “Very High” risk out of the 258 CBSAs analyzed. Riverside-San Bernardino-Ontario, Calif. comes in a close second, followed by Sacramento-Roseville-Arden-Arcade, Calif.
When ranking CBSAs based on Wildfire Risk Score, Riverside-San-Bernardino-Ontario, Calif., takes the top spot for the most number of homes that fall under the highest risk segment of 81-100, followed by Sacramento-Roseville-Arden-Arcade, Calif., and Austin-Round Rock, Texas.
Top 10 CBSAs Ranked by Homes at Very High Risk
CBSA
Very High # Homes
Home Reconstruction Value
Denver-Aurora-Lakewood, CO
17,860
$5,358,513,217
Riverside-San Bernardino-Ontario, CA
14,249
$4,233,998,840
Sacramento-Roseville-Arden-Arcade, CA
9,698
$3,351,781,562
Bend-Redmond, OR
9,128
$2,328,466,791
Colorado Springs, CO
7,296
$2,086,189,220
Durango, CO
6,052
$1,776,710,340
Fort Collins, CO
4,609
$903,336,600
Truckee-Grass Valley, CA
4,569
$1,430,020,245
Houston-The Woodlands-Sugar Land, TX
4,219
$917,157,644
Flagstaff, AZ
4,109
$753,176,500
Top 10 CBSAs Ranked by Numerical Risk Score
CBSA
81-100 Risk Score
Home Reconstruction Value
Riverside-San Bernardino-Ontario, CA
50,605
$14,805,549,511
Sacramento–Roseville–Arden-Arcade, CA
42,042
$15,875,023,943
Austin-Round Rock, TX
35,807
$9,019,956,767
Denver-Aurora-Lakewood, CO
35,174
$10,807,628,461
San Antonio-New Braunfels, TX
31,350
$7,097,211,479
Los Angeles-Long Beach-Anaheim, CA
17,006
$8,654,562,030
Chico, CA
15,103
$3,754,593,902
Colorado Springs, CO
14,990
$4,408,080,237
Truckee-Grass Valley, CA
14,671
$4,945,547,724
Houston-The Woodlands-Sugar Land, TX
14,092
$3,063,417,604
*Additional CBSA-level data may be available upon request.
To enhance accuracy, the CoreLogic wildfire analysis has been expanded from prior annual analyses to encompass additional categories of single-family residential structures including mobile homes, duplexes, manufactured homes and cabins, among other non-traditional home types. The values represent estimates of reconstruction costs, taking into account labor and materials, and are based on 100-percent or total destruction of the residential structure. Depending upon the size of the wildfire, there may be less than 100-percent damage to the residence, which would result in a lower realized reconstruction cost.
Technology that allows a drone to be piloted using a person’s brainwaves has been demonstrated in Portugal, reports BBC News. Drone specialist Tekever adapted existing electroencephalography (EEG) technology to enable a pilot on the ground to send instructions to the drone software, a technology it calls Brainflight.
Tekever told BBC News that the technology could enable people with restricted movement to control a UAV. Tekever believes the technology could eventually be used to pilot cargo planes, but experts say safety concerns will be a major roadblock.
Microsemi Corporation is offering a new Integrated GNSS Master (IGM) solution for small-cell synchronization. The IGM is the company’s first solution that fully integrates a 1588v2 PTP grandmaster with a GNSS receiver and antenna in a small, fully contained package, designed to mount indoors.
The Microsemi IGM solves the challenge of indoor synchronization, which has been a significant hurdle for cost-effective small cell indoor deployments.
According to the Small Cell Forum, 80 percent of small cell needs are for indoor use. Microsemi expects the company’s new IGM to revolutionize indoor small cell deployments by eliminating the need for an antenna on the rooftop along with expensive power, cabling and installation costs associated with connecting the GNSS antenna to the 1588 grandmaster in a typical small-cell deployment.
IGR reports that the cost to deploy a small cell is approximately $31,000 on average and much higher than the cost of the small cell itself. Similarly, the cost of deploying a GPS antenna on a roof is typically $15,000 to $25,000 and can go up to $60,000 in high-rise buildings, in addition to the roof rental expense on a yearly basis.
The Microsemi IGM eliminates the need for an outdoor antenna and therefore significantly reduces the purchase, installation and maintenance deployment costs for typical GNSS antenna systems. The sensitive GNSS receiver and patented Microsemi timing algorithms result in an indoor GNSS timing solution that can be deployed in many different indoor environments.
The IGM uses Power-over-Ethernet (PoE) to simplify installation by utilizing standard Ethernet within a facility and requires no more than 12.95 watts of power directly from the Ethernet cable. The IGM is mounted on the wall or ceiling, connected to the network via PoE, and the unit will automatically self-configure, lock to GNSS signals and provide precise frequency and phase with its 1588v2 PTP grandmaster needed for small cell operation.
“The IGM product introduction is a continued commitment from Microsemi to address market and customer challenges in timing and synchronization,” said Eric Colard, director of marketing and business development for Microsemi’s Frequency & Time Division. “The IGM solution complements our flagship timing products and will work with them in tandem to provide a truly end-to-end timing and synchronization solution.”
“Deploying small cells indoor to provide better coverage and enhance capacity is becoming a priority for operators,” said Richard Webb, Analyst, Mobile Backhaul, at Infonetics, recently acquired by IHS. “The challenge of tight synchronization requirements for LTE has been difficult to solve; Microsemi’s IGM innovative solution enables mobile operators to precisely synchronize small cells indoor and lower deployment costs.”
“The time is right for such an innovative and disruptive solution as IGM from Microsemi,” said Earl Lum, president, EJL Wireless Research. “Since Small Cells for indoor are now being readily deployed, Microsemi solves a critical cost issue and technical challenge operators are facing. The compact form factor, plug and play capability, and scalable client support of the IGM product hits the sweet spot for indoor small cell projects.”
LocationSmart, a provider of cloud-based location and interactivity services, and Locaid, a location-as-a-service platform for enterprise location, have merged to create an enterprise mobility platform for cloud-based location services.
The merger agreement was unanimously approved by the boards of directors of LocationSmart and Locaid, and stockholders of both companies approved the merger on Feb. 19. The combined company will operate under the LocationSmart brand. In conjunction with the merger, LocationSmart secured equity and debt financing led by Intersouth Partners and Hamilton Lane (Florida Growth Fund) to integrate operations and accelerate growth initiatives.
Mario Proietti will continue as CEO of LocationSmart, and Locaid founder and CEO Rip Gerber will serve on the company’s board of directors and as a strategic advisor.
“We are excited that we could join together the two preeminent enterprise location platforms in the industry to better serve our collective customers,” Proietti said. “Working together will enable us to deliver a richer and more robust set of location services that translate into better solutions for our clients. The innovations delivered through our award-winning platforms will continue to lead the market in meeting their needs to locate mobile consumers, workers and assets anywhere, anytime and on any network.”
“This unification of our location platforms is compelling,” Gerber said. “By joining forces, we provide a broader set of location enabling solutions to our enterprise customers, and serve as a more strategic service delivery channel for our wireless carrier partners. This strategic combination makes us very formidable in every part of the mobile location-enabled world. I am delighted that we were able to join the businesses together.”
This combination creates a worldwide cloud-location platform with a customer base of more than 200 brands and companies locating millions of end users to enhance their services and business operations. The merger establishes a stronger platform for future innovation within the mobile location industry, providing significant benefits to all constituencies, including:
Enhanced and trusted, global location awareness of customers, workers and assets
Unified access to a multitude of device location sources with the largest reach in the industry
Reliable and highly scalable enterprise-grade location services available in the cloud
Fully managed and carrier-approved privacy controls compliant with industry best practices
Advancements in international device roaming solutions.
The LocationSmart and Locaid platforms are employed by the Fortune 500 and other leading companies for mission-critical applications in a number of industries including service assistance, proximity marketing, workforce management, emergency alerting, mobile gaming and transaction verification. Through the integration of the two companies and their platforms, customers will be able to access, through a single unified web services interface, the most robust and comprehensive portfolio of cloud-based location services in the world.
Editor’s note: Dennehy is GPS World’s editor for location-based services, writing a monthly column for the LBS Insider newsletter. The views expressed are his own. He will be covering the Mobile World Congress in Barcelona for GPS World. Contact him at [email protected] with your news.
Sen. Ed Markey’s new car technology report, released earlier this month, basically says that connected vehicles can be hacked, causing danger to drivers and presenting major privacy concerns. While some critics believe Markey’s report was meant to drive media hysteria, others say it raises serious issues that the industry needs to address. In other location news, I’ll be covering the Mobile World Congress in Barcelona for GPS World. What will be the showcased location technology? Wearables? Connected vehicles? Or something new?
Kevin Dennehy
By Kevin Dennehy
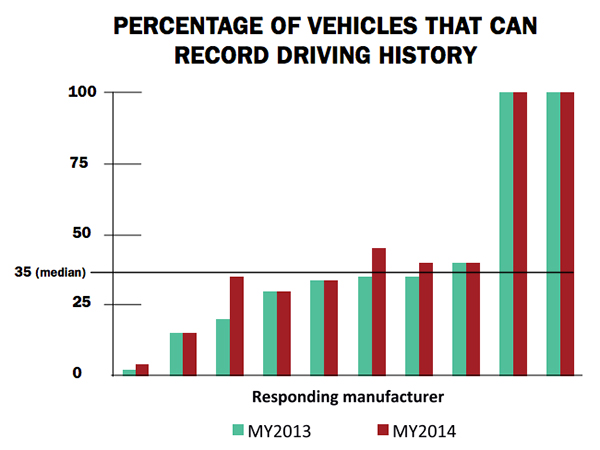
A report released by Sen. Edward Markey (D-Mass.) earlier this month says that even though drivers have come to rely on new connected technologies, automakers haven’t done their part to protect them from cyber attacks or privacy invasions
First reported by CBS News’ 60 Minutes, Markey’s report, Tracking & Hacking: Security & Privacy Gaps Put American Drivers at Risk, includes information from 16 automobile manufacturers who were given questions about security and privacy. However, few of the carmakers’ answers included how vehicles may be vulnerable to hackers — and what driver information is collected.
Location industry veteran Kim Fennell, deCarta CEO, said the report should be a real concern to the industry. “But it’s more of an issue for autonomous driving and the security of the car’s electronic control system. Even today, the OnStar service, which was a pioneer in the connected car space, can remotely slow your vehicle down in the event of a theft,” he said. “This feature, if hacked, could definitely create massive problems if the proper security technologies are not implemented.”
Markey’s report raised additional concerns about the use of navigation and other features that record and send location or driving history information.
Fennell said there should be a distinction between the infotainment systems in the vehicle and the on-board control systems of the car.
“We believe that there should be a strict firewall between these systems so that nothing malicious can happen that is initiated from the connected infotainment system. Any data should flow one way — from the control system of the car to the infotainment system,” he said. “This is not to say that the connected infotainment system shouldn’t be secure, it should be. In working with our OEM and Tier One partners, we have implemented strict security protocols between our servers and their apps.”
Markey’s report found that “[automakers] use personal vehicle data in various ways, often vaguely to ‘improve the customer experience’ and usually involving third parties, and retention policies — how long they store information about drivers — vary considerably among manufacturers.”
In addition, the report found that customers are often not made aware of data collection and, when they are, they often cannot opt out without disabling features, such as navigation.
Percentage of Vehicles that can record driving history
Overall, Fennell hopes that the most malicious thing that could happen in the event of a hack of an infotainment system is that a “Pandora station is changed to play nothing but Justin Bieber songs, the traffic information for your route is projected to be ridiculously long or the Yelp rating of the restaurant that you are going to is lowered down to one star.”
Ultimately though, the driver should be in control of the car and nothing in the infotainment system should affect the behavior of the vehicle, Fennell said.
In terms of driver safety, in a recent survey, deCarta found that more than two-thirds of respondents considered dashboard screens that display videos and other Internet content to be the most dangerous types of onboard information systems. Approximately 79 percent of those polled preferred “voice-activated mapping systems that allow drivers to keep their eyes on the road” as an essential safety-enhancing feature.
“There are two things that infotainment systems could do better to prevent driver distraction. First, instead of replicating the stove-piped app store environment of the smartphone, in-car infotainment services could be better integrated,” Fennell said. “If I find a destination on Yelp, I’d like to send that to my navigation system instead of typing in the address. Second, with today’s better automated speech-recognition technology and text-to-speech engines, it’s now possible to make requests of your infotainment system using natural language commands. Voicebox is doing some great things in this area.”
Fennell said that most existing systems are not connected. “But those that are, aren’t predictive enough. Your navigation/infotainment system should almost work as a concierge,” he said. “It should recognize what time it is and realize you are most likely leaving for work and offer up the best route based on traffic conditions. It should recognize that you are going to a destination in an urban area and offer the most convenient parking to your destination.”
Company Rolls out Indoor Positioning Product that Doesn’t Require Retailer Involvement
After testing and demoing the product in San Francisco last year, IndoorAtlas is rolling out a consumer app called GPSindoor, which uses smartphones to locate shoppers inside a mall. The product features product proximity advertising to allow shoppers to see where they are relative to a product for promotion marketing.
The product includes a crowdsourcing function to allow user-generated data to build indoor maps, wayfinding and other options for shopping promotions, said Wibe Wagemans, IndoorAtlas president.
“We don’t need any retailers per se. We need only the shopper and [their] smartphone,” he said. “There is no brand or retailer involvement if you use our app. Unlike Wi-Fi and Bluetooth beacons, since GPSindoor relies on a community of shoppers, it allows for higher accuracy than static maps. That gives us the confidence to take on the giants like Apple Beacons and Google Indoor Maps head on — we are completely independent of retailers and not dependent on them for our success in becoming the GPS of indoors.”
In other location news:
HERE released a new version of its mapping system for Android, saying it made significant improvements. According to the company’s blog, after more than 3 million downloads, it is shedding the “beta” label with this version. In the beta version, when users asked for a route, the app gave them three car routes. If a user wanted public transit or pedestrian routes, they had to switch to the appropriate tab. This process was slow and inconvenient for people who don’t use a car all the time, HERE said.
In its recent financial statements, Garmin indicated a growing, and profitable, segment is its wearables/fitness band product line. Mio is also expanding its wearable offerings. This should be a big topic at next months’ Mobile World Congress.
I’ll be covering the Mobile World Congress in Barcelona for GPS World. Contact me at [email protected] with your news.
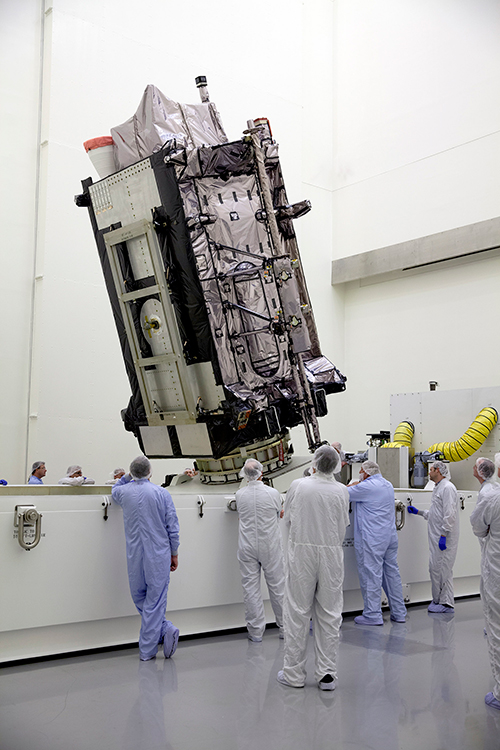
The Lockheed Martin GPS III Non-Flight Satellite Testbed (GNST).
A Lockheed Martin vice president has stated that the first GPS III satellite will likely launch in 2017, not 2016 as had been projected in the most recent update.
The company is readying the first satellite for launch availability by the end of 2015, for launch as early as the end of this year, but Space News reports that Mark Valerio, vice president and general manager of Lockheed Martin’s military space business, stated in a Feb. 18 news briefing that he expects the Air Force will schedule its launch for early 2017.
The GPS III generation of modernized satellites — with new signals, added signal strength, and resistance to interference and jamming — was originally projected to begin orbiting in 2014. Technical difficulties have delayed the program. The principal issues, those with the payload, have now been resolved, according to Valerio.
Valerio expects a firmer GPS III launch announcement for 2017 in March. He expected the final launch date “will depend on the health of the existing constellation, the availability of launch slots and synchronization with the ground system.” Ultimately, the Air Force always makes the final decision on the launch date.
Lockheed Martin is contracted to build eight GPS III satellites.
Late last year, a spokesman for the Space and Missile Systems Center said that “The first GPS III launch is tentatively considered for the first half of FY17, based on booster availability and Air Force launch priorities.”
The Air Force has put out feelers for other contractors to finish out the full generation of GPS III satellites. Lockheed Martin is building eight, with an option for four more, totalling 12; a complete constellation of III-generation satellites would require 24. Boeing Space and Intelligence Systems and Northrop Grumman Aerospace are reportedly interested.
“The best thing I can do is keep marching along the plan we have,” Valerio said. “We’re certainly not afraid of the competition.” Lockheed Martin has submitted cost-cutting proposals for the current GPS III satellite design, he added.
Ground Control
The corresponding new ground system for GPS III, the Operational Control Segment (OCX), has also fallen behind schedule. Just this month, the Air Force announced that Lockheed Martin may develop an interim control capability, a set of changes implemented upon the current control segment, the Architecture Evolution Plan (AEP), as a backup.
Michael Gilmore, the Defense Department’s director of operational test and evaluation, recently stated that OCX delays have pushed back GPS III operational testing “until after at least six, and as many as eight,” satellites have been launched into orbit. “This introduces significant risk that effectiveness and suitability deficiencies in GPS III satellites will not be discovered until it is too late to prevent their introduction to the operational constellation.”
Budget Blues
Don Jewell, GPS World’s contributing editor for defense, has written at length about the GPS III and OCX situations in his February newsletter column, “USAF FY16 Budget Plus $10B More, Please!”. We condensed some of his remarks, particular to the budget battle on Capitol Hill, for the Out in Front column of the March issue of the magazine, due out soon. Here is a further digest of those comments.
The 2016 President’s Budget, submitted in February, contains an Air Force requested a budget of $122.2 billion. This may be too little, too late.
On the satellite side of the house, GPS III has problems centering on development and delivery issues with a subcontractor. In this case, however, the whole satellite program is not failing, just a component, albeit an important one: the Mission Data Unit (MDU).
For GPS III+, the Air Force plans for a two-phased competition process: a Production Readiness competition for up to three firm-fixed price contracts to mature competitors’ production designs for a competition in a full and open competition for up to 22 GPS III Production SVs [satellite vehicles] with an expected award in FY17/18.
This sounds great if you need an entirely new GPS III system, which consists of, at a minimum, a new payload, satellite, launcher and ground C2 system. In fact, the government only needs an MDU. Failure to produce the MDU on time has delayed GPS III by 18 months to date.
More troubling are the government proposals to entertain other bids to finish the second half of the GPS III constellation. Such a competition or re-bid will take at least three years and cost hundreds of millions of dollars — and Lockheed Martin may well win again in the end
A significant added cost to the GPS budget concerns the need for a new ground C2 system if the total new systems approach is taken. If preliminary elements of the GPS space segment are developed without cross-checking the impact to the GPS control segment, technical, operational, budgetary and schedule impacts will be significant.
The already perturbed OCX budget likely has not considered the integration costs of a newly developed, yet-to-be-procured GPS III+ SV. OCX today is geared for the GPS III already contracted for, and it is failing to meet that challenge.
Budget constraints are tight and getting tighter, mandating the Air Force “do more with less” in every context. For GPS III SVs, this should — but by no means necessarily does — indicate developing an alternate MDU rather than buying a new block of GPS SVs.
Rohde & Schwarz has added the R&S RTM-K18 spectrum analysis and spectrogram option to its R&S RTM oscilloscope family, making the R&S RTM the only oscilloscope in its class that can analyze the time domain while simultaneously analyzing the spectrum, logic and serial protocol. Interactions such as those that occur in electronic devices with RF components are quickly analyzed in a single measurement.
Time and spectrum analyses can be configured completely independently of one another. This means that users can simultaneously analyze signal details that differ in time and frequency, with the optimum settings for each. Separate implementation of the signal paths makes this possible. Like a spectrum analyzer, important parameters such as center frequency and resolution bandwidth can be specifically configured to match each measurement task. The hardware-implemented digital downconverter (DDC) reduces the spectrum to the components relevant for analysis. As a result, the R&S RTM offers a fast, reactive analysis of embedded designs.
Additional displays for min. hold, max. hold and average, as well as markers for automatic peak value searches, support the user during spectrum analysis. Changes in the spectrum over time or sporadic unwanted signals are immediately visible in the spectrogram display. The amplitudes versus frequency and time are color coded.
With the R&S RTM-K15 history and segmented memory option, users can load all acquisition components from the 460 MSa deep memory and analyze them with the R&S RTM measurement functions.
The R&S RTM portfolio, which already consists of models with 200 MHz, 350 MHz and 500 MHz bandwidth, now includes two-channel and four-channel models with 1-GHz bandwidth. The new models exhibit the same analog characteristics, offering true 1mV/div at the full bandwidth and full ADC resolution with exceedingly low 270 µV noise.
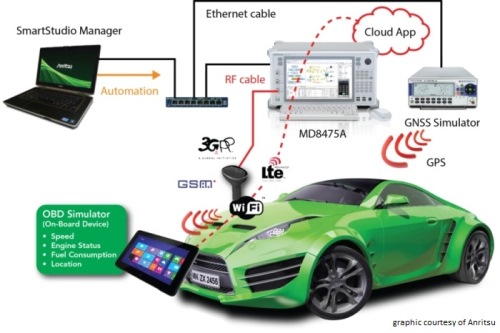
Anritsu plans to showcase a sophisticated, cloud-based connected car system for fleet tracking at Mobile World Congress 2015, which will be held in Barcelona March 2-5. The system was developed by the University of Hertfordshire in the UK with the help of network simulation technology from Anritsu.
The system will be demonstrated using a GNSS simulator from Spectracom to provide location information to the system being tested.
The connected car demonstration will show a car’s diagnostics system connecting to the cloud via a simulated LTE network environment provided by Anritsu’s mobile network simulator, the MD8475A. An application in the cloud enables a fleet manager on any Internet-connected device to view the location and operating parameters of any vehicle in the fleet in real time.
The MD8475A enables the university’s development team to test, from their Hertfordshire laboratory and with a single instrument, how the system’s in-car LTE modem would perform in mobile networks all across the world, and operating according to all major worldwide standards.
The combination of the MD8475A and the Spectracom simulator provides a complete test environment, to simulate any global location, and any type of cellular connectivity, to ensure correct operation of the system. This test bed will showcase the effectiveness of a complete wireless test-bed solution, to enable cost-effective development testing, product validation, and customer experience evaluation within a single system.
Anritsu Corporation has been a communications provider solutions for more than 110 years, with test and measurement solutions including wireless, optical, microwave/RF and digital instruments, operations support systems and solutions that can be used during R&D, manufacturing, installation and maintenance.
Topcon Positioning Group is partnering with The Toro Company to develop a GPS-guided sprayer that Toro will start selling to the commercial equipment marketplace this summer. The GeoLink system will be available for the Toro Multi Pro 5800 initially, with plans to offer it for a broader range of Toro sprayers in the future.
“We’re thrilled to partner with Toro on our debut in the turf spraying marketplace,” said Jason Killpack, director of business development, strategic partnerships for Topcon.
The Toro Multi Pro 5800 sprayer will get Topcon GPS guidance.
“This new system, which builds upon Topcon innovations developed for precision agriculture, is an excellent example of how positioning technologies can benefit non-traditional industries. We are taking proven precision agriculture technology and providing it as a resource for Toro to employ in its market,” Killpack said.
“In addition to working in tandem with Toro to develop this exciting new product, it also provides us the opportunity to expand our TopNETlive network, which is a key initiative within our organization.” The TopNETlive network is a subscription-based, real-time, GNSS reference network delivering high-quality correction data to rovers used for surveying, construction, GIS mapping and agricultural applications throughout North America.
“We started by understanding customer needs, and then selected Topcon as a partner to develop an integrated user-friendly solution,” said Jace Bertsch, marketing manager for Toro. “We are very excited to offer the unique features that have been engineered into this system, and are confident that GeoLink will be successfully deployed in both the golf and sports field market segments. Simply put, GeoLink ensures accurate and consistent coverage, which translates into exceptional results and reduced chemical costs.”
Farmers Edge Inc., a precision agriculture and independent data-management company, has acquired GranDuke Geomatics Ltd. of Lethbridge, Alberta. The agreement was finalized on Jan. 9, giving control of the geospatial solutions and software development company to Farmers Edge.
Headquartered in Winnipeg, Canada, Farmers Edge has operations in North and South America, Australia, Russia and Eastern Europe. The company said it’s goal is to increase growers’ profitability maintaining an environmentally sustainable approach by leveraging advanced precision tools and big data analytic solutions.
Farmers Edge offers its Precision Solutions package for every agribusiness, crop and geography. Precision Solutions is a turnkey comprehensive package that includes variable rate technology, field centric weather monitoring, high-resolution satellite imagery, in-field telematics and real boots on the ground. Farmers Edge allows farmers to collect, store and transfer data, make advanced management decisions and measure results.
Fertilizer and yield maps provided by GranDuke Geomatics Ltd. are part of the Precision Solutions product line, offering growers an increase in efficiency through automated workflows, specialized software design and cloud-based data processing.
GranDuke Geomatics Ltd. was founded in 2012 by Guy Duke and Kevin Grant, and with the assistance of the National Research Council offers customized software solutions and geospatial applications to clients in precision agriculture, environmental monitoring, and oil and gas. With 22 employees, GranDuke Geomatics Ltd. will continue to provide advanced GIS and yield data processing services for Farmers Edge.
“The acquisition of GranDuke is a huge opportunity for our company and our staff,” Grant said. “Farmers Edge is a world-class, fast growing precision agriculture company. We are excited to be a part of their continued growth.”
“This acquisition is the culmination of a lot of hard work and late evenings providing Farmers Edge with rapid software development and quick product turn-around times for their data analysis and mapping,” Duke said.
“We’re really excited about the acquisition of GranDuke Geomatics because they bring an outstanding software engineering team and valuable ag technology IP to the table,” said Wade Barnes, president and CEO of Farmers Edge Inc. “We are now incorporating this IP into our decision support tools that bring all the information together to make a meaningful impact on production. We want our growers to have all resources they need to attain the best results from their investment.”
Editor’s Note: Janice Partyka is principal of JGP Services, a consulting practice. She is GPS World’s editor for wireless, writing a monthly column for the Wireless LBS Insider newsletter. The views expressed are her own.
Hard to believe, we have only now reached the 10th anniversary of Google Maps. As important as digital maps have become, their purpose is much the same as the printed and drawn maps that preceded them. Digital maps emerged in the 1960s with the Census Bureau’s DIME maps. These first digital maps were used for analysis of place-specific data, such as populations within census tracts or cities. Digital maps in turn led to geographic information systems (GIS) for spatial analysis. Though GIS had uses in fields like city planning, the main stimulus for digital maps came in the 1990s with the convergence of the completion of GPS infrastructure, and affordable and portable computers.
Naturally, just knowing where you are doesn’t have huge value, but if that information can be fused with a digital map, which could generate a route to the destination of your choice, or access information on the places that surround you, then you have something. This is why companies like Etak, Tele Atlas and Navteq began the painstaking process of converting satellite images, printed topographic maps and data that could only be observed with one’s eyes (such as street signs, addresses, speed limits, and turn restrictions) into digital form.
One of my projects during the 1990s was to compare the accuracy of competing digital maps. It was a tedious process, entailing two-person driving crews traveling each street. The passenger recorded all relevant information and made periodic readings with a large, costly GPS receiver. At the time, digital maps could only be accessed by complicated GIS programs which restricted their usefulness.
Since then, digital maps have grown in significance due to the advent of smartphones, a growing suite of digital-map-enabled applications, and of course Google Maps. Google has made maps friendlier to developers through its application program interfaces (APIs), which also improved the user experience for scrolling across locations from a map view.
Google has mastered the process of data capture from roadways. Rather than rely on the eyes of people in the field, sensors and cameras collect mapping data. Image-processing software extracts and geo-codes textual data, automating and enhancing map creation. And Google has incorporated overhead and street-level photographic images into maps, adding substantial value.
We will never arrive at having a perfect digital map. The work to keep mapping accurate and give it more context will be ongoing. The next challenge in digital mapping is making it work offline and creating accurate maps of the indoors. These next innovations will not be led by GPS, but by sensors, including beacons. GPS has already done the heavy lifting.