Military officials from across all branches, federal security personnel, and industry leaders are set to convene for the second installment of AUVSI Defense 2023 on September 14 at the United States Army General Gordon R Sullivan Conference and Event Center in Arlington, Virginia.
The forum encourages industry leaders and attendees to connect with decision-makers and program managers across various agencies — as well as accelerating the development, funding, and acquisition of critical uncrewed technologies.
AUVSI Defense is where military and industry can set the course for innovation to support critical missions. This specialized program equips the armed services and their partners with the information and relationships they need to meet constantly shifting threats around the globe.
This year, the event will focus on the role that autonomy and AI play in U.S. Defense uncrewed/unmanned systems scalability and technology development, and why this is essential to strategic competition.
Program highlights include:
Keynote by Brent Ingraham, Deputy Assistant, Secretary of Defense Platform and Weapons Portfolio Management, OUSD
Keynote by Dr. Matt Turek, Deputy Director I2O, DARPA
Panel Discussion – Autonomy and AI Intelligent Systems Development and Integration for Strategic Advancement of Military Uncrewed Systems.
Moderated by: Dr. Jaret Riddick – Senior Fellow, Center for Security and Emerging Technology, Georgetown University
Panelists including: CAPT Daniel Malatesta, Program Manager PMS 408, U.S. Navy; Dr. Randy Yamada, Vice President Digital Battlespace Autonomy, Booze Allen Hamilton; and Dr. Jordan Fletcher, Chief Engineer, Army Platforms, MITRE.
For more information and registration, visit the AUVSI Defense website.
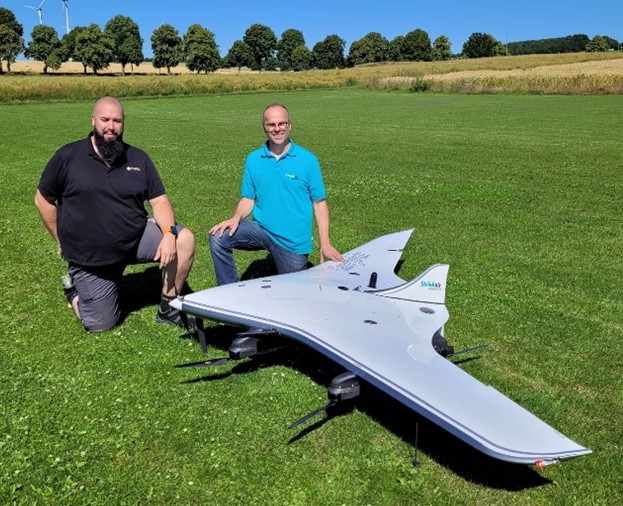
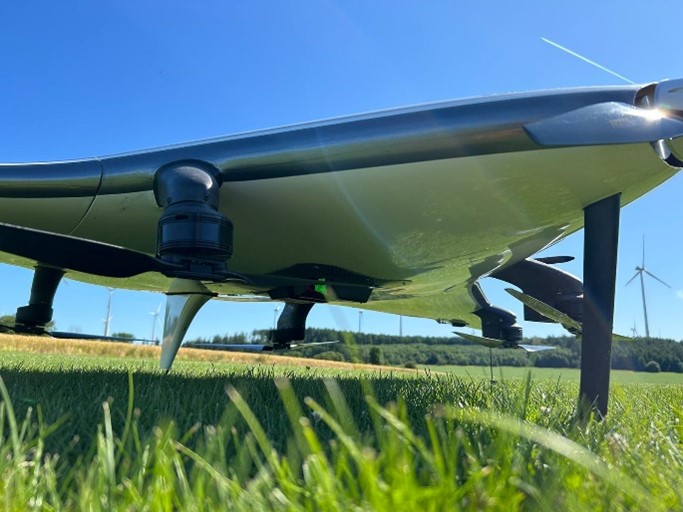
REIGL and StriekAir engineering GmbH have successfully completed the integration of an airborne scanning system, the RIEGL VUX-12023, on the StriekAir VTOL CarryAir UAV from Germany. During its inaugural flight, the integrated technology successfully captured accurate data of the ground structure.
The RIEGL VUX-12023 laser scanner is recognized for its precision and accuracy in aerial surveys. When integrated with the VTOL CarryAir, the UAV can reach a cruising speed of 85 km/h and offers users a combination of point cloud density and efficient data acquisition.
With the integration, users can acquire data about eight times faster than with conventional multicopters, according to REIGL. This time-saving feature aims to provide users with enhanced efficiency and data accuracy.
Matthias Hutecek (RIEGL) and Thomas Strieker (StriekAir engineering GmbH). (Image: REIGL)
The UAV can be utilized in a variety of applications — including surveying construction sites and infrastructure projects, mapping corridors, collecting topographic data for urban planning and environmental studies and more.
The RIEGL VUX-12023 offers smooth integration on UAS/UAV/RPAS, small manned airplanes and helicopters. It is offered as a stand-alone UAV lidar sensor and also in various fully integrated UAV-based laser scanning system with appropriate INS/GNSS system and optional cameras based on users’ needs.
Mapbox, a maps and location platform, has released new platform updates to enhance user’s 3D mapping experience by adding powerful dynamic lighting capabilities and landmark 3D buildings.
The new ready-to-use platform aims to enhance wayfinding and spatial orientation for users and provides a polished canvas for custom location data. Mapbox Standard is now accessible in public preview and available in pre-releases of the latest versions of its web and mobile SDKs.
Dynamic lighting for a natural day to night shift
Mapbox Standard provides four lighting presets: day, night, dusk and dawn. As the sun moves throughout the day, based on a user’s location, shadows shift and highlight different areas of the map. The dynamic lighting creates a true-to-life experience that can help users better orient themselves in the physical world.
Image: Mapbox
Landmarks improve map comprehension in 3D
As part of Mapbox Standard, Mapbox has created a dataset of hundreds of recognizable landmarks across the globe, with more being added each month. The landmark buildings integrate seamlessly into the map environment and respond dynamically to lighting changes.
Therefore, our cartographers chose a sleek and beautiful symbolic realism design for Mapbox Standard design that offers users an easy-to-read map where elements such as landmarks, buildings, roads and trees are clearly identifiable while keeping icons, labels and custom location data elements visible.
Users can choose between the new 3D elements and the 2D map within their application. Mapbox Standard is built with a base map that evolves alongside custom layers, delivering up-to-date rendering features and data layers without a manual style update or version upgrade.
To explore the new Mapbox Standard style, click here.
A2Z Drone Delivery, developer of commercial UAV delivery solutions, has launched its second generation RDST integrated cargo UAV, the RDST Longtail. The RDST Longtail features the company’s factory-integrated RDS2 drone winch, allowing payloads to be deposited safely from altitude so that spinning rotors are kept far from people and property.
The RDST Longtail serves as an off-the-shelf, ready-to-fly delivery UAV for last mile delivery. It can deliver or retrieve payloads up to 5 kg and over a distance of 11 km, making it suitable for various applications such as local parcel or food delivery, emergency medical deliveries, water sampling programs, offshore logistics, search and rescue operations and more.
The RDST Longtail continues the company’s focus on addressing consumer-protection concerns as the number of residential drone deliveries increases. By conducting deliveries from altitude, A2Z Drone Delivery’s solutions protect recipients from spinning UAV propellers, while mitigating privacy concerns of low-flying UAVs. Depositing payloads from altitude also keeps the UAV high above trees, power lines and buildings, enabling longer sight distances for missions requiring visual line of sight.
With the upgrades made to the RDST Longtail, A2Z Drone Delivery aims to democratize drone delivery for residential delivery and cases where operators need to quickly and efficiently deliver or retrieve payloads. For example, A2Z Drone Delivery platforms are in use delivering emergency defibrillators to first responders in the field, collecting water samples for analysis and delivering supplies in disaster relief efforts.
The UAV can also auto-release packages without the need for a recipient to be present at the delivery location. This is made possible by the all-new bag auto-release mechanism, allowing for easy pickups and auto-releasing of bags during deliveries.
Designed to meet FAA regulations, the RDST Longtail is remote ID compliant with a factory-integrated remote ID beacon. The Premium edition of the drone can fly in inclement weather and features a quick-release battery system for minimal downtime.
“Our prototype RDST Longtail has already logged 500 flight hours conducting daily residential parcel deliveries near our Ground Zero Test Facility outside Shanghai,” said Aaron Zhang, founder and CEO of A2Z Drone Delivery. “Many of the upgrades included in this second generation RDST have been made in response to customer feedback on capabilities they need to deploy for missions in inclement weather. The RDST Longtail is the flexible commercial delivery UAV for last-mile deliveries that will round out a logistics fleet.”
For more information on A2Z Drone Delivery system, click here.
Xona Space Systems has partnered with the Air Force Research Laboratory (AFRL) and the U.S. Space Force under a $1.2 million Direct to Phase II SBIR (Small Business Innovation Research) contract to work toward a secure low Earth orbit (LEO) positioning, navigation and timing (PNT) constellation leveraging Xona’s PULSAR service.
The contract was awarded through an AFWERX SBIR Open Topic, after Xona demonstrated its LEO PNT technology using the “Huginn” demo satellite in late 2022.
Xona is developing PULSAR – a high-performance PNT service enabled by a commercial constellation of dedicated LEO satellites.
The PULSAR service aims to advance PNT security, resilience and accuracy capabilities by augmenting existing GNSS while also operating as an independent PNT constellation.
“Our partnership with the AFRL Space Vehicles directorate and USSF’s Space Warfighting Analysis Center will give Xona the expertise necessary to seamlessly integrate PULSAR into the U.S. national security space architecture,” said Brian Manning, CEO, Xona Space Systems. “Early assessment of unique DOD PNT requirements will set us up for a successful transition to operational service.”
Colonel Jeremy Raley, commander of the Phillips Research Site and director of the AFRL Space Vehicles Directorate, said the investment will contribute to force design analytics that consider contributing signals from multiple orbit regimes.
“Lessons from this effort will pave the way for future defense programs to successfully utilize commercial space assets for flexible and diverse satnav that is resilient to the adversarial threat,” Raley said.
Preceding the award, Xona became the first company to launch a privately funded PNT mission progressing from concept to on-orbit in less than 12 months. Since then, Xona has partnered with major companies such as Hexagon | NovAtel, Septentrio, Spirent, Safran, and StarNav. In April 2023, the company moved into its new headquarters in Burlingame, California, where the company plans to start the production of PULSAR satellites.
Satellite images taken on June 25 and August 9 show an overview of southern Lahaina, Hawaii, before and after the recent wildfires. (Image: Maxar Technologies)
The number of wildfires this year only increases as the island of Maui, Hawaii has been struck by several wind-whipped wildfires fueled by Hurricane Dora. Flames engulfed parts of Hawaii the morning of Wednesday, August 9, destroying a centuries-old town and killing at least 90 people, reported NBC News.
The fires took people on the island by surprise on Tuesday, as it left behind burned-out cars on once busy streets and smoking piles of debris where historic buildings once stood. Residents and tourists were forced to evacuate the area – including some who reportedly jumped into the ocean to escape the flames.
The National Weather Service believes the combination of high winds and low humidity is what caused the dangerous fire conditions across the island.
Satellite images also were taken, showing hundreds of shops and homes burned to the ground. The satellite images focus on the historic Lahaina area, which dates to the 1700s and has long been a popular tourist destination rich with native Hawaiian culture.
In one image from Maxar Technologies, the historic area of Banyan Court in Lahaina appears to have been mostly reduced to ash. Some 271 structures were damaged or destroyed, the Honolulu Star-Advertiserreported, citing official reports from flyovers conducted by the U.S. Civil Air Patrol and the Maui Fire Department.
The fires in Maui come after scientists have warned that wildfires are becoming more frequent and more widespread across the globe.
Rising global temperatures and the increased extreme weather has led to a surge in the number of wildfires rapidly consuming extensive areas of vegetation and forested lands. Wildfires have recently spread across Greece, Italy, Spain, Portugal, Algeria, Tunisia and Canada — resulting in mass environmental and economic damage as well as human casualties.
A passenger on a plane captured the devastating wildfire that decimated the historic town of Lahaina, Maui.pic.twitter.com/h262jX92yq
ProStar Holdings Inc., a precision mapping company, has announced a technology integration with Leica Geosystems, part of Hexagon. The integration combines ProStar’s utility mapping software, PointMan, and Leica Geosystems’ precision GPS/GNSS receivers for GIS asset data collection.
The integration provides a precise and comprehensive data collection solution to capture, record and display the precise location of critical underground infrastructure across the globe using Leica Geosystems receivers.
“It only makes good business sense to work with other software providers and create mutually beneficial business relationships throughout the geospatial industry,” said Jason Hooten, GIS sales and support manager, Leica Geosystems.
Through the technology integration, PointMan now supports Leica Geosystems receivers for mobile devices running the Google Android operating system and Apple iOS, including the popular Zeno FLX100 plus GNSS receiver.
“The relationship adds significant value to our distribution network as Leica is recognized as a global leader in providing utility data collection solutions and precision GNSS receivers,” said Page Tucker, CEO of ProStar.
ProStar’s PointMan is natively cloud and mobile, offered as a Software as a Solution (SaaS). ProStar’s solutions are being adopted by some of the largest entities in North America, including Fortune 500 construction firms, the largest subsurface utilities engineering (SUE) firms, and government agencies.
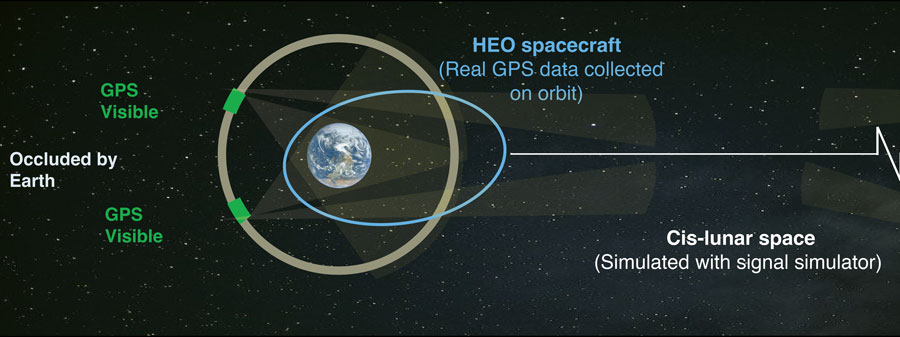
Figure 1: Diagram of cis-lunar space, which includes the real GPS sidelobe data collected on an HEO space vehicle. (All figures provided by the authors)
As part of NASA’s increased interest in returning to the moon, the ability to acquire accurate, onboard navigation solutions will be indispensable for autonomous operations in cis-lunar space (see Figure 1). Artemis I recently made its weeks-long journey to the Moon, and spacecraft carrying components of the Lunar Gateway and Human Landing System are planned to follow suit. During launch and within the GNSS space service volume, space vehicles can depend on the robust navigation signals transmitted by GNSS constellations (GPS, GLONASS, BeiDou, and Galileo). However, beyond this region, NASA’s Deep Space Network (DSN) serves as the system to track and guide lunar spacecraft through the dark regions of cis-lunar space. Increasingly, development of a lunar navigation satellite system (LNSS) that relies on a low size, weight and power (SWaP) “smallSat” constellation is being discussed for various possible orbits such as low lunar orbit (LLO), near rectilinear halo orbit (NRHO) and elliptical frozen orbit (ELFO).
Figure 2: DPE 3D (left) and 2D (right) spatial correlogram shown on a 3D north-east grid.
We have implemented direct positioning estimation (or collective detection) techniques to make the most of the limited and weak GPS signals (see Figure 2) that have been employed in other GNSS-degraded environments such as urban canyons. The algorithm used in conventional GNSS positioning employs a two-step method. In the first step, the receiver acquires signals to get a coarse estimate of the received signal’s phase offset. In the second step, the receiver tracks the signals using a delay lock loop coupled with a phase or frequency lock loop. The second step enables the receiver to get fine measurements, ultimately used to obtain a navigation solution. In the scenario addressed in our work, where a vehicle is navigating beyond the GPS satellite constellation, the signals are weak and sparse, and a conventional GPS receiver may not be able to acquire or maintain a lock on a satellite’s sidelobe signals to form a position solution. For a well-parameterized region of interest (that is, having a priori knowledge of the vehicle orbital state through dynamic filtering), and if the user’s clock error is known within a microsecond, a direct positioning estimator (DPE) can be used to improve acquisition sensitivity and obtain better position solutions. DPE works by incorporating code/carrier tracking loops and navigation solutions into a single step. It uses a priori information about the GPS satellites, user location, and clocks to directly estimate a position solution from the received signal. The delay-Doppler correlograms are first computed individually for the satellites and are then mapped onto a grid of possible candidate locations to produce a multi-dimensional spatial correlogram. By combining all signals using a cost function to determine the spatial location with the most correlation between satellites, the user position can be determined. As mentioned, signals received beyond the constellation will be sparse and weak, which makes DPE a desirable positioning method.
BACKGROUND
The proposed techniques draw from several studies exploring the use of weak signals and provide a groundwork for developing robust direct positioning methods for navigating beyond the constellation. NASA has supported and conducted several of the studies in developing further research into the use of signals in this space.
A study done by Kar-Ming Cheung and his colleagues at the Jet Propulsion Laboratory propagates the orbits of satellites in GPS, Galileo, and GLONASS constellations, and simulates the “weak GPS” real-time positioning and timing performances at lunar distance. The authors simulated an NRHO lunar vehicle based on the assumption that the lunar vehicle is in view of a GNSS satellite as long as it falls within the 40-degree beamwidth of the satellite’s antenna. The authors also simulate the 3D positioning performance as a function of the satellites’ ephemeris and pseudorange errors. Preliminary results showed that the lunar vehicle can see five to 13 satellites and achieve a 3D positioning error (one-sigma) of 200 to 300 meters based on reasonable ephemeris and pseudorange error assumptions. The authors also considered using relative positioning to mitigate the GNSS satellites’ ephemeris biases. Our work differs from this study in several key ways, including using real data collected beyond the GNSS constellations and investigating the method of direct positioning estimation for sparse signals.
Luke Winternitz and colleagues at the Goddard Space Flight Center described and predicted the performance of a conceptual autonomous GPS-based navigation system for NASA’s planned Lunar Gateway. The system was based on the flight-proven Magnetospheric Multiscale (MMS) GPS navigation system augmented with an Earth-pointed high-gain antenna, and optionally, an atomic clock. The authors used high-fidelity simulations calibrated against MMS flight data, making use of GPS transmitter patterns from the GPS Antenna Characterization Experiment project to predict the system’s performance in the Gateway NRHO. The results indicated that GPS can provide an autonomous, real-time navigation capability with comparable, or superior, performance to a ground-based DSN approach using eight hours of tracking data per day.
In direct positioning or collective detection research, Penina Axelrad and her colleagues at the University of Colorado at Boulder and the Charles Stark Draper Laboratory explored the use of GPS for autonomous orbit determination in geostationary orbit (GEO). They developed a novel approach for directly detecting and estimating the position of a GEO satellite using a very short duration GPS observation period that had been presented and demonstrated using a hardware simulator, radio-frequency sampling receiver, and MATLAB processing.
Ultimately, these studies and more have directed our research in exploring novel methods for navigating beyond the constellation space.
DATA COLLECTION
The data we used was collected as part of the U.S. Air Force Academy-sponsored Falcon Gold experiment and the data was also post-processed by analysts from the Aerospace Corporation. A few of the key notions behind the design of the experiment was to place an emphasis on off-the-shelf hardware components. The antenna used on board the spacecraft was a 2-inch patch antenna and the power source was a group of 30 NiMH batteries. To save power, the spacecraft collected 40-millisecond snapshots of data and only took data every five minutes. The GPS L1 frequency was down-converted to a 308.88 kHz intermediate frequency and was sampled at a low rate of 2 MHz (below the Nyquist rate) and the samples were only 1- bit wide. Again, the processing was designed to minimize power requirements.
METHODS AND SIMULATIONS
To test our techniques, we used real data collected from the Falcon Gold experiment on a launch vehicle upper stage (we’ll call it the Falcon Gold satellite) which collected data above the constellation on a HEO orbit. The data collected was sparse, and the signals were weak. However, the correlation process has shown that the collected data contained satellite pseudorandom noise codes (PRNs). Through preliminary investigation, we find that the acquired Doppler frequency offset matches the predicted orbit of the satellite when propagated forward from an initial state. The predicted orbit of the satellite was derived from the orbital parameters estimated using a batch least-squares fit of range-rate measurements using Aerospace Corporation’s TRACE orbit-determination software. The propagation method uses a Dormand-Prince eighth-order integration method with a 70-degree, first-order spherical harmonic gravity model and accounting for the gravitation of the Moon and Sun. The specifics of this investigation are detailed below.
Figure 3: GPS constellation “birdcage” (grey tracks), with regions of visibility near the GPS antenna boresight in blue and green for the given line-of-sight from the Falcon Gold satellite along its orbit (orange).
The positions of the GPS satellites are calculated using broadcast messages (combined into so-called BRDC files) and International GNSS Service (IGS) precise orbit data products (SP3 files). GPS satellites broadcast signals containing their orbit details and timing information with respect to an atomic clock. Legacy GPS signals broadcast messages contain 15 ephemeris parameters, with new parameters provided every two hours. The IGS supports a global network of more than 500 ground stations, whose data is used to precisely determine the orbit (position and velocity in an Earth-based coordinate system) and clock corrections for each GNSS satellite. These satellite positions, along with the one calculated for the Falcon Gold satellite, allowed for the simulation of visibility conditions. In other words, by determining points along the Falcon Gold satellite trajectory, we determine whether the vehicle will be within the 50° beamwidth of a GPS satellite that is not blocked by Earth.
Figure 3 shows a plot rendering of the visibility conditions of the Falcon Gold satellite at a location along its orbit to the GPS satellite tracks. Figure 4 depicts three of the 12 segments where signals were detected and compares the predicted visibility to the satellites that were actually detected. A GPS satellite is predicted to be visible to the Falcon Gold satellite if the direct line-of-sight (DLOS) is not occluded by Earth and if the DLOS is within 25° of the GPS antenna boresight (see Figure 5).
Figure 4: Predicted visibility of direct line-of-sight to each GPS satellite where a blue line indicates the PRN is predicted to be visible but undetected. A green line is predicted to be visible and was detected, and a red line indicates that the satellite is predicted to not be visible, but was still detected.Figure 5: Depiction of the regions of a GPS orbit where the Falcon Gold satellite could potentially detect GPS signals based on visibility.
As a preliminary step to evaluate the Falcon Gold data, we analyzed the Doppler shifts that were detected at 12 locations along the Falcon Gold trajectory above the constellation. By comparing the Doppler frequency shifts detected to the ones predicted by calculating the rate of change of the range between the GPS satellites and modeled Falcon Gold satellite, we calculated the range rate root-mean-square error (RMSE). Through this analysis, we were able to verify the locations on the predicted trajectory that closely matched the detected Doppler shifts.
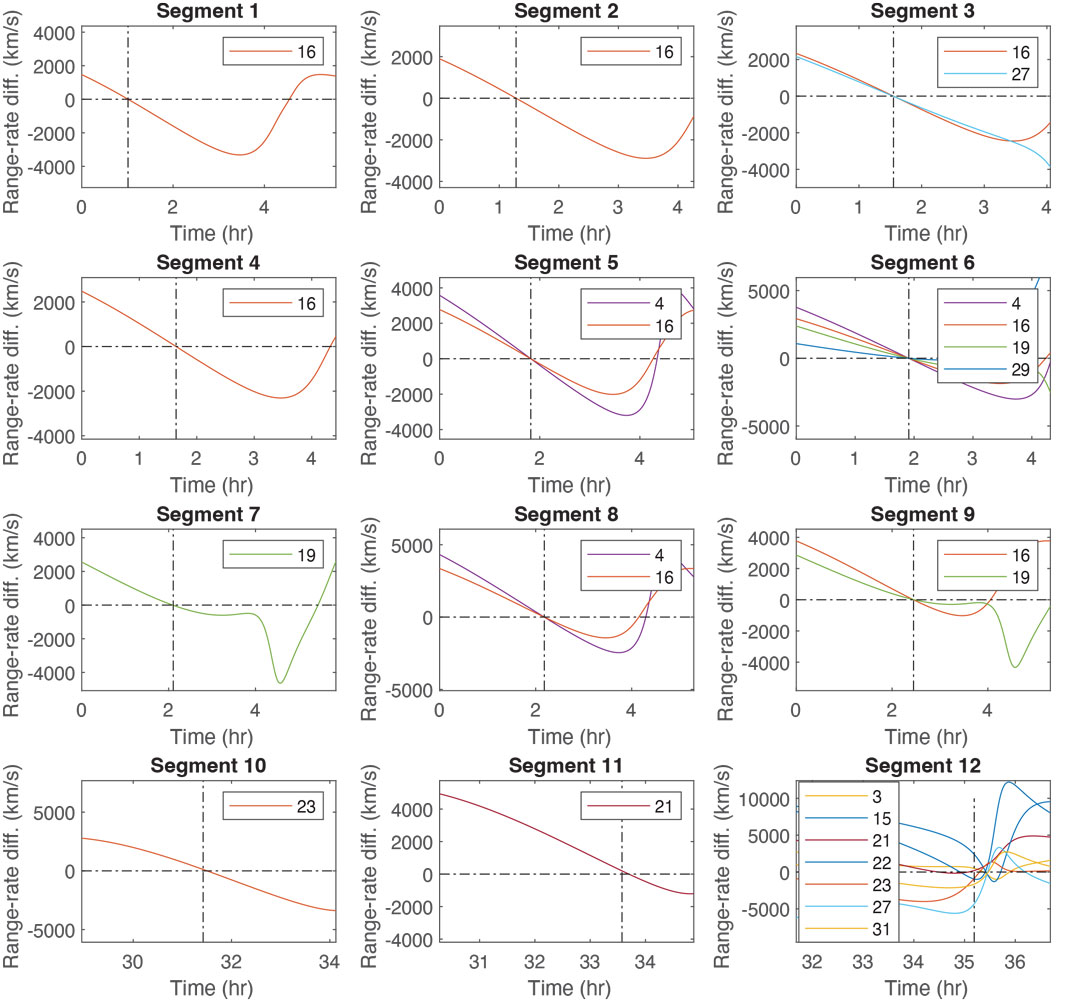
These results are used to direct our investigations to regions of the dataset to parameterize our orbit track in a way to effectively search our delay and Doppler correlograms to populate our spatial correlograms within the DPE. Figure 6 shows the time history of the difference of predicted range rates on the trajectory and the detected range rates on the trajectory. That is, a constant detected range rate value is subtracted from a changing range rate for the duration of the trajectory and not just at the location on the trajectory at the detect time (dashed vertical line). From this we can see that the TRACE method gives range rates near the detected ranges at the approximate detection time for the 12 different segments.
Figure 6: Plots depicting the 12 segments of detection and the corresponding time history of differences of range-rate values for each GPS PRN detected. The time history is of the range-rate difference between the predicted range rate from the TRACE-estimated trajectory and the constant detected range rate at the detection time (vertical line).
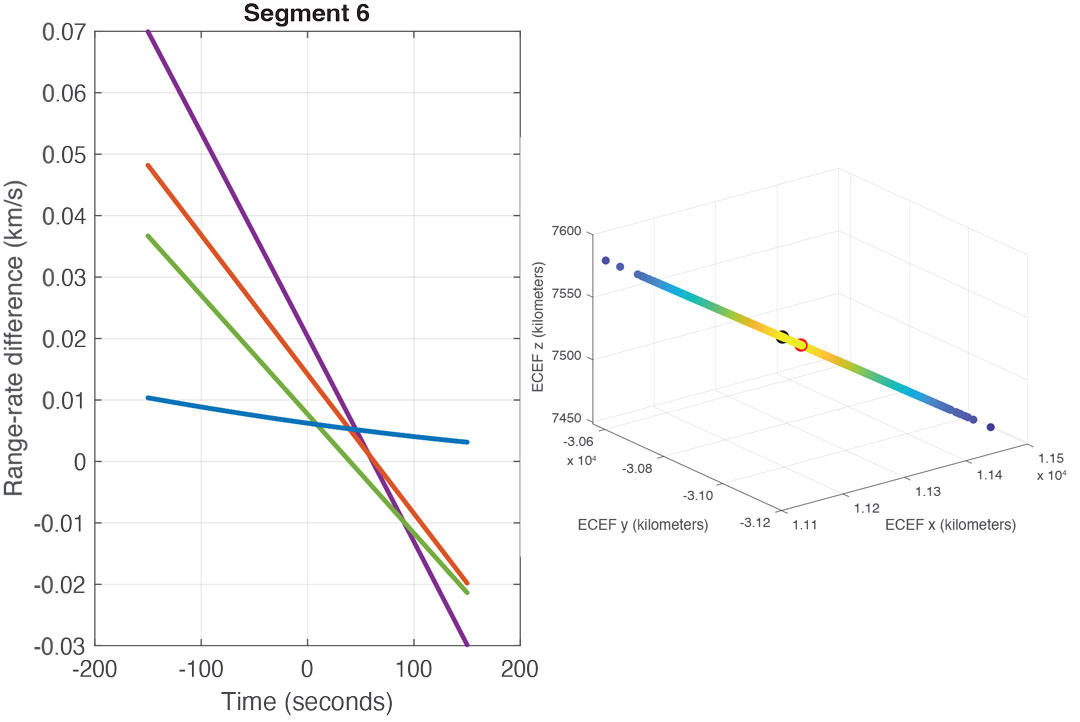
Excluding Segment 12, which was below the MEO constellation altitude, Segment 6 has more detected range rates than that of the other segments. On closer inspection of this segment, and using IGS precise orbit data products, it appears that the minimum RMSE of the range rates from the detected PRNs is off from the reported detection time by several seconds (see Figure 7). Investigating regions along the Falcon Gold TRACE-estimated trajectory and assuming a mismatch in time tagging results in a location (in Earth-centered Earth-fixed coordinates) with a lower RMSE for the predicted range rates compared to detected range rates.
Figure 7: Range-rate difference between the predicted range rate from the TRACE-estimated trajectory and the constant detected range rate at the detection time (left). A portion of the trajectory around Segment 6 with the TRACE-estimated location at the time of detection (red) and the location with the minimum RMSE of range rate (black).
To determine the search space for the DPE, we first determine the location along the original TRACE-estimated trajectory with the minimum RMSE of range rates for each segment. Then we propagate the state (position and velocity) at the minimum location to the Segment 6 time stamp. If the time segment has more than three observed range rates (Segment 6 and Segment 12), we perform a least squares velocity estimate using the range-rate measurements, using the locations along the trajectory and selecting the location with the smallest RMSE. Then, for Segment 12, the position and velocity obtained from least squares is propagated backwards in time to the Segment 6 timestamp. All of these points along the trajectory as well as the original point from the TRACE estimated trajectory are used in a way similar to the method of using a sigma point filter. Specifically, the mean and covariance of the position and velocity values are used to sample a Gaussian distribution. This distribution will serve as the first iteration of the candidate locations for DPE. There were a total of three iteration steps and at each iteration the range of clock bias values over which to search was refined from a spacing of 1,000 meters, 100 meters, and 10 meters. Also on the third iteration, the sampled Gaussian distribution was resampled with 1,000 times the covariance matrix values in the directions perpendicular to the direction to Earth. This was done to gain better insight into the GPS satellites that were contributing to the DPE solution.
RESULTS
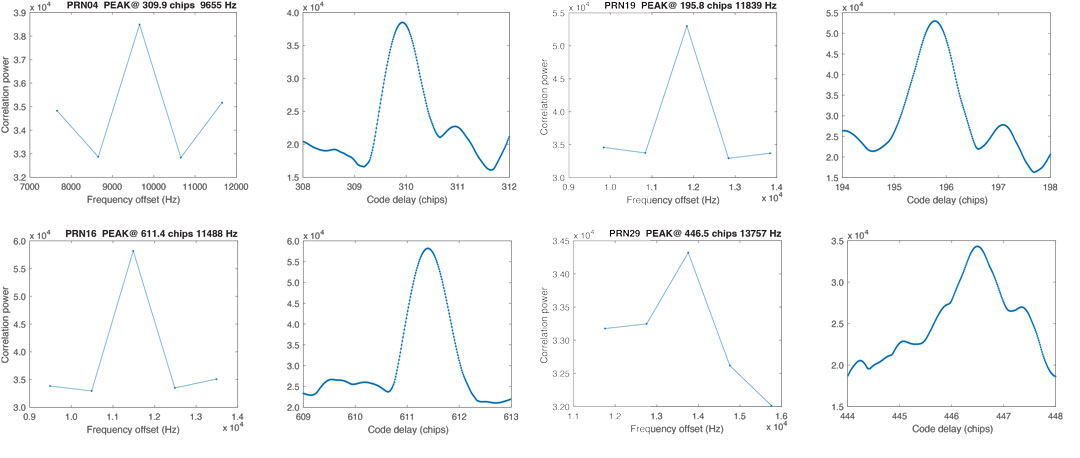
Figure 8 shows the correlation peaks for each of the signals reported to be detected using a 15-millisecond non-coherent integration time within the DPE acquisition. Satellite PRNs 4, 16 and 19 are clearly detected. Satellite PRN 29 is less obviously detected, but the maximum correlation value is associated with the reported detected frequency. However, this is the peak detected frequency only if the Doppler search band is narrowly selected around the reported detected frequency. Similarly, while the peak code delay shows a clear acquisition peak for PRNs 4, 16 and 19, for PRN 29 the peak value for code delay is more ambiguous with many peaks of similar magnitude of correlation power. Figure 8 depicts the regions around the max peak correlation chip delay.
Figure 8: Acquisition peak in frequency (left) and time (right) for PRN 4, 16, 19 and 29. The correlograms are centered on the frequency predicted from the range rate calculated along the trajectory.
For the first iteration of DPE, the peak coordinated acquisition values for PRN 16 and PRN 4 are chosen for the solution space. From the corresponding spatial correlogram, the chosen candidate solution is roughly 44 kilometers away from the original position estimated using TRACE.
For the second iteration of DPE, the clock bias is refined to search over a 100-meter spacing. The peak values for PRN 16 and PRN 19 are chosen for the solution space and the chosen candidate solution is roughly 38 kilometers away from the original position estimated using TRACE.
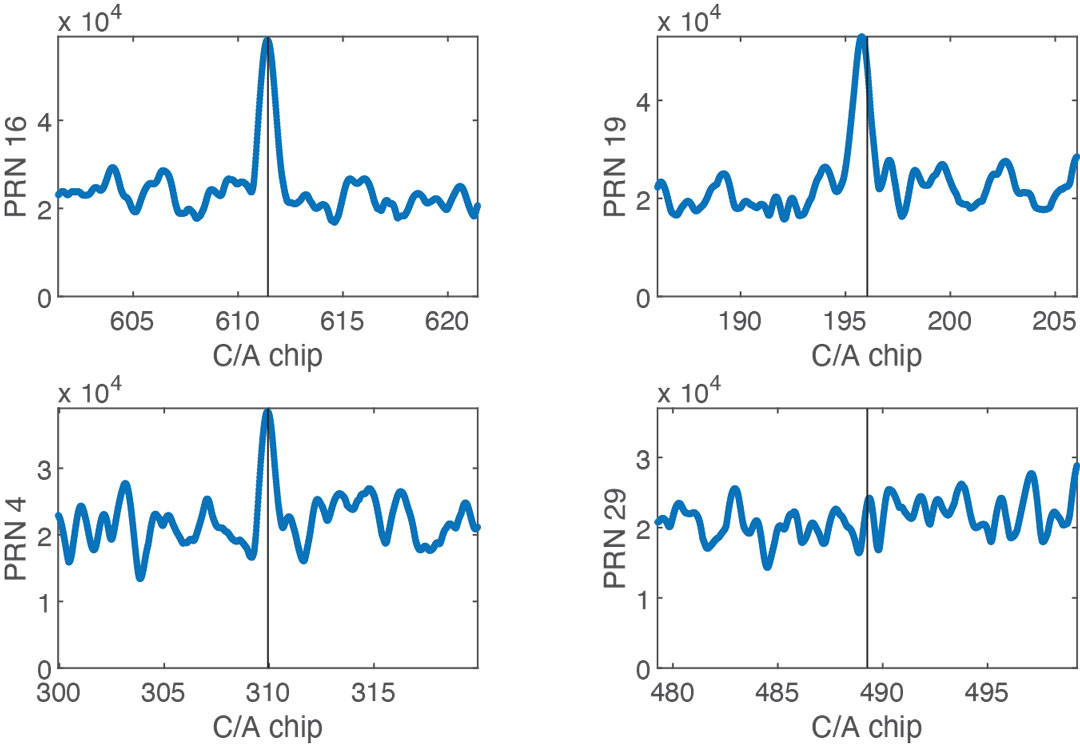
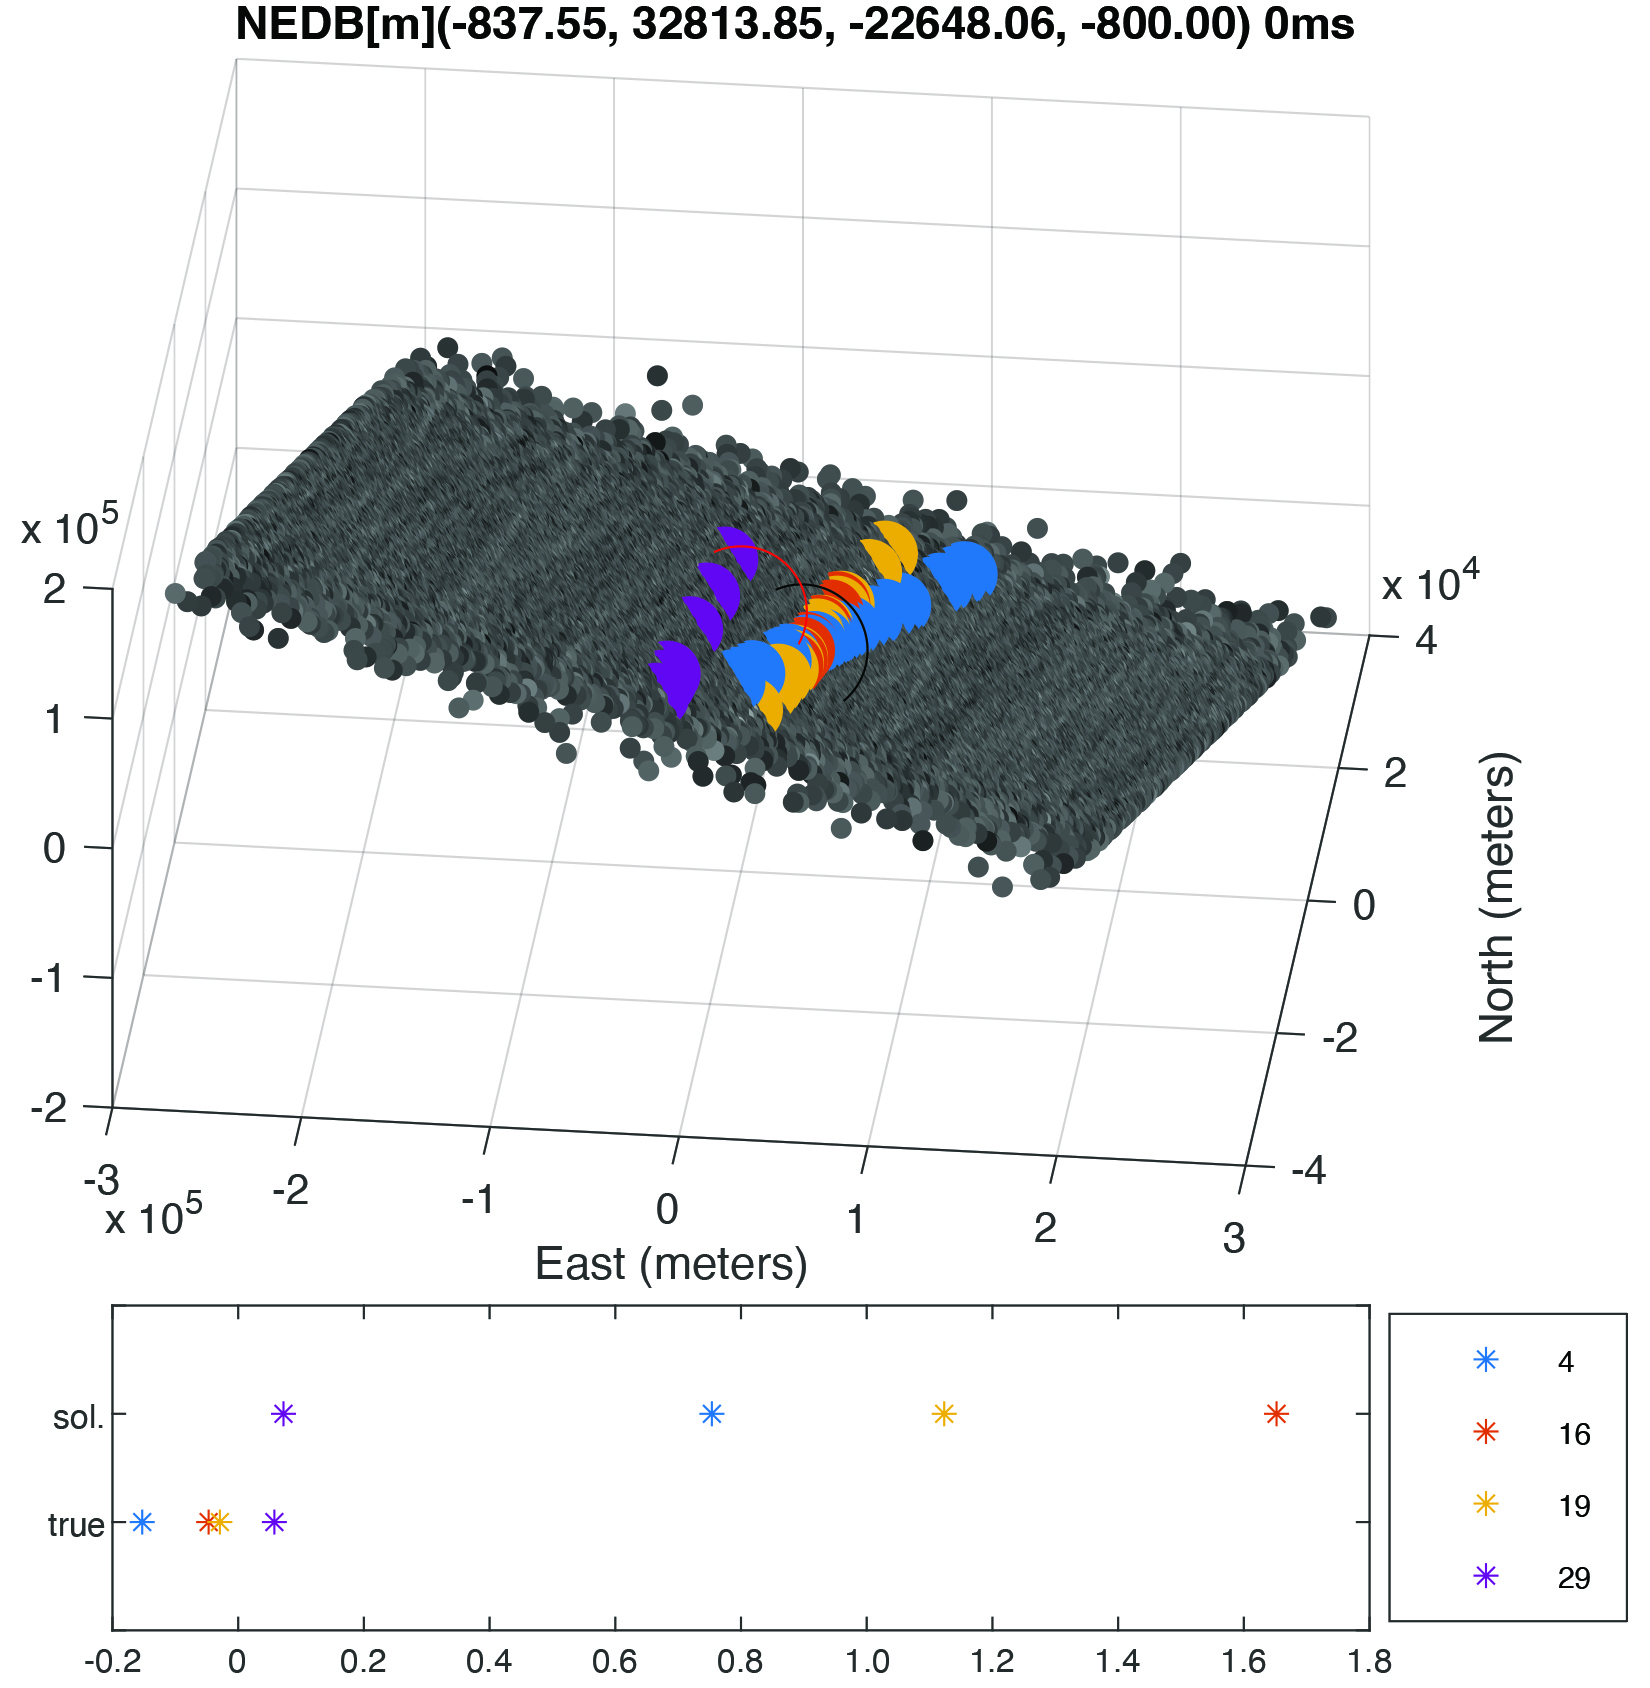
For the final iteration, Figures 9 and 10 depict the solutions with the 10-meter clock bias spacing and the approach of spreading the search space over the dimension perpendicular to the direction of Earth. Again, this was done to illustrate how the peak correlations appear to be drawing close to a single intersection location. However, the results fall short of the type of results shown in the spatial correlogram previously depicted in Figure 2 when many satellite signals were detected.
Figure 9: Acquisition peaks plotted in the time domain with the candidate location chosen at the location of the vertical black line for the detected PRNs for the third iteration of the DPE method.Figure 10: Spatial correlogram with the candidate location chosen at the location of the black circle for the detected PRNs for the third iteration of DPE method. The original TRACE-estimated position is indicated by a red circle. The two positions are approximately 28 kilometers apart.
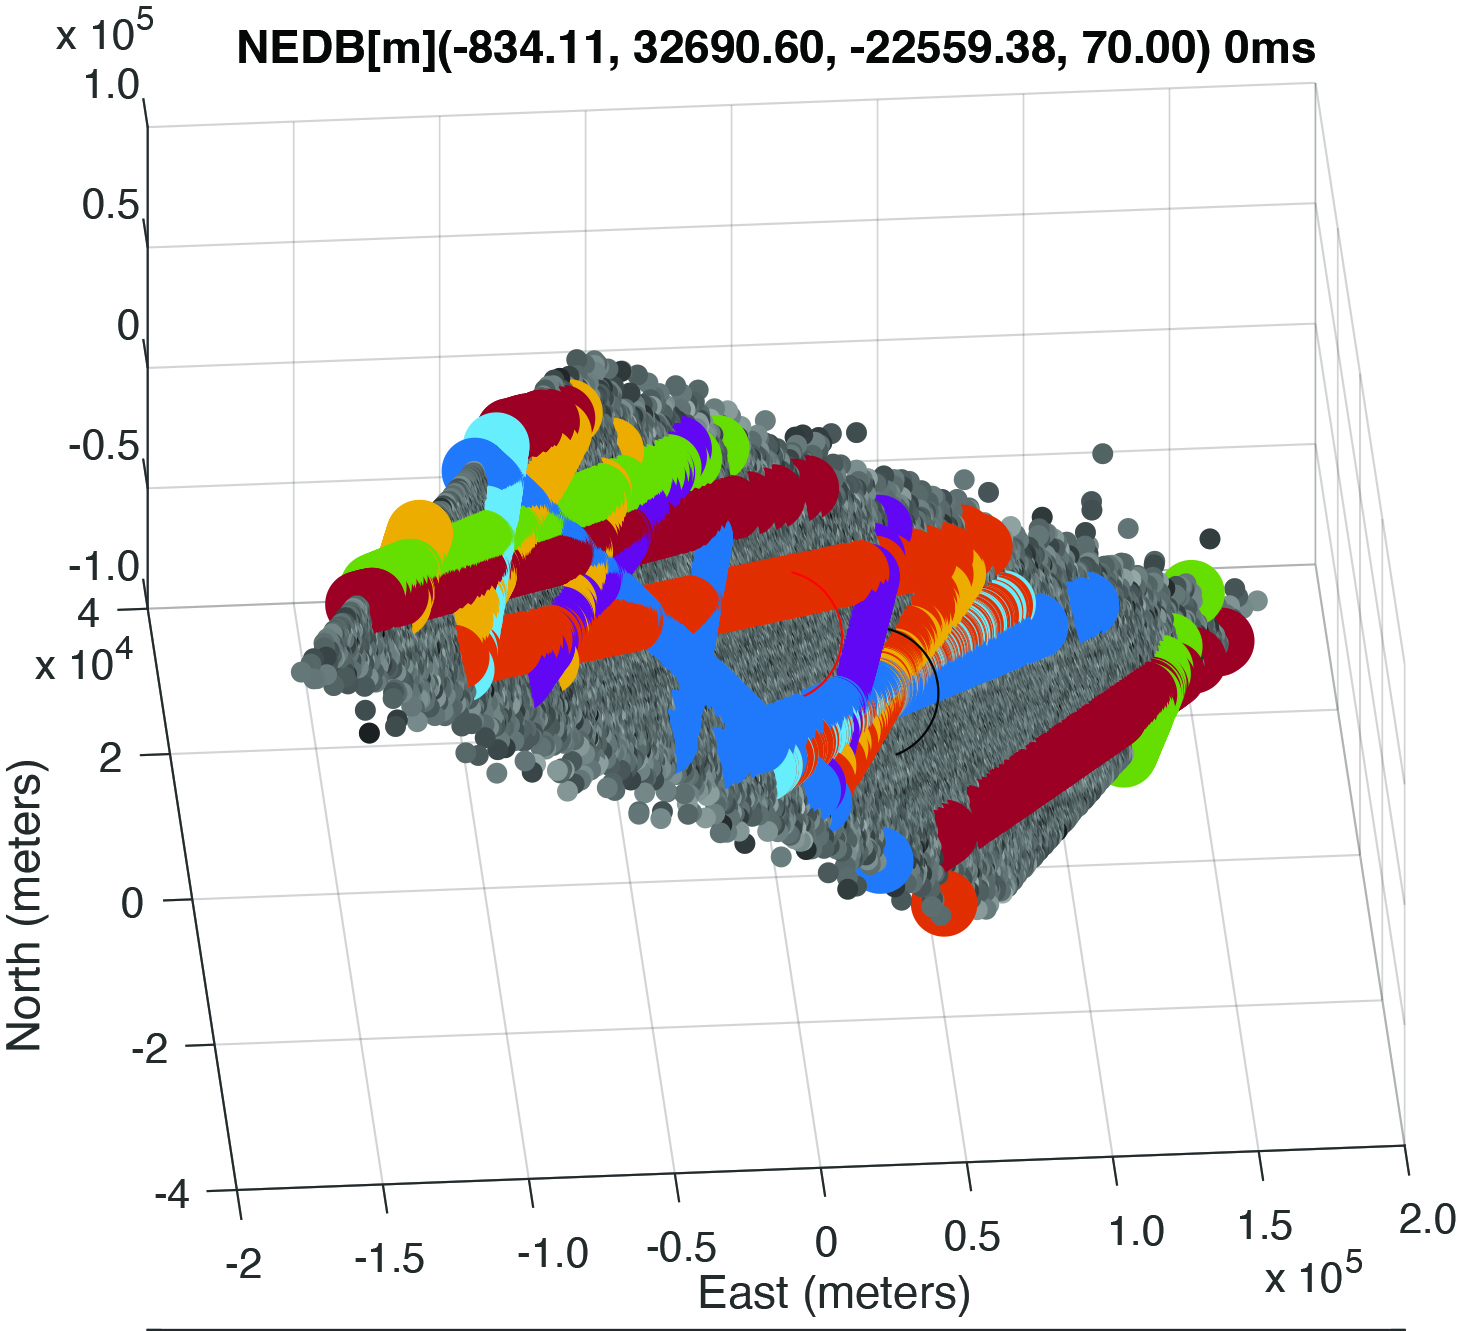
A similar iterative method was followed using not just the four detected PRNs, but any satellite that was predicted to be visible with the relaxed criteria allowing for visibility based on receiving signals from the first and second sidelobes of the antenna. This is predicted using a larger 40° away from the GPS antenna boresight criterion. The final spatial correlogram (Figure 11) shows similar results to the intersections shown in Figure 10. However, there is potentially another PRN shown with a peak contribution near the original intersection point. These results are somewhat inconclusive and will need to be investigated further.
Figure 11: Spatial correlogram with the candidate location chosen at the location of the black circle for the detected PRNs for the third iteration of DPE method using additional satellites. The original TRACE-estimated position is indicated by a red circle. The two positions are approximately 24 kilometers apart.
CONCLUSIONS AND FUTURE WORK
Our research investigated the DPE approach of positioning beyond the GNSS constellations using real data. We will further investigate ways to parameterize our estimated orbit for use within a DPE algorithm in conjunction with other orbit determination techniques (such as filtering) as our results were promising but inconclusive. Some additional methods that may aid in this research include investigating the use of precise SP3 orbit files over the navigation message currently used (BRDC) within our DPE approach. Also, some additional work will need to be completed in determining the possibility of time tagging issues that could result in discrepancies and formulating additional methods related to visibility prediction that could aid in partitioning the search space. Additionally, we plan to investigate other segments where few signals were detected, but where more satellites are predicted to be visible (a better test of DPE). Finally, using full 40-millisecond data segments rather than the 15 milliseconds used to date may provide the additional signal strength needed to give more conclusive results.
ACKNOWLEDGMENTS
This article is based on the paper “Direct Positioning Estimation Beyond the Constellation Using Falcon Gold Data Collected on Highly Elliptical Orbit” presented at ION ITM 2023, the 2023 International Technical Meeting of the Institute of Navigation, Long Beach, California, January 23–26, 2023.
KIRSTEN STRANDJORD is an assistant professor in the Aerospace Engineering Department at the University of Minnesota. She received her Ph.D. in aerospace engineering sciences from the University of Colorado Boulder.
FAITH CORNISH is a graduate student in the Aerospace Engineering Department at the University of Minnesota.
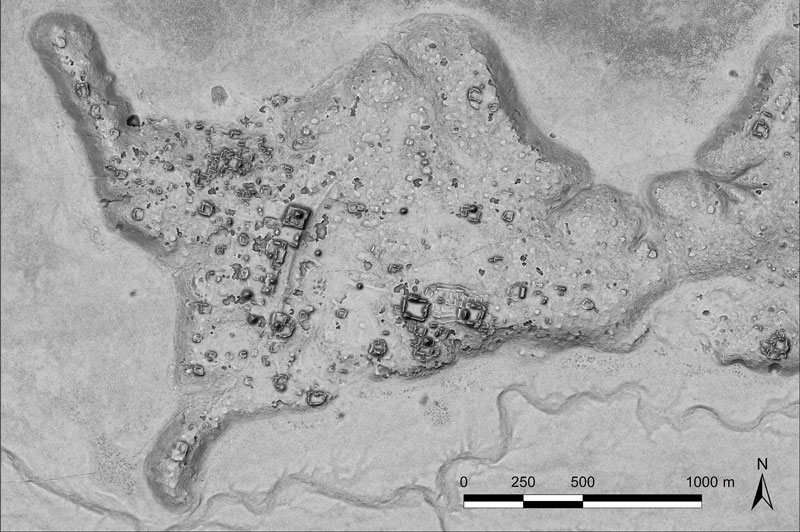
A relief of the ancient Maya site archaeologists are calling Ocomtún. (Image: Žiga Kokalj/ZRC SAZU)
In a biological preserve in Mexico’s Campeche State, a team of archaeologists have documented pyramids, palaces, a ball court and other remains of an ancient city they call Ocomtún, reported the New York Times.
Archeologists surveyed the site for six weeks in May and June, finding 50-foot-tall (15.2-meter-tall) structures resembling pyramids, as well as pottery and Mayan engravings they believe date to between 600 and 900 AD. The team determined the city was likely abandoned more than 1,000 years ago.
Mexico’s National Institute of Anthropology and History (INAH) hailed their findings late last month, saying they discovered the ancient city in “a vast area practically unknown to archaeology.”
“I’m often asked why nobody has come there, and I say, ‘Well, probably because you need to be a little nuts to go there,” said Ivan Sprajc, the survey’s lead archaeologist and a professor at a Slovenian research center, ZRC SAZU. “It’s not an easy job.”
Surveying the area has been revolutionized over the last decade by lidar — allowing researchers to survey densely forested areas that are difficult to explore on foot. Archeologists were able to use airborne lasers to pierce through dense vegetation and reveal the ancient structures and human-modified landscapes beneath.
INAH described the site as having once been a major center of Mayan life. Surrounded by wetlands, Ocomtún includes pyramids, plazas, elite residences and “strange” complexes of structures arranged almost in concentric circles, Dr. Sprajc told CNN.
“For example, we have several very curious architecture complexes of structures which are arranged in almost concentric circles. So, we are only guessing what this could be. Perhaps marketplaces,” he added.
Mexico’s National Institute of Anthropology and Historyteam plans to return next year for further investigation.
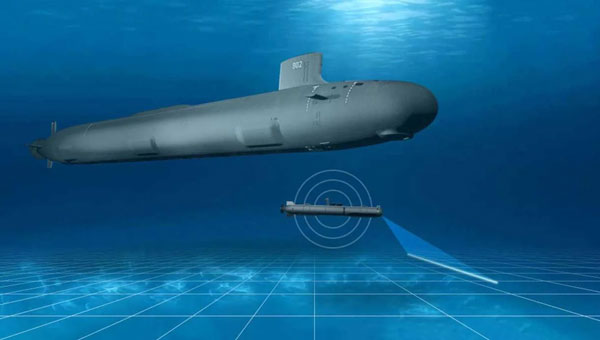
L3Harris has completed a fully autonomous launch and recovery of an autonomous underwater vehicle (AUV) from an underway submarine, referred to as Torpedo Tube Launch and Recovery (TTL&R). The launch used Iver4 AUV technology from L3Harris.
The L3Harris team worked closely with the U.S. Navy to demonstrate AUV launch and recovery through a test program aboard submarines and Navy support vessels.
The recovery of AUVs into an underway submarine allows the host platform to remain covert while the AUV performs surveys and missions in areas inaccessible to the host platform. The AUVs return with data that can be used for tactical and navigational planning — delivering manned and unmanned teaming to a fleet.
According to L3Harris, the company welcomes the continued opportunity to support the Navy in the development of manned and unmanned operational concepts. This capability will increase operational effectiveness and allow SSN-class submarines to serve as an AUV mothership.
Off the coast of Long Island, New York, UAVs are sweeping the ocean patrolling for any danger that may lurk below the water. This follows a recent increase in shark encounters for beachgoers, reported USA Today.
According to George Gorman, the state’s park director in Long Island, there have been five shark bites reported this year as shark season is just beginning.
On July 6, the sighting of a 10-foot shark prompted officials to keep people out of the water at Robert Moses State Park. This is the same Long Island beach that delayed its opening on July 4, after a UAV spotted a school of 50 sand sharks off the coast.
Even if the injuries have not been serious, Gorman and others are concerned by the spike in shark sightings and encounters.
The UAVs conduct three sweeps a day on popular Long Island beaches — once before opening, sometime midday, and a final round before the end of the day.
Cary Epstein, a lifeguard supervisor who pilots UAVs at Jones Beach, explained how UAVs provide additional viewpoints to lifeguards on the beach.
“When you’re up in an elevated lifeguard station or a lifeguard stand, you can see up and you can see out, but you can’t see straight down,” Epstein said. “When we do have sharks that are eating on these fish, it’s very, very clear to us. You could see it, no questions asked.”
Additional state funding has been provided for more advanced UAVs to spot sharks.
New York Governor, Kathy Hochul, recently announced a new program that will provide $1 million toward purchasing 60 new shark-monitoring UAVs. The new devices will build on the enhanced shark safety measures at Long Island state park beaches — including more trained staff, new jet skis, and more buffer zones between swimming areas and fishing areas.
Inertial Labs has been awarded a General Services Administration (GSA) Multiple Award Schedule (MAS) contract. With the contract in place, federal, state and local government agencies will gain streamlined access to Inertial Labs’ products and services.
The GSA Schedule contract aims to simplify the procurement process, allowing government entities to acquire solutions for navigation, positioning and motion-sensing systems. The products and services offered by Inertial Labs cater to a wide range of applications, including unmanned systems, defense, aerospace, transportation and more.
“We are extremely proud to have been awarded a GSA Schedule contract,” Jamie Marraccini, CEO of Inertial Labs said. “We look forward to supporting the critical missions of our government partners and providing them with the advanced technology they require.”