Category: BeiDou

  • Faux signals for real results: Safran Federal Systems

    Faux signals for real results: Safran Federal Systems

    An exclusive interview with Tim Erbes, Technical Director, Safran Federal Systems (formerly Orolia Defense & Security). For more exclusive interviews from this cover story, click here.


    What are currently the key challenges for simulation?

    One of our big challenges is determining what performance requirements are necessary for our users. Often, they can’t determine what the specs need to be. All they know is that they need it to work. “I need this receiver from one company, this IMU from another company, and the simulator I got from you guys to work together and I need the performance to match reality.” It can be very challenging to say, “What are the requirements for the simulator? How accurate does it need to be? What types of things matter in this integration?”

    Often, we’re left trying to figure that out. So, that’s an interesting, maybe unexpected challenge. It’s easy to look at the datasheet and see what some specs are, but it’s a much harder thing to say, “Well, what do you need the specs to be?” So, we’ve been working with our customers to try to nail down some of those specs, particularly with Wavefront. We have some specs on such things as phase alignment and phase stability. But how do you translate that into something like “Well, I just want the CRPA to work the same in the lab as it does in the real world?” There’s not a direct, easy way to do that. We’re in the middle of trying to figure that out. That’s definitely one of our challenges.

    What about the increase in jamming and spoofing threats?

    In the last five years, we’ve seen a lot more open talk about jamming and spoofing in the world. The receiver manufacturers must think about this a lot more. What’s interesting from a simulator point of view is that this is not actually new for us. We have the advantage that we’ve been designing to program requirements for years and they have included jamming and spoofing for years. So, in a way, simulation is ahead of this state of the world. Jamming and spoofing are not new or hard ideas for us. In fact, spoofing is similar to simulation. So, we already know how to do that.

    Image: Safran Federal Systems (formerly Orolia Defense & Security)
    Image: Safran Federal Systems (formerly Orolia Defense & Security)

    However, jamming and spoofing are new to programs and integration labs. So, there might be platforms where they’re now testing against jamming or spoofing requirements where in the past, maybe they didn’t do that. They certainly can use our simulators to help them do that. However, we’re not seeing a lot of new requirements coming to us saying we need new jamming or spoofing capabilities, because we already have them. Luckily, we are future oriented regarding the jamming and spoofing requirements, so those really haven’t been a challenge for us yet.

    That can always change, right? If new requirements come up, such as higher data rates or wider bandwidth waveforms or different types of waveforms, then we would have to adapt and add support for that kind of stuff. As of right now, however, we aren’t really seeing that. So, luckily, we’re prepared for that. As for the industry as a whole, there has definitely been a big movement in the last few years to understand the effects of jamming and spoofing. Simulation is a big part of that.

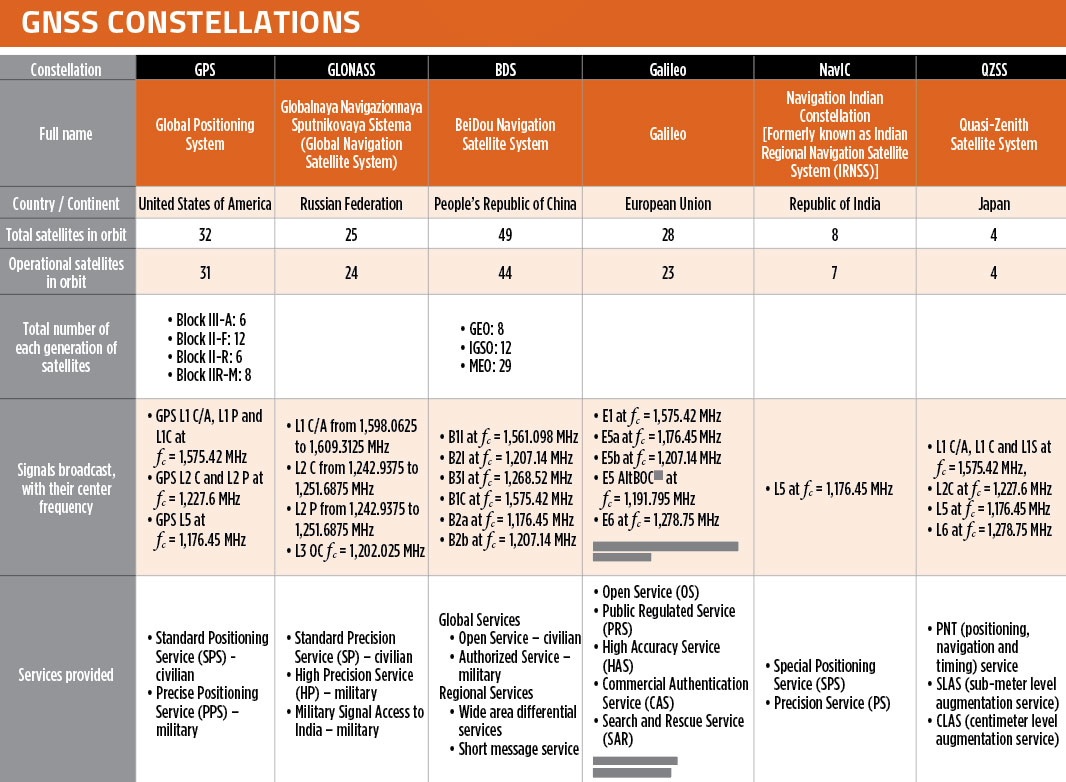
    What about the completion of the BeiDou and Galileo constellations?

    For a long time, we simulated four constellations. Then that began to get fuzzy. Do you consider SBAS a constellation or is that just an augmentation? Do you count EGNOS and other supplemental constellations for the other constellations? What about NavIC and QZSS? Before you know it, you start to lose track of exactly how many you have. We just released our 8th constellation, Xona.We’re going to be demonstrating it at JNC.

    Tell me more about that.

    We are trying to have all the constellations and that can be a fuzzy definition. Does that mean all that are up there right now or all that will be up there in the future? We’re trying to be forward looking and add everything that is going to be up there or might be up there so that lab users can develop and test. Multi-constellation simulation is a particularly challenging problem for groups that don’t have simulators. If you’re just doing research on, say, GPS, and want a new code, you might be able to do that in a lab on your own. But as soon as you say, “I want to do research on whether this LEO constellation helps navigation on a receiver that also uses Galileo and GPS,” suddenly, your research requires a full multi-constellation simulation.
    There are two choices. One is to have a simulator do the constellations that already exist, and then you have some research to add constellations. That can be very challenging, especially with time alignment and things like that. The other is to have a simulator that can do all the constellations. That would be the easy choice, right? That presents a problem with such things as LEO navigation being on the rise and these constellations that are just emerging, that are still not even fully defined.

    So, we’re trying to build those into our simulation products, to help researchers and decision makers determine whether these will be useful features to add to their receivers or their systems. We have the advantage of having a software-defined architecture. We designed the software so that it is easy to add new constellations to it. Basically, once we’re given a proper ICD, we’re only a couple of months away from a first draft implementation of that new signal. Then we iterate. There used to always be a government-driven, multi-year program to develop an ICD. Now, we have this new concept of the signal manufacturers. We’re seeing private companies release signal specs. That’s a very different way of creating a signal in a constellation. So, sometimes you don’t get much time between when the ICD is available and when simulator users want to use that constellation. Having a software-defined architecture really helps us move quickly. We can add such things as Xona very fast.

    Xona told me a couple of days ago that they will soon put out an ICD. What’s the difference between actual signals that you can record and play versus something that’s only on paper?

    That’s a great point. Probably many people don’t realize, when they first look at this, that what’s in the ICD and what’s on live sky are sometimes very different. Is the simulator supposed to match live sky? Or is it supposed to match the intended final state of the constellation, according to the ICD? This is a huge topic for M-Code, which is ever changing, and has a very large ICD that’s been released. Space Systems Command/Military Communications & Position, Navigation, & Timing (MCPNT) controls the features and releases them incrementally. We’re constantly having to make changes to the simulator to match those releases. The same is true for the other ICDs. At the Institute of Navigation Joint Navigation Conference (JNC), we will demonstrate an expanded PRN. I think this showed up in the ICD a couple of years ago, but it’s not used by any users yet. Some of the receiver manufacturers are starting to look at using PRNs beyond 32. So, we’re adding that to the simulator. This has already happened for BeiDou as well. I think their ICD goes up to more than 60 satellites. It’s an ever-changing race. The ICDs are constantly being updated and we’re trying to update the simulator.

    Image: Safran Federal Systems (formerly Orolia Defense & Security)
    Image: Safran Federal Systems (formerly Orolia Defense & Security)

    Meanwhile, live sky is many years behind the paper, right? This creates an interesting challenge: when you design a system, are you designing it for today or for the future? We have users in both groups. We have users that only care about what is happening today, because they need a model. Maybe you want to model a specific mission and you want to make sure that everything’s going to go properly. Or maybe you’re designing a system that you want to release in three or four years, and you want to make sure that it’s going to work with the state of the system then.

    A big challenge is to make sure that we’re keeping pace with all these ICDs. There are more constellations than ever and the technology makes it easier to change signal architectures. We’re seeing signals change faster than we’ve ever seen them change before. We go to conferences and hear about such things as on-orbit reprogramming and signals that might even change specs while they’re being transmitted. Maybe they don’t even have to have a fixed bandwidth or fixed bit rate. We’re going to start talking about signals that can reprogram on the fly. That’s going to make simulation more and more challenging. The technology exists to do this.

    Software-defined waveforms is a very logical step. In the software world, we have this concept of version nightmare. When you have 20 different pieces of software that are interdependent, it can get very challenging. We’re going to start to see that in simulators. We’re going to see, “Hey, what version of navigation authentication are you using? We updated it six months ago. Are you using the new one or the old one? Which one should we use?” Well, it depends on what your receiver is using. It’s going to be interesting and challenging to keep all this straight in the next few years as things evolve. Certainly, however, our goal is to be there for all of it and to be as fast and as forward thinking as we can for our customers. That means that we also need to know what our customers need. So, we’re always looking for feedback and requests, what challenges our customers face and we’re responding to those requests.

    Tell me more about the difference between simulators used by receiver manufacturers in their labs as they’re tweaking receivers or developing new ones vs. simulators used for mission planning.

    The simulators are the same, but they’re used in very different ways. In most lab simulation, what the constellation looks like that day doesn’t matter very much. They can just run with a default constellation for a given day. They’ll run that scenario hundreds or thousands of times and never need to change it because they’re testing parts of the receiver that don’t care a whole lot about the specifics of what’s happening.

    Whereas missions are time- and location-specific.

    Yeah, exactly. They want to know which satellites will be overhead at an exact time and place. It’s not so much a problem anymore, but there used to be certain days and times when you would not get enough satellites in view, or you might have very bad dilution of precision, and your mission might actually fail. We’re past those days. There are now enough satellites up there. Most receivers will navigate within their specs most of the time in most places. However, for critical missions, such as military operations or rocket launches, you might not want to just assume that any day is a good day. So, if you’re about to launch a rocket, you might want to check. “What does the constellation look like right now?” The challenges that brings is that simulators have a default constellation, but the constellations are constantly changing.

    When you’re doing real day mission planning, the big problem isn’t so much how to generate a signal, it’s how to find out what’s happening today. That’s really the nature of the problem because what’s out there today is different from what was happening yesterday or what will happen tomorrow. You might have unhealthy satellites. You need to know that if you want to model them. It becomes a big challenge to get all the right data into the simulator. Once all that data is in there, then it’s the same as any other simulation.

    Are there good sources for current data on GLONASS, BeiDou and Galileo?

    Image: Safran Federal Systems (formerly Orolia Defense & Security)
    Image: Safran Federal Systems (formerly Orolia Defense & Security)

    There are a couple of websites that provide information about where the satellites currently are. However, we’ve found that each one of those sites has its own challenges. Some are maybe 30 minutes out of date, which is pretty good, but puts the satellites in slightly different spots. Some of those sites only support some of the constellations. We’re talking about multiple countries and they don’t all agree on how this should be done. So, there’s not a single point that you can visit to get all the satellite data. There are a couple of companies that try to fix this. U-blox has AssistNow; Qualcomm has an assist for its cellular receivers; Trimble, NovAtel, and a couple of other companies have their error correction services to which you can subscribe to get some of that data.

    If you want real-time up-to-date ephemeris for all the constellations, that is challenging. There are one or two options we have found that seem to work, but they each have their disadvantages. Maybe they don’t have all the satellites. Again, we’re talking about versioning issues. So, if you’ve designed your system with a certain version of an ICD and they’ve added more satellites since, those new SVs maybe aren’t so important for your users, so you don’t publish them. Other users want those satellites. So, we see versioning issues in these data streams. For example, we use the CORS network to get a lot of GPS data but that whole network, as far as I know, is only running the legacy data. As far as I know, no network is distributing the L1C modernized data that we will need at some point. So, as we launch new signals and constellations, we need the networks to provide this new data.

    What are some other challenges?

    For us, being a software-defined simulator on a platform dependent on software-defined radio (SDR), we’re constantly looking at what’s changing in the SDR technology community. There’s always some interesting stuff happening there that we try to incorporate. We don’t have any big announcements this year, as far as new architectures or anything like that. However, the SDR community is evolving. It’s still a rather new industry. A few years ago, we were an early adopter of SDR technology for mass deployment. Now, we’re seeing some more mature SDRs starting to push such things as channel count and coherency. We will probably take advantage of that in the future.

    The other interesting thing technology-wise is that we’re also a GPU-dependent technology. So, as the GPU industry continues to evolve and makes bigger and faster GPUs, we get a relatively low-cost way to upgrade. We don’t have to do a lot of R&D to upgrade to a new GPU. For our users that means that the number of signals they can generate on their simulators is always increasing even using the same hardware from one generation to the next. Our first simulator did 75 signals; the next version did 150. We could build a system that did more than 1,000 signals, but our users don’t need it.

    I assume that the growth curve for GPUs is steeper than that for signals.

    I think that you’re right about that. I’m sure glad they do, because then something like Xona shows up and we don’t have to rearchitect our system to generate 300 signals, right? At JNC we will show expanded PRN, 300 Xona satellites in the constellation, and a 10 fold improvement on Wavefront performance specs.. We will continue to build simulators that meet our customers’ requirements. Besides GPUs, a lot of the technology involves software R&D and signals. The stuff that we do digitally inside of our system that allows us to do things like extremely precise phase alignment on Wavefront, for example. We spent a lot of time developing that stuff.

  • Far Out: Positioning above the GPS constellation

    Far Out: Positioning above the GPS constellation

    Read Richard Langley’s introduction to this article:Innovation Insights: Falcon Gold analysis redux


    Photo:
    Figure 1: Diagram of cis-lunar space, which includes the real GPS sidelobe data collected on an HEO space vehicle. (All figures provided by the authors)

    As part of NASA’s increased interest in returning to the moon, the ability to acquire accurate, onboard navigation solutions will be indispensable for autonomous operations in cis-lunar space (see Figure 1). Artemis I recently made its weeks-long journey to the Moon, and spacecraft carrying components of the Lunar Gateway and Human Landing System are planned to follow suit. During launch and within the GNSS space service volume, space vehicles can depend on the robust navigation signals transmitted by GNSS constellations (GPS, GLONASS, BeiDou, and Galileo). However, beyond this region, NASA’s Deep Space Network (DSN) serves as the system to track and guide lunar spacecraft through the dark regions of cis-lunar space. Increasingly, development of a lunar navigation satellite system (LNSS) that relies on a low size, weight and power (SWaP) “smallSat” constellation is being discussed for various possible orbits such as low lunar orbit (LLO), near rectilinear halo orbit (NRHO) and elliptical frozen orbit (ELFO).

    Figure 2 : DPE 3D (left) and 2D (right) spatial correlogram shown on a 3D north-east grid.
    Figure 2: DPE 3D (left) and 2D (right) spatial correlogram shown on a 3D north-east grid.

    We have implemented direct positioning estimation (or collective detection) techniques to make the most of the limited and weak GPS signals (see Figure 2) that have been employed in other GNSS-degraded environments such as urban canyons. The algorithm used in conventional GNSS positioning employs a two-step method. In the first step, the receiver acquires signals to get a coarse estimate of the received signal’s phase offset. In the second step, the receiver tracks the signals using a delay lock loop coupled with a phase or frequency lock loop. The second step enables the receiver to get fine measurements, ultimately used to obtain a navigation solution. In the scenario addressed in our work, where a vehicle is navigating beyond the GPS satellite constellation, the signals are weak and sparse, and a conventional GPS receiver may not be able to acquire or maintain a lock on a satellite’s sidelobe signals to form a position solution. For a well-parameterized region of interest (that is, having a priori knowledge of the vehicle orbital state through dynamic filtering), and if the user’s clock error is known within a microsecond, a direct positioning estimator (DPE) can be used to improve acquisition sensitivity and obtain better position solutions. DPE works by incorporating code/carrier tracking loops and navigation solutions into a single step. It uses a priori information about the GPS satellites, user location, and clocks to directly estimate a position solution from the received signal. The delay-Doppler correlograms are first computed individually for the satellites and are then mapped onto a grid of possible candidate locations to produce a multi-dimensional spatial correlogram. By combining all signals using a cost function to determine the spatial location with the most correlation between satellites, the user position can be determined. As mentioned, signals received beyond the constellation will be sparse and weak, which makes DPE a desirable positioning method.

    BACKGROUND

    The proposed techniques draw from several studies exploring the use of weak signals and provide a groundwork for developing robust direct positioning methods for navigating beyond the constellation. NASA has supported and conducted several of the studies in developing further research into the use of signals in this space.

    A study done by Kar-Ming Cheung and his colleagues at the Jet Propulsion Laboratory propagates the orbits of satellites in GPS, Galileo, and GLONASS constellations, and simulates the “weak GPS” real-time positioning and timing performances at lunar distance. The authors simulated an NRHO lunar vehicle based on the assumption that the lunar vehicle is in view of a GNSS satellite as long as it falls within the 40-degree beamwidth of the satellite’s antenna. The authors also simulate the 3D positioning performance as a function of the satellites’ ephemeris and pseudorange errors. Preliminary results showed that the lunar vehicle can see five to 13 satellites and achieve a 3D positioning error (one-sigma) of 200 to 300 meters based on reasonable ephemeris and pseudorange error assumptions. The authors also considered using relative positioning to mitigate the GNSS satellites’ ephemeris biases. Our work differs from this study in several key ways, including using real data collected beyond the GNSS constellations and investigating the method of direct positioning estimation for sparse signals.

    Luke Winternitz and colleagues at the Goddard Space Flight Center described and predicted the performance of a conceptual autonomous GPS-based navigation system for NASA’s planned Lunar Gateway. The system was based on the flight-proven Magnetospheric Multiscale (MMS) GPS navigation system augmented with an Earth-pointed high-gain antenna, and optionally, an atomic clock. The authors used high-fidelity simulations calibrated against MMS flight data, making use of GPS transmitter patterns from the GPS Antenna Characterization Experiment project to predict the system’s performance in the Gateway NRHO. The results indicated that GPS can provide an autonomous, real-time navigation capability with comparable, or superior, performance to a ground-based DSN approach using eight hours of tracking data per day.

    In direct positioning or collective detection research, Penina Axelrad and her colleagues at the University of Colorado at Boulder and the Charles Stark Draper Laboratory explored the use of GPS for autonomous orbit determination in geostationary orbit (GEO). They developed a novel approach for directly detecting and estimating the position of a GEO satellite using a very short duration GPS observation period that had been presented and demonstrated using a hardware simulator, radio-frequency sampling receiver, and MATLAB processing.

    Ultimately, these studies and more have directed our research in exploring novel methods for navigating beyond the constellation space.

    DATA COLLECTION

    The data we used was collected as part of the U.S. Air Force Academy-sponsored Falcon Gold experiment and the data was also post-processed by analysts from the Aerospace Corporation. A few of the key notions behind the design of the experiment was to place an emphasis on off-the-shelf hardware components. The antenna used on board the spacecraft was a 2-inch patch antenna and the power source was a group of 30 NiMH batteries. To save power, the spacecraft collected 40-millisecond snapshots of data and only took data every five minutes. The GPS L1 frequency was down-converted to a 308.88 kHz intermediate frequency and was sampled at a low rate of 2 MHz (below the Nyquist rate) and the samples were only 1- bit wide. Again, the processing was designed to minimize power requirements.

    METHODS AND SIMULATIONS

    To test our techniques, we used real data collected from the Falcon Gold experiment on a launch vehicle upper stage (we’ll call it the Falcon Gold satellite) which collected data above the constellation on a HEO orbit. The data collected was sparse, and the signals were weak. However, the correlation process has shown that the collected data contained satellite pseudorandom noise codes (PRNs). Through preliminary investigation, we find that the acquired Doppler frequency offset matches the predicted orbit of the satellite when propagated forward from an initial state. The predicted orbit of the satellite was derived from the orbital parameters estimated using a batch least-squares fit of range-rate measurements using Aerospace Corporation’s TRACE orbit-determination software. The propagation method uses a Dormand-Prince eighth-order integration method with a 70-degree, first-order spherical harmonic gravity model and accounting for the gravitation of the Moon and Sun. The specifics of this investigation are detailed below.

    Figure 3: GPS constellation “birdcage” (grey tracks), with regions of visibility near the GPS antenna boresight in blue and green for the given line-of-sight from the Falcon Gold satellite along its orbit (orange).
    Figure 3: GPS constellation “birdcage” (grey tracks), with regions of visibility near the GPS antenna boresight in blue and green for the given line-of-sight from the Falcon Gold satellite along its orbit (orange).

    The positions of the GPS satellites are calculated using broadcast messages (combined into so-called BRDC files) and International GNSS Service (IGS) precise orbit data products (SP3 files). GPS satellites broadcast signals containing their orbit details and timing information with respect to an atomic clock. Legacy GPS signals broadcast messages contain 15 ephemeris parameters, with new parameters provided every two hours. The IGS supports a global network of more than 500 ground stations, whose data is used to precisely determine the orbit (position and velocity in an Earth-based coordinate system) and clock corrections for each GNSS satellite. These satellite positions, along with the one calculated for the Falcon Gold satellite, allowed for the simulation of visibility conditions. In other words, by determining points along the Falcon Gold satellite trajectory, we determine whether the vehicle will be within the 50° beamwidth of a GPS satellite that is not blocked by Earth.

    Figure 3 shows a plot rendering of the visibility conditions of the Falcon Gold satellite at a location along its orbit to the GPS satellite tracks. Figure 4 depicts three of the 12 segments where signals were detected and compares the predicted visibility to the satellites that were actually detected. A GPS satellite is predicted to be visible to the Falcon Gold satellite if the direct line-of-sight (DLOS) is not occluded by Earth and if the DLOS is within 25° of the GPS antenna boresight (see Figure 5).

    Figure 4: Predicted visibility of direct line-of-sight to each GPS satellite where a blue line indicates the PRN is predicted to be visible but undetected. A green line is predicted to be visible and was detected, and a red line indicates that the satellite is predicted to not be visible, but was still detected.
    Figure 4: Predicted visibility of direct line-of-sight to each GPS satellite where a blue line indicates the PRN is predicted to be visible but undetected. A green line is predicted to be visible and was detected, and a red line indicates that the satellite is predicted to not be visible, but was still detected.
    Figure 5: Depiction of the regions of a GPS orbit where the Falcon Gold satellite could potentially detect GPS signals based on visibility.
    Figure 5: Depiction of the regions of a GPS orbit where the Falcon Gold satellite could potentially detect GPS signals based on visibility.

    As a preliminary step to evaluate the Falcon Gold data, we analyzed the Doppler shifts that were detected at 12 locations along the Falcon Gold trajectory above the constellation. By comparing the Doppler frequency shifts detected to the ones predicted by calculating the rate of change of the range between the GPS satellites and modeled Falcon Gold satellite, we calculated the range rate root-mean-square error (RMSE). Through this analysis, we were able to verify the locations on the predicted trajectory that closely matched the detected Doppler shifts.

    These results are used to direct our investigations to regions of the dataset to parameterize our orbit track in a way to effectively search our delay and Doppler correlograms to populate our spatial correlograms within the DPE. Figure 6 shows the time history of the difference of predicted range rates on the trajectory and the detected range rates on the trajectory. That is, a constant detected range rate value is subtracted from a changing range rate for the duration of the trajectory and not just at the location on the trajectory at the detect time (dashed vertical line). From this we can see that the TRACE method gives range rates near the detected ranges at the approximate detection time for the 12 different segments.

    Figure 6: Plots depicting the 12 segments of detection and the corresponding time history of differences of range-rate values for each GPS PRN detected. The time history is of the range-rate difference between the predicted range rate from the TRACE-estimated trajectory and the constant detected range rate at the detection time (vertical line).
    Figure 6: Plots depicting the 12 segments of detection and the corresponding time history of differences of range-rate values for each GPS PRN detected. The time history is of the range-rate difference between the predicted range rate from the TRACE-estimated trajectory and the constant detected range rate at the detection time (vertical line).

    Excluding Segment 12, which was below the MEO constellation altitude, Segment 6 has more detected range rates than that of the other segments. On closer inspection of this segment, and using IGS precise orbit data products, it appears that the minimum RMSE of the range rates from the detected PRNs is off from the reported detection time by several seconds (see Figure 7). Investigating regions along the Falcon Gold TRACE-estimated trajectory and assuming a mismatch in time tagging results in a location (in Earth-centered Earth-fixed coordinates) with a lower RMSE for the predicted range rates compared to detected range rates.

    Figure 7: Range-rate difference between the predicted range rate from the TRACE-estimated trajectory and the constant detected range rate at the detection time (left). A portion of the trajectory around Segment 6 with the TRACE-estimated location at the time of detection (red) and the location with the minimum RMSE of range rate (black).
    Figure 7: Range-rate difference between the predicted range rate from the TRACE-estimated trajectory and the constant detected range rate at the detection time (left). A portion of the trajectory around Segment 6 with the TRACE-estimated location at the time of detection (red) and the location with the minimum RMSE of range rate (black).

    To determine the search space for the DPE, we first determine the location along the original TRACE-estimated trajectory with the minimum RMSE of range rates for each segment. Then we propagate the state (position and velocity) at the minimum location to the Segment 6 time stamp. If the time segment has more than three observed range rates (Segment 6 and Segment 12), we perform a least squares velocity estimate using the range-rate measurements, using the locations along the trajectory and selecting the location with the smallest RMSE. Then, for Segment 12, the position and velocity obtained from least squares is propagated backwards in time to the Segment 6 timestamp. All of these points along the trajectory as well as the original point from the TRACE estimated trajectory are used in a way similar to the method of using a sigma point filter. Specifically, the mean and covariance of the position and velocity values are used to sample a Gaussian distribution. This distribution will serve as the first iteration of the candidate locations for DPE. There were a total of three iteration steps and at each iteration the range of clock bias values over which to search was refined from a spacing of 1,000 meters, 100 meters, and 10 meters. Also on the third iteration, the sampled Gaussian distribution was resampled with 1,000 times the covariance matrix values in the directions perpendicular to the direction to Earth. This was done to gain better insight into the GPS satellites that were contributing to the DPE solution.

    RESULTS

    Figure 8 shows the correlation peaks for each of the signals reported to be detected using a 15-millisecond non-coherent integration time within the DPE acquisition. Satellite PRNs 4, 16 and 19 are clearly detected. Satellite PRN 29 is less obviously detected, but the maximum correlation value is associated with the reported detected frequency. However, this is the peak detected frequency only if the Doppler search band is narrowly selected around the reported detected frequency. Similarly, while the peak code delay shows a clear acquisition peak for PRNs 4, 16 and 19, for PRN 29 the peak value for code delay is more ambiguous with many peaks of similar magnitude of correlation power. Figure 8 depicts the regions around the max peak correlation chip delay.

    Figure 8: Acquisition peak in frequency (left) and time (right) for PRN 4, 16, 19 and 29. The correlograms are centered on the frequency predicted from the range rate calculated along the trajectory.
    Figure 8: Acquisition peak in frequency (left) and time (right) for PRN 4, 16, 19 and 29. The correlograms are centered on the frequency predicted from the range rate calculated along the trajectory.

    For the first iteration of DPE, the peak coordinated acquisition values for PRN 16 and PRN 4 are chosen for the solution space. From the corresponding spatial correlogram, the chosen candidate solution is roughly 44 kilometers away from the original position estimated using TRACE.
    For the second iteration of DPE, the clock bias is refined to search over a 100-meter spacing. The peak values for PRN 16 and PRN 19 are chosen for the solution space and the chosen candidate solution is roughly 38 kilometers away from the original position estimated using TRACE.
    For the final iteration, Figures 9 and 10 depict the solutions with the 10-meter clock bias spacing and the approach of spreading the search space over the dimension perpendicular to the direction of Earth. Again, this was done to illustrate how the peak correlations appear to be drawing close to a single intersection location. However, the results fall short of the type of results shown in the spatial correlogram previously depicted in Figure 2 when many satellite signals were detected.

    Figure 9: Acquisition peaks plotted in the time domain with the candidate location chosen at the location of the vertical black line for the detected PRNs for the third iteration of the DPE method.
    Figure 9: Acquisition peaks plotted in the time domain with the candidate location chosen at the location of the vertical black line for the detected PRNs for the third iteration of the DPE method.
    Figure 10: Spatial correlogram with the candidate location chosen at the location of the black circle for the detected PRNs for the third iteration of DPE method. The original TRACE-estimated position is indicated by a red circle. The two positions are approximately 28 kilometers apart.
    Figure 10: Spatial correlogram with the candidate location chosen at the location of the black circle for the detected PRNs for the third iteration of DPE method. The original TRACE-estimated position is indicated by a red circle. The two positions are approximately 28 kilometers apart.

    A similar iterative method was followed using not just the four detected PRNs, but any satellite that was predicted to be visible with the relaxed criteria allowing for visibility based on receiving signals from the first and second sidelobes of the antenna. This is predicted using a larger 40° away from the GPS antenna boresight criterion. The final spatial correlogram (Figure 11) shows similar results to the intersections shown in Figure 10. However, there is potentially another PRN shown with a peak contribution near the original intersection point. These results are somewhat inconclusive and will need to be investigated further.

    Figure 11: Spatial correlogram with the candidate location chosen at the location of the black circle for the detected PRNs for the third iteration of DPE method using additional satellites. The original TRACE-estimated position is indicated by a red circle. The two positions are approximately 24 kilometers apart.
    Figure 11: Spatial correlogram with the candidate location chosen at the location of the black circle for the detected PRNs for the third iteration of DPE method using additional satellites. The original TRACE-estimated position is indicated by a red circle. The two positions are approximately 24 kilometers apart.

    CONCLUSIONS AND FUTURE WORK

    Our research investigated the DPE approach of positioning beyond the GNSS constellations using real data. We will further investigate ways to parameterize our estimated orbit for use within a DPE algorithm in conjunction with other orbit determination techniques (such as filtering) as our results were promising but inconclusive. Some additional methods that may aid in this research include investigating the use of precise SP3 orbit files over the navigation message currently used (BRDC) within our DPE approach. Also, some additional work will need to be completed in determining the possibility of time tagging issues that could result in discrepancies and formulating additional methods related to visibility prediction that could aid in partitioning the search space. Additionally, we plan to investigate other segments where few signals were detected, but where more satellites are predicted to be visible (a better test of DPE). Finally, using full 40-millisecond data segments rather than the 15 milliseconds used to date may provide the additional signal strength needed to give more conclusive results.

    ACKNOWLEDGMENTS

    This article is based on the paper “Direct Positioning Estimation Beyond the Constellation Using Falcon Gold Data Collected on Highly Elliptical Orbit” presented at ION ITM 2023, the 2023 International Technical Meeting of the Institute of Navigation, Long Beach, California, January 23–26, 2023.


    KIRSTEN STRANDJORD is an assistant professor in the Aerospace Engineering Department at the University of Minnesota. She received her Ph.D. in aerospace engineering sciences from the University of Colorado Boulder.

    FAITH CORNISH is a graduate student in the Aerospace Engineering Department at the University of Minnesota.

  • China’s BeiDou, GPS and great power competition

    China’s BeiDou, GPS and great power competition

    China’s BeiDou GNSS is newer, has more features, is more accurate, and has more satellites in the skies of more nations than the venerable U.S. GPS, according to Sarah Sewall, Executive Vice President for Strategic Issues at IQT.

    Photo:
    Image: BeiDou program

    More than that, it is one example of “a new form of great power competition that most in the U.S. government don’t recognize,” she said. China is providing superior precision, navigation, and timing information to enhance its diplomatic, economic and military power and the United States cannot afford to cede this area of longstanding advantage.

    In a recent paper published by Harvard’s Belfer Center for Science and International Affairs, “China’s BeiDou: New Dimensions of Great Power Competition,” Sewall and co-authors Tyler Vandenburg and Kaj Malden outline their finding that China’s version of GPS is part of a longstanding effort to join the technological ranks of leading nations and leverage its capabilities to achieve geopolitical advantage in many areas.

    “First, the global reach of BeiDou ensures that the Peoples’ Liberation Army is no longer dependent on another nation’s satnav. China’s economy — and those of other nations relying on BeiDou — can continue to function even if GPS is degraded or denied,” Sewall stated. “This may increase Beijing’s incentives to attack other national satellite capabilities.”

    “BeiDou is also an economic driver for the Chinese economy and innovation. The output of China’s commercial space and navigation services industry has increased by tens of billions in the last decade, and new applications such as precision agriculture and self-driving cars show no sign of slowing,” Sewall continued.

    The focus of Sewall’s paper, though, is the way BeiDou supports China’s Belt and Road and Digital Silk Road initiatives to gain influence and leverage around the world. She points out that in cases where BeiDou provides the most accurate positioning, navigation, and timing (PNT) data, particularly in the global south, China may be able to hold much of another nation’s economy hostage.

    The BeiDou constellation has more satellites than GPS or any other system. It also has more than ten times the monitoring stations in other countries than have been deployed for GPS. As a result, in many places, particularly in the developing world, BeiDou’s accuracy is much better.

    Her assessment of BeiDou’s technical superiority received some unexpected support recently from a government advisory board on GPS. It reported that “GPS’s capabilities are now substantially inferior to those of China’s BeiDou,” and urged the administration to regain U.S. leadership in the field.

    Being newer and more advanced makes it easier for China to encourage other nations to use BeiDou signals and purchase specialized equipment, especially when equipment purchases are heavily subsidized by the Chinese government.

    This is important because systems such as GPS and BeiDou provide more than just directions to the nearest coffee shop. Their precise PNT signals are used for everything from synchronizing cellphone networks and industrial machine controls, to time stamping financial transactions, and coordinating electrical grids. GPS has been called “the silent utility” because signals are used in almost every technology.

    “It is very difficult for government leaders in the developing world to turn down discounted infrastructure and opportunities for economic development,” Sewall said. “Even if they know that tying that infrastructure to Chinese signals may give the CCP [Chinese Communist Party] a future on/off switch to their economies.”

    The West and the United States in particular, faces challenges confronting China’s efforts with BeiDou, according to Sewall.

    “Many in government equate national power with military power, but that’s a narrow and insufficient formulation, particularly in the 21st century,” Sewall said. “American officials under appreciate China’s efforts to create commercial technology dependencies abroad. The United States has left a vacuum in the developing world that our industry is seemingly unable to fill in the face of competition from Chinese firms that are heavily supported by their government.”

    Sewall describes a Chinese “tech stack” being exported that include BeiDou services as part of Belt and Road and Digital Silk Road. It is comprised of a hierarchy of equipment that includes network cables, servers, and cell phones.

    “We don’t really have a democratic approach to help foreign nations make meaningful technology choices. We risk ceding global infrastructure to China if we fail to help Western firms offer their own integrated products and services to the developing world,” she said.

    If we recognized this new form of great power competition, America could easily leap frog China in areas such as satellite navigation, said Patrick Diamond, a member of the President’s Advisory Board on GPS.

    “We could provide higher accuracy GPS and make signals much more secure though internet delivered authentication,” Diamond said. “We could offer complementary terrestrial systems to GPS that would give other nations their own sovereign source of precise time and location while at the same time cooperating with our signals from space.”

    “Competing effectively with China in the coming decades will require Americans to think more holistically,” Sewall said, “from realizing that GPS is not just about the military and space, to understanding that national power is more than the ability to prosecute war.”

  • China threatens U.S. GNSS dominance

    China threatens U.S. GNSS dominance

    Photo:
    Image: Nikada/E+/Getty Images

    A report by CNBC — based on a paper published by Harvard’s’ Belfer Center for Science and International Affairs and written by Sarah Sewall — noted a growing concern that China’s BeiDou is technologically superior to GPS and serves much of the population better.

    Experts in the CNBC report explained that BeiDou supports China’s military ambitions, has spurred economic growth in the country, and has increased its diplomatic leverage.

    The first BeiDou satellite was launched in 2000 and served only mainland China. The system now consists of 45 operational satellites with 30 of them being the latest generation BDS-3 satellites.

    Image: Bedou.gov
    Image: Bedou.gov

    In 2020, China launched the last BeiDou satellite, completing the constellation. Since then, the influence of BeiDou has grown, with an estimated 1.1 billion people now using the system.

    One feature in the latest BeiDou satellites is two-way messaging that is mainly available in China and requires special chips that are not widely available in the consumer market. It enables users to send short messages in areas without ground network cell coverage and can be used for search and rescue operations.

    Surveillance fears

    The CNBC report noted the fear that, with its enhancements, the BeiDou system could be used as a surveillance device — as the two-way messaging feature reveals a user’s locations as well as other types of data.

    Additionally, with the growing number of apps for cellphones and an increase in autonomous vehicles that use the BeiDou system, more and more user data is being transmitted.

    The bottom line

    Satellites in the United States’ GPS constellation do not yet have those kinds of features.

    There are 31 operational GPS satellites, 6 of which are GPS III satellites.

    Image: GPS.gov
    Image: GPS.gov

    GPS satellite modernization 

    In 2008 Lockheed Martin beat out Boeing — the manufacturer of older GPS satellites — to build the GPS III satellites, the last of which was delivered in February. GPS III satellites deliver enhanced performance through a variety of improvements, including increased signal protection with improved accuracy.

    GPS III SV07, SV08, SV09 and SV10 (SV stands for “space vehicle”) are awaiting launch at Lockheed Martin’s GPS III processing facility in Waterton, Colorado.

    Lockheed Martin is now working on 22 GPS IIIF satellites — contracted in 2018 — that will feature more advanced capabilities. These satellites are expected to launch in 2026.

    The U.S. Space Force exercised its second contract option valued at approximately $737 million for the procurement of three additional GPS IIIF space vehicles from Lockheed Martin on Oct. 22, 2021. This contract option is for GPS IIIF satellites 15, 16 and 17 (SV15-17).

    The entire fleet of GPS satellites is expected to be modernized in 2032 or 2033. However, for now, President Biden’s National Space-Based Positioning Navigation, and Timing (PNT) Advisory Board recognizes the need for a resilient national PNT architecture and acknowledges that BeiDou is technologically superior to GPS.

  • PNT by Other Means: Oxford Technical Solutions

    PNT by Other Means: Oxford Technical Solutions

    An exclusive interview with Paris Austin, Head of Product – New Technology, Oxford Technical Solutions. For more exclusive interviews from this cover story, click here.


    What are your title and role?

    I’m the head of product for core technology at OxTS. My role now is focused on R&D innovation. So, the research side, developing prototypes and taking new technology to market effectively. One of the key things we’re examining is GNSS-denied navigation: how we can improve our inertial navigation system via other aiding sources and what other aiding sensors can complement the IMU or inertial measurement unit to give you good navigation in all environments. Use GNSS when it’s good, don’t rely on it when it’s bad or completely absent.

    We rely increasingly on GNSS but are also increasingly aware of its weaknesses and vulnerabilities. What do you see as the main challenges?

    Excessive reliance on anything leads to people exploiting it, which is where the spoofing, the jamming, and the intentional denial come in. We all rely on technology nowadays to do all our menial tasks; then, if we lose the technology, we don’t have the skills to do the task ourselves and we’re in trouble. Reliance on a mass global scale on GNSS is a good and a bad thing. It is good for technology because costs come down. Access to GNSS data is increasingly easy and devices that use it are increasingly cost-effective. But if your commercial, industrial, or military operations rely too much on that one sensor, they can fall over. That’s where complementary PNT comes in: if you can put your eggs in other baskets, so that you have that resilience or redundancy, then you can continue your operation — be it survey, automotive or industrial — even if GNSS falls or is intermittently unavailable or unavailable for a long period of time.

    However, you can fully replace a GNSS only with another GNSS.

    You cannot replace GNSS with anything that has all the pros and none of the cons. You could use something like lidar or an IMU to navigate relative to where you started. However, you would not know where you are in the world without reference to a map, which would have been made with respect to GNSS global coordinates. The best thing you can do is use things with GNSS to plug the gaps or rely less on it periodically in the sense of having multiple updates per second and be able to at least start with a global reference, then navigate relative to that for a period of time and then get another global update. Then you can navigate in between either via dead reckoning or local infrastructure that is being referenced with respect to the global frame. That way, you can transition between GNSS and localized aiding without any dropouts in your operation or your functionality without relying on completely clean GNSS data all the time.

    As you say, you can’t replace it. If you do claim to be breaking free from GNSS you’re really playing a different game and just describing it in a way that sounds as good as GNSS, but in reality you’re saying, “I can navigate in this building but I don’t know where this building is” until you start saying, “Well, I’ve referenced it with respect to a survey point that used a GNSS survey pole.” At that point, you’re not breaking free from GNSS, you’re just using it differently.

    INS-GNSS integration has been around for a long time and the two technologies are natural partners because each one compensates for the other’s weaknesses. What have been some of the key recent developments in that integration?

    The addition of new GNSS constellations has helped a lot because you need four satellites for a position or time lock and six satellites to get RTK. What previously were 12 to 14 satellites from GPS and GLONASS visible at any one time have doubled with the addition of Galileo and BeiDou. So, your requirement for six satellites at any one time has become a much more reasonable proposition in terms of maintaining that position lock in the first place. Meanwhile, IMU sensors have been coming down in price. So, you can make a more cost-effective IMU than ever, or you can spend the same and get a much better sensor than you ever could before. Your period between the GNSS updates is also less noisy and you have less random walk and more stability.

    With less drift you can also go for longer periods without re-initializing your IMU.

    Yeah, exactly. Your dead reckoning period can go longer, while still taking advantage of tight coupling wherein you use the ambiguity area of the IMU to reduce the search area for the satellites. So, a better IMU means that you can use GNSS more readily when you go under a bridge or go through a tunnel. You can lock on to satellites quicker again because of the advancements that have been made with the IMU technology.

    What have been some of the key advances in IMU technology in the last five or ten years?

    With GNSS receivers, the market has become more competitive, there are now more options than ever before. People being disruptive in the space has allowed us to use lower cost sensors for the same performance or mix and match gyroscopes and accelerometers to get the best IMU complementary level. Previously, you may have had an accelerometer that far outweighed the performance level of the gyroscope. So, you would have very good velocity drift over time. But if you’re heading drifts, you still end up in the wrong place when you haven’t had GNSS for a while.

    So, that’s allowed us to pick a much more complementary combination of sensors and producing an IMU that we manufacture and calibrate ourselves, while using off-the-shelf gyroscopes and accelerometers. That allows us to make an IMU that is effectively not bottlenecked in any one major area. I think previously, with IMUs, you took what you could get and some of that technology was further ahead than other. So, it’s a good thing for us because the sensors that we’re getting do not cause single-source bottlenecks and we can achieve higher level of performance than we ever could, without having to significantly increase our prices.

    The way we’ve always seen it, either you add features or performance level and maintain the price, because the technology is maturing over time, or you disruptively lower your price with the same technology. On occasion, we have done that in the survey space. That’s where the performance level requirements are far tighter because people are moving from static survey using GNSS, where they’re used to millimeter-level surveys, into the mobile mapping space, where they still rely entirely on RTK GNSS.

    However, they also rely on high accuracy heading, pitch, and roll to georeference points from a lidar scan at a distance instead of only exactly where they are. Where new IMU technology has helped us is to get the better heading, pitch, and roll performance for georeferencing as well as reducing the drift while we dead reckon in a GNSS outage.

    What is the typical performance of IMU accelerometers and gyros these days?

    It boils down to what it gives us in terms of position drift or heading, pitch, and roll drift over 60 seconds. Real-time heading, pitch, and roll is heavily affected by gyroscope performance.

    How much more do you have to pay to get that increase in performance?

    There are definitely diminishing returns. When you look at some of the Applanix systems that have very good post-processing performance in terms of drift, you’re talking about something like $80,000 for a mobile mapping survey system that is maybe 50% better on roll and pitch in normal conditions, let alone an outage, vs. $30,000 to $40,000 for our top system, which is 0.03 roll and pitch, for example. If you go down to 0.015, you can pay double for the INS. Similarly, if you go the other way, and you go cheaper, you can probably get a .1 degree roll and pitch system for $1,000.

    So, it’s a very steep curve. The entry level systems are very disruptively low priced now but given the requirements for certain applications —particularly survey — that .1 degree means that you can never achieve centimeter-level point cloud georeferencing. And that’s where people are still justifying spending $80,000 or more on the INS. They also spend similar levels on their RIEGL lidar scanners and other profilers. So, it’s complementary to the quality of the other sensors. However, it really doesn’t make sense to spend $1,000s on your INS and then $80,000 on your lidar, because you’re going to be bottlenecking the point cloud that you get out of it at the end anyway.

    The same goes for autonomous vehicles, where people are now spending sub-$1,000 on their lidar or their camera, and they don’t want to spend $30,000 to $40,000 on their INS for a production level, autonomous vehicle. So, there needs to be that similar complementary pricing for sensors in that space, where you can offer an INS for hundreds of dollars, for example, that performs maybe only a percentage less than INSs do today.

    For an autonomous vehicle to stay in lane, it still needs these building blocks to be high accuracy, because they’ve only got 10s of centimeters with which to play. However, they are doing it from the point of view that they don’t care where they are in the global frame at that moment in time to stay in their lane, only where the lane markings are. However, they will care where they are in the global frame when they come to navigate off of a map that someone else has made and they’re looking for features within the map, for such things as traffic signs, stoplights, and things that are out of sight or occluded by traffic, so that they know if they’re approaching them and the camera is just blocked at that time. That’s where the global georeferencing comes in and where GNSS remains critical effectively. Right?

    It ranges price-wise. The top-end systems — Applanix and NovAtel — in the open road navigation sense, are not orders of magnitude better but you do end up paying double very quickly. If you look at the datasheet, positioning in open sky conditions is identical between a £1,000 power system and an £80,000 pound system. The differences all come in those drifts specs, or the heading, pitch, and roll specs that are being achieved, because the value really comes from the IMU being used at that point.

    Is most of the quality difference between these devices due to better machining, smarter electronics, or improved post-processing?

    Any one of them on their own will not get you a good navigation solution. Fundamentally, you can have a good real-time GNSS-only system that will work at a centimeter level if you just use, say, a u-blox receiver, which is less than $100. Adding a low-cost IMU can fill some gaps, but not particularly intelligently and you’ll get jumps and drop-outs or unrecoverable navigation. That’s when the algorithms come in to play in terms of intelligent filtering of bad data and when to fall back on one solution versus the other and when to blend the two.

    I was asking specifically within INS. When you’re talking about a $1,000 INS versus an $80,000 INS, how much of the improvement in performance is due to manufacturing, how much of it is due to smart electronics, and how much of it is due to algorithms or post processing?

    Most of it is probably down to the raw sensor quality and then the calibration of the sensors. An IMU calibration is important, in terms of compensating for bias and scale factor errors, but also for the misaligned angle of the sensors. So, you need to make sure that your accelerometers and your gyros are all mounted exactly orthogonal to each other. A $1,000 sensor is very unlikely to be calibrated to the same level as an $80,000 one. That’s probably because you’d get 10% more out of calibrating the $1,000 one but you might get three times the performance out of calibrating the $80,000 one. So, you have a lot more to get out of a high-end system in terms of unlocking the potential whereas the low-end sensors are probably already giving 80% to 90% of their potential out of the box, with no calibration at all.

    You affect such things as warmup time. A well-calibrated system will already be modeled accurately almost as soon as you power it on. If you don’t calibrate the system, you can still have a Kalman filter or something running in real time that can model the errors live. But it will mean that you won’t be at spec level performance as soon as you power up. When does it matter to you that you get the best data? Is it the instant you power up because you’re navigating an autonomous vehicle out of the parking garage? Or do you have 10 minutes before you need to take the data and use it for anything, and therefore you can take those 10 minutes to model the sensors live?

    You might save money on the electronics budget but spend it to pay the driver to do the warm-up procedure. You can reallocate where you spend your money. If you’re rolling out a fleet of 100 vehicles, though, you probably don’t want to have to have 100 drivers that are trained to do a warm-up procedure. So, you would spend the money on the electronics to have an INS that does not require a warm-up. That is an option that you can go with now. If you spend the extra you can get away from the warm-up procedure requirements, because things have been modeled during calibration instead of in real time.

    Your website focuses on three areas: automotive, autonomy, and surveying and mapping. Why those and what might be next in terms of markets or end user applications?

    Automotive is probably the bread-and-butter part of OxTS. For a long time, automotive users were looking for a test and validation device that could give them their ground truth data to validate onboard vehicle sensors. We were very much the golden truth sensor, making sure that the sensors they were putting into the production vehicles were fit for purpose and safe. So, if they claimed it had autonomous emergency braking, they used our sensor to say how far away it was from the target — for example, a pedestrian — when it made the vehicle stop. Did it break with the appropriate distance between them? They had a unit in each vehicle and got centimeter accuracy between them. That was very easy to do with GNSS. Because on a proving ground for automotive users, they always have RTK.

    Now the automotive world is moving into the urban environments and doing more open-road testing. So, the need for complementary PNT is more on their mind than ever. They are looking for a technology from us and our competitors that allows them to keep doing those tests that they did on the proving ground, but in real world scenarios. They may collect 1,000 hours of raw data and then only have an autonomous emergency breaking (AEB) event kick in three times in those 1,000 hours. They will then look at the OxTS data at that time and say something like, “Did the dashboard light come on and then did the brake kick in at the required time to avoid the collision?”

    So, they rely on the INS data to be accurate all the time. It cannot be that in 1,000 hours, if you get those three events, two of them do not meet the accuracy requirements to be your ground truth sensor. Because then they would basically say, well, we don’t know whether the AV kicks in at the right time on the open road. They would have to fall back to the proving ground testing to have any confidence. So, that’s where the automotive world is looking to use an INS to reference its onboard sensors.

    In autonomy and survey, on the other hand, the INS is used actively to feed another sensor to either georeference or, in the case of autonomy, actively navigate the vehicle. So, that data being accurate is critical because an autonomous vehicle without accurate navigation cannot move effectively and would have to revert to manual operation. There’s a lot to do with localization and perception and avoidance of obstructions and things like that.

    Timing synchronization is critical. People haven’t solved a way to synchronize multiple vehicles without using GNSS and PPS. Some people are using PTP to synchronize, but they’ll often have a GNSS receiver at the heart of it with the nanosecond-accurate time to be the actual synchronization time. And then everything else is a slave PTP device that operates off of that. So, if we did not give accurate timing, position and orientation, there is basically nothing that that vehicle could do to navigate other than navigating relative to where it was when it last had accurate INS time.

    Often, these vehicles will enter a kind of limp mode or stop completely and require user operation to get it to the next stage. It’s where you see the street drone-type small robots now, which will stop if a pedestrian walks in front of it, obviously, because it is a safety requirement. But also, if it doesn’t know where it is, like a Roomba operating inside, it cannot localize with respect to landmarks that it has in its map, it will just effectively try to re-localize off of random movements until it can orient itself. In that scenario, an INS or an IMU can help you reduce the number of times that you’re losing absolute localization. Where the autonomy side of things comes in for us is if we can offer the navigation quality, more of the time and to a high accuracy but for acceptable cost, then the sensor is a viable one to be put into the autonomous vehicle.

    In autonomy, our active and potential customers are looking to do everything for a very, very low cost base, because they know that they’re trying to reach consumers with these products rather than businesses. So, their value box is entirely within the algorithms that they’re selling. They’re trying to offer scalable solutions that could roll out to thousands or millions of vehicles around the world, with their algorithms at the center of them. That localization and perception stuff is where you see companies such as Nvidia getting involved, because they want to be at the heart of it. Then they say that they can support any sensor while not being tied to any one of them. However, their algorithm is always going to be there at the heart of it. They will have GNSS receivers they support, they will have IMUs, they will have cameras, lidar, and radar and all the other kinds of possible aiding sensors. But they will say that their algorithm will still function if you have any number of those being fed in at any time.

    So, autonomy relates to automotive in a sense, because you have autonomous passenger vehicles, but you also have autonomous heavy industry and autonomous survey, where people are flying drones autonomously or operating Spot autonomous dog robots, things like that, which can still be a survey application where you don’t want to have a human in the loop but you still need to navigate precisely. Someone may be sending a Spot dog robot into a deactivated nuclear reactor where they don’t want to send a human, but they still need to get to a very specific point within that power station and report back. They need to avoid obstructions, they need to georeference data they collect, and then take a reading from a specific object or sensor that’s inside and come back out safely. So, accurate navigation throughout the whole process is very important.

    I understand the role of OxTS in testing and development. However, are any of your systems going to be in any production vehicles?

    Many of the companies that are working on autonomous passenger vehicles are realizing that they are still a long, long way away.

    What about your presence in the auto market more broadly?

    They are used, but as separate components. You will have GNSS, IMU, radar, cameras, and lidar but the localization and perception will all be done by the OEM or by a tier one supplier to the OEM. So, they don’t want a third-party solution that is giving them a guarantee of their position because it’s a black box. They need to have traceability and complete insight as to what each sensor is saying so that they can build in redundancy and bring the vehicle safely to a stop if one of those systems is reporting poor data. For production vehicles, we are very much used as a validation tool in the development stage, but in terms of producing the production vehicle, they need to have that visibility of the inner workings of the system. Most INSs will not give you that insight as to how they arrived at their navigation output, because that is proprietary information. As a result, many automotive customers are looking to do that themselves. However, as I said, they’re realizing that it’s very difficult, and they’re quite a long way from navigating anywhere.

    Therefore, currently no OxTS products are in production vehicles.

    Not for passenger autonomy. However, they are used in some of the other autonomous spaces, such as heavy industry, that take place in private, fixed spaces such as mines, quarries, and ports where there is little interaction with the public. That is not only because the vehicle price point is much higher for some of these mining vehicles and heavy industry vehicles, but also because you don’t have to have your algorithm and perception capability deal with vehicles that are not autonomous or are driven by drivers that are not trained on health and safety in the area.

    In these private spaces, you can tune your systems to work with each other without having to worry about the pedestrians and the random vehicles for which you’ve not accounted in your perception algorithms. That’s where the divide comes at the moment. If there are untrained people in the area, then there’s a lot more to accommodate and that makes the proposition much more difficult.

    Are you at liberty to discuss any recent end user success story with your products?

    The Ordnance Survey in the UK has been using our INS to create 3D maps on which they can then use semantic segmentation to classify features within the environment and pull out all the relevant features within a survey of a city, for example. They’re blending the raw data from OxTS lidar and map data that they have to create high accuracy 3D maps that can be used to add that third dimension to the high accuracy 2D maps that have been their value proposition for the past few decades. They can say, “here are all the trees in the environment” or all the traffic signs or buildings or that kind of thing that you’re going to see in Google Earth imagery. They start to reach the realms of high accuracy map data. They’re looking to sell that map data to commercial entities to monetize it and use it on a nationwide level and then on a global level.

    If you have that map data, there’s a lot that you can do with it, in terms of intelligent decision making about routing a vehicle, or many other things, such as monitoring the heat output of buildings. In the EU, there are many directives around such things as carbon emissions. If you’re being more efficient with the heat output of your buildings, you can effectively say that you’re hitting your CO2 emissions reduction goals, by running whatever initiative to insulate buildings better and things like that. It always starts with, “Where was I when I saw this object or this building?” Therefore, I can georeference that building, I can color it by thermal imaging and things like that.

    They can start to produce 3D imagery that is colored by thermal output, they can do it by any other number of sensors as well, that can give them meta data that can allow them to sell the data to someone else. It makes what was previously a very big job very efficient. So, they can drive hundreds of kilometers in a day where previously it was a static survey that was done over the course of weeks on foot. It’s also changing the efficiency metric that they can deliver to their end users.

    Thank you very much!

  • Online Exclusive: PNT by Other Means

    Online Exclusive: PNT by Other Means

    Image: Safran Federal Systems
    Image: Safran Federal Systems

    Due to the limited space available in print, I was able to use only used a small portion of the interviews I conducted for our July cover story. For full transcripts of them (totaling more than 12,000 words) see below:

    • Safran Federal Systems (formerly Orolia Defense & Security) makes the VersaPNT, which fuses every available PNT source — including GNSS, inertial, and vision-based sensors and odometry. I spoke with spoke with Garrett Payne, Navigation Engineer.
    • Xona Space Systems is developing a PNT constellation consisting of 300 low-Earth orbit (LEO) satellites. It expects its service, called PULSAR, to provide all the services that legacy GNSS provide and more. I spoke with Jaime Jaramillo, Director of Commercial Services.
    • Spirent Federal Systems and Spirent Communications are helping Xona develop its system by providing simulation and testing. I spoke with Paul Crampton, Senior Solutions Architect, Spirent Federal Systems as well as Jan Ackermann, Director, Product Line Management and Adam Price, Vice President – PNT Simulation at Spirent Communications.
    • Oxford Technical Solutions develops navigation using inertial systems. I spoke with Paris Austin, Head of Product – New Technology.
    • Satelles has developed Satellite Time and Location (STL), a PNT system that piggybacks on the Iridium low-Earth orbit (LEO) satellites. It can be used as a standalone solution where GNSS signals will not reach, such as indoors, or are otherwise unavailable. I spoke with Dr. Michael O’Connor, CEO.
    • Locata has developed an alternative PNT (A-PNT) system that is completely independent from GNSS and is based on a network of local ground‐based transmitters called LocataLites. I spoke with Nunzio Gambale, founder, chairman, and CEO.
  • Septentrio and Xona Space Systems collaborate on GNSS receiver

    Septentrio and Xona Space Systems collaborate on GNSS receiver

    Image: Septentrio
    Image: Septentrio

    Septentrio and Xona Space Systems have collaborated to develop an experimental receiver compatible with Xona multi-frequency PULSAR signals.

    The multi-frequency receiver will be one of the first to decode all PULSAR signals alongside standard GNSS signals such as GPS, Galileo, GLONASS and BeiDou.

    Septentrio will be showcasing this receiver at the ION Joint Navigation Conference, June 12-15, 2023, in San Diego, California.

    “As Xona PULSAR signals become available, a Septentrio receiver will offer users an opportunity to be the first to experiment with PULSAR and GNSS in many different scenarios,” Bryan Chan, VP of business development and strategy, Xona Space Systems, said.

  • China completes multiple satellite launches that include replenishing the BeiDou constellation

    China completes multiple satellite launches that include replenishing the BeiDou constellation

    Photo:
    Image: Nikada/E+/Getty Images

    On May 16, China launched a BeiDou satellite to replenish the constellation, reported Space News. This brings the constellation total to 56 satellites.

    This backup satellite was aboard a Long March 3B rocket, which launched from the Xichang Satellite Launch Center in southwest China at 10:49 p.m. Eastern Time. The satellite aims to improve BeiDou’s stability, positioning precision and overall health.

    In addition to launching the BeiDou satellite, China also launched satellites to study Earth and synthetic aperture radar test satellites (SAR) for disaster prevention.

    On May 21, the Macau Science Satellite 1A and 1B launched on a Long March 2C rocket from the Jiuquan Satellite Launch Center at 4 a.m. Eastern Time. This satellite was designed to study the Earth’s magnetic field.

    Also, on May 21, aboard the same rocket was the Luojia-2 (01), a Ka-band synthetic aperture radar test satellite for Wuhan University. The Luojia-2 (01) will test signal enhancement and integration of remote sensing imaging, meteorological detection and more.

    The China Aerospace Science and Technology Corporation has planned more than 60 launches this year and has already completed 20 thus far.

  • Seen & Heard: Tracking pythons and wild camels

    Seen & Heard: Tracking pythons and wild camels

    “Seen & Heard” is a monthly feature of GPS World magazine, traveling the world to capture interesting and unusual news stories involving the GNSS/PNT industry.


    Image: Apple
    Image: Apple

    Apple Products Meet Accuracy with GPS

    Apple launched the Ultra Watch, which contains a dual-frequency GPS antenna that can receive L5 signals, as well as the iPhone 14, which features a dual-band GPS receiver combining the L1 and L5 signals. The company is also harnessing signals from more than 70 satellites to boost the accuracy of its services such as SOS alerts and alerting emergency responders, per The National News. The dual-frequency abilities of the new products provide accurate location for calculating distance, pace and routes. The L5 signals also are a critical component of Apple’s health and safety features, providing more accuracy than in previous products.


    Image: dwi septiyana/iStock/Getty Images Plus/Getty Images
    Image: dwi septiyana/iStock/Getty Images Plus/Getty Images

    Collar Accidently Tracks Python

    Wildlife researchers in Key Largo, Florida, accidently discovered a way to locate and eradicate invasive Burmese pythons, per WFLA News Channel 8. The team of researchers were observing racoons and possums that were fitted with tracking collars to note their behavior. After months of observation, a possum collar sent a mortality signal due to lack of movement. To the researchers’ surprise, the collar then started moving again. They later discovered the possum had been eaten by a python. While this was not the intent of the team’s research, they proved this could be an effective way to lower the increasing population of the invasive python species.


    Image: Pavliha/ iStock/Getty Images Plus/Getty Images
    Image: Pavliha/ iStock/Getty Images Plus/Getty Images

    Remote-Sensing Finds Wild Camels

    Scientist Liu Shaochuang and his team have used satellite remote-sensing technology to study and track wild camels. Shaochuang studies the interrelationship between endangered animals and their environments, which may help protect the species against climate change. To track a camel, Shaochuang attaches a GNSS-enabled collar, which transmits the camel’s location every day. The short message function is provided by China’s BeiDou satellite system, which transmits and receives signals in real time. Based on the data, Shaochuang and his team can observe migratory paths, living environments and possible threats.


    Image: Screenshot of CNN video
    Image: Screenshot of CNN video

    Former South Carolina Attorney Convicted with Location Data

    On March 3, Alex Murdaugh was convicted of killing his son Paul Murdaugh and wife Maggie Murdaugh. With limited evidence, the prosecution used a phone video and vehicle navigation data to prove Alex’s guilt. During the trial, Alex claimed he was visiting his mother during the time the murders took place. However, General Motors OnStar data accessed by investigators from his Chevrolet Suburban contradicted the alibi, putting Alex at the scene of the crime during the time of the murders. Plus, in a smartphone video taken by Paul that night, Alex’s voice could be heard, placing him at the scene.

  • China to use BeiDou SBAS in railway survey

    China to use BeiDou SBAS in railway survey

    Image: ximushushu/iStock/Getty Images Plus/Getty Images
    Image: ximushushu/iStock/Getty Images Plus/Getty Images

    China will use the BeiDou satellite-based augmentation system (BDSBAS) to provide positioning services in railway surveys and construction, reported the China Railway Siyuan Survey and Design Group and Xinhua Net.

    Four satellite-based and 12 ground-based observation stations will be placed along the Wufeng-Enshi railway section located in the Hubei Province in central China.

    The BDSBAS and the BeiDou ground-based augmentation system aim to further enhance railway survey efficiency.

  • GNSS Almanac: Key stats on GNSS constellations

    GNSS Almanac: Key stats on GNSS constellations

    Image: vasilypetkov/iStock / Getty Images Plus/Getty Images
    Image: vasilypetkov/iStock / Getty Images Plus/Getty Images

    In our October 2021 issue, we celebrated the availability of four global navigation satellite system (GNSS) constellations. Below is the status (as of Feb. 23, 2023) of these four GNSS and their two regional cousins.

    Many thanks to Mohamed Tamazin, Ph.D., Senior GNSS Architect for GNSS Simulation with Orolia — a Safran Electronics & Defense company, who provided or confirmed these data. While the data on GPS and Galileo are easily accessible, those for the other constellations are difficult, in some cases very difficult, to find.

    — Matteo Luccio, Editor-in-Chief

    GNSS Almanac chart 2023

  • CHC Navigation releases GNSS RTK steering system

    CHC Navigation releases GNSS RTK steering system

    Image: CHC Navigation
    Image: CHC Navigation

    CHC Navigation has released the NX510 SE Auto-Steer, an automated steering system that retrofits several types of new and old farm tractors and other vehicles. It can be connected to local real-time kinematic (RTK) networks or GNSS RTK base stations.

    NX510 SE is a guidance controller powered by multiple corrections sources and five satellite constellations: GPS, GLONASS, Galileo, BeiDou and QZSS. It has a built-in 4G and UHF modem that connects to all industry-standard differential GPS and RTK corrections to achieve centimeter-accuracy steering.

    NX510 SE contains GNSS and inertial navigation system terrain compensation technology, which maintains high accuracy in challenging environments and terrain. This makes NX510 SE suitable for ditching, planting and harvesting applications.

    In addition, AgNav multilingual software, operating on a 10.1 in industrial display, supports multiple guideline patterns that include AB line, A+ line, circle line, irregular curve and headland turn.