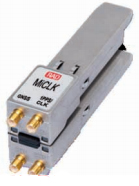
Telecom company RAD will be expanding the timing synchronization capabilities of its Service Assured Access (SAA) solution when it introduces MiCLK, an IEEE 1588 grandmaster clock with a built-in GNSS receiver.The grandmaster clock is SFP-based (small form-factor pluggable).
RAD is demonstrating the MiCLK at Mobile World Congress 2015, being held this week in Barcelona, Spain.
“LTE and LTE-A’s stringent synchronization requirements and the growing use of small cells in 4G networks create synchronization challenges in the backhaul segment, but existing solutions are either too expensive or do not provide full network coverage,” said Ulik Broida, RAD’s vice president of marketing and business development. “With the revolutionary MiCLK, RAD makes it easy to upgrade existing backhaul networks to support LTE-A at an affordable price.”
Many network operators prefer to use IEEE 1588-2008 (also known as Precision Time Protocol, or PTP) and synchronous ethernet to deliver accurate frequency and time throughout 4G backhaul networks. They are reluctant to install GNSS at every cell site because of practical and cost reasons, as well as concern about possible GNSS jamming and spoofing. However, accurate time distribution requires every network element between the time reference — the grandmaster — and the cell site to support IEEE 1588. This could be an expensive and complex endeavor when the grandmaster is located in a central PoP. “MiCLK allows network operators to avoid costly upgrades by bringing the grandmaster to the base station,” said Broida.
RAD’s patent-pending MiCLK is a miniature pluggable device that responds to the needs of next-generation cellular backhaul networks, the company said. Its SFP design allows simple installation to upgrades any network device with a fully featured IEEE 1588 grandmaster, including a GNSS receiver and various redundancy options to sustain its operation in case of GNSS failure, RAD said.
“Easily installed with minimal technical intervention, MiCLK is a versatile add-on anywhere in the network,” Broida concludes. “It is a valuable addition to mobile equipment vendor portfolios, and an ideal solution for 4G service providers in search of a quick, cost-effective way to bring accurate synchronization to small cell backhaul.”
RAD is exhibiting at Hall 2, Stand 2D50 at Mobile World Congress.
Editor’s note: GPS World Innovation editor Richard Langley has co-authored a study, described below, exploring how irregularities in Earth’s upper atmosphere can distort GPS signals, an important step toward mitigation.
The Aurora Borealis viewed by the crew of Expedition 30 on board the International Space Station. The sequence of shots was taken on February 7, 2012 from 09:54:04 to 10:03:59 GMT, on a pass from the North Pacific Ocean, west of Canada, to southwestern Illinois. Image Credit: NASA/JSC
News from the Jet Propulsion Laboratory
When you don’t know how to get to an unfamiliar place, you probably rely on a smartphone or other device with a GPS module for guidance. You may not realize that, especially at high latitudes on our planet, signals traveling between GPS satellites and your device can get distorted in Earth’s upper atmosphere.
Researchers at NASA’s Jet Propulsion Laboratory (JPL), Pasadena, Calif., in collaboration with the University of New Brunswick in Canada, are studying irregularities in the ionosphere, a part of the atmosphere centered about 217 miles (350 kilometers) above the ground that defines the boundary between Earth and space. The ionosphere is a shell of charged particles (electrons and ions), called plasma, that is produced by solar radiation and energetic particle impact.
The new study, published in the journal Geophysical Research Letters, compares turbulence in the auroral region to that at higher latitudes, and gains insights that could have implications for the mitigation of disturbances in the ionosphere. Auroras are spectacular multicolored lights in the sky that mainly occur when energetic particles driven from the magnetosphere, the protective magnetic bubble that surrounds Earth, crash into the ionosphere below it. The auroral zones are narrow oval-shaped bands over high latitudes outside the polar caps, which are regions around Earth’s magnetic poles. This study focused on the atmosphere above the Northern Hemisphere.
“We want to explore the near-Earth plasma and find out how big plasma irregularities need to be to interfere with navigation signals broadcast by GPS,” said Esayas Shume. Shume is a researcher at JPL and the California Institute of Technology in Pasadena, and lead author of the study.
If you think of the ionosphere as a fluid, the irregularities comprise regions of lower density (bubbles) in the neighborhood of high-density ionization areas, creating the effect of clumps of more and less intense ionization. This “froth” can interfere with radio signals including those from GPS and aircraft, particularly at high latitudes.
The size of the irregularities in the plasma gives researchers clues about their cause, which help predict when and where they will occur. More turbulence means a bigger disturbance to radio signals.
“One of the key findings is that there are different kinds of irregularities in the auroral zone compared to the polar cap,” said Anthony Mannucci, supervisor of the ionospheric and atmospheric remote sensing group at JPL. “We found that the effects on radio signals will be different in these two locations.”
The researchers found that abnormalities above the Arctic polar cap are of a smaller scale — about 0.62 to 5 miles (1 to 8 kilometers) — than in the auroral region, where they are 0.62 to 25 miles (1 to 40 kilometers) in diameter.
Why the difference? As Shume explains, the polar cap is connected to solar wind particles and electric fields in interplanetary space. On the other hand, the region of auroras is connected to the energetic particles in Earth’s magnetosphere, in which magnetic field lines close around Earth. These are crucial details that explain the different dynamics of the two regions.
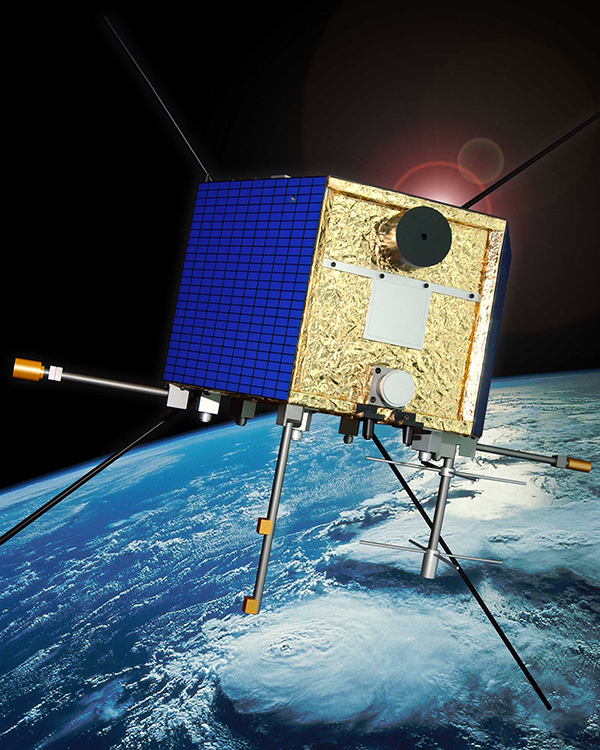
CAScade, Smallsat and IOnospheric Polar Explorer (CASSIOPE) is a made-in-Canada small satellite from the Canadian Space Agency. It is comprised of three working elements that use the first multi-purpose small satellite platform from the Canadian Small Satellite Bus Program. Image Credit: Canadian Space Agency
To look at irregularities in the ionosphere, researchers used data from the Canadian Space Agency satellite Cascade Smallsat and Ionospheric Polar Explorer (CASSIOPE), which launched in September 2013. The satellite covers the entire region of high latitudes, making it a useful tool for exploring the ionosphere.
The data come from one of the instruments on CASSIOPE that looks at GPS signals as they skim the ionosphere. The instrument was conceived by researchers at the University of New Brunswick.
“It’s the first time this kind of imaging has been done from space,” said Attila Komjathy, JPL principal investigator and co-author of the study. “No one has observed these dimensional scales of the ionosphere before.”
The research has numerous applications. For instance, aircraft flying over the North Pole rely on solid communications with the ground; if they lose these signals, they may be required to change their flight paths, Mannucci said. Radio telescopes may also experience distortion from the ionosphere; understanding the effects could lead to more accurate measurements for astronomy.
“It causes a lot of economic impact when these irregularities flare up and get bigger,” he said.
NASA’s Deep Space Network, which tracks and communicates with spacecraft, is affected by the ionosphere. Komjathy and colleagues also work on mitigating and correcting for these distortions for the DSN. They can use GPS to measure the delay in signals caused by the ionosphere and then relay that information to spacecraft navigators who are using the DSN’s tracking data.
“By understanding the magnitude of the interference, spacecraft navigators can subtract the distortion from the ionosphere to get more accurate spacecraft locations,” Mannucci said.
Other authors on the study were Richard B. Langley of the Geodetic Research Laboratory, University of New Brunswick, Fredericton, New Brunswick, Canada; and Olga Verkhoglyadova and Mark D. Butala of JPL. Funding for the research came from NASA’s Science Mission Directorate in Washington. JPL, a division of the California Institute of Technology in Pasadena, manages the Deep Space Network for NASA.
DigitalGlobe, a global provider of high-resolution satellite imagery and geospatial solutions, has signed of a Memorandum of Understanding with the United Nations.
Under the agreement, DigitalGlobe and the United Nations Office for Outer Space Affairs (UNOOSA) will take stock of their combined expertise in the use of earth observation technologies for economic, social, and scientific development and improved decision-making, particularly in developing countries.
UNOOSA and DigitalGlobe will work to develop an online platform to provide easy access to imagery catalogues as well as data and analytical services specifically tailored for the needs of the United Nations. Under the agreement, DigitalGlobe will provide advisory services on remote-sensing imagery and geospatial analytics, working with UNOOSA to advance and accelerate adoption of geospatial and satellite imagery-based analytics across the entire United Nations System.
The cooperation will also extend to DigitalGlobe’s participation in relevant UNOOSA-supported events and activities, including those of the United Nations Platform for Space-based Information for Disaster Management and Emergency Response (UN-SPIDER) and of the United Nations Geographic Information Working Group (UNGIWG).
“Cooperation and collaboration in the area of geospatial information and analytics will improve how the United Nations, including its member states and its system of organizations, can address global economic, environmental, geopolitical, and societal issues,” said Simonetta Di Pippo, director of UNOOSA.
“DigitalGlobe is thrilled to partner with UNOOSA, the United Nations body that promotes international cooperation in the peaceful uses of outer space,” said Jeffrey R. Tarr, DigitalGlobe president and CEO. “The arrangement provides an ideal platform to explore how high-resolution satellite imagery and geospatial analytics can be more efficiently and effectively shared across the entire United Nations System, thus propelling us toward our purpose of ‘Seeing a Better World.”
Data Reveals Homes Most at Risk in California, Colorado and Texas
According to new data released today by CoreLogic, nearly 900,000 single-family homes across 13 states in the western U.S. are currently designated at “High” or “Very High” risk for wildfire damage, representing a combined total reconstruction value estimated at more than $237 billion. Of the total homes identified, just over 192,000 homes fall into the “Very High Risk” category alone, with total reconstruction cost valued at more than $49.6 billion.
The CoreLogic Wildfire Risk analysis designates risk levels as “Very High,” “High,” “Moderate” and “Low.”
Two additional categories, “Urban” and “Agriculture” indicate homes at even lower risk. Homes designated as “Urban” are located in areas with a dense concentration of buildings and infrastructure to such an extent that little natural vegetation exists to support a wildfire. Homes designated as “Agriculture” are located in areas comprised of row crops, orchards/vineyards or other specific land use that is typically irrigated. Even if it is not irrigated, the crops are nourished and healthy with no ground litter present, and therefore, the vegetation is unlikely to support or enhance a wildfire.
The analysis also assigns a numeric risk score to each property, ranging from 1 to 100. This separate score indicates the level of susceptibility to wildfire, as well as the risk associated with the property being located in close proximity to another high-risk property or area. The score designation is important since wildfire can easily expand to adjacent properties and cause significant damage even if that property was not originally considered high risk.
When expanding the analysis to include the numeric score, more than 1.1 million homes fall under the highest Wildfire Risk Score segment (81-100), representing a combined potential reconstruction value of more than $268.5 billion.
Total U.S. Properties at Risk and Reconstruction Values by Risk Category
Wildfire Risk Level
Total Properties
Reconstruction Cost
Very High
192,242
$49,608,484,867
High
704,860
$187,661,388,760
Moderate
1,351,313
$292,811,373,342
Low
1,378,104
$334,120,053,463
Agriculture
993,580
$244,167,729,666
Urban
23,778,799
$6,094,873,170,789
Total:
28,398,898
$7,203,242,200,887
Total U.S. Properties at Risk and Reconstruction Values by Numeric Risk Score
Wildfire Risk Score (1-100)
Total Properties
Reconstruction Cost
81-100
1,101,131
$268,549,008,333
61-80
1,193,814
$338,395,410,748
51-60
487,013
$131,081,392,801
1-50
25,616,940
$6,465,216,389,005
Total:
28,398,898
$7,203,242,200,887
The states most commonly associated with wildfires also contain the most properties at risk — California, Colorado and Texas have the largest number of residential properties categorized as “Very High Risk,” with a combined reconstruction value exceeding $36 billion. Including homes located in the “High Risk” category, the reconstruction value is more than $188 billion for these three states. When analyzed by risk score, 816,515 homes with reconstruction costs valued at more than $206.5 billion fall into the highest risk segment of 81-100.
Limiting the evaluation to property-level risk strictly in the “Very High” category, California tops the list of states analyzed with a total of 50,905 homes falling into that group. Comparatively, when assigning the Wildfire Risk Score, Texas takes the top spot with 451,848 homes scoring in the 81-100 highest-risk range.
Total Properties at Risk by State and Risk Category
State
Low
Moderate
High
Very High
Agriculture
Urban
Total
AZ
43,273
4,443
8,488
8,089
5,332
1,910,771
1,980,396
CA
221,104
169,468
255,023
50,905
146,013
8,208,625
9,051,138
CO
70,935
38,628
50,009
49,667
66,876
1,482,352
1,758,467
ID
37,352
22,968
15,197
11,078
86,542
384,018
557,155
MT
60,588
18,903
9,601
10,218
22,516
194,927
316,753
NV
17,845
20,520
8,653
281
3,166
816,975
867,440
NM
55,969
19,554
25,766
9,481
16,200
483,282
610,252
OK
165,009
88,642
187
0
33,225
968,210
1,255,273
OR
37,137
41,160
51,872
13,788
157,749
938,664
1,240,370
TX
332,766
829,457
261,855
35,016
175,691
5,960,221
7,595,006
UT
11,185
13,590
3,441
68
31,825
681,016
741,125
WA
308,066
72,069
12,509
1,997
219,334
1,625,394
2,239,369
WY
16,875
11,911
2,259
1,654
29,111
124,344
186,154
Total
1,378,104
1,351,313
704,860
192,242
993,580
23,778,799
28,398,898
Reconstruction Values by State and Risk Category
State
Low
Moderate
High
Very High
Agriculture
Urban
Total
AZ
$9,641,256,308
$976,410,271
$1,758,550,435
$1,572,563,175
$1,143,819,360
$366,495,664,312
$381,588,263,861
CA
$75,842,726,208
$61,916,244,431
$89,354,295,530
$16,103,052,587
$49,993,071,641
$2,787,437,974,226
$3,080,650,364,623
CO
$18,625,174,701
$11,531,765,722
$14,580,510,822
$13,914,663,160
$17,325,198,320
$341,298,432,193
$417,275,744,918
ID
$9,201,487,848
$5,563,694,301
$3,712,505,829
$2,620,564,770
$19,821,299,748
$81,602,075,191
$122,521,627,687
MT
$14,629,451,956
$4,430,244,606
$2,287,179,138
$2,395,322,719
$5,408,564,612
$40,511,274,596
$69,662,037,627
NV
$4,236,711,357
$5,193,363,455
$4,565,346,511
$164,097,900
$804,282,891
$209,146,367,671
$224,110,169,785
NM
$11,654,726,259
$4,622,802,292
$7,067,786,311
$2,461,741,365
$3,238,850,020
$98,567,625,878
$127,613,532,125
OK
$31,924,967,489
$16,773,531,745
$32,840,233
$0
$6,781,088,763
$175,933,722,480
$231,446,150,710
OR
$8,237,043,811
$9,489,672,570
$11,913,602,274
$3,198,334,352
$37,257,178,708
$213,002,484,645
$283,095,316,360
TX
$59,531,714,789
$147,682,544,644
$48,259,080,738
$6,333,237,927
$32,857,921,476
$1,201,265,765,342
$1,495,930,264,916
UT
$2,849,584,240
$3,928,155,203
$768,151,716
$14,155,093
$8,343,607,261
$157,244,129,873
$173,147,783,386
WA
$84,067,607,674
$18,078,389,368
$2,876,053,207
$505,435,568
$54,701,823,116
$397,645,668,540
$557,874,977,473
WY
$3,677,600,823
$2,624,554,734
$485,486,016
$325,316,251
$6,491,023,750
$24,721,985,842
$38,325,967,416
Total
$334,120,053,463
$292,811,373,342
$187,661,388,760
$49,608,484,867
$244,167,729,666
$6,094,873,170,789
$7,203,242,200,887
Total Properties at Risk by State and Numerical Risk Score
State
1-50
51-60
61-80
81-100
Total
AZ
1,919,351
14,308
27,159
19,578
1,980,396
CA
8,286,708
133,654
367,457
263,319
9,051,138
CO
1,454,787
52,823
122,509
128,348
1,758,467
ID
476,310
9,554
27,868
43,423
557,155
MT
243,990
13,114
27,301
32,348
316,753
NV
848,682
2,337
9,184
7,237
867,440
NM
523,755
14,487
32,139
39,871
610,252
OK
1,250,888
1,431
2,219
735
1,255,273
OR
1,091,300
22,616
46,655
79,799
1,240,370
TX
6,458,363
197,548
487,247
451,848
7,595,006
UT
693,256
14,713
24,311
8,845
741,125
WA
2,192,567
8,662
17,001
21,139
2,239,369
WY
176,983
1,766
2,764
4,641
186,154
Total
25,616,940
487,013
1,193,814
1,101,131
28,398,898
Reconstruction Values by State and Numerical Risk Score
State
1-50
51-60
61-80
81-100
Total
AZ
$369,191,090,202
$2,781,562,044
$5,612,822,008
$4,002,789,607
$381,588,263,861
CA
$2,785,871,424,591
$53,258,974,686
$153,067,995,013
$88,448,970,333
$3,080,647,364,623
CO
$333,552,521,110
$13,769,558,737
$33,846,313,158
$36,107,351,913
$417,275,744,918
ID
$102,894,072,845
$2,426,687,082
$6,899,872,812
$10,300,994,948
$122,521,627,687
MT
$52,685,950,526
$2,997,541,855
$6,338,603,322
$7,639,941,924
$69,662,037,627
NV
$216,436,292,731
$624,126,373
$3,860,921,144
$3,188,829,537
$224,110,169,785
NM
$105,891,175,664
$3,334,262,905
$7,919,619,903
$10,468,473,653
$127,613,532,125
OK
$230,716,181,496
$235,452,854
$370,084,424
$124,431,936
$231,446,150,710
OR
$248,596,738,298
$5,247,235,235
$11,061,921,922
$18,192,420,905
$283,098,316,360
TX
$1,276,614,038,497
$39,753,699,730
$97,535,512,589
$82,027,014,100
$1,495,930,264,916
UT
$159,359,659,455
$4,309,214,977
$7,363,299,947
$2,115,609,007
$173,147,783,386
WA
$547,066,785,312
$1,964,631,216
$3,905,374,051
$4,938,186,894
$557,874,977,473
WY
$36,340,458,278
$378,445,107
$613,070,455
$993,993,576
$38,325,967,416
Total
$6,465,216,389,005
$131,081,392,801
$338,395,410,748
$268,549,008,333
$7,203,242,200,887
At the CBSA (Core Based Statistical Area) level, Denver-Aurora-Lakewood, Colo. ranks first for the most number of homes at “Very High” risk out of the 258 CBSAs analyzed. Riverside-San Bernardino-Ontario, Calif. comes in a close second, followed by Sacramento-Roseville-Arden-Arcade, Calif.
When ranking CBSAs based on Wildfire Risk Score, Riverside-San-Bernardino-Ontario, Calif., takes the top spot for the most number of homes that fall under the highest risk segment of 81-100, followed by Sacramento-Roseville-Arden-Arcade, Calif., and Austin-Round Rock, Texas.
Top 10 CBSAs Ranked by Homes at Very High Risk
CBSA
Very High # Homes
Home Reconstruction Value
Denver-Aurora-Lakewood, CO
17,860
$5,358,513,217
Riverside-San Bernardino-Ontario, CA
14,249
$4,233,998,840
Sacramento-Roseville-Arden-Arcade, CA
9,698
$3,351,781,562
Bend-Redmond, OR
9,128
$2,328,466,791
Colorado Springs, CO
7,296
$2,086,189,220
Durango, CO
6,052
$1,776,710,340
Fort Collins, CO
4,609
$903,336,600
Truckee-Grass Valley, CA
4,569
$1,430,020,245
Houston-The Woodlands-Sugar Land, TX
4,219
$917,157,644
Flagstaff, AZ
4,109
$753,176,500
Top 10 CBSAs Ranked by Numerical Risk Score
CBSA
81-100 Risk Score
Home Reconstruction Value
Riverside-San Bernardino-Ontario, CA
50,605
$14,805,549,511
Sacramento–Roseville–Arden-Arcade, CA
42,042
$15,875,023,943
Austin-Round Rock, TX
35,807
$9,019,956,767
Denver-Aurora-Lakewood, CO
35,174
$10,807,628,461
San Antonio-New Braunfels, TX
31,350
$7,097,211,479
Los Angeles-Long Beach-Anaheim, CA
17,006
$8,654,562,030
Chico, CA
15,103
$3,754,593,902
Colorado Springs, CO
14,990
$4,408,080,237
Truckee-Grass Valley, CA
14,671
$4,945,547,724
Houston-The Woodlands-Sugar Land, TX
14,092
$3,063,417,604
*Additional CBSA-level data may be available upon request.
To enhance accuracy, the CoreLogic wildfire analysis has been expanded from prior annual analyses to encompass additional categories of single-family residential structures including mobile homes, duplexes, manufactured homes and cabins, among other non-traditional home types. The values represent estimates of reconstruction costs, taking into account labor and materials, and are based on 100-percent or total destruction of the residential structure. Depending upon the size of the wildfire, there may be less than 100-percent damage to the residence, which would result in a lower realized reconstruction cost.
Technology that allows a drone to be piloted using a person’s brainwaves has been demonstrated in Portugal, reports BBC News. Drone specialist Tekever adapted existing electroencephalography (EEG) technology to enable a pilot on the ground to send instructions to the drone software, a technology it calls Brainflight.
Tekever told BBC News that the technology could enable people with restricted movement to control a UAV. Tekever believes the technology could eventually be used to pilot cargo planes, but experts say safety concerns will be a major roadblock.
Kalashnikov produces a well-known assault rifle. The acquisition of the UAV companyZALA Aero is part of the company’s development strategy through 2020, according to a statement released to Defense News.
“Based off Kalashnikov Concern and ZALA Aero company, we plan to develop and manufacture drones, mobile and earth-based management stations,” said Aleksey Krivoruchko, Kalashnikov Concern CEO.
“Our main product here will be intelligence-gathering pilotless airplanes, helicopters and aerostats. The decision to purchase control stake of ZALA Aero to widen our product line has been made as a part of the strategy of Kalashnikov corporate development through the year 2020 and as a part of the process of developing new sectors of our market.”
The UAVs will operate to secure state borders, intelligence gathering and rescue operations, as well as special operations, the report states.
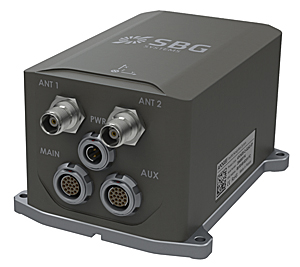
SBG Systems has released the Apogee Series, its most accurate inertial navigation systems based on robust and cost-effective MEMS technology. The INS/GNSS integrates the latest generation of MEMS sensors and a tri-frequency GNSS receiver. Apogee achieves 0.008° in roll and pitch in real-time and 0.005° in post-processing. With two antennas, it delivers a robust and accurate heading.
Four models compose the Apogee line.
The Apogee-A provides only orientation data.
The Apogee-N additionally embeds a GNSS receiver; it is a compact solution with one antenna for land and aerial applications.
The Apogee-D embeds a dual-antenna GNSS receiver for accurate heading under low dynamics conditions.
The Apogee-E delivers navigation data when connected to an external GNSS receiver or to the SplitBox with integrated GNSS.
Mobile Mapping. Apogee can be precisely synchronized with LiDAR equipment because of a UTC time-stamping accurate to 1 microsecond. This integrated INS/GNSS provides optimal position in multipath environment or during GNSS outages, thanks to a tight GNSS integration and the continuous fusion of inertial and odometer data. To get the required positioning accuracy, Apogee supports RTK and Precise Point Positioning services (Omnistar, Terrastar, and more).
Aerial Mapping and Remote Sensing. With very low noise gyroscopes, low latency, and high resistance to vibrations, the Apogee allows aerial surveys by plane or helicopter. It provides real-time orientation and position data with direct fusion of inertial and GNSS information. Compact, lightweight and low power, the Apogee is easy to install, and has an embedded web interface for configuration.
Post-processing. Orientation and position data can be recorded in the Apogee data logger. At the office, the user imports data in the post-processing software. This tool gives access to several RTK networks and reference station offline data (such as VRS and CORS.) Additionally, it enhances orientation and position accuracy by a complete “backward/forward” calculation.
“SBG Systems manufactures inertial systems from the concept to the production. The Apogee benefits from our high level of expertise in integrated design, IMU calibration, testing, and filtering,” said Alexis Guinamard, CTO of SBG Systems.
All models are available for order. Below is a promotional video with more information.
Lockheed Martin and Esri have deployed commercial software to the Amazon Web Services Commercial Cloud Services (C2S) environment for the first time with an intelligence community customer, the National Geospatial-Intelligence Agency (NGA). The move enables government agencies to better share geospatial intelligence.
The deployment of the portal for Esri’s ArcGIS geographic information system (GIS) provides a single environment for analysts to securely organize and share data throughout the intelligence community and Department of Defense. It’s also the foundational step in consolidating multiple geospatial intelligence portals into the single NGA-provided portal, resulting in technology and license cost savings.
This is NGA’s second pioneering step in the cloud, after the agency moved its Map of the World application to the C2S environment late last year.
“Deploying Esri’s Portal for ArcGIS to a commercial cloud environment securely organizes existing data and facilitates collaboration across intelligence agencies,” said Jason O’Connor, vice president of Analysis and Mission Solutions for Lockheed Martin. “This cloud implementation also further shapes the government’s processes for architecting and implementing enterprise class services within a cloud environment.”
ArcGIS connects users to maps and geographic information. Users can create and view maps, compile geographic data, analyze mapped information and share geographic information in a range of applications.
“Working with Lockheed Martin and the NGA on this strategic implementation for national security is particularly meaningful,” said Jack Dangermond, Esri president. “It recognizes the importance of consolidating geospatial intelligence information into a single portal to facilitate rapid situational awareness and response by our intelligence community.”
Lockheed Martin and Esri have partnered for eight years on the Geospatial-Intelligence Visualization Services (GVS) program, which helped NGA and the Intelligence Community achieve this cloud migration milestone. The Total Application Services for Enterprise Requirements (TASER) GVS contract vehicle, which was originally awarded in 2012, conveys geospatial visualization context and analytic capabilities to warfighters, intelligence officers and policy-makers through classified and unclassified computer networks.
OxTS has released the xNAV550, its new compact and lightweight GNSS-aided inertial navigation system, along with an OEM board set version, the xOEM550.
xNAV550. The xNAV550 is the latest model in the xNAV family and the first to offer a position accuracy of 2 cm, yet remains a compact GNSS-aided inertial navigation system at 425 grams. Suitable for all applications where size and weight as well as performance matter, it is designed for use on UAVs and in other weight-constrained applications.
Featuring dual GNSS receivers and a custom-built inertial measurement unit, the xNAV550 constantly monitors position, orientation and velocity with high accuracy in real-time. Four gigabytes of on-board storage is available, automatically logging data for an added layer of protection. Data can be downloaded from the system and post-processed using OxTS’s advanced software, which is included as standard at no extra cost.
Integrating the xNAV550 with cameras, laser scanners or other sensor arrays is easy using the NMEA outputs, OxTS said, with 1-PPS and event input triggers for synchronization and time stamping. These features and the convenience of the one-box solution ensure that the xNAV550 make it quick and easy to acquire accurate data required for direct georeferencing, the company said.
xOEM550. The xOEM550 is designed for system integrators looking for a high-performance INS to build into a complete scanning and georeferencing system. Weighing 165 grams, it won’t add bulk to a system, and the free and distributable OxTS post-processing software enables system integrators to offer a turnkey solution at a competitive price, the company said.
OxTS will be exhibiting at ILMF 2015 in Denver, Colo., Feb. 23-25. Stop by Booth #30 to take a look at the xNAV and xOEM systems or contact [email protected] for more information.
A Walkera QR X350 quadcopter. (Photo credit: Wikimedia Commons).
The Federal Aviation Administration has proposed a framework of regulations that would allow routine use of certain small unmanned aircraft systems (UAS) in today’s aviation system for commercial purposes.
“We have tried to be flexible in writing these rules,” said FAA Administrator Michael Huerta in a statement. “We want to maintain today’s outstanding level of aviation safety without placing an undue regulatory burden on an emerging industry.”
The FAA proposal offers safety rules for UAS under 55 pounds conducting “non-recreational” operations. The rule would limit flights to daylight and visual line-of-sight operations. It also addresses height restrictions, operator certification, optional use of a visual observer, aircraft registration and marking, and operational limits.
The proposed rules also includes extensive discussion of the possibility of an additional, more flexible framework for “micro” UAS under 4.4 pounds. The FAA is asking the public to comment on this possible classification to determine whether it should include this option as part of a final rule. The FAA is also asking for comment about how the agency can further leverage the UAS test site program and an upcoming UAS Center of Excellence to further spur innovation at “innovation zones.”
The public will be able to comment on the proposed regulation for 60 days from the date of publication in the Federal Register. The FAA also intends to hold public meetings to discuss innovation and opportunities at the test sites and Center of Excellence. These meetings will be announced in a future Federal Register notice.
“Technology is advancing at an unprecedented pace, and this milestone allows federal regulations and the use of our national airspace to evolve to safely accommodate innovation,” said Transportation Secretary Anthony Foxx.
The proposed rule would require an operator to maintain visual line of sight of a small UAS. The rule would allow, but not require, an operator to work with a visual observer who would maintain constant visual contact with the aircraft. The operator would still need to be able to see the UAS with unaided vision (except for glasses). The FAA is asking for comments on whether the rules should permit operations beyond line of sight, and if so, what the appropriate limits should be.
Under the proposed rule, the person actually flying a small UAS would be an “operator.” An operator would have to be at least 17 years old, pass an aeronautical knowledge test and obtain an FAA UAS operator certificate. To maintain certification, the operator would have to pass the FAA knowledge tests every 24 months. A small UAS operator would not need any further private pilot certifications (such as a private pilot license or medical rating).
The new rule also proposes operating limitations designed to minimize risks to other aircraft and people and property on the ground:
A small UAS operator must always see and avoid manned aircraft. If there is a risk of collision, the UAS operator must be the first to maneuver away.
The operator must discontinue the flight when continuing would pose a hazard to other aircraft, people or property.
A small UAS operator must assess weather conditions, airspace restrictions and the location of people to lessen risks if he or she loses control of the UAS.
A small UAS may not fly over people, except those directly involved with the flight.
Flights should be limited to 500 feet altitude and no faster than 100 mph.
Operators must stay out of airport flight paths and restricted airspace areas, and obey any FAA Temporary Flight Restrictions (TFRs).
The proposed rule maintains the existing prohibition against operating in a careless or reckless manner. It also would bar an operator from allowing any object to be dropped from the UAS.
Operators would be responsible for ensuring an aircraft is safe before flying, but the FAA is not proposing that small UAS comply with current agency airworthiness standards or aircraft certification. For example, an operator would have to perform a preflight inspection that includes checking the communications link between the control station and the UAS. Small UAS with FAA-certificated components also could be subject to agency airworthiness directives.
The new rules would not apply to model aircraft. However, model aircraft operators must continue to satisfy all of the criteria specified in Sec. 336 of Public Law 112-95, including the stipulation that they be operated only for hobby or recreational purposes. Generally speaking, the new rules would not apply to government aircraft operations, because we expect that these government operations will typically continue to actively operate under the Certificate of Waiver or Authorization (COA) process unless the operator opts to comply with and fly under the new small UAS regulations.
In addition to this proposal, earlier today, the White House issued a Presidential Memorandum concerning transparency, accountability, and privacy, civil rights, and civil liberties protections for the Federal Government’s use of UAS in the national airspace system, which directs the initiation of a multi-stakeholder engagement process to develop a framework for privacy, accountability, and transparency issues concerning commercial and private UAS use.
The current unmanned aircraft rules remain in place until the FAA implements a final new rule. The FAA encourages new operators to visit www.knowbeforeyoufly.org.
The U.S. Department of Transportation will host a third workshop to continue discussions of the GPS Adjacent Band Compatibility Assessment on March 12.
The workshop will focus on the following topics:
Identification of GPS and GNSS receivers to be considered for testing that are representative of the current categories of user applications
Discussion of a GPS/GNSS receiver test plan.
Anyone interested in presenting on either or both of the above topics should contact Stephen Mackey by March 2.
The workshop will be held 8:30 a.m.-3:30 p.m. PDT at Aerospace Corporation, 2310 E. El Segundo Blvd., El Segundo, California.