JAVAD GNSS is introducing its new unmanned aerial vehicle with the dramatic flourish of a video showing the UAV in flight, accompanied by the “Also Sprach Zarathustra” theme from 2001: A Space Odyssey.
The TRIUMPH-F1 unmanned aerial vehicle is based on the JAVAD GNSS TRIUMPH-1. TRIUMPH-1 is the company’s field-tested high-precision geodetic GNSS receiver with 864 channels to track all current and future GNSS signals.
When used on the ground, the TRIUMPH-F1 can function as a TRIUMPH-1 base or rover. The four motor arms (for eight motors) are detachable. There are four screw inserts in the bottom to attach the TRIUMPH-F1 to a pole mount for field use.
The TRIUMPH-F1 features user-friendly mission programming. The four lithium polymer batteries that power the eight propeller motors, arranged in a stacked quad formation, each have a test button and LEDs to indicate the current charge level, as well as accessible ports for easy charging.
The TRIUMPH-F1 also has two micro-SD slots for image storage, a SIM card slot, a USB connector for uploading flight plans and downloading collected images, and indicators for satellite tracking and communications. Other indicators are dedicated to flight status and gyro. It comes equipped with four angled documentation cameras and a downward high-precision camera for photogrammetry.
JAVAD GNSS will exhibit the new device at InterGeo, to be held October 7-9 in Berlin.
To learn more, watch the video or visit JAVAD GNSS.
Esri is making available an interactive Ebola Outbreaks story map. Users can explore the first known contact with the disease in 1976 in the Democratic Republic of Congo and every outbreak since then, including the ongoing crises in Guinea, Liberia, Sierra Leone, and Nigeria.
The story map includes basic statistics about each outbreak, and reports from different agencies, all accessed directly from within the map. The map appears below:
What are your challenges this year? How are you driving business in today’s economy? What issues are you concerned about? We want to know, and so does the rest of the industry.
GPS World is conducting its annual State of the Industry Survey asking GNSS professionals about the state of their business, the economic climate for GNSS products and services, driving market factors, the government’s role in funding and regulating, budgets devoted to R&D, the effects of jamming, and the “Issue of the Year.”
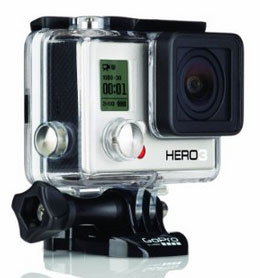
This GoPro Hero3 video camera could be yours.
Everyone who takes the survey will be automatically entered in a drawing for these prizes:
A GoPro Hero3 professional-quality video camera
A pair of tickets to GPS World’s 2014 Leadership Dinner (for those not attending ION GNSS+ in Tampa, Florida, we’ll send a voucher for a comparable dinner in your hometown);
$50 Mastercard gift cards
The survey should take about 10 minutes, and your responses are confidential.
Two satnav superpowers battled it out aboard a superyacht in the Mediterranean this summer, as a spoofing detector designed to differentiate between real and fake GPS signals came to grips with a spoofing device previously responsible for hijacking a sophisticated drone helicopter, deceiving it into landing when it was trying to hover, and for misdirecting the same luxury yacht in tests last summer.
Mark Psiaki, Cornell University professor of mechanical and aerospace engineering, and graduate student Brady O’Hanlon spent a week aboard the White Rose of Drachs, a luxury superyacht, testing their second-generation spoofing detector as the boat cruised from Monaco around the boot of Italy to Venice at the head of the Adriatic Sea. Also on board was a researcher from assistant professor Todd Humphreys’ Radionavigation Laboratory at the University of Texas at Austin. Humphreys tested his latest spoofer aboard the same yacht last year; this year, Psiaki and O’Hanlon embarked for a follow-up experiment to see if they could outsmart the spoofer.
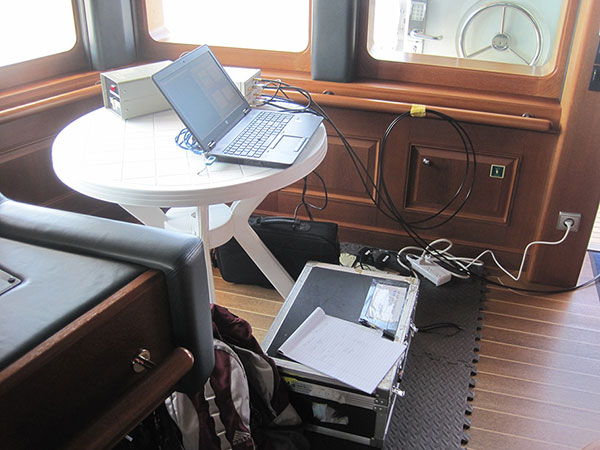
The Cornell team’s spoofing detection system electronics quietly at work detecting evildoers on the bridge of the White Rose.
Both researchers have published earlier versions of their work in GPS World magazine, Psiaki in “GNSS Spoofing Detection,” the Innovation column in the June 2013 issue, and Humphreys in “Drone Hack” in the August 2012 issue.
The former story relates how Humphreys and Psiaki began their investigations as far back as 2008. “There was no intention to help bad actors deceive GNSS user equipment. Rather, our goal was to field a formidable ‘Red Team’ as part of a ‘Red Team/Blue Team’ (foe/friend) strategy for developing advanced ‘Blue Team’ spoofing defenses.”
In international waters this summer, the Cornell and Texas teams could conduct their research unhindered; on land, it’s very difficult to get permission to hack a GPS signal, even for research purposes, Psiaki said.
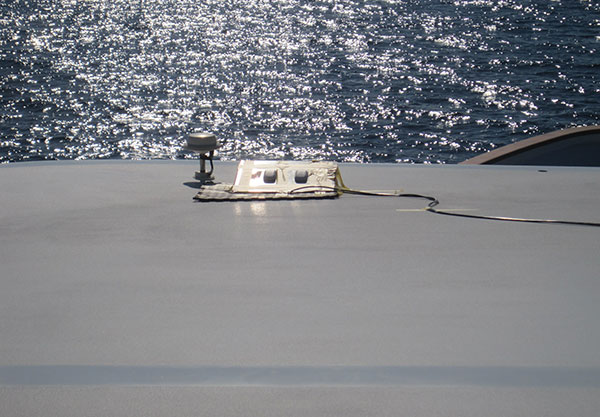
The Cornell two-antenna system installed on the roof of the White Rose bridge next to the superyacht’s GPS antenna.
Aboard the White Rose, Humphreys’ team initiated an attack of the boat’s GPS receiver, overlaying a disguised false signal on top of the real one, and attempting to send the boat off-course without generating any obvious warning signs. Stationed in a different area of the boat, Psiaki and O’Hanlon’s device set itself to detect the false signals through real-time analysis of their properties, and to provide protection against any attack by issuing a definitive warning whenever false signal characteristics were identified.
“We tested numerous spoofing scenarios,” recalled Psiaki. “We proved the efficacy of the new two-antenna version of one of our spoofing detection systems. It is the functional equivalent of our previous moving-antenna spoofing detection system. With two antennas we can simulate the effects of antenna motion without any need for moving parts. The only problems we encountered were with the initial spoofing drag-off, at which point the true and spoofed signals interfere with each other, and signal tracking can be tricky.
“We recorded wide-band data for all these cases. We think that we know how to enhance our defenses to hold on to the signals and recognizing spoofing during the initial drag-off. We also think that we know how to recover the true signals after an attack. The recorded wide-band data should enable us to develop and test these refinements in the lab, i.e., without the need to go back to sea — not that we would mind having to take another cruise on the White Rose of Drachs.”
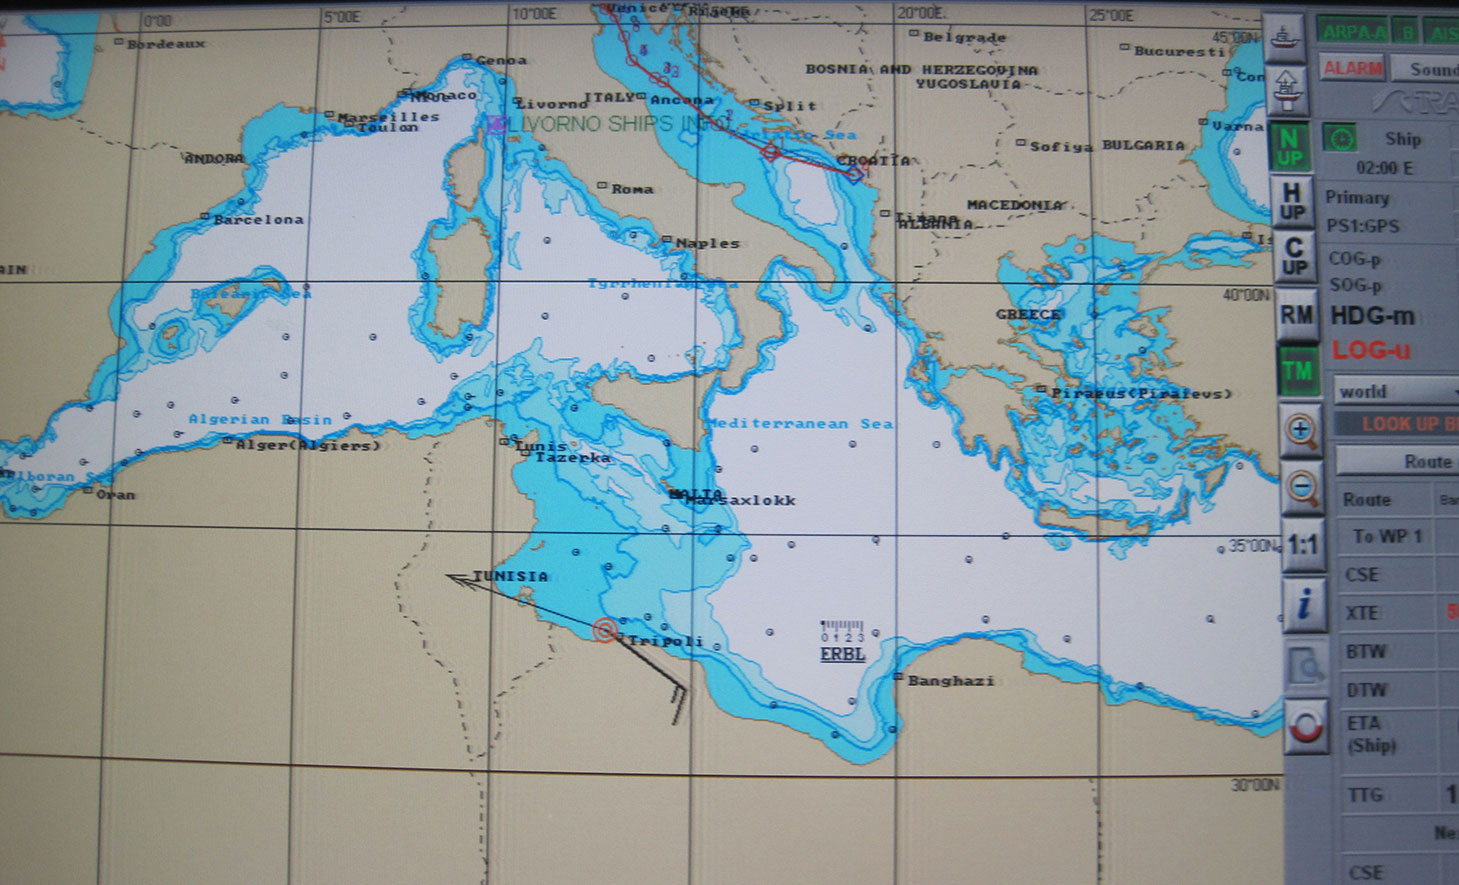
In one test, the yacht’s GPS receiver was spoofed into believing that it was veering off its course, set northwards to Venice, and heading south to Libya at a very high speed. The Cornell detector was able to warn the White Rose’s bridge crew about the attack before the yacht was 20 meters off course.
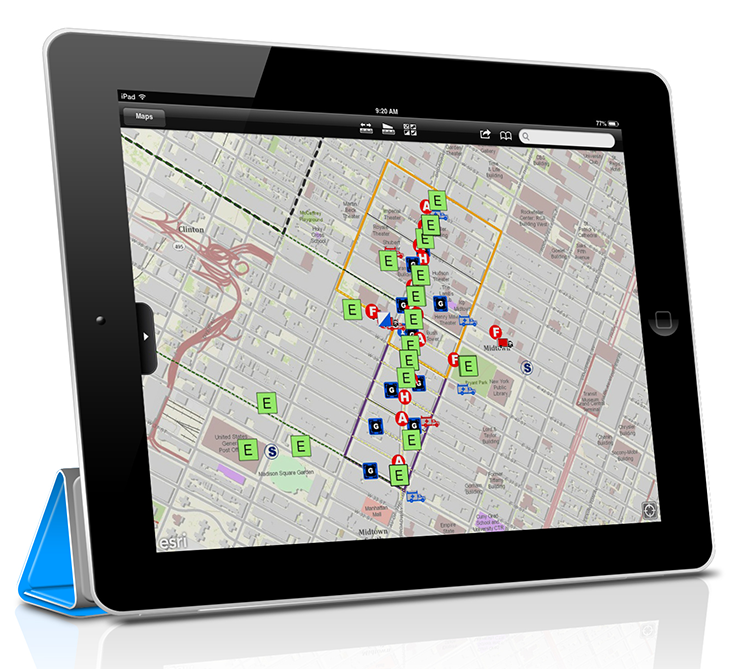
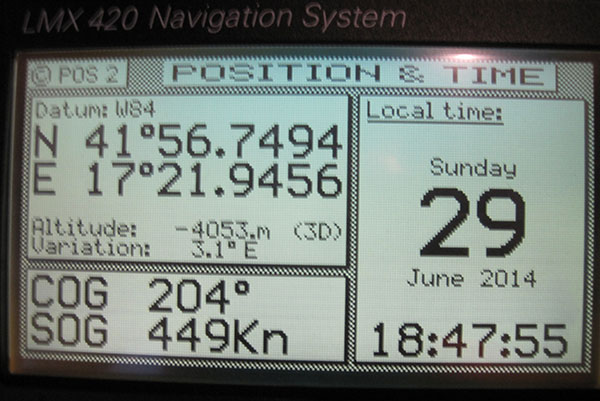
The White Rose’s GPS-driven chart showing it off the coast of Libya (black line) when it was actually in the Adriatic, cruising from Montenegro to Venice (blue line). The spoofing detector knew all along that this was a false reading.“This photo shows the White Rose’ Litton GPS receiver with ridiculous speed and altitude readings — we were in a hurry to get from the Adriatic to Libya and therefore spoofed a straight line route that took us across, actually beneath, Italy and Sicily, at speeds exceeding 900 kts in order to get there in 50 minutes. “
“We want to progress to the point where not only can we tell it’s a false signal, but we can also say, ‘Here is the true signal; here is the true position,’” Psiaki added.
The owner of the White Rose of Drachs, an anonymous businessman, allows the boat to be used for scientific purposes during off seasons.
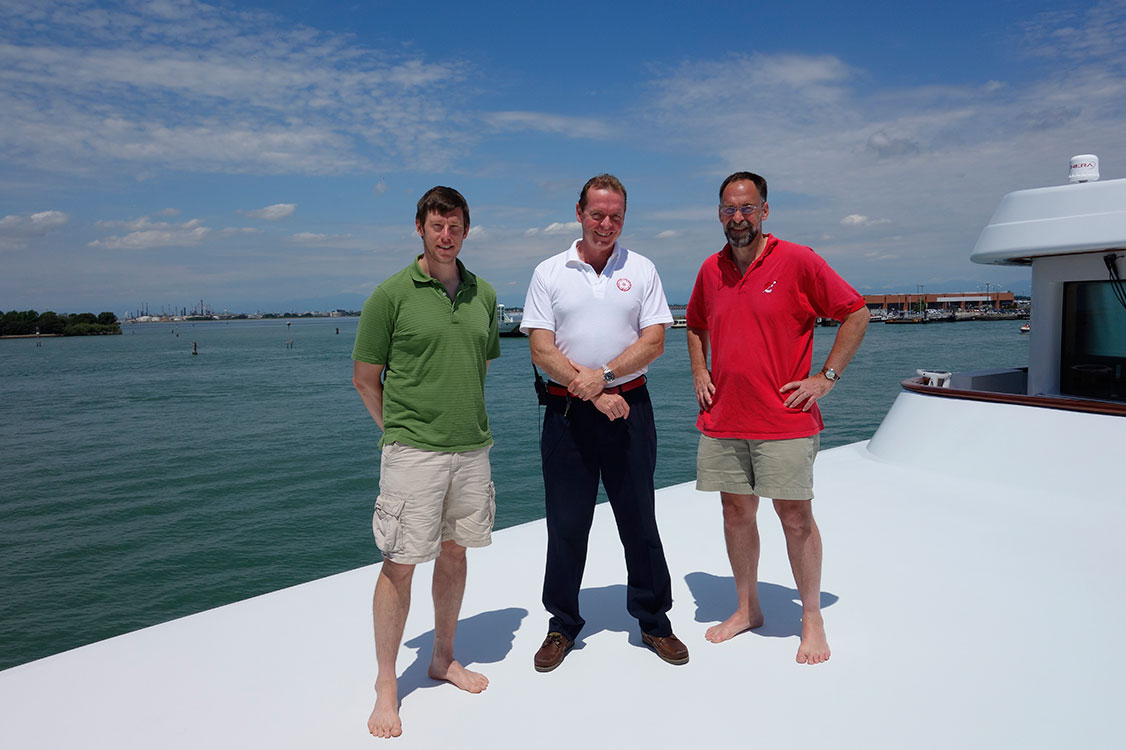
The Cornell and White Rose team: (from left) Brady O’Hanlon, Cornell ECE Ph.D. student, Andrew Schofield, master of the White Rose of Drachs, and Mark Psiaki, Cornell Prof. of Mechanical & Aerospace Engineering.
Psiaki will present a paper on the superyacht experiments at the Institute of Navigation’s GNSS+ conference in September in Tampa, Florida, and GPS World will publish an article based on this paper in the November issue.
This story draws on initial reporting by Anne Ju in the July 28 Cornell Chronicle, with additional material and photos supplied by Mark Psiaki.
Includes: Tests Show Tech Can Meet FCC Indoor 911 Accuracy; InvenSense to Acquire Sensor Nav Companies Trusted Positioning, Movea; Business Aviation Agrees to Promote EGNOS Use at European Airports; Patent Issued for Dynamic Location Reporting; Remote Patient Monitoring to Reach €19.4B in 2018; News from the Esri User Conference; Google Acquires Satellite-Imaging Startup for $500M; EuroGeographics to Create Expert Group in GNSS Positioning; Geospatial Computing Book Published; USGS Releases Earthquake Hazard Map; Events
Scott McCormick, president of the Connected Vehicle Trade Association (CVTA) discusses Super Mobility Week, the Intelligent Transportation Systems’ World Congress, and what to expect in the connected vehicle market.
GigOptix, Inc., is making available samples of its newest GNSS RF receiver for road, maritime, agriculture and surveying applications.
GigOptrix is a supplier of advanced high speed semiconductor components for use in long-haul, metro, cloud connectivity, data centers, consumer electronics links and interactive applications, through optical and wireless communications networks.
The new EXG0201 device is expected to be one of several RF-focused products the company will bring to market over the next few quarters stemming from the recently acquired Tahoe RF Semiconductor, now called the GigOptix-Auburn RF Design Center after its integration into GigOptix earlier this month.
The new EXG0201 product marks the introduction of GNSS RF receivers by GigOptix. It is a low-power consumption, highly linear RF GNSS receiver in a small Quad Flat No-Lead (QFN) package. The fully integrated device is optimized for industrial applications and has dual channels supporting both the upper and lower GNSS bands.
The EXG0201 provides two modes of operation, a high-resolution mode and a low-resolution, low-power mode. It integrates RF signal processing, 12 or 3-bit analog to digital convertors, dual fractional-N synthesizers (with a shared reference to generate RF LO signals) and a three-wire SPI digital interface to provide the necessary functionality required to create a high-end GNSS receiver system. All of the EXG0201 sub-systems are programmable through the use of the on-chip SPI interface.
The GNSS industrial market, supporting road, maritime, agriculture, and surveying applications, is expected to grow to 67% in annual shipments to 43 million devices. The road segment dominates the annual quantity consuming about 98% of the total shipments. The road segment’s growth is driven by increased regulatory pressure for E911 emergency location calls.
“The EXG0201 represents our introduction of fully integrated RF-to-bits devices into a growing GNSS market, and serves as a proof point to the strategic importance of the Tahoe RF acquisition. The newly acquired IP and product capabilities put us in an excellent position to provide differentiated solutions and increased business over the long-term,” said Irshad Rasheed, director of marketing for wireless and RF products at GigOptix. “From a capabilities standpoint, the EXG0201 provides excellent performance with 28 MHz of signal bandwidth, dual-channel operation, 60 dB of instantaneous dynamic range, and 75 dB of gain, all contained within a small 72-pin QFN package.”
The EXG0201 is expected to ship in full production quantities starting in the fourth quarter of fiscal 2014.
Organized by decade, the interactive map lets users explore inductees in the Pro Football Hall of Fame from the initial class in 1963 to this year’s seven inductees. Users can see where each gridiron great is from and explore biographical information from the Pro Football Hall of Fame about each inductee.
2014 USGS National Seismic Hazard Map, displaying intensity of potential ground shaking from an earthquake in 50 years (which is the typical lifetime of a building).
To help make the best decisions to protect communities from earthquakes, new USGS maps display how intense ground shaking could be across the nation.
The USGS recently updated its U.S. National Seismic Hazard Maps, which reflect the best and most current understanding of where future earthquakes will occur, how often they will occur, and how hard the ground will likely shake as a result.
42 States at Risk; 16 States at High Risk
While all states have some potential for earthquakes, 42 of the 50 states have a reasonable chance of experiencing damaging ground shaking from an earthquake in 50 years (the typical lifetime of a building). Scientists also conclude that 16 states have a relatively high likelihood of experiencing damaging ground shaking. These states have historically experienced earthquakes with a magnitude 6 or greater.
The hazard is especially high along the west coast, intermountain west, and in several active regions of the central and eastern U.S., such as near New Madrid, Missouri, and near Charleston, South Carolina. The 16 states at highest risk are Alaska, Arkansas, California, Hawaii, Idaho, Illinois, Kentucky, Missouri, Montana, Nevada, Oregon, South Carolina, Tennessee, Utah, Washington, and Wyoming.
While these overarching conclusions of the national-level hazard are similar to those of the previous maps released in 2008, details and estimates differ for many cities and states. Several areas have been identified as being capable of having the potential for larger and more powerful earthquakes than previously thought due to more data and updated earthquake models. The most prominent changes are discussed below.
Students conduct the “drop, cover, hold on” safety procedure during an earthquake preparedness drill. Photo Credit: Jessica Robertson, USGS
Informed Decisions Based on the Maps
With an understanding of potential ground shaking levels, various risk analyses can be calculated by considering factors like population levels, building exposure, and building construction practices. This is used for establishing building codes, and in the analysis of seismic risk for key structures. This can also help in determining insurance rates, emergency preparedness plans, and private property decisions such as re-evaluating one’s home and making it more resilient.
These maps are part of USGS contributions to the National Earthquake Hazards Reduction Program (NEHRP), which is a congressionally-established partnership of four federal agencies with the purpose of reducing risks to life and property in the U.S. that result from earthquakes. The contributing agencies are the USGS, Federal Emergency Management Agency (FEMA), National Institute of Standards and Technology, and National Science Foundation (NSF). As an example of the collaboration, the hazards identified in the USGS maps underlie FEMA-sponsored seismic design provisions that are incorporated into building codes adopted by states and localities. The maps also reflect investments in research by academic and other scientists supported by grants from the USGS and the NSF.
“The standards for seismic safety in building codes are directly based upon USGS assessments of potential ground shaking from earthquakes, and have been for years,” said Jim Harris, a member and former chair of the Provisions Update Committee of the Building Seismic Safety Council.
“The committees preparing those standards welcome this updated USGS information as a basis for making decisions and continuing to ensure the most stable and secure construction.”
Key Updates
East Coast
The eastern U.S. has the potential for larger and more damaging earthquakes than considered in previous maps and assessments. As one example, scientists learned a lot following the magnitude 5.8 earthquake that struck Virginia in 2011. It was among the largest earthquakes to occur along the east coast in the last century, and helped determine that even larger events are possible. Estimates of earthquake hazards near Charleston, SC, have also gone up due to the assessment of earthquakes in the state.
Damage to the Washington National Cathedral in DC from the earthquake in Virginia on August 23, 2011. Photo Credit: William Leith, USGS
In New York City, the maps indicate a slightly lower hazard for tall buildings than previously thought (but still a hazard nonetheless). Scientists estimated a lower likelihood for slow shaking from an earthquake near the city. Slow shaking is likely to cause more damage to tall structures in contrast, compared to fast shaking which is more likely to impact shorter structures.
Central U.S.
The New Madrid Seismic Zone has been identified to have a larger range of potential earthquake magnitudes and locations than previously identified. This is a result of a range of new research, part of which was recently compiled by the Nuclear Regulatory Commission.
West Coast
In California, earthquake hazard extends over a wider area than previously thought. Most notably, faults were recently discovered, raising earthquake hazard estimates for San Jose, Vallejo and San Diego. On the other hand, new insights on faults and rupture processes reduced earthquake hazard estimates for Irvine, Santa Barbara and Oakland. Hazard increased in some parts of the San Francisco Bay Area and Los Angeles region and decreased in other parts. These updates were from the new Uniform California Earthquake Rupture Forecast Model, which incorporates many more potential fault ruptures than did previous assessments. Recent earthquakes in Alaska, Mexico and New Zealand taught scientists more about complex ruptures and how faults can link together. This insight was applied to California for which approximately 250,000 potential complex ruptures were modeled.
New research on the Cascadia Subduction Zone resulted in increased estimates of earthquake magnitude up to magnitude 9.3. Deep-sea cores were collected that show evidence within the sea-floor sediments of large earthquake-generated mudflows. Earthquake shaking estimates were also increased following abundant data gathered from the magnitude 9.0 earthquake in Tohoku, Japan in 2011 and the magnitude 8.2 earthquake offshore of Chile in 2014, as those events ruptured along subduction zones similar to the Pacific Northwest zone.
In Washington, scientists incorporated new knowledge of the Tacoma Fault into the maps and identified changes to the geometry of the Whidbey Island fault in the northern Puget Sound. Earthquake hazard also increased for Las Vegas because of new science. In Utah, scientists dug trenches to study prehistoric earthquakes along the Wasatch Fault. While the overall seismic hazard didn’t change significantly, detailed changes were made to the fault models in this region and robust data were acquired to hone the assessments. This is valuable since approximately 75% of Utah’s population, including the residents of Salt Lake City, lives near this fault.
The magnitude 7.9 earthquake in Wenchuan, China in 2008 provided many new records of shaking that are very similar to anticipated future earthquakes in the western U.S., as the fault structures are similar. Previously, scientists did not have nearly as many shaking records from earthquakes of this size.
Induced Earthquakes — Research Underway
Some states have experienced increased seismicity in the past few years that may be associated with human activities such as the disposal of wastewater in deep wells.
One specific focus for the future is including an additional layer to these earthquake hazard maps to account for recent potentially triggered earthquakes that occur near some wastewater disposal wells. Injection-induced earthquakes are challenging to incorporate into hazard models because they may not behave like natural earthquakes and their rates change based on man-made activities.
PenBay Solutions, a developer of GIS-based facility management and public safety software, is introducing InVision 1.5 in booth #F116 at the Esri User Conference in San Diego, July 14-17. The new technology will also be featured at the InVision Special Interest Group Lunch in room 28B at 12 p.m. on July 16 at the conference.
InVision software is built on the Esri ArcGIS platform to help users visualize, analyze and interpret data in ways that reach beyond individual buildings and site maps. InVision bridges the gap between managing exterior and interior built environments by aggregating all facility and infrastructure data from various sources into a single, comprehensive, visual system for portfolio management, operations, and safety and security.
The 1.5 release of InVision software introduces several new features and enhancements with an emphasis on mobile capabilities. InVision 1.5 introduces mobile viewers for:
Space Management: view space types, uses and assignments while in the field to more easily find and understand space use and classification.
Asset Management: remotely view utility and asset types, statuses and conditions to more quickly locate and evaluate assets.
Campus Viewing: provide information about campus points of interest so employees, residents and visitors can easily find what they are looking for.
Security Planning: view security plans – including both indoor and outdoor environments – and share that security information via mobile devices with outside public safety agencies and response personnel.
Security Operations: view critical building, floor, space and security asset information in the field to better understand the location and status of security assets in real time.
“Mobility is critically important to our customers,” said Stu Rich, Chief Technology Officer at PenBay Solutions. “These new InVision Mobile Viewers are just the beginning. We’re in the process of developing mobile applications designed for data collection, data editing and inspection workflows as well. Watch for announcements around those exciting new applications in the coming months.”
The InVision Secure Event Management Solution supports a range of activities and users throughout event planning, coordination, and operations. With InVision Secure, users can coordinate plan creation, manage the review and approval process, and securely share information that is relevant to the safety and security of events. The solution helped make Super Bowl XLVIII a safe and successful event, according to PenBay Solutions.
“PenBay Solutions was instrumental in helping us with all the agencies we worked with to gather data, and for implementing a public safety system that met our needs for the Super Bowl,” said Captain Steven Pollackov of FDNY’s GIS Unit. “As we move forward, we will be utilizing this platform more and more.”
CoreLogic, a global property information, analytics and data-enabled services provider, has released a new version of its EQECAT natural catastrophe modeling platform, which contains three new proprietary risk models that quantify and analyze the potential financial impact of catastrophic natural hazards in peak exposure regions across the globe. The expansion of natural catastrophe risk analysis includes modeling for earthquake and tsunami events in Japan and earthquake events in Singapore, as well as for European windstorms, including a North European offshore wind farm risk model.
EQECAT, which was acquired by CoreLogic in December 2013, first introduced its natural catastrophe risk modeling platform RQE (Risk Quantification & Engineering) in January 2013 that includes more than 180 natural hazard models for 96 countries and territories spanning six continents. Loss calculations simulate 300,000 years of losses to provide comprehensive and highly credible estimates of risk exposure to earthquakes, tropical cyclones and windstorms, severe convective storms, brushfires, winter storms and flooding.
“This release of the RQE v15.0 platform not only advances the innovative and industry-leading science that is the hallmark of EQECAT risk models, but also demonstrates the commitment CoreLogic has to delivering timely enhancements and new platform features to our clients,” said Paul Little, head of EQECAT.
The additional catastrophe risk modeling delivered through the new RQE v15.0 platform includes:
The European Windstorm Model, which introduces the ability to analyze offshore wind farm turbines that are rapidly expanding in Europe as a result of major investments in alternative energy. The “Eurowind” model extends over the North Sea, Irish Sea, Baltic Sea and Atlantic Ocean, and gives insight into loss caused by wind storms. In addition, the windstorm model includes two views of frequencies — the empirical model based on the historical record from 1960 to present, and the analytic model with a continuous 1200-year simulation of an Earth System Model (ESM) driven by climatic background conditions to characterize the frequency and severity of European windstorms. The European Windstorm Model also now incorporates Spain and Portugal, extending the existing coverage to 24 countries and provides analysis of extratropical cyclone risk. Expanded capabilities also include access to Global Climate Model research used to help determine the frequency and scale of European windstorms.
The Japan Earthquake Model, which provides the most current view of earthquake risk across the country based on December 2013 research released by the Japanese government and national research organizations. This model accounts for previously un-modeled very large magnitude events with updated seismic source zones and increased maximum magnitudes. New damage and loss data from the 2011 Great East Japan (TÅhoku-oki) earthquake prompted a complete review and update to model vulnerability functions, including major changes to performance -based effects of deep building foundations and base isolation. For the first time, CoreLogic introduces tsunami as a sub-peril, offering both a fully probabilistic and a scenario-based tsunami risk model, using 30-meter digital elevation maps for more granular and precise risk evaluations for a complete view of earthquake and tsunami risk across Japan.
The Singapore Earthquake Model, which accounts for the increased probability of a near-term large-magnitude earthquake on the Sunda (Java) megathrust fault. This fault zone is one of the most active on Earth and largely influences earthquake risk in Singapore. This new model accounts for seismic risk factors specific to Singapore, such as soft soils that amplify intermediate-period ground motions from distant large earthquakes and the existence of reinforced concrete high-rise buildings.
“Combining more than 30 years of collected data from CoreLogic with EQECAT natural catastrophe models allows us to deliver a more comprehensive, highly credible analysis of key drivers of hazard risk at various levels of exposure around the globe, from across regional borders to individual site levels,” said Mahmoud Khater, chief science officer for catastrophe modeling.
The updated EQECAT RQE v15.0 platform also offers significant enhancements to user interface, reporting options and workflow management tools. Enhancements include a more comprehensive view of exposure data with expanded filter options, event-specific hazard intensity reports for individual locations, and analysis of annual exceedance probability refined by region and sub-peril to show drivers of portfolio losses, among other capabilities.
Registration is open for Trimble’s International User Conference, Trimble Dimensions, being held November 3-5 at the Mirage and the Treasure Island Hotels in Las Vegas. The conference addresses innovations in agriculture, construction, civil infrastructure, engineering, government, mapping, natural resources, surveying, telecommunications, transportation, logistics and utilities.
Trimble Dimensions provides insight into how information technology can transform the way professionals work by using integrated workflows to increase productivity, the company said. Participants can hear how industry colleagues use Trimble’s end-to-end technology to transform data into intelligent, usable information. Attendees will see first-hand how new tools, processes and ideas can help make a positive impact on their business.
Throughout the conference, attendees will have a variety of opportunities to network with key industry players, nurture existing business relationships, build partnerships, and discover how to overcome challenges in today’s competitive business environment.
Highlights include more than 400 educational sessions, including both on-site and off-site immersive training, more than 30 specialized tracks to advance career objectives with many sessions qualifying for Professional Development Hour (PDH) hours, and on-site product demonstrations.


 Esri is making available an interactive


 Esri’s updated