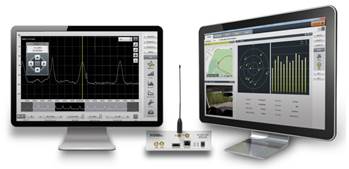
Averna, developer of test solutions and services for communications and electronics device-makers worldwide, now offers RF Studio for National Instruments Software Defined Radio Platform (USRP), converting the USRP into a portable and cost-effective RF system for the recording and playback of real-world GNSS signals.
National Instruments USRP is an affordable, PC-hosted platform used with NI LabVIEW system design software to build powerful wireless communications systems for research and education, Averna said. RF Studio is Averna’s proprietary software platform designed to streamline work with real-world RF signals. It provides user-friendly modules for capturing, processing, analyzing, archiving, and playing back RF spectrum while also maintaining the signal-recording context.
Working together, Averna and National Instruments teams developed RF Studio for the USRP, an innovative and portable solution to record and play back live RF environments to accelerate RF project work. RF Studio’s LabVIEW compatible plug-in support delivers great value to LabVIEW users as it gives them quick access to a rich toolset for their in-house applications, and supports additional capture sources and customized views.
“RF Studio for the USRP is the only cost-effective and portable product on the market that offers the flexibility to cover a wide variety of use cases, thus making it a very competitive solution for general-purpose RF record and playback,” commented Brendan Wolfe, Director of Market Development for Averna. “We’ve been working very closely with the NI teams to bring this innovative solution to market, and we expect great success from this solution partnership.”
RF Studio for the USRP offers these features:
· Record and play back real-world RF signals, up to 40 MHz wide
· Capture actual RF spectrum like FM, DAB, GPS, GLONASS, and cellular
· Visualize and record weak signals with the Noise Figure view
· Advance signal analysis with the Spectrum, Histogram, and Power views
· Use simple RF-chain configuration tools to quickly detect and set up the recording environment
· DriveView option: Log video, audio and NMEA data at the same time as recording RF
“The combination of RF Studio and the USRP provides a flexible, affordable solution for RF record and playback. Now in addition to prototyping wireless communications systems in LabVIEW, users can test them by reproducing realistic RF environments in the lab,” said Erik Luther, Wireless Communications Group Manager for National Instruments.
RF Studio for the USRP is available now to customers worldwide through National Instruments’ LabVIEW Tools Network.
Breaking Defense is reporting that DigitalGlobe has requested that the National Oceanic and Atmospheric Administration (NOAA) relax the 41-cm limit currently in place.
Walter Scott, DigitalGlobe’s founder and now executive VP and chief technical officer, tells Breaking Defense there is “significant demand” for quarter-meter resolution from the international market. And that’s why the company applied for a change to the resolution they can be licensed for from half a meter to a quarter meter.
NOAA is responsible for managing remote sensing satellite licenses in the U.S. View the Commercial Remote Sensing Regulatory Affairs website here.
Current NOAA license holders (per NOAA website) are listed below:
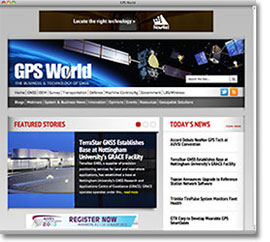
Cleveland — August 19, 2013 — GPS World, the industry-leading publication and website focused on GNSS, has launched a new, improved website redesign at env-gpsworld-integration.kinsta.cloud. The site offers a clean, fresh look with an easy-to-navigate layout and the introduction of useful features.
The redesign includes technological and aesthetic enhancements that provide improved navigation, better organization of content, and make use of current web technologies. GPS World intends for the new design to better meet the needs of its readers and visitors by making the site more functional, intuitive, and appealing.
Enhancements to the website include:
A rotating “Featured Stories” slider so visitors can quickly see important content
“Today’s News” with at-a-glance headlines
A Video Spotlight featuring news and advertiser-sponsored videos, connected to GPSWorldTV, the magazine’s YouTube channel
“I’m excited to unveil GPS World’s new website design,” said Alan Cameron, GPS World editor and publisher. “We wanted to create a site that provides a positive experience for our visitors, providing them with the news they need when they need it, as well as thoughtful commentary on the industry.”
Hand-in-hand with the site redesign, the GPS World newsletters have been given a facelift. The weekly Navigate! newsletter was the first to show off a new attractive, crisp design. The monthly, market-specific newsletters will follow in the coming month, including Survey Scene, Professional OEM, Defense PNT, GSS Monthly, GeoIntelligence Insider, and the newly combined Wireless LBS Insider (previously two separate newsletters).
GPS World’s sister site, Geospatial Solutions, will receive a similar redesign in the coming weeks.
About GPS World GPS World, published by North Coast Media, is the leading publication covering the U.S. Global Positioning System, Russia’s GLONASS constellation, Europe’s Galileo satellite navigation system, China’s Beidou/Compass system, and Japan’s QZSS. GPS World was the first publication in the market, launched over 20 years ago, and continues to be the market’s leading publication. GPS World is also the only publication in the industry that offers an audited circulation.
About North Coast Media
North Coast Media, LLC (NCM) is the largest business-to-business (B2B) publishing company headquartered in Cleveland. The company employs more than 45 professionals who collectively possess hundreds of years of experience creating and delivering unparalleled media — from industry-leading print magazines, to websites and enewsletters, to social media and mobile solutions, to exclusive industry research, custom products and one-on-one buyer-seller networking events. NCM’s flagship brands include GPS World, Landscape Management (LM), Pest Management Professional (PMP), LP Gas, Pit & Quarry and Golfdom.
GNSS Industry Outlook for 2014 Sponsored by:Hemisphere GNSS
Broadcast Date: Thursday, August 15, 2013
Moderator: Alan Cameron, Editor & Publisher, GPS World Speakers: Len Jacobson –GPS consultant,John Pottle – Marketing Director, Positioning and Navigation division, Spirent
GNSS Industry Outlook for 2014: Immediately after the GNSS State of the Industry online survey closes on August 12, our analysts provide running commentary on the polling results. We’ll look at a broad spectrum of responses (more than 700 to date, and still counting!) to questions about the GNSS economic outlook for 2013–2014, the industry’s Issue of the Year, the anticipated winners of the indoor navigation technology battle, alternate funding sources, the next evolutionary leap for commercial GNSS devices, and more. Also, sector-specific questions with responses from survey and high-precision; machine control and UAVs; wireless and consumer; satellites, signals, and simulators; defense, security, and government.
Moderator: Alan Cameron, Editor & Publisher, GPS World
Speakers:
Len Jacobson is a GPS consultant with in-depth experience in the field since 1968: executive, scientific, and marketing postions with Magnavox and Interstate Electronics (IEC), now a major part of L-3 Communications. He is active in the Institute of Navigation, having been Western Regional Vice President twice and had leadership roles in several of their conferences.
John Pottle is marketing director of Spirent’s Positioning and Navigation division, based in the UK. Under John’s leadership, Spirent has continued to follow the mantra “Testing the Future of Navigation and Positioning” as applications moved from specialist to mainstream. John holds a Bachelor of Science degree in Communication Engineering and a Masters degree in Business Administration. He is a Fellow of the Institution of Engineering and Technology and of the Royal Institute of Navigation.
An alternative tool for detecting underground nuclear explosions?
By Dorota A. Grejner-Brzezinska, Jihye Park, Joseph Helmboldt, Ralph R. B. von Frese, Thomas Wilson, and Jade Morton
Well-concealed underground nuclear explosions may go undetected by International Monitoring System sensors. An independent technique of detection and verification may be offered by GPS-based analysis of local traveling ionospheric disturbances excited by an explosion. Most of the work to date has been at the research demonstration stage; however, operational capability is possible, based on the worldwide GPS network of permanently tracking receivers. This article discusses a case study of detecting underground nuclear explosions using observations from GPS tracking stations and the Very Large Array radio telescope in New Mexico.
More than 2,000 nuclear tests were carried out between 1945 and 1996, when the Comprehensive Nuclear Test Ban Treaty was adopted by the United Nations General Assembly. Signatory countries and the number of tests conducted by each country are the United States (1000+), the Soviet Union (700+), France (200+), the United Kingdom, and China (45 each). Three countries have broken the de facto moratorium and tested nuclear weapons since 1996: India and Pakistan in 1998 (two tests each), and the Democratic People’s Republic of Korea (DPRK) in 2006 and 2009, and most recently, in 2013.
To date, 183 countries have signed the treaty. Of those, 159 countries have also ratified the treaty, including three nuclear weapon states: France, the Russian Federation, and the United Kingdom. However, before the treaty can enter into force, 44 specific nuclear-technology-holder countries must sign and ratify. Of these, India, North Korea and Pakistan have yet to sign the CTBT, and China, Egypt, Iran, Israel, and the United States have not ratified it.
The treaty has a unique and comprehensive verification regime to make sure that no nuclear explosion goes undetected. The primary components of the regime are:
The International Monitoring System: The IMS includes 337 facilities (85 percent completed to date) worldwide to monitor for signs of any nuclear explosions.
International Data Center: The IDC processes and analyzes data registered at IMS stations and produces data bulletins.
Global Communications Infrastructure: This transmits IMS data to the IDC, and transmits data bulletins and raw IMS data from IDC to member states.
Consultation and Clarification: If a member state feels that data collected imply a nuclear explosion, this process can be undertaken to resolve and clarify the matter.
On-Site Inspection: OSI is regarded as the final verification measure under the treaty.
Confidence-Building Measures: These are voluntary actions. For example, a member state will notifying CTBTO when there will be large detonations, such as a chemical explosion or a mining blast.
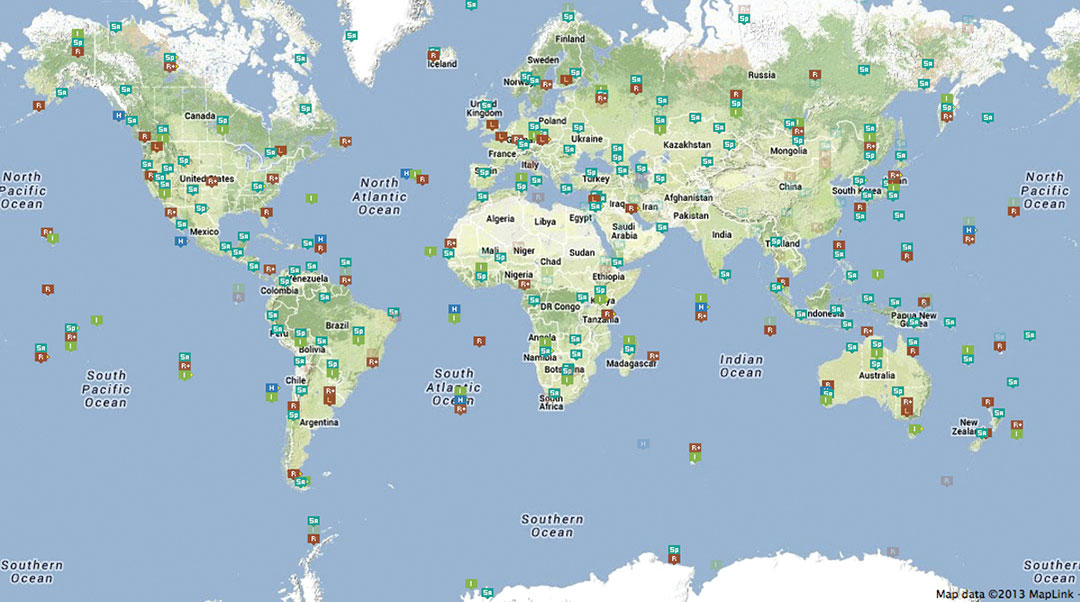
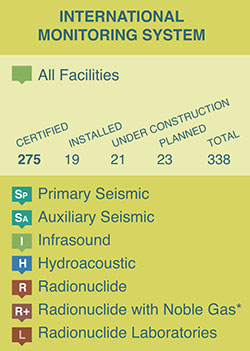
The IMS (see Figure 1) uses the following state-of-the-art technologies. Numbers given reflect the target configuration:
Seismic: Fifty primary and 120 auxiliary seismic stations monitor shockwaves in the Earth. The vast majority of these shockwaves — many thousands every year — are caused by earthquakes. But man-made explosions such as mine explosions or the North Korean nuclear tests in 2006, 2009, and 2013 are also detected.
Hydroacoustic: As sound waves from explosions can travel extremely far underwater, 11 hydroacoustic stations “listen” for sound waves in the Earth oceans.
Infrasound: Sixty stations on the surface of the Earth can detect ultra-low-frequency sound waves that are inaudible to the human ear, which are released by large explosions.
Radionuclide: Eighty stations measure the atmosphere for radioactive particles; 40 of them can also detect the presence of noble gas.
Figure 1. The International Monitoring System (IMS): worldwide facilities grouped by detection technologies used.
Only the radionuclide measurements can give an unquestionable indication as to whether an explosion detected by the other methods was actually nuclear or not. The observing stations are supported by 16 radionuclide laboratories.
Since radionuclide detection method provides the ultimate verification as far as the type of blast goes, it should be mentioned that while the 2006 North Korean event (yield of less than a kiloton) was detected by the IMS stations in more than 20 different sites within two hours of detonation, and both seismic signal and radioactive material were detected, the 2009 event (yield of a few kilotons) was detected by 61 IMS stations; seismic and infrasound signals were detected, but no radioactive material was picked up by the radionuclide stations. Seismic signal was consistent with a nuclear test, but there was no “ultimate” proof by the radionuclide method.
Thus, well-concealed underground nuclear explosions (UNEs) may be undetected by some of the IMS sensors (such as the radionuclide network). This raises a question: Is there any other technology that is readily available that can detect and discriminate various types of blasts, particularly those of nuclear type? Recent experiments have shown that an independent technique of detection and verification may be offered by GPS-based analysis of local traveling ionospheric disturbances (TIDs) excited by an explosion.
GNSS-Based Detection
Atmospheric effects from mostly atmospheric nuclear explosions have been studied since the 1960s.The ionospheric delay in GNSS signals observed by the ground stations can be processed into total electron content (TEC), which is the total number of electrons along the GNSS signal’s path between the satellite and the receiver on the ground. The TEC derived from the slant signal path, referred to as the slant TEC (STEC), can be observed and analyzed to identify disturbances associated with the underground nuclear explosion.
STEC signature (in spectral and/or spatial-temporal domains) can be analyzed to detect local traveling ionospheric disturbances (TID).
TID can be excited by acoustic gravity waves from a point source, such as surface or underground explosions, geomagnetic storms, tsunamis, and tropical storms. TIDs can be classified as Large-Scale TID (LSTID) and Medium-Scale TID (MSTID) based on their periods regardless of the generation mechanism. The periods of LSTIDs generally range between 30–60 minutes to several hours, and those of MSTIDs range from 10 to 40 or even 60 minutes. LSTIDs mostly occur from geophysical events, such as geomagnetic storms, which can be indicated by global Kp indices, while MSTIDs are genrally not related to any high score Kp indices. An underground nuclear explosion can result in an MSTID.
TIDs are generated either by internal gravity wave (IGW) or by acoustic gravity wave (AGW). The collisional interaction between the neutral and charged components cause ionospheric responses. The experimental results indicate IGWs can change the ozone concentration in the atmosphere. In the ionosphere, the motion of the neutral gas in the AGW sets the ionospheric plasma into motion.
The AGW changes the iso-ionic contours, resulting in a traveling ionospheric disturbance.
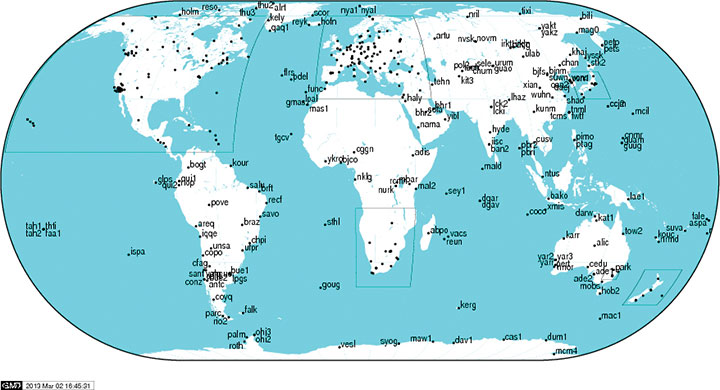
The past 10–15 years has resulted in a significant body of research, and eventually a practical application, with worldwide coverage, of GPS-based ionosphere monitoring. A significant number of International GNSS Service (IGS) permanent GNSS tracking stations (see Figure 2) form a powerful scientific tool capable of near real-time monitoring and detection of various ionospheric anomalies, such as those originating from the underground nuclear explosions (UNEs).
Figure 2. The IGS global tracking network of 439 stations.
The network is capable of continuously monitoring global ionospheric behavior based on ionospheric delays in the GNSS signals. The GNSS signals are readily accessible anywhere on Earth at a temporal resolution ranging from about 30 seconds up to less than 1 second.
A powerful means to isolate and relate disturbances observed in TEC measurements from different receiver-satellite paths is to analyze the spectral coherence of the disturbances. However, in our algorithms, we emphasize the spatial and temporal relationship among the TEC observations. Spatial and temporal fluctuations in TEC are indicative of the dynamics of the ionosphere, and thus help in mapping TIDs excited by acoustic-gravity waves from point sources, as well as by geomagnetic storms, tropical storms, earthquakes, tsunamis, volcanic explosions, and other effects.
Methodology of UNE Detection
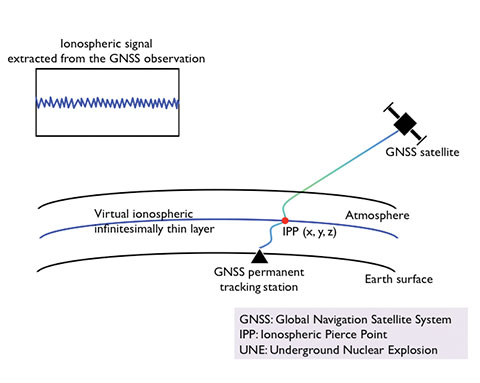
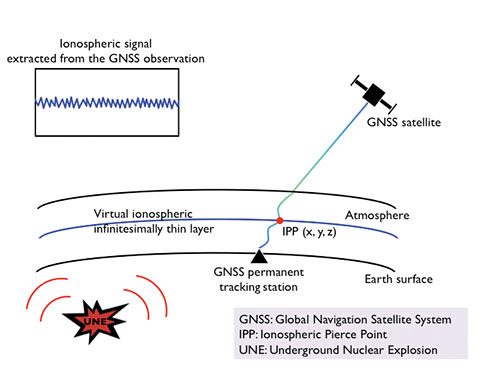
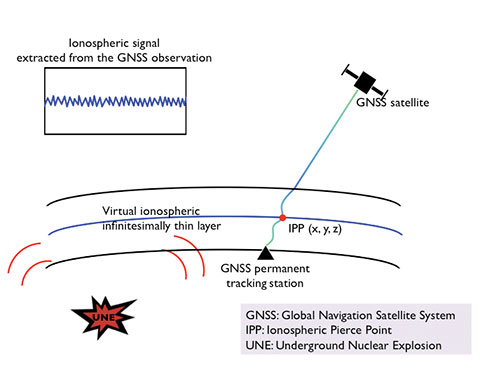
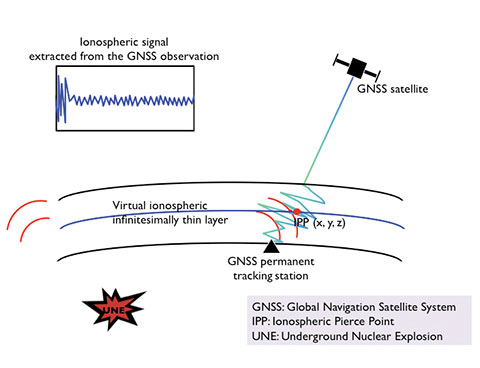
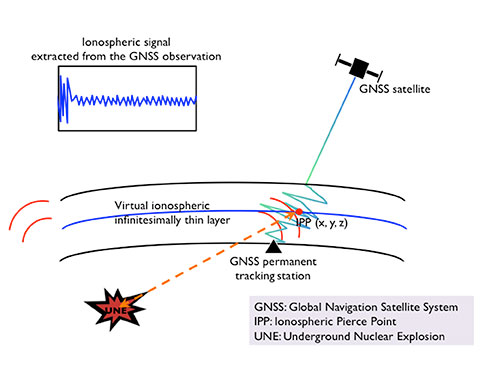
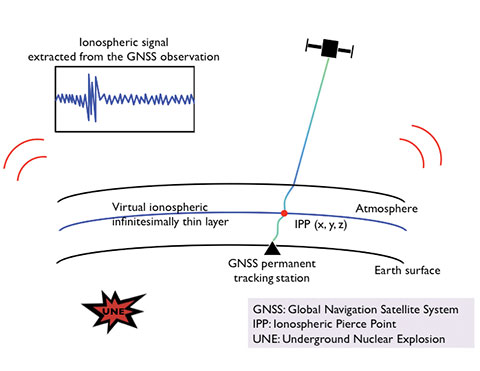
Figure 3 illustrates the concept of the generation of the acoustic gravity wave by a UNE event, and its propagation through the ionosphere that results in a traveling ionospheric disturbance (TID). The primary points of our approach are: (1) STEC is calculated from dual-frequency GPS carrier phase data, (2) after eliminating the main trend in STEC by taking the numerical third order horizontal 3-point derivatives, the TIDs are isolated, (3) we assume an array signature of the TID waves, (4) we assume constant radial propagation velocity, vT, using an apparent velocity, vi, of the TID at the ith observing GNSS station, (5) since the TID’s velocity is strongly affected by the ionospheric wind velocity components, vN and vE, in the north and east directions, respectively, the unknown parameters,vT, vN, and vE, can be estimated relative to the point source epicenter, and (6) if more than six GNSS stations in good geometry observe the TID in GNSS signals, the coordinates of the epicenter can also be estimated.
Figure 3a. Pictorial representation of the scenario describing a GNSS station tracking a satellite and the ionospheric signal (3-point STEC derivative); not to scale.Figure 3b. The scenario describing a GNSS station tracking a satellite and the ionospheric signal and a point source (e.g., UNE) that generates acoustic gravity waves; not to scale.Figure 3c. The scenario describing a GNSS station tracking a satellite and the ionospheric signal, and the propagation of the acoustic gravity waves generated by a point source (e.g., UNE); not to scale.Figure 3d. The scenario describing a GNSS station tracking a satellite and the ionospheric signal, at the epoch when the GNSS signal is affected by the propagation of the acoustic gravity waves generated by a point source (e.g., UNE); not to scale.Figure 3e. Same as 3D, indicating that the geometry between GNSS station, the satellite and the IPP can be recovered and used for locating the point source; multiple GNSS stations are needed to find the point source location and the the velocity components of TID and ionospheric winds; not to scale.Figure 3f. Same as 3D, after the TID wave passed the line of sight between the GNSS stations and the satellite; not to scale.
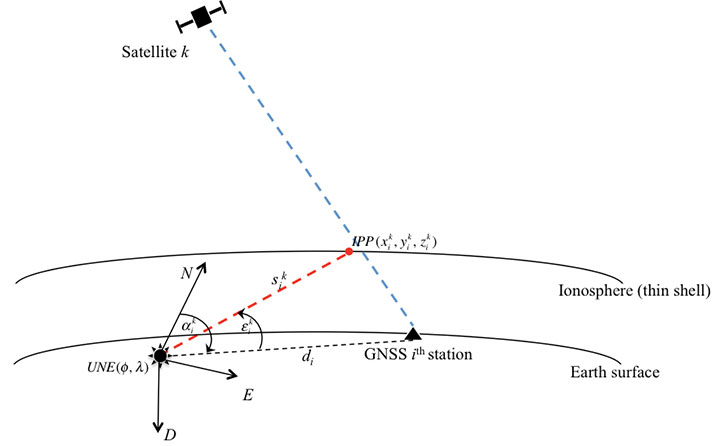
Figure 4 illustrates the geometry of detection of the point source epicenter. Determination of the epicenter of the point source that induced TIDs can be achieved by trilateration, similarly to GPS positioning concept. The TIDs, generated at the point source, propagate at certain speed, and are detected by multiple GPS stations.
The initial assumption in our work was to use a constant propagation velocity of a TID. By observing the time of TID arrival at the ionospheric pierce point (IPP), the travel distance from the epicenter to the IPP of the GPS station that detected a TID (which is the slant distance from the ith station and the kth satellite) can be derived using a relationship with the propagation velocity. In this study, we defined a thin shell in the ionosphere F layer, 300 kilometers above the surface, and computed the IPP location for each GPS signal at the corresponding time epoch of TID detection.
Figure 4. Geometry of point source detection based on TID signals detected at the IPP of GPS station, i, with GPS satellite k. Unknown: coordinates of the point source, ( ф, λ ); three components of TID velocity vT, vN, and vE ; Observations: coordinates of IPP, (xik, yik, zik) and the corresponding time epoch to TID arrival at IPP, tik; Related terms: slant distance between IPP and UNE, sik; horizontal distance between the point source epicenter and the GPS station coordinates, di; azimuth and the elevation angle of IPP as seen from the UNE, αjk and εjk , respectively.
Very Large Array (VLA)
In addition to GNSS-based method of ionosphere monitoring, there are other more conventional techniques, for example, ground-based ionosondes, high-frequency radars, Doppler radar systems, dual-frequency altimeter, and radio telescopes. In our research, we studied the ionospheric detection of UNEs using GPS and the Very Large Array (VLA) radio telescope.
The VLA is a world-class UHF/VHF interferometer 50 miles west of Socorro, New Mexico. It consists of 27 dishes in a Y-shaped configuration, each one 25 meters in diameter, cycled through four configurations (A, B, C, D) spanning 36, 11, 3.4, and 1 kilometers, respectively. The instrument measures correlations between signals from pairs of antennas, used to reconstruct images of the sky equivalent to using a much larger single telescope. While conducting these observations, the VLA provides 27 parallel lines of sight through the ionosphere toward cosmic sources.
Past studies have shown that interferometric radio telescopes like the VLA can be powerful tools for characterizing ionospheric fluctuations over a wide range of amplitudes and scales. We used these new VLA-based techniques and a GPS-based approach to investigate the signature of a TID originated by a UNE jointly observed by both GPS and the VLA. For this case study, we selected one of the 1992 U.S. UNEs for which simultaneous GPS and VLA data were available.
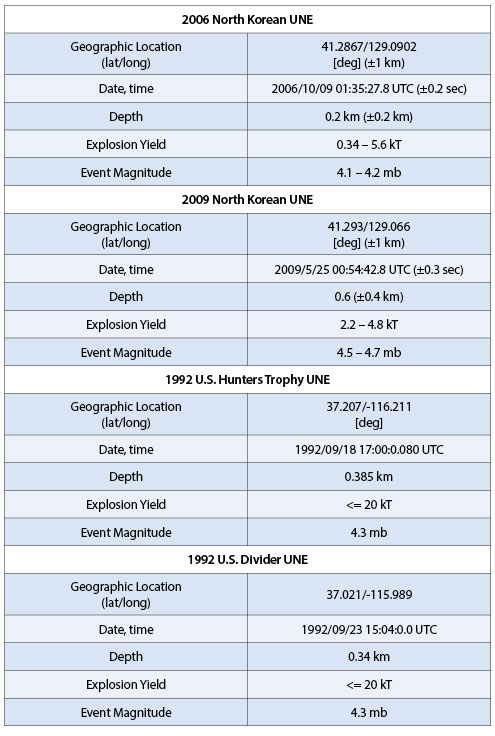
Table 1. Characteristics of the analyzed events (UNEs).
Experimental Results
We summarize here the test studies performed by the OSU group in collaboration with Miami University and the U.S. Naval Research Laboratory on detection and discrimination of TIDs resulting from UNEs using the GNSS-based and VLA-based techniques. Table 1 lists the UNE events that have been analyzed to date. As of March 2013, the results of the 2013 North Korean UNE were not fully completed, so they are not included here.
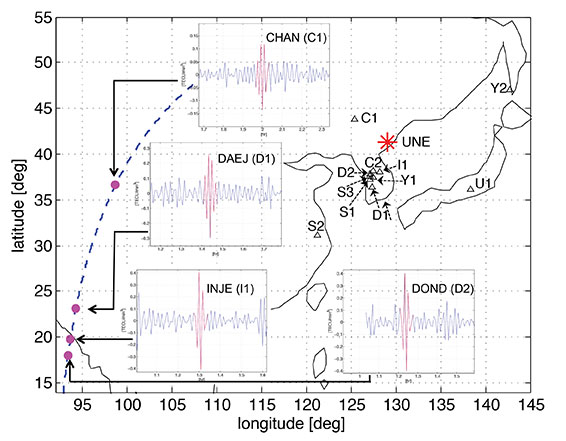
In the 2006 and 2009 North Korean UNE experiments, STEC data from six and 11 nearby GNSS stations, respectively, were used. Within about 23 minutes to a few hours since the explosion, the GNSS stations detected the TIDs, whose arrival time for each station formulated the linear model with respect to the distance to the station. TIDs were observed to propagate with speeds of roughly 150–400 m/s at stations about 365 km to 1330 km from the explosion site. Considering the ionospheric wind effect, the wind-adjusted TIDs located the UNE to within about 2.7 km of its seismically determined epicenter (for the 2009 event; no epicenter location was performed for the 2006 event due to insufficient data). The coordinates estimated by our algorithm are comparable to the seismically determined epicenter, with the accuracy close to the seismic method itself. It is important to note that the accuracy of the proposed method is likely to improve if the stations in better geometry are used and more signals affected by a TID can be observed. An example geometry of UNE detection is shown in Figure 5.
Figure 5. Locations of the underground nuclear explosion (UNE) in 2009 and GNSS stations C1 (CHAN), C2 (CHLW), D1 (DAEJ), D2 (DOND), I1 (INJE), S1 (SUWN), S2 (SHAO), S3 (SOUL), U1 (USUD), Y1 (YANP), Y2 (YSSK) on the coastline map around Korea, China, and Japan. The TID waves are highlighted for stations C1, D1, D2, I1. The bold dashed line indicates the ground track for satellite PRN 26 with dots that indicating the arrival times of the TIDs at their IPPs. All time labels in the figure are in UTC.
For the Hunters Trophy and the Divider UNE tests, the array signature of TIDs at the vicinity of GPS stations was observed for each event. By applying the first-order polynomial model to compute the approximate velocity of TID propagation for each UNE, the data points — that is the TID observations — were fit to the model within the 95 percent confidence interval, resulting in the propagation velocities of 570 m/s and 740 m/s for the Hunters Trophy and the Divider, respectively.
The VLA has observing bands between 1 and 50 GHz, and prior to 2008 had a separate VHF system with two bands centered at 74 and 330 MHz. A new wider-band VHF system is currently being commissioned. The VHF bands and L-band (1.4 GHz) are significantly affected by the ionosphere in a similar way as the GPS signal. In this study, we used VLA observations at L-band of ionospheric fluctuations as an independent verification of the earlier developed method based on the GNSS TID detection for UNE location and discrimination from TIDs generated by other types of point sources.
The VLA, operated as an interfer-ometer, measures the correlation of complex voltages from each unique pair of antennas (baselines), to produce what are referred to as visibilities. Each antenna is pointed at the same cosmic source; however, due to spatial separation, each antenna’s line of sight passes through a different part of the ionosphere. Consequently, the measured visibilities include an extra phase term due to the difference in ionospheric delays, which translates to distortions in the image made with the visibilities. This extra phase term is proportional to the difference in STEC along the lines of sight of the two telescopes that form a baseline. Thus, the interferometer is sensitive to the STEC gradient rather than STEC itself, which renders it capable of sensing both temporal and spatial fluctuations in STEC.
The spectral analysis was performed on the STEC gradients recovered from each baseline that observed the Hunters Trophy event. Briefly, a time series of the two-dimensional STEC gradient is computed at each antenna. Then, a three-dimensional Fourier transform is performed, one temporal and two spatial, over the array and within a given time period (here ~15 minutes). The resulting power spectrum then yields information about the size, direction, and speed of any detected wavelike disturbances within the STEC gradient data.
Roughly 20 to 25 minutes after the UNE, total fluctuation power increased dramatically (by a factor of about 5×10³). At this time, the signature of waves moving nearly perpendicular to the direction from Hunters Trophy (toward the northeast and southwest) was observed using the three-dimensional spectral analysis technique. These fluctuations had wavelengths of about 2 km and inferred speeds of 2-8 m s-1. This implies that they are likely due to small-scale distortions moving along the wavefront, not visible with GPS. Assuming that these waves are associated with the arrival of disturbances associated with the Hunters Trophy event, a propagation speed of 570–710 m/s was calculated, which is consistent with the GPS results detailed above.
In addition, a TID, possibly induced by the February 12, 2013, North Korean UNE, was also detected using the nearby IGS stations, by the detection algorithm referred to earlier. Eleven TID waves were found from ten IGS stations, which were located in South Korea, Japan, and Russia. Due to the weakness of the geometry, the epicenter and the ionospheric wind velocity were not determined at this point. The apparent velocity of TID was roughly about 330–800 m/s, and was calculated using the arrival time of the TID after the UNE epoch and the slant distance between the corresponding IPP and the epicenter. The reported explosion yield was bigger, compared to the 2009 North Korean UNE, which possibly affected the propagation velocity by releasing a stronger energy. However, more in-depth investigation of this event and the corresponding GPS data is required.
Conclusions
Research shows that UNEs disturb the ionosphere, which results in TIDs that can be detected by GNSS permanent tracking stations as well as the VLA. We have summarized several GNSS-based TID detections induced by various UNEs, and verified the GNSS-based technique independently by a VLA-based method using the 1992 U.S. UNE, Hunters Trophy. It should be noted that VLA observation was not available during the time of the Divider UNE test; hence, only the Hunters Trophy was jointly detected by GPS and the VLA. Our studies performed to date suggest that the global availability of GNSS tracking networks may offer a future UNE detection method, which could complement the International Monitoring System (IMS).
We have also shown that radio-frequency arrays like the VLA may also be a useful asset for not only detecting UNEs, but for obtaining a better understanding of the structure of the ionospheric waves generated by these explosions. The next generation of HV/VHF telescopes being developed (such as the Lower Frequency Array in the Netherlands, the Long Wavelength Array in New Mexico, the Murchison Widefield Array in Australia) utilize arrays of dipole antennas, which are much cheaper to build and operate and are potentially portable.
It is conceivable that a series of relatively economical and relocatable arrays consisting of these types of dipoles could provide another valuable supplement to the current IMS in the future, particularly for low-yield UNEs that may not be detectable with GPS.
Acknowledgment
This article is based on a paper presented at the Institute of Navigation Pacific PNT Conference held April 22–25, 2013, in Honolulu, Hawaii.
Dorota A. Grejner-Brzezinska is a professor and chair, Department of Civil, Environmental and Geodetic Engineering, and director of the Satellite Positioning and Inertial Navigation (SPIN) Laboratory at The Ohio State University.
Jihye Park recently completed her Ph.D. in Geodetic Science program at The Ohio State University. She obtained her B.A. and M.S degrees in Geoinformatics from The University of Seoul, South Korea.
Joseph Helmboldt is a radio astronomer within the Remote Sensing Division of the U.S. Naval Research Laboratory.
Ralph R.B. von Frese is a professor in the Division of Earth and Planetary Sciences of the School of Earth Sciences at Ohio State University.
Thomas Wilson is a radio astronomer within the Remote Sensing Division of the U.S. Naval Research Laboratory.
Yu (Jade) Morton is a professor in the Department of Electrical and Computer Engineering at Miami University.
Two Autonomous Vehicles Seek Safe Avoidance in Critical Tests
A new state-of-the-art research center runs car-makers’ safety systems through their paces, in tandem with a soft-target robot that can be crash-impacted without adverse effects. Precise positioning and exact repeatability of test sequences are key criteria.
Paul Perrone, Perrone Robotics
The Insurance Institute for Highway Safety has undertaken a $30 million expansion project at its Vehicle Research Center near Washington, D.C., enlarging and enhancing a state-of-the-art vehicle test track and building a new 700 x 300-foot (213 x 91-meter) covered track for weather-resistant testing.
The VRC will use new robotic and positioning technologies to achieve required levels of precision and repeatability for vehicle testing of frontal collision avoidance and other safety systems. Tests of both the same and different vehicles must be conducted under identical, controlled conditions for the results to have comparable fidelity.
Crash tests and research conducted at the VRC help drive life-saving improvements in vehicle designs. The new facility will enable staff to evaluate emerging automated vehicle technology in commercial vehicle systems intended to prevent crashes or lessen their severity, with the goal of encouraging the entire industry to adopt the most effective new features.
Safety systems in vehicles to be tested include the following:
◾ Adaptive cruise control
◾ Collision-imminent braking
◾ Lane-departure warning/correction
◾ Other automated technologies.
Such functions represent semi-automated functions aboard vehicles now on the road. The system is also designed to address and test the full spectrum of semi- to fully-automated vehicles, addressing evolving levels of autonomy and ultimately producing driverless vehicle technology.
IIHS has contracted Perrone Robotics, Inc. (PRI), to deliver a robotic system for testing such vehicles. PRI develops new applications using its MAX robotics and suite of automation software building blocks. MAX enables rapid integration of a range of sensor and actuator types and has evolved with several frameworks, including MAX-UGV for unmanned ground vehicles. PRI has used MAX-UGV to build automated passenger cars, all-terrain vehicles, tractors, custom platforms, and rockstar Neil Young’s long-range electric LincVolt, a converted 1959 Lincoln Continental.
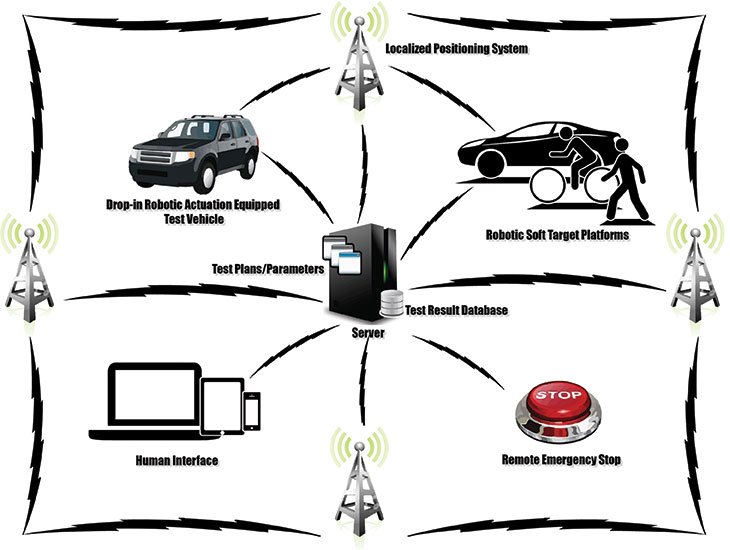
FIGURE 1. PRI test system.
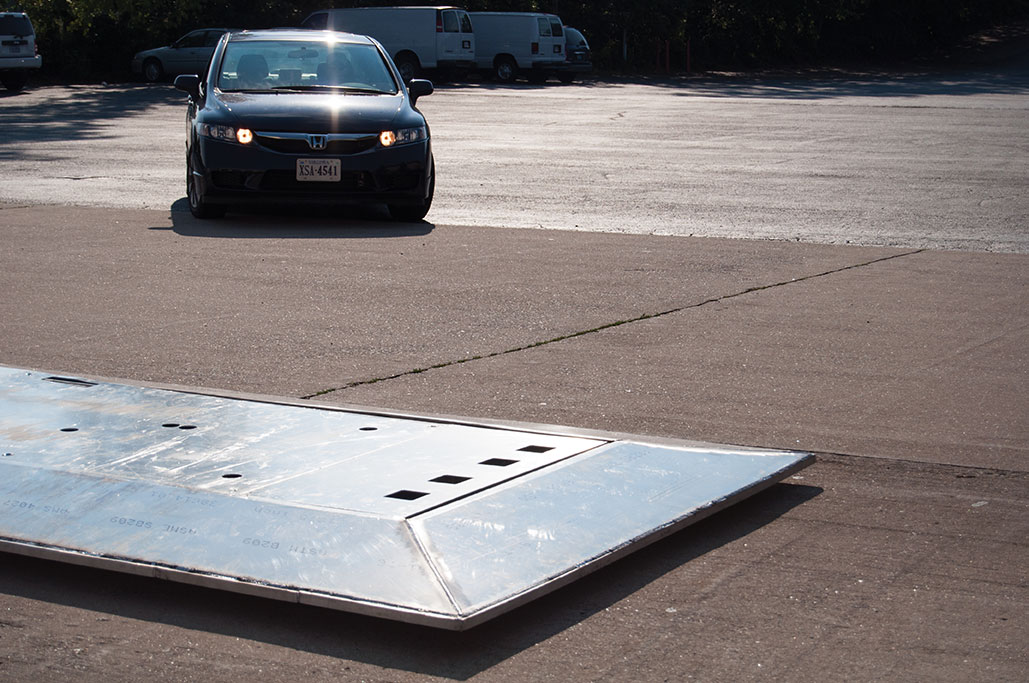
For the first phase of the IIHS project, the Perrone Robotics system includes a robot target vehicle with the footprint of a car, but measuring only 4 inches high, with a 1-inch ground clearance.
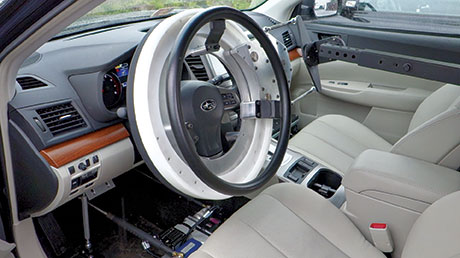
A robot target vehicle with the footprint of a car measure 4 inches high. Photos: Brian J. Geiger.
Test Scenario Example. One instance to be tested is National Highway Traffic Safety Administration criteria for crash-imminent braking (CIB). The CIB concept goes beyond the forward-collision warning systems already found in many new cars by actually engaging the brakes when a driver, at fairly slow speeds, gets too close to the car in front of him. In tests, the while the test vehicle travels at similar speeds on a programmed collision course with the robot.
The target robot vehicle carries one of a number of soft targets. If the vehicle under test fails to prevent a collision with the robot target, the test vehicle runs over the robot target vehicle, dislodging the soft target, but avoiding damage to the test vehicle, robot target vehicle, and the soft target. The next phase of the project adds smaller-footprint target robot platforms with soft targets, representative of pedestrians and cyclists.
To ensure that the test vehicle can perform repeatable tests, the system also includes a drop-in actuator kit that can be installed into any test vehicle in 30 minutes or less. The system is designed to allow a human driver to sit comfortably in the vehicle and optionally drive, but can also control the throttle, brake, and steering to drive test profiles. Repeatability is key for the operation of robots and vehicles, as well as track conditions, which will be helped by the covered track.
The VRC test track is installing Locata as its positioning system. In addition to alleviating concerns about GPS outages or dead/weak signal spots, this enables the PRI system to be operated reliably inside the new covered test track. While GPS is not an option for covered or indoor test sites and suffers from environmental issues, the high fidelity and localized positioning provided by Locata overcomes these barriers to test.
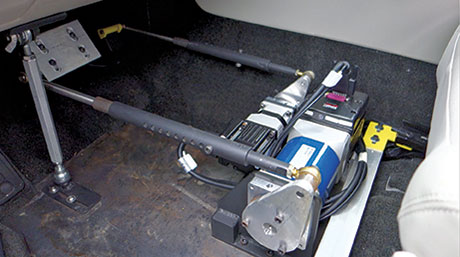
Drop-in actuator kit steering. Photos: Brian J. Geiger.Drop-in actuator kit throttle-brake. Photos: Brian J. Geiger.
PRI will deliver the target robot and drop-in actuators custom-built. The company looked at starting with existing platforms and building from them, but it would have been infeasible or overly expensive to meet the IIHS requirements for this system. Most existing systems were developed for vehicle dynamics testing or low-speed/simple collision testing. Most couldn’t handle some or all of the more challenging requirements such as the following:
Drop-in actuator kit:
Allow human driver to sit comfortably and drive the vehicle without interfering;
Drive autonomously while also allowing for hybrid modes whereby test drivers and onboard systems may assist or take over controls;
Offer out-of-the-box programmability and flexibility to handle a wide range of test scenarios and automated vehicle levels;
Install into any vehicle in 30 minutes or less;
Do not damage vehicle with installation; retain a significant percent of resale value.
Target robot vehicle:
Accelerate from 0 to 55 mph in 10 seconds;
Survive collisions at speeds up to 55 mph;
Allow collision-avoidance testing with minimal damage to test vehicles and target robot;
Scale for carrying a wide variety of soft-target payloads and enable a wide range of vehicles, from small car to SUV to tractor-trailer) to be tested.
Locata positioning system:
Work outside and also on covered track; cover track area with no dead/weak spots;
Deliver better than 10-centimeter accuracy for position measurements and relative position control of robots and vehicles;
Deliver position updates at 100 Hz in combination with attitude and heading reference system (AHRS) or inertial navigation system (INS).
The positioning requirement derives from the testers’ need not only for accurate location data of each vehicle, but for precise knowledge of how far apart they are while performing real-time control to orchestrate repeatable scenarios, intersecting vehicle and robot paths to determine whether the vehicle acts to prevent a collision.
A human operator is easily accomodated within the drop-in actuator kit. Photos: Brian J. Geiger.
Safety Systems
There is a driver in the test vehicle, and there are personnel present at the test site who could be injured by a test vehicle or target robot platform. In addition to wireless e-stop remotes, the test vehicle and target robot systems can be disabled and stopped by a number of events. In the target robot, an e-stop causes the battery pack to be completely disconnected from all vehicle systems, and a spring-load is released applying mechanical braking to stop the vehicle.
Under normal conditions, the spring is held back with a pneumatic system and air is dumped upon e-stop event. A target robot e-stop is triggered by
◾ remote e-stop controller
◾ a command issued by control software
◾ loss of communication with external systems
◾ failure of or loss of communication with internal systems
◾ loss of power.
Aside from fail-safe remote and onboard e-stop systems, additional safety measures are employed by means of safety controllers that monitor safety-critical regions of software, implement a wide range of robot-safety checking rules, and ensure that the robot is operating within safe parameters of the environment (such as by staying within an invisible fence and pre-defined operation boundary).
Common MAX-UGV Robot Logic
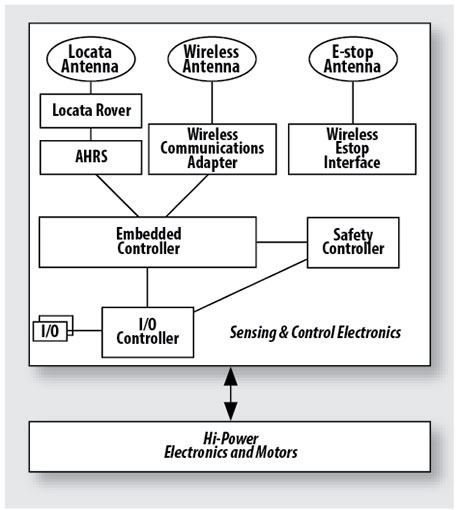
A common instrumentation and control system (CICS) for both the target robot platforms and test vehicle instrumentation and robotic assist platforms is illustrated in Figure 2.
FIGURE 2. Target robot logic flow.
Embedded Controller. The heart and soul of the vehicle hosts and runs the algorithms, receives sensor data, and executes actuation commands to the motor controllers based on desired route plans and dynamic sensor information. This controller runs the MAX software platform, MAX-UGV framework, and various MAX drivers.
I/O Controller. Handles inputs from sensors for temperatures, voltages, and currents as well as monitoring limit switches and actuating relays. Certain controls are planned such as mock brake lights on target robots and warning lights in test vehicles.
Locata. A constellation of nine LocataLite units on towers covers the existing track for Phase I of the project. Phase 2 will require additional units to add coverage to the covered track; some towers will provide coverage to both tracks. Each target robot vehicle and each drop-in kit for the test vehicles carries a Locata rover.
Locata’s new software essentially adds some capability from its indoor software to its outdoor software to deal with reflections/multipath issues caused by the metal buildings at the test site. The new software also allows the rover to perform real-time calculations on board, required for the less-than 10-cm accuracy. Previously this had to be done on a separate system and data had to be transferred back and forth, which worked against meeting real-time position update requirements for controlling speed, position, and relative position of robots and test vehicles. In test vehicles and target robots, the Locata rover position updates are merged with the output of an attitude, heading, and reference system (AHRS).
AHRS. The CICS in the robots and test vehicles includes an AHRS that provides the required heading, position, and velocity updates. Accuracy requirements are heading, 1 degree; position, less than 10 centimeters; velocity, 1 mph. Our required position update rate is 10 Hz. We expect to achieve 100 Hz in our system, which improves self-nav capability and overall performance. This rate also applies to other measured/logged data. A Kalman filter computes data from sources within the AHRS and from external sources: GPS and Locata.
Wireless Adapter, Antenna. On our critical channel, we exchange messages between vehicles to effect proper trajectory and relative positioning. Our e-stop controllers and safety systems also use this network. The non-critical channel is used for test setup and supervisory control, decimated data transmission for HMI monitoring, and logged data transmission.
Wireless E-stop Interface. This interface is for remote shutdown of a vehicle. The e-stop triggers are similar for the test vehicle systems, but the driver can also disable the robotic system. Rather than brake the test vehicle, an e-stop of the test vehicle systems disables the steering, brake, and throttle actuators into limp-mode and releases control of the test vehicle to the driver.
Safety Controller. A separate watchdog controller monitors live conditions and the embedded controller and onboard systems, and serves as a direct line for remote wireless e-stop.
Electronics, Motors. These includes six high-performance 4-inch motors, motor controllers, cut-off contactors, and overall cut-off system for e-stop.
Conclusion
The IIHS expansion project is a first of its kind for automated vehicle testing, breaking new ground for target positioning and control, and providing the first indoor test track for this purpose. Data from these tests will be used to improve safety of on road semi- and fully-automated vehicles and help save many thousands of lives, setting a high bar for capability and performance of all automated vehicle functions. Requirements for safety, repeatability, and seamless handoff between driver and autonomous control of the test vehicles, as well as the speeds at which the robots must travel and survive collisions, pose significant challenges. We believe our systems meet them fully.
Predicting where a dangerous wildfire is going to start can be very difficult, but geographic information systems (GIS) can quickly analyze geographic data about fire-contributing conditions to aid in effective wildfire planning and prevention.
“GIS is an ideal technology to predict the characteristics of a wildfire because it excels at analyzing multiple data layers,” said Gabe Schmidbauer, GIS professor at American Sentinel University. “The complex nature of wildfire dynamics requires the analysis of multiple disparate datasets such as housing, vegetation and weather for wildfire planning and prevention and can help predict when the current conditions are right for a wildfire.”
That’s been the situation recently in Colorado as more than a dozen large fires burn in four national forests and eight other areas.
GIS Impacts Communities
Recently, a major online GIS mapping system was created to show the precise extent of the burning by GIS software vendor Esri to help residents, firefighters, emergency response workers, officials and others interested in the situation on the ground. It demonstrates how GIS experts can have a major impact on their communities.
“As GIS analysts model their prediction of wildfire behavior, they simulate changes in fire direction, intensity and geographical extent of a burned area over time to help predict where a potential fire will occur, as well as where a current fire will spread. This gives officials a leg up in fire prevention prediction analysis,” said Schmidbauer.
Esri’s map system scrolls in or out to cover the area the user wants to see. Pull back and you notice that not only are there the well-publicized problems in Colorado, but large fires in California, New Mexico, Arizona, Utah and Idaho.
Social network hotspots are also included on the map. Click and you can see relevant data pulled in, including a list of items needed in a particular area.
There are also other helpful annotations. For example, the map shows current wind patterns, color-coded to show strength. Wind is an important factor in how fires develop. The information can help predict how they might spread, which will affect firefighting efforts and the decisions made by officials and residents of the potentially affected areas.
Schmidbauer says this analysis is important to help let people answer important questions, such as: Should you head for safer ground? Is it too soon to pull out and possibly leave property, pets and belongings without supervision?
Users can choose to see which layers of information appear on the map, including U.S. Geological Survey wildfire activity, topographic maps and National Oceanographic and Atmospheric Administration red flag warnings.
There is also a choice of base maps, over which other data is displayed. They include street, topographic, and terrain maps. In addition, users can separately display sources of images from Flickr or YouTube videos as well as messages from Twitter to develop the real time development of the wildfire.
“All this information can be invaluable when you’re trying to save someone else’s life or your own,” said Schmidbauer. “And it is all made possible through the power of knowing how to apply GIS to problems in society, non-profits, or business.”
Sponsored by: Hemisphere Broadcast Date: Thursday, June 20, 2013 Moderator:Eric Gakstatter, Survey Scene Newsletter Editor Speakers: Kevin Kelly, Geodesist, ESRI, Inc.; Craig Greenwald, Technical Director, GeoMobile Innovations; Michael L. Dennis, RLS, PE, Geodesist, NOAA
A look at the challenge of dealing with horizontal datums in your GIS. We are moving into a new era in dealing with datum transformations. Geodata 2.0 is coming, and it can create big headaches when attempting to combine disparate geospatial databases. Sensors such as GPS receivers, remote sensing imagery, and 3D scanning provide much more accurate data, setting up a collision with outdated and mismatched legacy horizontal datums.


