Topographic surface with well sample data and water level. (Image: Golden Software)
Golden Software, a developer of scientific graphics software, has enhanced the visualization capabilities in version 16 of its Surfer gridding, contouring and 3D surface mapping package. Geologists, environmental consultants and geospatial professionals can use Surfer 16 to interpret complex scientific data.
“We have improved every aspect of core functionality in Surfer 16 so it’s faster and easier to make meaningful custom maps,” said Golden Software CEO Blakelee Mills. “Surfer users will find the new version generates more accurate representations of physical, chemical and structural properties, allowing them to make better decisions.”
Surfer is a robust 3D data visualization and mapping software that enables users to model their data sets, apply an array of advanced analytics tools, and graphically communicate the results. Known for its fast and powerful contouring algorithms, Surfer is used extensively by geologists in mining and oil & gas activities and by hydrologists in environmental monitoring projects.
The primary improvements in Surfer 16 have been made in the color mapping and Contour Map capabilities:
Equal Area Stretch. Similar to Histogram Equalization, this new feature lets the user stretch colors across the distribution of data, creating a proportionate representation of the data variation and enhancing the visualization’s contrast. This means that tightly distributed data can be displayed as quickly varying colors in the generated colormap, making it easier to spot anomalies in data values. Colors can be stretched automatically or manually across the histogram of data values.
Equal Area Contouring. Another new feature added to surface mapping functionality, Equal Area Contouring allows the user to calculate the geographic distribution of contours so they align more precisely with the geophysical data they represent. This results in a more accurate visualization of geophysical data sets, which are seldom linearly distributed.
“The combination of Equal Area Stretch and Contouring creates striking visual maps that vividly highlight data distribution,” said Mills. “This makes it easier to interpret and understand geophysical and geochemical concentrations in the subsurface.”
Surfer 16 includes three other enhancements:
True 3D Point Data. Surfer has always accurately displayed lidar point cloud data, and this 3D visualization capability has been expanded. Now any 3D vector data can be represented in three dimensions in 3D View. Clients who use Surfer to visualize subsurface wells can use this to display the well path. It can also be applied to quickly check the quality of 3D grids.
Enhanced Attribute Management. Surfer now has commands to calculate geometry — such as area or perimeter length — and add those values to object attributes. These calculations can be performed either to create new attributes or modify existing ones with updated information. One of the key advantages of this enhancement is that area data can be normalized and attributed to objects for generation of more accurate choropleth maps.
Kriging with External Drift. Surfer is known for its powerful kriging functions, and this capability is even better in v16 with the addition of Kriging with External Drift. This allows users to add a secondary data set for use as a proxy in interpolating the primary data set with the goal of yielding better estimated values. Surfer users asked for this new function because it typically lets them obtain and use less expensive data sets to supplement a more expensive one.
“Surfer has a reputation for high-quality graphic outputs, powerful gridding algorithms, and ease of use – and we have improved each of these capabilities in Surfer 16,” Mills said.
LandViewer, a cloud service developed by EOS Data Analytics, provides access to satellite data and fast-paced analytics. In recent months, it has undergone numerous updates, which have expanded the existing catalogue of satellite imagery, introduced more tools for analysis and added other new features.
By the end of 2018, free space and airborne data available for browsing, analysis and download via LandViewer included imagery from the European Space Agency’s (ESA’s) Sentinel-2 and Sentinel-1, NASA-USGS’s Landsat 8 and previous missions, MODIS, CBERS-4 and NAIP.
This broad selection of Earth observation data has grown even larger with the addition of high-resolution commercial imagery from Airbus, SpaceWill and SI Imaging Services.
LandViewer has evolved into a single platform. On top of open-source data, users can freely explore the potential of commercial data with global coverage, short revisit periods, and spatial resolution up to 40 centimeters.
The current catalogue includes imagery from Pléiades 1a/1b, SPOT 5, SPOT 6 and SPOT 7, along with KOMPSAT-2, 3, 3A and SuperView. The high-resolution imagery browser offers free preview, automatic price calculation by selected area, and fast image delivery within three business days via cloud EOS Storage.
Preview of KOMPSAT-3A image collected over Shanghai Hongqiao International Airport on Oct. 29, 2018. (Photo: EOS)
Long-term observations. An abundance of available data, such as weekly updated Sentinel-2 imagery and historical Landsat data, has made it much easier to monitor changes over long time spans. Rather than taking a long time to select and process years of satellite data to get a multitemporal perspective, the LandViewer’s new Time Series Analysis will crunch the remote sensing data and deliver the results in an easily interpretable graph.
Sentinel-2 time series graph generated for agricultural fields in Kansas state. (Screenshot: EOS)
Users can select an area of interest (AOI), and a satellite dataset and a time period between 1 month and 10 years. The algorithm can then pick all imagery with minimum cloudiness and calculate NDVI, NDWI or NDSI in just a few moments. By default, the generated Time Series graph contains lines (representing the min, max, mean and std values) that can be hidden or displayed for convenience; whenever an unusual spike or drop in values is noticed, a satellite scene that represents that part of the curve can be visualized to establish the cause. The results can be downloaded either as an image (.png), or a .csv file for working in Excel.
Enhanced vegetation analysis. Users searching for an in-depth look at vegetation cover can use LandViewer’s new spectral indexes: SAVI, EVI, ARVI, GCI, SIPI and NBR. These indexes complement generalized NDVI analysis by making corrections for atmospheric and topographic effects or soil brightness influences, depending on vegetation density, climate and elevation in the area of interest.
The NBR index is designed to highlight burned areas against healthy vegetation; the difference between pre-fire NBR and post-fire NBR values can be applied to estimate the severity of burn.
The use of several indexes simultaneously enables better insight into plant health and helps to identify stressed or infected vegetation at an early stage.
Sentinel-2-derived SAVI analysis of an arid agricultural region in Saudi Arabia. (Screenshot: EOS)
User-friendly legend and area calculation. Another new LandViewer feature, the index legend, is designed to solve the problem of interpreting the index results, a common issue for new users. Now when a spectral index is applied over the selected territory, the user can view a detailed legend, where each color-marked class contains a short description.
For example, calculation of NDVI will identify and highlight areas with “dense”, “moderate”, “sparse vegetation”, “open soil” or “no vegetation”.
Screenshot: EOS
Another new time-saving functionality is that the area of each class within the spectral index legend is calculated automatically, in both square meters and by percentage.
Also, the expanded Area of Interest (AOI) tool enables bulk uploading of AOIs and speeds up work by allowing simultaneous visualization and fast switching of all AOIs on a map for imagery searches or new scene subscription.
Advanced zone analytics. By introducing the clustering function, EOS’ remote sensing experts and software developers have taken LandViewer’s spatio-temporal analytics to the next level. With this function, users can run unsupervised satellite data-based classification of an area up to 200 square kilometers into as many as 19 clusters (or zones). This process involves setting custom parameters (size/number of zones) and waiting a few moments for LandViewer to build a raster image of the area with color-marked zones, and a vector layer outlining the boundaries. Both outputs can be downloaded.
This scalable analysis can provide various insights across agriculture, forestry, coastal monitoring and other industries. For example, a farmer can make use of convenient color mapping of zones within the field based on NDVI values for precise in-field navigation and crop management.
Engaging animations. With the informative spectral data contained in satellite image pixels, LandViewer has introduced a time-lapse animation feature allowing journalists and active social media users to create engaging animated stories and share them on the internet. Each GIF can contain up to 300 scenes, with indexes or band combinations applied. From calving of glaciers to construction of new stadiums, satellite imagery is full of information that’s worth watching and sharing with the world.
Hexagon AB has signed an agreement to acquire Thermopylae Sciences and Technology, a software provider primarily focused on the U.S. government and defense market that specializes in geospatial applications, mobile frameworks and cloud computing for enhanced location intelligence.
Thermopylae has developed advanced visualization solutions to support tactical edge mapping in support of mission critical operations. Built upon the Google technology stack, its defense and intelligence solutions are targeted at addressing the challenges involved in working with critical problem sets in secure or classified government environments.
In addition, its portfolio is applicable to a host of markets in the private sector, including real estate, finance, insurance, retail and media, with customers ranging from startups to Fortune 50 companies.
“Thermopylae’s software and domain expertise nicely augment our ability to deliver the visual location intelligence necessary for enabling autonomous connected ecosystems,” said Hexagon President and CEO Ola Rollén. “Ultimately, the addition of Thermopylae will enrich the 5D experience delivered through our Hexagon Smart M.App and Luciad portfolios — both of which enable smart digital realities with 3D, 4D (real-time sensor feed integration) and 5D (dynamic analytics) capabilities. Not only does the acquisition provide an avenue for international market adoption of Thermopylae’s technologies but also an additional avenue for Hexagon to accelerate adoption of our 5D visualization capabilities in U.S. government agencies.”
Headquartered in Arlington, Virginia, Thermopylae will operate as a part of Hexagon’s Geospatial division, which is reported under the Geospatial Enterprise Solutions segment. Sales in 2017 amounted to $20 million.
Completion of the transaction (closing) is subject to customary regulatory approvals, including a voluntary filing to the Committee on Foreign Investment in the United States (CFIUS).
Orolia’s LEOSAR-GEOSAR-MEOSAR (LGM) Mission Control Center (MCC) solutions are now commissioned as Nodal MCCs in Spain and Australia, enabling global distribution of critical search-and-rescue information through the Cospas-Sarsat system.
With the successful commissioning of their Nodal MCCs, Spain and Australia will now be able to share critical information with the U.S. and France, providing worldwide coverage for global search and rescue.
In addition, since they will be authorized to commission other MCCs in their regions, they will also significantly advance the Cospas-Sarsat MEOSAR program.
Orolia’s McMurdo PRISMA MCC features satellite search-and-rescue technology with full LGM capability. It is the commercial solution of choice for search-and-rescue authorities in Norway, the UK and many other countries.
“We’re proud to support the world’s most critical search and rescue operations,” said Steve Ludwig, Orolia’s director of SARSAT Operations. “With Orolia onboard, you can rely on proven solutions in critical environments where failure is not an option. Our PRISMA Mission Control Center systems are the only successfully deployed, Cospas-Sarsat commissioned commercial solutions available, meeting the highest standard for search-and-rescue support.”
The Orolia PRISMA Mission Control Center. (Photo: Orolia)
Orolia has been developing global search-and-rescue programs for nearly 30 years, reaching a major milestone with the Medium-altitude Earth Orbit Search and Rescue (MEOSAR) system in 2011, and completing all global MEOSAR system installations since.
To date, 75 percent of the Earth’s surface is monitored by Orolia’s MEOSAR systems.
Through its McMurdo brand, Orolia has equipped these systems with the latest search-and-rescue technology to increase response times and save more lives worldwide.
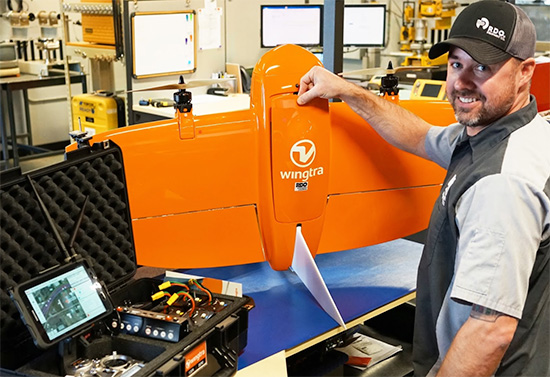
Swiss-based Wingtra, creator of professional vertical takeoff and landing (VTOL) surveying drones, and RDO Integrated Controls, a division of RDO Equipment Co., have rolled out the first Wingtra Certified Repair Center.
The agreement between the two companies further enhances RDO Integrated Controls’ customer support to a growing Wingtra customer base.
Specifically, the training and certification process delivered by Wingtra will greatly reduce downtime when repairs or maintenance is required across RDO Integrated Controls’ territory, which includes the U.S. upper Midwest, Pacific Northwest and Southwest.
Along with advanced technical training, the agreement includes strategic warehousing of Wingtra systems and components across RDO Integrated Controls’ regions.
“This is a monumental step in our joint efforts to not only deliver the best professional VTOL surveying drone available, but to also provide our customers with unbeatable long-term support,” said Scott McTavish, North American sales manager at Wingtra. “Our advanced aerial surveying platform is enhancing the industrial workspace in so many ways. We are fortunate to have a partner in RDO who shares our values of caring for our end users. Rapid response and local support is key to user satisfaction.”
“The addition of the Certified Repair and Service Center is the next logical step in our winning relationship with Wingtra,” Brad Reich, service operations manager for RDO Integrated Controls, said. “RDO and Wingtra can now provide UAV customers with the best service and support in the North American market.”
The new service and repair capacity at RDO means rapid response and local long-term support for WingtraOne customers. (Photo: Wingtra)
Wingtra develops, produces and commercializes high-precision VTOL drones that collect survey-grade aerial data. Wingtra entered the market in early 2017 and has been selling globally ever since.
Founded in 1968, RDO Equipment Co. sells and supports agriculture, construction, environmental, irrigation, positioning and surveying equipment and is a total solution provider.
Image: iStock.com/metamorworks via Bentley Systems
Nestwave has developed an ultra-low power, advanced GNSS solution for use in internet of things (IoT) applications.
Nestwave, a Paris-based startup, is demonstrating its new low-power, high-accuracy GPS IP at Mobile World Congress, being held Feb. 25-28 in Barcelona, Spain.
The software-based GNSS solution allows modem customers to add accurate position-based services to their modem platforms.
When integrated with an IoT modem such as NB-IoT, Cat M1, LoRa or Sigfox, the solution offers low-cost geolocation for emerging applications such as asset tracking, smart factories and smart cities, without the need for an external GNSS chip.
“After several years of development and based on a number of key signal processing breakthroughs, we believe Nestwave is well-positioned to provide a best-in-class solution for low-power IoT applications where position awareness is key,” said Rabih Chrabieh, Nestwave CEO. “We are excited to demonstrate our GPS solution, in collaboration with Cadence by leveraging their Tensilica Fusion F1 DSP platform at MWC this year.”
“The Fusion F1 DSP is gaining traction with customers as a platform for low-cost, power-sensitive IoT communications standards like NB-IoT,” said Gerard Andrews, director of marketing for Tensilica products at Cadence.
The Cadence Tensilica Fusion F1 DSP is designed for low-cost IoT applications requiring a single processor core that is proficient at both DSP and control-code workloads.
Developed on a highly configurable architecture, the Fusion F1 DSP is specifically designed to excel at “always-on” processing, including wake-on-voice and sensor fusion applications.
Additionally, the Fusion F1 DSP instruction-set architecture is very efficient at running narrowband wireless communications standards like BLE, Thread, Zigbee, 802.11ah, NB-IoT and GNSS.
Visit the Nestwave/Cadence demo at the Cadence booth at Fira Gran Via, hall 6, stand 6L34.
OriginGPS, maker of small-format GNSS modules and cellular internet of things (IoT) systems, presented new products with customized IoT and GPS demonstrations at Embedded World 2019, Nuremberg, Germany, Feb. 26-28, Hall 3, Booth 3-121.
OriginIoT systems enable developers to rapidly develop IoT products with stackable add-ons, while all data is configured from the cloud, and no additional embedded code or RF knowledge is required.
OriginGPS’ latest release is the multi-constellation ORG1518-MK06 module. It combines low power modes for extended battery life, 8MB built-in Flash memory, AGPS support for extended ephemeris improving position calculation, and UART+I2C or UART+SPI interfaces.
Selectable add-on sensor boards click on the OriginIoT cellular IoT system, offering backward compatibility with 2G, 3G, CAT1 and CAT M. (Image: OriginGPS)
An ultra-sensitive integrated patch antenna easily switches over to an external antenna via an integrated RF switch.
The ORG1518-MK06 is suitable for solutions requiring multiple antenna options, such as automotive aftermarket and agriculture applications.
Addressing the global IoT market with fast data transmission, the OriginIoT NB-IoT/CAT M with 2G fallback will be suited to devices that are battery-powered and transmit data only occasionally, such as parking and agriculture applications, resulting in a very long sensor battery life, typically 10+ years. The new model will be released later this year.
“The new products are based on OriginGPS patented technologies and retain the miniature footprint for which the company has become synonymous,” said Robert van Tilburg, vice president, Global Sales and Business Development, OriginGPS. “We are excited to offer our customers additional features and options to choose from, enabling them to reduce overall solution costs. 2019 is going to be an exciting year with technology advancements facilitating our product offering with more personalized IoT and GNSS products.”
OriginGPS partner Gemalto will also be presenting OriginIoT demos at Hall 3, Booth 3-438. Gemalto’s Cinterion LTE-M module is integrated in the OriginIoT systems to provide 2G, 3G, Cat1, Cat-M and NB-IoT cellular communication.
Airbus Defence and Space has launched The OneAtlas Platform, a collaborative environment to access premium imagery, perform large-scale image processing, extract insights and benefit from Airbus assets for solution development.
OneAtlas is offering a 30-day free trial, giving customers streaming access to imagery, sample change detection reports, and global imagery and data layers, including the basemap and the WorldDEM.
Besides access to a comprehensive archive with premium imagery, users can try services such as:
Ocean Finder for the maritime industry
Verde for precision agriculture
Starling for forest management
Earth Monitor for tracking changes over an area of interest
The developer portal provides more information through API documentation and discusses how to benefit from the imagery either in streaming or download format.
The Ocean Finder provides a satellite-based maritime ship detection service. (Photo: OneAtlas)
The NavIC Indian constellation is now supported in NovAtel’s latest firmware release for its OEM7 series of GNSS receivers.
The 7.05.04 firmware release for OEM7 provides the following benefits:
Users can achieve a single point position accuracy of 2.5 m (rms) using NavIC L5 signals (from the Indian Regional Navigation Satellite System) with GPS L1 on the newly available JSN model.
Access to the L5 frequencies on the OEM7600 and OEM7720 provides triple-frequency capabilities to unlock the potential of GPS L5, Galileo E5a and AltBOC, Beidou B2a and NavIC L5.
A full listing of all changes in this release are included in the “What’s New” document included in the firmware download package. Visit this page to download the latest firmware for a specific platform. Visit NovAtel’s documentation portal for the OEM7 reference manual.
Why abandon well-worn mapping methods in current use?
It has to be for one or more forms of gain: time, money or staffpower. UAV-borne lidar can save a lot of field time, eliminate the need for site revisits, capture more data than previously possible, and provide a better product using more automated extraction tools.
Surveyors and other mappers must frequently develop a reliable surface model of an area about to undergo major construction. If it is new construction over native soil, then the area is often covered with vegetation ranging from short grass to very tall trees. By far the majority of these areas are surveyed using GPS, total stations, levels or some combination thereof, depending on the project. In any case, at least one trained individual, more often two or even three individuals, must walk the area collecting the necessary data with some form of survey equipment.
This is the tried-and-true methodology. It is easy to schedule, easy to estimate, and barring any field or office mistakes, absolutely reliable. Manually visiting a point in the field on return visits should yield similar, though not exact, results, at least within the tolerances of the equipment. It doesn’t matter if the temperatures are near freezing or over 100 degrees. It doesn’t matter if it is raining or sunny. It doesn’t matter if the grass is cut or if the leaves are on and in full glory. This is a very reliable method in all respects, assuming the proper tools and techniques are used.
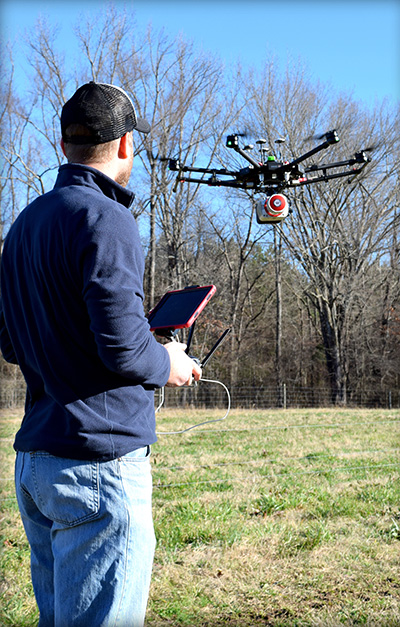
Piloting a lidar-equipped drone. (Photo: Bailie McRae)
How can this type of field survey be improved upon? First, is the product sufficient? Does the field crew reliably capture all the pertinent features? Did they get the location of the trees, buildings, poles and so on?
How many site visits are usually required to complete the average project?
What about the elevation data? Did they capture the drainage and breaklines sufficiently?
As always, the driving question is: Why change? Why abandon well-worn methods in current use?
It has to be for one or more forms of gain: time, money or manpower — which often equates to one or both of the first two terms.
When surveying with conventional equipment such as total stations, levels, and even GPS equipment, the likelihood of failure of a tried and true system is not very great. Comparatively, when using a UAV lidar system, not only are the stakes higher (as the equipment costs more), but the likelihood of an all-out failure is more likely and is definitely more devastating. There is no quick fix if your UAV crashes. It is more likely that the UAV will crash (usually due to operator error) than the lidar system itself will fail.
Facing these concerns, does one embrace a UAV lidar solution or hold to the tried and true?
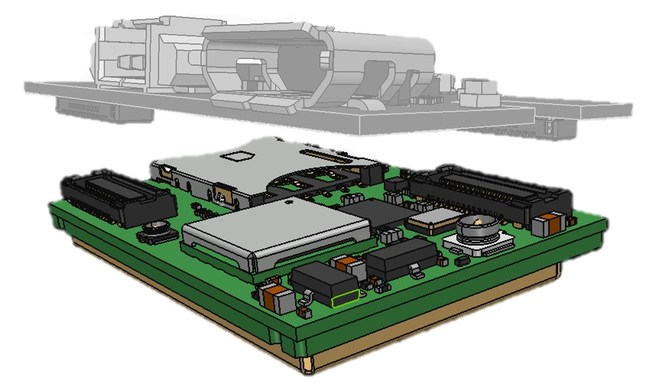
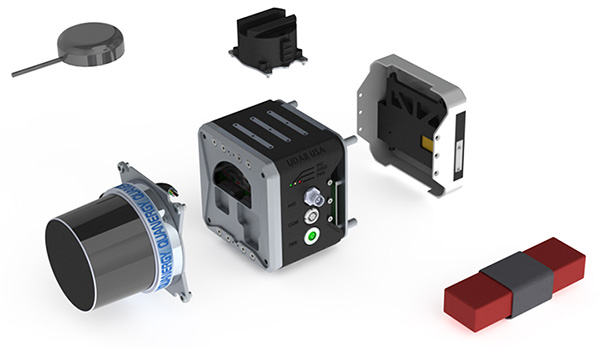
EQUIPMENT: Left to right, from top down: GPS antenna, laser head (Quanergy M8), detachable mount (car & UAV), computer and INS (GNSS receiver + IMU), interface plate, battery. (Photo: Lidar USA)
If it is important to get a heavily wooded 40- to 100-acre job collected and delivered as a surface at 1-foot contour accuracy (or maybe even 0.5 foot) in a single day, then UAV lidar is the tool for the job. UAV lidar can save a lot of field time, eliminate the need for site revisits, capture more data than previously possible, and allow for a better product using more automated extraction tools.
Accuracy. Often the client wants a 3D point cloud, or digital elevation model (DEM), which is not necessarily derived from lidar. If the site has no vegetation present, then an image-based solution should be sufficient.
However, most sites are initially covered with vegetation. In that case, an image solution from some sort of aerial camera will only provide a surface on the top of the vegetation — not what the client wants. While lidar may not be perfect, it can get to within 0.1 to 0.2 feet of the ground surface, in spite of grass or trees. For most initial design surveys, this is all that is required.
Money. Cost is perhaps the topic of greatest persuasion against lidar and in favor of an image-only solution. A lidar system is more expensive than most camera systems, but again the camera system simply cannot collect viable ground data in vegetated areas.
Time. Another factor is the time required to become profitable with the system, and the longevity of the system. In a good economy, it doesn’t take many 40-acre topo jobs to completely pay for a UAV lidar system. Once more, it is about time.
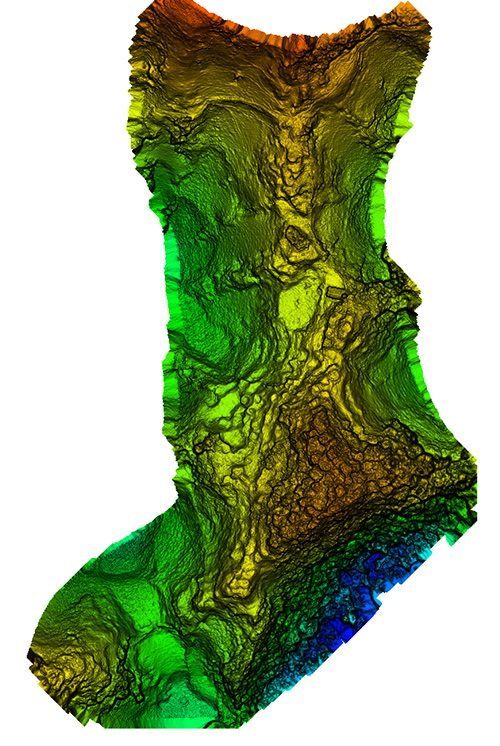
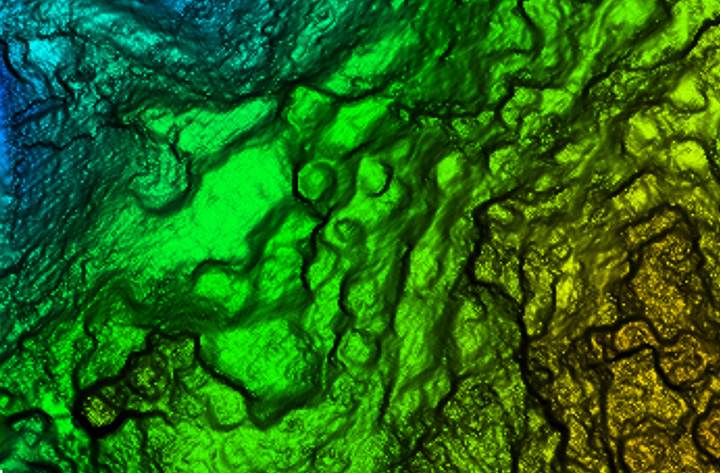
Broad overflight area of the cloud forest. (Image: Lidar USA)
As to product longevity, any new UAV product released today should be just as functional in five years. You may have to upgrade your UAV, but the lidar system will still be good for the jobs we’re discussing.
Lidar collects XYZ and intensity. It does not collect RGB values. This is a strike against lidar. While lidar data can be colorized with imagery captured from a camera on the same system as the lidar, or separately, this is generally discounted as being imprecise (not well aligned). Lidar does not inherently or directly capture color. However, imagery is 2D in nature and does not capture XYZ data.
Imagery can align with the lidar nearly perfectly; it is a matter of a good boresight.
UAV photogrammetry, or image-only solutions are amazing. They provide a wealth of information. They are complementary to and synergistic with UAV lidar.
The advantages of including a UAV lidar solution along with a UAV photogrammetry solution include:
the ability to measure at any time, day or night, in bright light or no light;
rapid surface generation (not instant, but fast);
flat surfaces, vertical walls, overhead structures — everything is collected without difficulty;
power lines, guy wires and so on are all collected directly,
bare-earth collection (multi-echoes and direct collection to ground, not just top of vegetation) is possible;
generally a much wider collection width and fewer flight lines.
Further, lidar can often penetrate dust, fog and mists.
Sensors and Their Issues
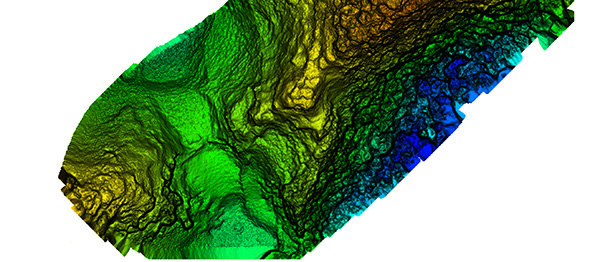
Bare earth classified surface of small site. (Image: Lidar USA)
Lidar does require an inertial navigation system (INS) and all of the controlling software. This generally makes the system more expensive. It also makes it able to more rapidly generate the final product.
Inertial Use with Lidar. An INS combines a GNSS receiver with an inertial measurement unit (IMU) and a lot of software and specialized filtering algorithms. It is essentially the central nervous system of a lidar system. The GNSS receiver provides universal timing such that every instrument including the IMU, scanner, cameras and others are all precisely time-stamped. This is key to proper data fusion. The GNSS receiver also provides positioning. The IMU is essential for determining proper orientation (roll, pitch, heading) as well as positioning at an extremely high data rate (2000 Hz) between the recorded GNSS epochs. If a GNSS event is missed (which shouldn’t happen on a UAV) the IMU bridges the gap between epochs. Large gaps can lead to positional drift, but shouldn’t happen on a UAV.
The real-time software maintains satellite lock (coupling with the IMU as necessary), while the post-processing software, using a post-process kinematic (PPK) process, provides the best possible solution of the trajectory. It solves the trajectory forward, backward and over and over with different parameters until it reaches an optimum solution. So it’s not just the hardware that makes the system more expensive, it’s also the software.
Closer site inspection — notice non-natural occurring mounds. (Image: Lidar USA)
Double Duty? There is some confusion as to the INS on a UAV. Can the INS used to navigate the drone be used for the lidar system as well, to save money? Yes, and no. Yes it can, with the proper integration — however, the INS to navigate the drone is usually far, far inferior to that required by a lidar system. So, No. Also, the lidar system really should be portable from the UAV to a car to maximize use. So the systems need to remain separate, for the most part.
Height and Width. Another UAV sensor issue concerning lidar is often very confusing. Some sensors are only good for 40- to 60-meter flying heights; some are useful to 200 or more meters. Depending upon where you work, this may be of no concern. In the U.S., we are limited to 120 meters above ground level (AGL) in any case. In most areas, being able to fly at 80 to 100 meters AGL is sufficient as long as accuracy and point density are not compromised.
Scan width varies a lot as well. The scan width of the shorter range systems is typically no more than 150 meters of usable area, whereas others can scan 500 meters wide. Consider that most surveys are 40 acres, maybe up to 100 acres, and we find that one flight is all that is necessary even with the least-expensive system. Do you need 500 meters wide? The answer depends upon your business model. If you are doing miles and miles of transmission corridor work, you probably need the greater width.
Ground Accuracy. What matters here is not so much positioning accuracy but point-cloud thickness. This can be difficult to understand and is a worthy subject by itself. The question is whether you can deliver the product you most often are required to deliver with the system. If you deliver 1-foot contour projects, can you achieve this with a 6-centimeter system or do you have to have a much more costly 1-centimeter system? Clearly the 1-centimeter system is much better, but what do you need to deliver?
Intensity is another concern. Most of the less expensive systems don’t do a very good job delivering a “b+w image-like” point cloud; that is, their intensity falls off dramatically with distance. Others do an amazing job. Is this important? Can it be overcome with colorization? If you were doing your work conventionally, would you be delivering an image-like surface? I doubt it. Certainly the intensity is nice to have and the information can be very useful in automated processing, but is it worth the price difference?
Ultimate Test: the Jungle
Recently we undertook an adventure with some explorers in South America, near the city of Jaen, Peru. A crew filming a new TV show for the Travel Channel sought to understand more about the ancient civilization of Chachapoyas, Warriors of the Clouds. Little is known about this race of people because they were conquered by the Incas in the 16th century and shortly thereafter by the Spanish conquistadores.
Our team was to help identify structures in an area called Leymebamba, about four hours’ drive from Jaen, hidden beneath the deep Amazon cloud forests — definitely not a typical North American forest. These forests are not only very dense with vegetation but with cloud cover that is generally at the level of the canopy.
Many centuries after the Chachapoyas have vanished, structural remains are concealed not only by the clouds and the canopy, but buried beneath several feet of dirt and a lot of living and long-since-dead organic matter. Only the most pronounced features can be found by the naked eye or a traditional survey.
Lidar brings a huge advantage in that it can get a much better approximation of the ground as well as any other hard surface such as walls, fences, trails, buildings and towers. By blanketing an area with dozens if not hundreds of points per square meter, post-processing software can “peel” the living vegetation away from the ground surface. This ground-classified data can then be analyzed by a trained scientist to determine if there are in fact any revelations to be had.
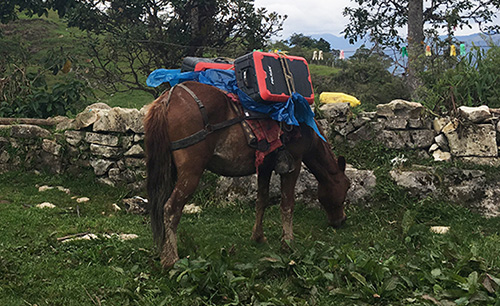
In our case, we were using an A-series high-definition lidar system, best flown at 40 to 60 meters and, in extremely dense vegetation, at 5 to 6 meters/second. Collecting 700,000 points per second enables us to potentially capture more than 400 points per square meter in a single pass. The area we were to scan varied considerably in terrain and had very little to offer that was flat and open. In fact, to get to the site, we had to pack several mountain horses with the UAV, several sets of batteries, and the scanner as they traveled down very steep terrain about 900 feet to the base of the hill to be scanned.
We’ve said we can scan from nearly anything moving, but we’ve never done it from a horse. Well, we weren’t actually scanning, but it was pretty close.
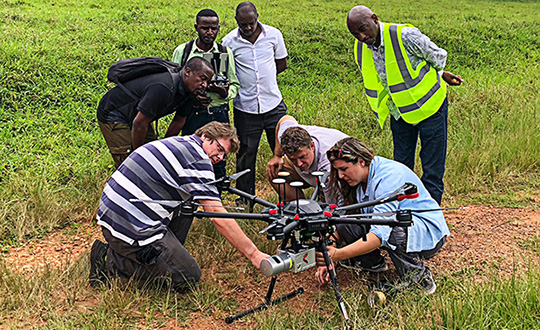
UAV and lidar, bound for the cloud forest. (Photo: Forrest Briggs)
Finding a suitable take-off and landing area posed a challenge. Due to vegetation and terrain, only small areas could be scanned in a single flight, as the vehicle would quickly leave line-of-sight (LOS). While LOS may not be an issue legally in this area, it remains a real concern: we always want our equipment to come home at the end of the mission.
We learned something we hadn’t anticipated along this journey regarding weather. The day would start out around 80° F; around 2 p.m. it would rain, and the rest of the day would close out much cooler. Does this matter? Yes, if you are now wet and cold with several hours ahead of you. It seems there is always some new surprise.
As the area was remote, with no internet access, the existing map data for mission planning had to be downloaded prior to visiting the site. Each lidar mission was preceded by a scout flight using a small UAV to help ensure safety and appropriate flying height per flight line.
Situating the Base. Projects like this always pose dilemmas. Finding a good place for a GPS base station in a cloud forest is no small task. Normally we would put the base station on a known reference point so we can easily join the data with other projects. In this case we didn’t have any such concern. We simply needed an area with a clear view of the sky; usually this means no obstructions 12 degrees above the horizon. However, in a forest and in the mountains, you take what you can get. In our case, we found a rock outcropping and placed the unit on it with no tripod. It didn’t give us the best solution, but it worked.
Ideally we leave the base running for hours to get a good solution. Since we had multiple sites to scan, this wasn’t a problem. All sites were within walking distance of the base, so there was no concern about being too far away and adding more problems to the project. In PPK mode we can easily be 10 or 20 kilometers from the base with no concern.
Other Forest Challenges. In-field processing, far from internet or electrical supply, requires very judicious battery and especially laptop usage. The lack of many things we take for granted can quickly be a show-stopper if necessary (maybe even a phone call).
Even back at the hotel where power was available — don’t count on it. While the film crew and archeologists are eager to see results, everybody has to wait. No power.
Supposedly this is common and only lasts an hour. Three hours pass and everybody goes to bed but the lidar crew.
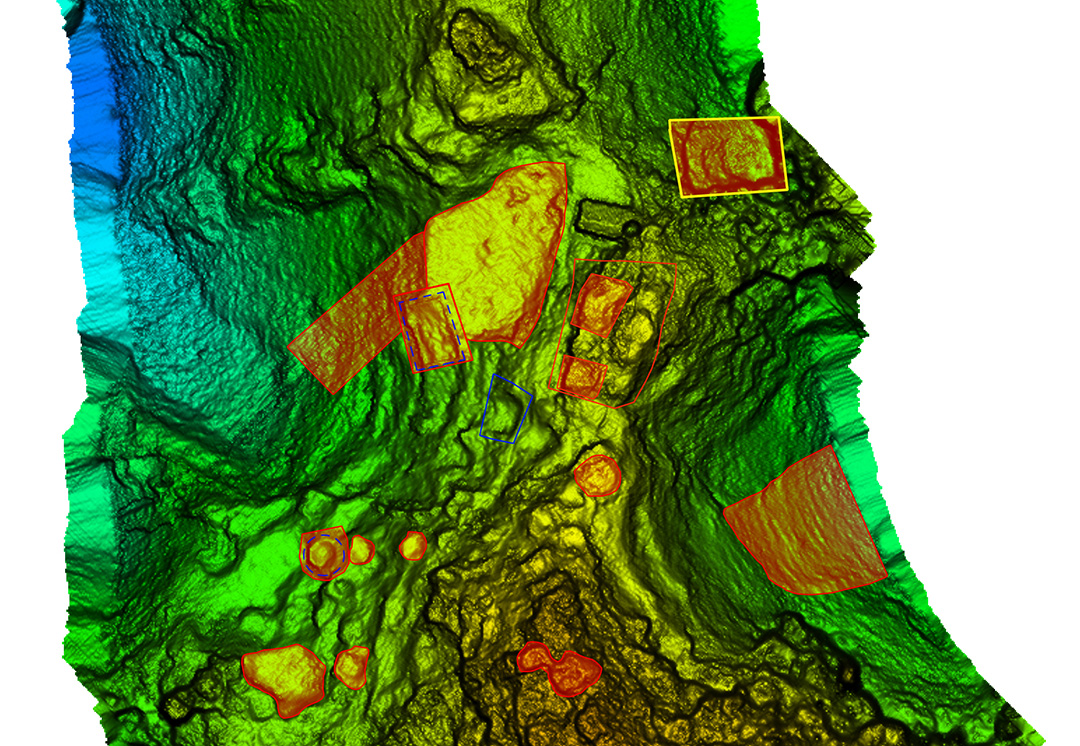
Areas of interest to archeologist — lots of them. (Image: Lidar USA)
Finding the ground should be easy, but a new version of software has been installed. There’s a kink in our plans. Finally after some internet help (a call back home), the right settings are found and the software begins peeling away the vegetation to reveal the ground. The top of each hill (several were scanned) looked like a primitive fortress with 20 to 30 cylindrical structures clearly spread over the top of each site. On one site we identified a tower at least 3 meters in height.
While areas like this could be scanned with a conventional aerial system, collecting much larger areas, the UAV lidar solution offers several distinct advantages. One of these is just a quick recon of the area. Physically being on the ground at the site makes the team much more aware of what is going on. Secondly is the far, far greater density of points and the ability to collect much more off-nadir, allowing for more of the vertical structure to be captured.
In the end, our mission was successful. The UAVs were ported by horseback up and down precarious trails. The lidar worked great. None of the batteries failed. The drones didn’t crash. The archeologists were thrilled with the results, having found several new structures and a tower unknown to them. Once again, UAV lidar proved to be the best tool for the job. Indiana Jones out!
Manufacturers
As both INS sensors and lidar scanners continue to change, this allows us to make quite a variety of configurable systems. For this particular project, we used our Snoopy INS (OEM) with a Quanergy M8 Ultra scanner. The Snoopy INS uses a NovAtel OEM719 GNSS receiver to ensure best performance with GNSS collection. Other options for the INS include the NovAtel STIM300 (Sensonor IMU), VectorNav VN-300 and Trimble Applanix AP family. For scanners we support all Velodyne scanners including the latest AlphaPuck, Quanergy, Riegl and several more. Of course, for cameras there are the ever-popular FLIR, Sentera, PhaseOne and DJI. GPS base stations are not all equal, but most will work as long as they log at least L1/L2 GPS at 1Hz.
JEFF FAGERMAN is a a professional surveyor and certified photogrammetrist. He has a master’s degree in photogrammetry from Purdue University and worked as a photogrammetric software developer at Intergraph before starting Fagerman Technologies. Now known as Lidar USA, the company focuses on mobile lidar aboard UAVs.
Upgrade to MAGNET Collage Web includes with new deliverable options.
Topcon Positioning Group has upgraded its MAGNET Collage Web, a web-based service enabling the sharing and collaboration of UAV and scanning data sets.
MAGNET Collage Web version 1.3 allow operators to work with more types of data with greater flexibility, including the ability to import BIM models, as well as CAD and GIS data.
MAGNET Collage Web and MAGNET Collage desktop software meet the demands of a diverse user-group. The latest update is designed to address an increasing need from the vertical building construction market segment to work in a single-software environment with BIM, scanning and UAV datasets.
“Now operators can view and publish BIM models, along with other data types, directly through the web browser to be sharable with more versatility,” said Alok Srivastava, director of product management. “MAGNET Collage Web can be used to overlay as-built laser scans and design data to visualize proposed changes and detect construction issues. The software supports OBJ, FBX and 3DS formats.”
The upgrade to MAGNET Collage Web also includes new direct publishing functionality for CAD and GIS data files through the browser.
“Operators can now overlay 3D point clouds and reality models with CAD and GIS design data, including support for DXF, SHP, KML, GML and GeoJSON formats,” said Srivastava.
The upgrade to MAGNET Collage Web also introduces advanced sharing controls including the ability to fully customize layer visibility, appearance, window layout, feature selection and camera position.
“The updated customization controls allow operators to share and present their projects exactly the way they mean to with a multitude of viewing options, allowing specific features to be highlighted as necessary,” said Srivastava.
Additionally, MAGNET Collage Web can now be accessed through the Topcon “Blue Bar” that allows direct access to the service from any Topcon website. The universal account and application management toolbar is embedded at the top of Topcon web pages.
Airbus Defence and Space and Hisdesat Servicios Estratégicos S.A. have generated the first joint TerraSAR-X/PAZ radar interferogram. This milestone demonstrates the missions’ capacity for cross-sensor interferometry, whose processing is among the most challenging.
Interferograms are typically used to derive the topographic elevation and deformation of the Earth’s surface, and are created using at least two different images acquired at different date. This flattened cross-sensor-interferogram has been created from a mixed image pair with four days’ temporal separation acquired by TerraSAR-X and PAZ (StripMap scenes from Nov. 22-26, 2018). The area covers the oil and gas production site Burgan (Kuwait) and parts of the Persian Gulf. The oil field is the world largest sandstone oil field with the total surface area of about 1,000 km².
As PAZ is positioned in the same orbit as TerraSAR-X and TanDEM-X and features exactly identical ground swaths and acquisition modes, they all three form a high-resolution SAR satellite constellation, jointly exploited by Hisdesat and Airbus. With the launch of PAZ, the observation repeat cycle has been divided by half, which improves the monitoring of fast ground deformation phenomena that can endanger lives and infrastructures.
“This is a major step towards achieving the implementation of our TerraSAR-X/PAZ radar constellation,” said Hanjo Kahabka, head of production and radar constellation manager at Airbus. “The level of accuracy obtained with this interferogram is a guarantee for our customers to continue to rely on the high quality standard we have set with TerraSAR-X and TanDEM-X, but with an improved monitoring capacity,”
“In Hisdesat we are very proud of reaching this milestone. Interferometry is one of the most technically demanding applications, and thanks to this successful joint exercise with Airbus we have not only demonstrated the top performance of our PAZ satellite but its full compatibility with TerraSAR-X and TanDEM-X,” said Miguel García Primo, CEO at Hisdesat. “Now operation in constellation can become a reality and we will be able to provide to our customers full set of images and services with the constellation.”