Report from the Association of Unmanned Vehicle Systems International (AUVSI) Orlando, Florida, May 12-15, 2014
Just before the start of the huge AUVSI show, the FAA once again cautioned Unmanned Aerial Systems proponents that still more care is needed with UAS airspace access. The majority of UAS operators and manufacturers are making efforts to become compliant with reasonable FAA rules. Also, AUVSI had some good information on the economic benefits of UAS commercial applications to the U.S.
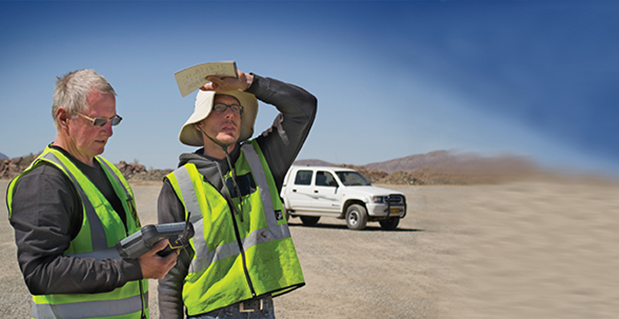
The annual AUVSI conference came down to the Sunshine State this year, and the sun did shine, with temperatures in the high 80s most days. The Orlando Convention Center is a huge place and AUVSI took up the majority of the South Exhibit hall along with a bunch of rooms where most of the technical presentations were run. With close to 600 exhibitors and more than 6500 attendees, this is still one of the bigger trade shows.
FAA Rules
However, just before the start of this huge show, the Federal Aviation Administration (FAA) once again cautioned Unmanned Aerial Systems (UAS) proponents that still more care is needed with UAS airspace access. It’s probably more than a coincidence that FAA released news of a March 22 close call at 2,300 feet between a US Airways airliner on approach to Tallahassee, Florida, and a model F4 Phantom Jet — UAS owner and operator unknown. And CNN also picked it up and animated it pretty quickly. As the industry as a whole strains to seek more airspace access, it’s difficult to understand how incidents like this happen. And, in the process, they push back all the good efforts that are being made by the large majority of UAS operators and manufacturers to demonstrate their ability and desire to become compliant with reasonable FAA rules.
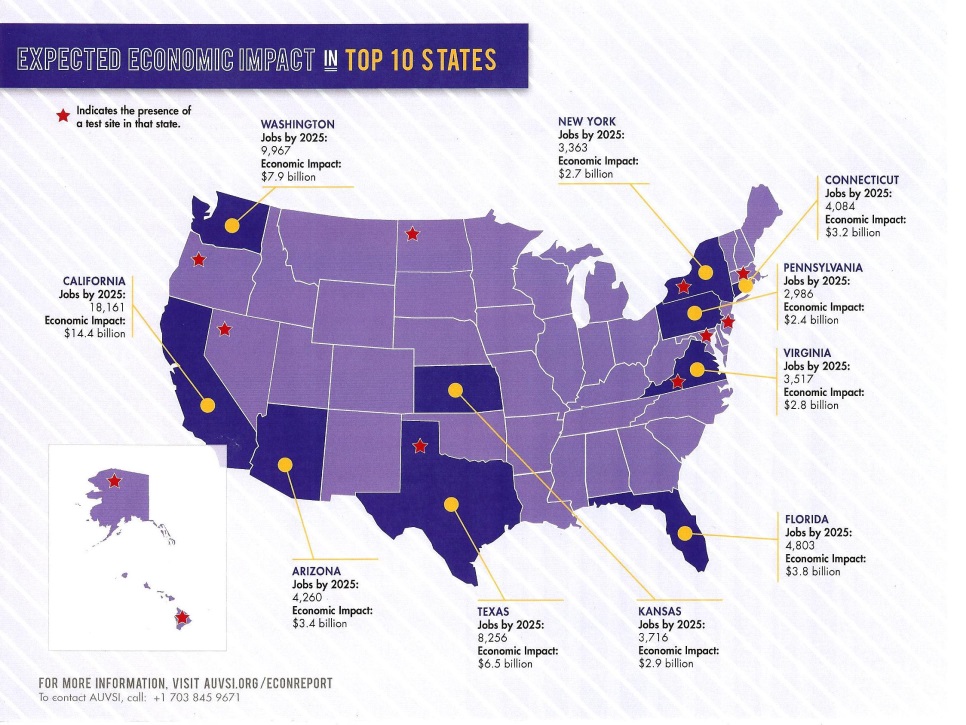
Nevertheless, AUVSI had some good promotional material available at the conference showing the economic benefit to the U.S. for UAS commercial applications — a $82 billion market and around 104,000 jobs over the next ten year, $50 billion in the top ten states alone.
Wildfire mapping, agriculture monitoring, disaster management, power-line surveys, telecomms, weather monitoring, aerial imaging/mapping, TV news and sports coverage, movie making, environmental monitoring and oil and gas exploration — these are just some of the commercial areas where AUVSI anticipates that UAS will generate significant revenue.
Presentations and Sessions
The conference presentations began on Monday afternoon, and one paper that caught my eye was by Sierra Nevada (SNC) on its Fusion Filter, which is designed to take multiple sensor inputs and develop navigation and guidance for en-route, terminal approach and landing. This particle filter maintains thousands of weighted position estimates and refines them to provide a composite position and guidance output. Sensor inputs that SNC has used include 3D radar, lidar, FLIR IR camera, daytime camera, GPS/INS, and digital terrain elevation data (DTED). For landing applications, ~50 algorithms run to determine runway location with or without GPS/INS inputs. SNC has flown development flight tests on both fixed wing and rotor craft.
Tuesday began with a General Session headlined by Rep. John Mica (R-Fla.), House of Representatives; Lt. Gen. Kevin Mangum, deputy commanding general/chief of staff, U.S. Army Training and Doctrine Command; and Rep. Frank Lobiondo (R-N.J.), House of Representatives. In introducing these speakers, Ralf Alderson of AUVSI talked about the change from an industry basically serving the U.S. Department of Defense to a coming UAS commercial marketplace: “Time to start learning about the rest of the world,” he commented.
- John Mica chaired the House Transportation Committee until 2012, and was one of the movers behind the government’s legislation that gave the FAA its 2015 deadline to integrate UAS into the National Airspace System (NAS). Mica’s disappointing advice was for us to now think in terms of 10-15 years before there would be complete UAS integration in the NAS, largely due delays in the name of safety by the FAA.
- Lt. Gen. Kevin Mangum (Army three-star) began by telling us that the Army’s first UAV may have been the SD1 Drone used in Germany in 1960/61. He indicated that everything the Army does with UAS is basically focused on providing the soldier in the field with the tools he needs to be successful. He indicated how UAS are available at the various command levels, and gave us insight into progress with manned and unmanned teaming.
- Frank Lobiondo is chairman of the House Aviation Subcommittee, which oversees the majority of programs of the FAA. He acknowledged that “The rest of the country is not tuned in” to the benefits of UAS, and “sensationalized media coverage only highlights (UAS) in a very negative way.” Nevertheless, Congress is desperate to see the potential economic impact of UAS unleashed, and will urge FAA to speed up the process.
Later on at the conference, almost as if in response to Lobiondo’s comments, FAA Manager of UAS Integration Jim Williams made a welcome announcement. Four companies have approached FAA for expedited UAS approvals, and the FAA is now working with them to expedite limited commercial operations before UAS rules are finalized. Limited commercial operations for filmmaking, power-line inspection, precision agriculture and flare-stack inspection are therefore expected to be soon authorized by FAA.
The next General Session featured presentations by Alaska Lt. Gov. Louis Mean Treadwell and futurist Mike Walsh. While Walsh’s presentation was entertaining and thought-provoking. Challenging almost all status quos for how to conduct business, Treadwell had more to say that was directly relevant for today’s UAS industry. “Do consumers get it, do they want it, do they fear it?” These were the messages Treadwell gave to his AUVSI audience. As a past technology and business start-up innovator, he had a lot to say about the suitability of Alaska for UAS testing and innovation. With 47,000 people working in aerospace in Alaska, and the recently FAA-awarded Alaska-Hawaii based Pan-Pacific Test Range; Treadwell encouraged the UAS industry to come and try Alaska.
Exhibit Floor Highlights UAS Opportunities
Meanwhile, the GNSS and navigation systems suppliers to the UAS industry were going about the business of the trade show — exhibiting and demonstrating their capabilities. Wandering purposefully around the huge show floor, I set about uncovering what was new and how people felt about UAS opportunities:
Septentrio:
Septentrio introduced a new RTK engine this year, which is better in occluded situations — such as under tree canopies or around downtown buildings. It has better scintillation detection and provides clearer warning indicators to users. The bottom line is that its RTK is more robust and works better.
Septentrio has also had some significant success with major dredging operators around the world. It has reduced convergence times for PPP, say when starting with an initial RTK position, and position accuracy degrades gracefully over 15-30 minutes.
Accord:
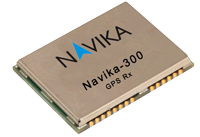
Accord is quite excited by the prospect of a new FAA TSO C-199, which when approved will establish equipment requirements for gliders, balloons and aircraft such as micro-lights, all without electrical systems. The TSO creates a new class of equipment, which is now referred to as Light Aircraft Surveillance Equipment (LASE). The aircraft targeted for equipage are currently exempt from the rule that mandates other aircraft should carry ADS-B — which broadcasts position and velocity, allowing others in the airspace to track and avoid your aircraft. So to improve safety, a simpler, less expensive ADS-B device is being called for that uses an off-the-shelf (non-certified) GNSS receiver as the position source. The point is if this GNSS is good enough for this special class of aircraft, why wouldn’t it be good enough for UAVs, which are so similar to these targeted aircraft?
Accord has a Micro-i GPS SBAS receiver for this application using a chip-level receiver called the Navika-300, which comes from its Indian technology partners. Accord claims that the Navika is comparable to other chip-level receivers in the market from CSR (Sirf) and u-blox.
Topcon:
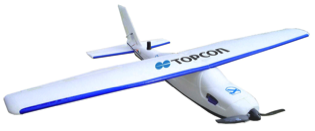
Topcon has partnered with MAVinci from Germany to market the Sirius Basic and Pro aerial positioning system in Europe, and presumably this system will find its way into everywhere that Topcon does business.
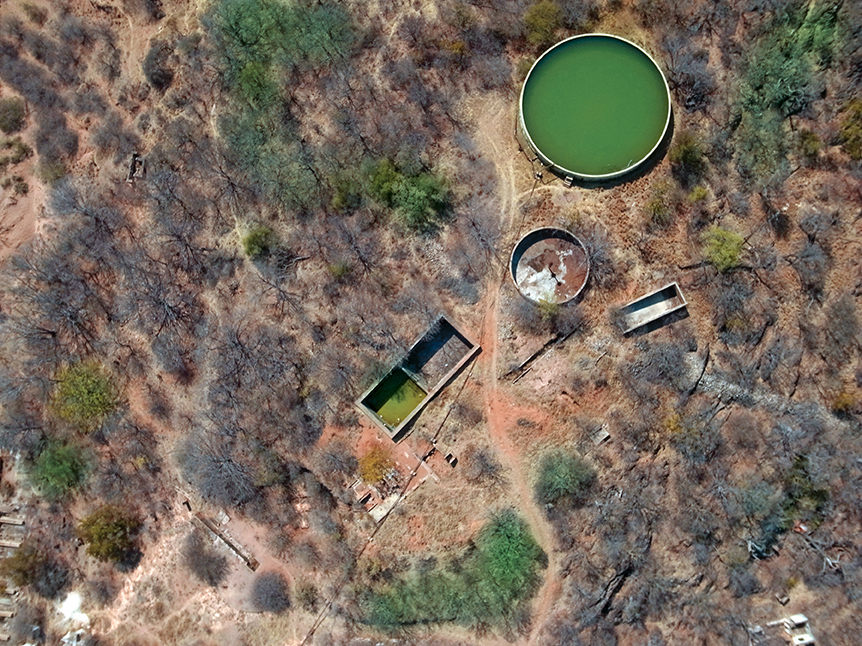
Achieving 5-cm GNSS-RTK accuracy without traditional Ground Control Points (GCP) increases productivity. Removing the need for placement of GCPs can potentially reduce time for a survey project by up to 50 percent. This precise positioning technology allows image locations developed by Sirius Pro to be used as the equivalent of GCPs.
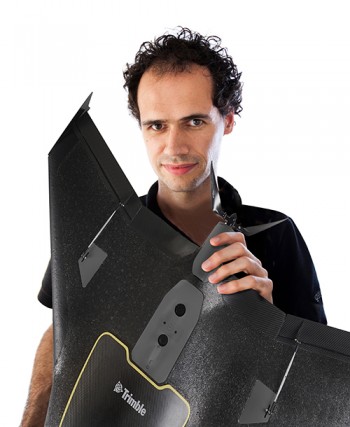
Trimble:
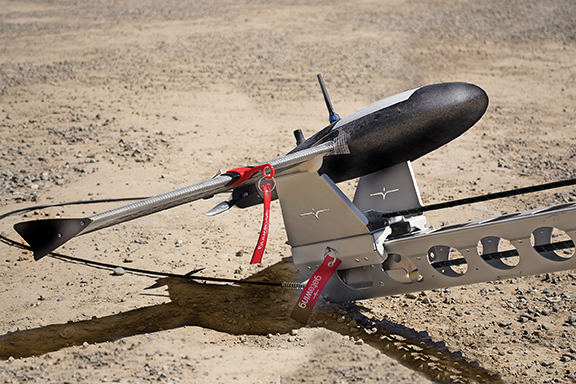
The Trimble UX-5 Aerial Imaging Rover was probably first on the market as a GNSS/UAS system for precision surveying. Following the acquisition of Gatewing, Trimble has been working hard to bring a fully capable UAS surveying solution to market.
The Trimble UX5 aerial image data is processed into deliverables by the new Trimble Business Center (TBC) photogrammetry module. Specialized computer-vision algorithms produce accurate results automatically, with minimal manual interaction. The UX-5 provides a stable and reliable photogrammetric system delivering excellent results without requiring specialized photogrammetry knowledge or experience.
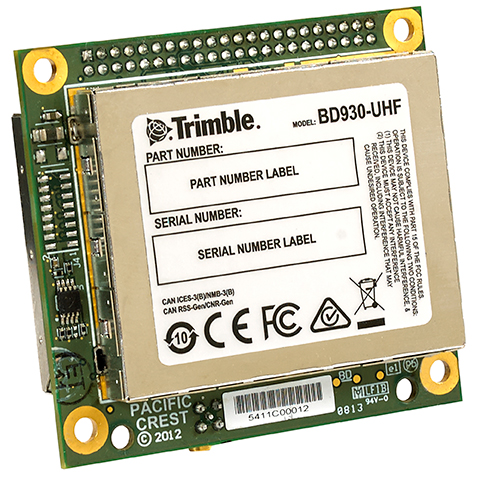
Trimble also unveiled a new high-performance integrated UHF receiver at the chipset level ( 60 x 55 x 15 millimeters), designed for OEM integrations, UAS among them. The BD930-UHF supports both triple frequency from the GPS and GLONASS constellations plus dual frequency from BeiDou and Galileo, making it ready to take advantage of additional signals as GNSS grows and grows. The BD930-UHF delivers quick RTK initializations for 1–2 centimeter positioning. It also has an advanced kalman filter PVT engine positioning in urban canyons and the like, for applications not requiring centimeter-level accuracy. The receiver also supports fault detection and exclusion (FDE) and receiver autonomous integrity monitoring (RAIM) for safety-critical applications — sure to become increasingly important in the FAA-ruled airspace and coming regulations.
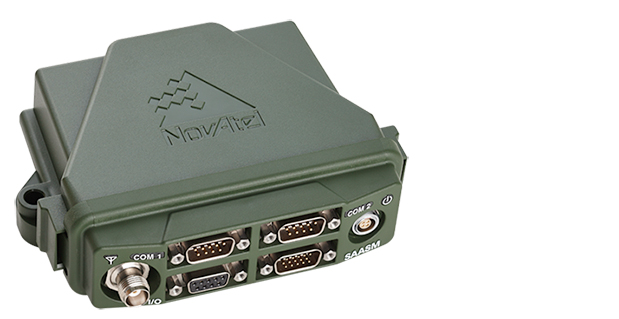
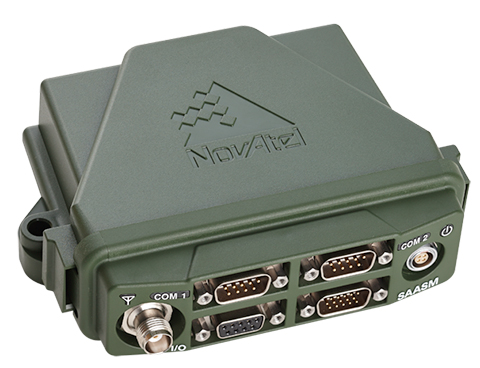
NovAtel:
NovAtel announced the release of the new OEM617D receiver at AUVSI’s Unmanned Systems 2014. The OEM617D is a compact, dual-antenna, dual-frequency, single-card receiver offering NovAtel’s ALIGN heading functionality and RT-2 Real Time Kinematic (RTK) GNSS positioning technology, in both dynamic and static environments. The OEM617D provides dual-frequency operation with GPS, GLONASS and BeiDou signals and also tracks Galileo, SBAS and QZSS, maximizing GNSS availability globally. Fixed and rotary-wing aircraft/UAS, marine, and autonomous ground vehicles will benefit by integrating the OEM617D as well as other applications requiring precise position and heading accuracy.
Gladiator:
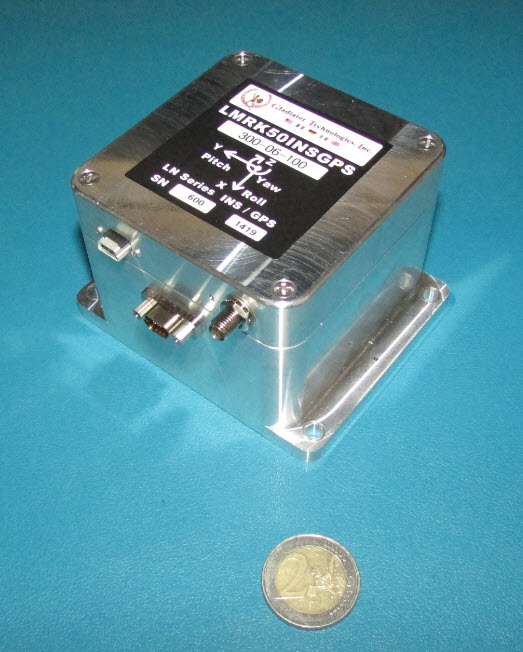
The Landmark 50 is a high-performance GPS/inertial product which comes in at the top of the Gladiator MEMS inertial product line. The LandMark 50 INS/GPS represents inertial performance on par with small ring laser and fiber-optic gyros. This performance leap with low-cost MEMS technology offers substantial improvement in performance utilizing the newest high-performance MEMS gyros and accelerometers combined with a 72-channel, 10-Hz update rate u-blox GPS, GLONASS, BeiDou, QZSS and SBAS receiver.
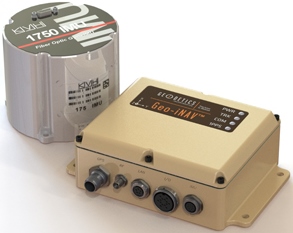
Geodetics:
Geodetics showed off a couple of new GPS/inertial products. The Geo-ReiNAV comes in both a commercial and a mil-spec (SAASM) version. As the team was at lengths to explain, Geodetics is GPS “agnostic” — which in today’s terminology means Geodetics uses a variety of OEM receivers in their products — the smarts are in the filter and processing. The other key component is a Seiko/EPSON G352/362 MEMS Quartz IMU, which apparently has less noise and lower drift (or more accurately “in-run bias stability”) than other silicon MEMS inertials.
Incidentally, we sat and discussed this material at the Geodetics booth, which seemed more spacious than in previous years — it was larger, as it spilled over into the next vacant booth which Hemisphere was supposed to have occupied — but having apparently reserved and paid, didn’t show up for the exhibition.
Sparton:
Sparton released news of the GAINS-10 Multi-GNSS assisted inertial navigation system at AUVSI this year. The unit excels in challenging environments. It provides accurate inertial navigation in the presence of mechanical shock, transient platform vibrations and extreme magnetic interference. The 10DOF IMU features high speed, synchronous sampling of all inertial systems combined with high rate coning and sculling compensation and is fully calibrated over temperature.
Vectornav:
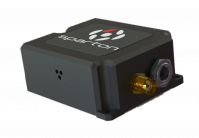
The VN-300 is a miniature dual antenna GPS-aided INS system. The dual GPS adds heading determination, and the inertial aiding helps through potential GPS outages. A pressure sensor is also included for altitude determination. The VN-300 can be used in a wide variety of industrial and military applications and is well suited for size, weight, power and cost-constrained applications such as unmanned vehicle systems; antenna, camera and platform stabilization; heavy machinery monitoring; robotics; and primary or secondary flight navigation.
Oxford Scientific (OxTS):
Last year at AUVSI, Oxford introduced a miniature datalogging GPS/MEMS INS — this year it returned with the xNAV500, which is now real time. With dual GPS and antenna inputs, this unit also provides heading determination in a small form factor that is apparently very affordable.
MicroPilot:
One of the leading providers of autopilot systems for a large number of the UAS at the show, MicroPilot has not stood still during the last 12 months. The latest product addition is the MP2128³× triplex redundant autopilot using three high-performance 2128ɡ autopilot boards on one pcb. The advantage is that this autopilot is fault resistant, providing two additional back-up channels to resist critical function failure. A board-level option is available for integrators who want to combine functions in fewer on-board boxes.
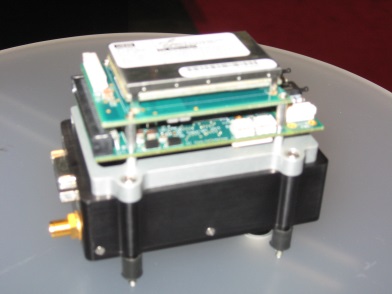
UTC/Cloud Cap:
Cloud Cap is also one of the principle autopilot suppliers to the UAS industry. Cloud Cap appears to pack additional functions into its range of autopilots — including a core autopilot, flight sensors, navigation, wireless communications and interfaces providing data to the payload system. The Piccolo Nano is its smallest device, and has been mounted in a board stack on top of a Cloud Cap enclosure containing a NovAtel OEM615 used as the Nano GPS navigation source.
Overall on par with last year’s AUVSI conference in Washington, D.C., the Orlando venue probably encouraged more industry participation, but there seemed to be a lot fewer military people around. This probably accounts for what looks like reduced attendance over last year.
The GNSS/navigation exhibitors, however, were just as innovative as last year, and were present in good numbers. There was generally good traffic at most of these booths, so there are probably new customers coming directly from the show. What was the most notable new thing at the conference? For me, it was discovering the potential for a reduced scope of equipment certification — provided UAS could find a way to be included within the same class of aviation as balloons, micro-lights and gliders. This would really help bring more UAS with high-performance navigation into usable airspace — even unleashing the commercial potential that Congress and the industry need so badly.
Tony Murfin
GNSS Aerospace