Tag: Nepal

  • Peak XV: The framework that measured Mount Everest

    Peak XV: The framework that measured Mount Everest

    A ceiling fan slowly churned, stirring the hot, humid air. Outside, warm rains pelted the muddy streets as distant langurs whooped in the thick jungle mists below.

    An incessant fly caught the attention of the office’s lone occupant, hunched over a table covered with a large grid-lined sheet of paper. Pencils, erasers, French curves and straightedges lay scattered next to a stack of calculation sheets, but the man holding a pencil in one hand gripped a rolled newspaper in the other, intent on his battle with the fly.

    Suddenly, the door burst open.

    “Mr. Waugh!” the intruder exclaimed, panting as he rushed in.

    “Radhanath,” Waugh replied in surprise, looking up from his maps. “I thought you were in Calcutta, 1,600 km away.”

    “Yes, Mr. Waugh, I was, but this is too important to deliver by post.”

    “Really, Radhanath. You intrigue me,” replied Waugh. “Come out with it. Your excitement is adding to this already unbearable heat.”

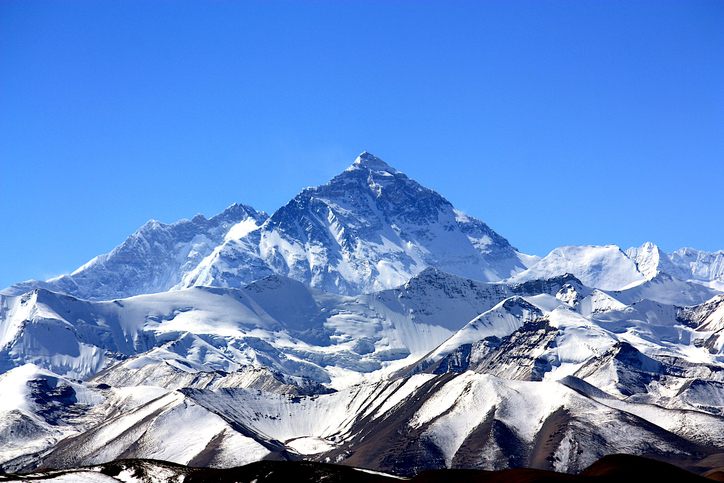
    “Sir,” Radhanath tried to say calmly. “I have discovered the highest mountain in the world!”

    That conversation happened in 1852. It was the crown jewel of an effort that began 50 years earlier. Britain was on the ascent. Surveying was the mathematics of empire. India, Britain’s largest protectorate, had never been systematically mapped. The British East India Company needed to know what minerals, crops and commodities could be turned into profitable enterprises, where they were, and how to move them to ports. This depended on accurately mapping India. Infantry officer William Lambton proposed an audacious solution: measure the entire subcontinent with triangles.

    William Lambton
    William Lambton

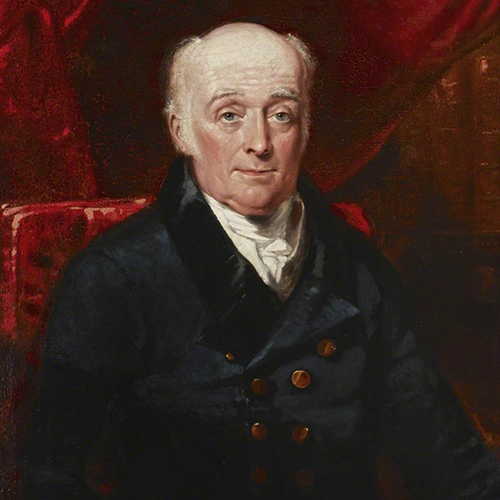
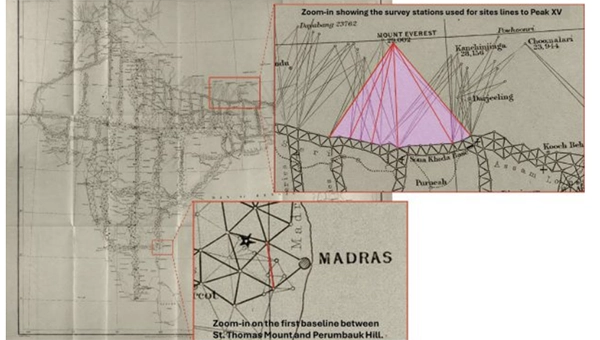
    Lambton was granted the commission, and on April 10, 1802, the Great Trigonometrical Survey (GTS) of India began with a humble but critical baseline from St. Thomas Mount near Madras, 12 km south to Perumbauk Hill. Everything depended on the accuracy of this first baseline: even the smallest error would multiply as triangles spread across the subcontinent. Perfection was essential. The distance was measured with a 100-ft steel chain protected from the sun beneath A-frame tents to prevent thermal expansion. It moved slowly, 100 ft at a time from start to finish. Every link mattered. The baseline took 57 days.

    To guarantee perfect alignment, Lambton relied on a massive custom-built theodolite. It weighed 1,102 lbs, requiring 12 men to carry. Surveyors planted stakes, stretched strings, and used the theodolite to correct for every change in elevation, turning a simple chain measurement into the geodetic foundation of the entire survey.

    Time marched on faster than the survey. The East India Company estimated five years, but by 1818, the survey reached west to Mangalore and north to Hinganghat. It was too slow. Lambton’s vision of “an uninterrupted series of triangles…from sea to sea…to an unlimited extent in every other direction,” a complete geometric quilt covering India, proved implausible. Malaria took its toll. Lambton’s health declined and in 1823 he died at Hinganghat. George Everest inherited the survey.

    The map of triangles covered Madras to Mangalore.
    The map of triangles covered Madras to Mangalore.
    George Everest
    George Everest

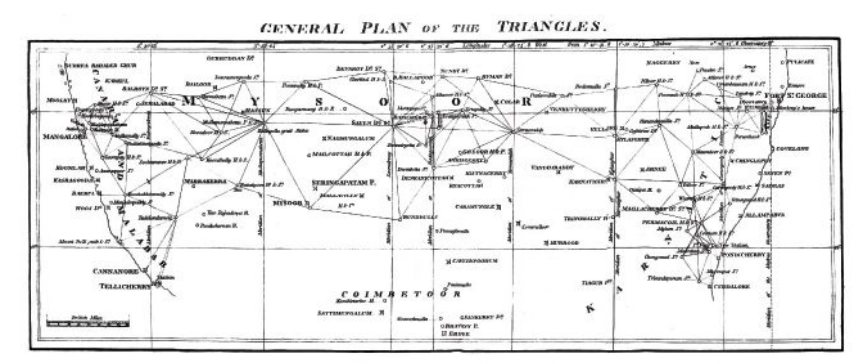
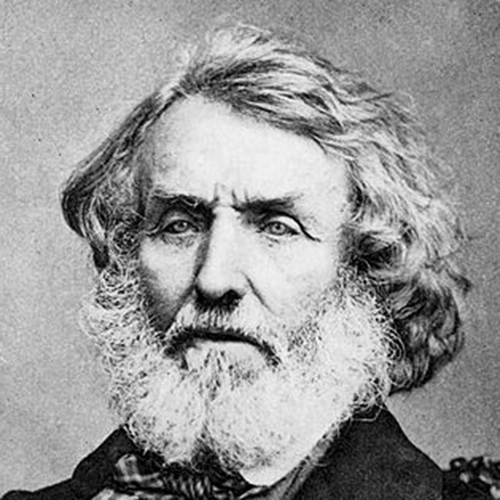
    Everest recognized Lambton’s dream of total coverage would take centuries. Instead, he conceived a “gridiron” of chains running north–south and east–west, intersecting at right angles, scaffolding to which localized surveys could be tied. The shift is evident on the GTS map: dense triangulation in south-central India reflects Lambton’s ambition, while the more open, structural network elsewhere reveals Everest’s pragmatism.

    By the 1830s, Everest’s survey party had grown into slow-moving caravans, reaching as many as 1,000 people at peak times. Contemporary accounts describe columns supported by elephants, horses and camels, with hundreds of porters carrying tents, instruments and provisions. The logistics were immense: scouts rode ahead to negotiate passage with villages, reapers with scythes gathered grass for the animals, hunters supplied fresh meat and a traveling treasury paid workers and suppliers. To villagers, an approaching column appeared like a military invasion. Negotiations for assistance and safe passage could halt the survey for days.

    The survey’s path was relentless. The Great Arc bisected India along the 78th meridian, from Cape Comorin to Bangalore, across the Deccan Plateau, through Hyderabad, over the northern plains to Dehra Dun at the Himalayan foothills. They didn’t simply pass through. They stayed. Sometimes for weeks, building 50 ft masonry towers to mount the theodolites.

    When daytime heat and haze made measurements impossible, Everest shifted to night surveying using powerful lanterns visible from 30 miles away. They constantly adapted due to temperature, atmospheric refraction, verification baselines measured at the chain ends. Every measurement propagated from that first line at Madras; a minor error would compound over thousands of miles.

    The price was paid in lives. Malaria wiped out entire parties. Three officers died in the Terai, the malarial lowlands of northern India. Two more retired, health-shattered. Everest himself contracted malaria repeatedly, suffering partial paralysis. The climate, he wrote, was “very deadly.”

    Andrew Waugh
    Andrew Waugh

    The survey transformed the land. To achieve clear sight lines, villages were razed, sacred hills appropriated, and community supplies exhausted. Yet the work continued. In December 1841, almost 40 years since the GTS began, the 1,500-mile Great Arc was complete. The spine was in place. Everest retired in 1843, passing the work to Andrew Scott Waugh, who extended the gridiron eastward. Nepal and Tibet were closed to outsiders. Waugh understood the distant Himalayan peaks, more than a hundred miles away, would have to be measured from the border stations anchored to the GTS framework. Accuracy became even more critical. This shift in focus from Everest’s large sprawling triangles inching north like a spider’s web forming the Great Arc, to Waugh’s tight triangles hugging the Himalayan frontier is visible on the GTS map.

    Over the next decade, Waugh’s teams pushed eastward through the jungles of Bengal, Bihar and Orissa, verifying baselines, fixing latitudes and longitudes astronomically, establishing stations that brought the peaks within mathematical reach. Along the entire border, surveyors recorded the peaks.

    Close-up of the border survey stations used to observe Peak XV. (Credit: Royal Geographical Society)
    Close-up of the border survey stations used to observe Peak XV. (Credit: Royal Geographical Society)

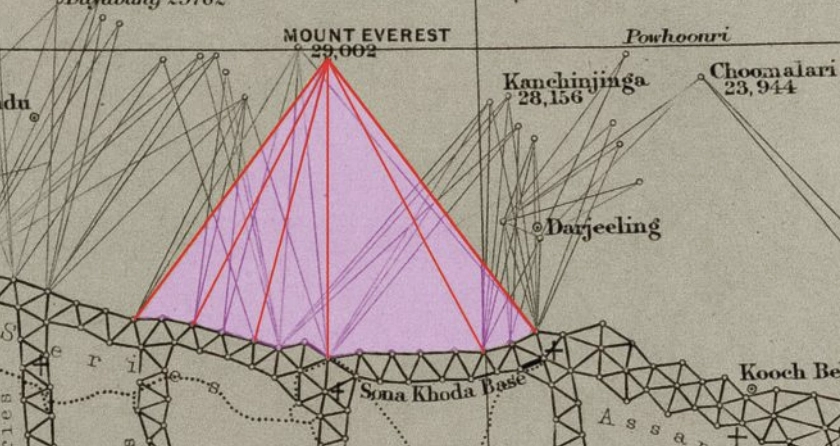
    To measure Peak XV, six observation stations were selected across the Terai, the deadly malarial lowlands chosen for the clear site lines to the summit. From these stations, surveyors recorded azimuth and elevation angles across multiple seasons. They measured the summit at sunrise, when the peak was first illuminated. None of the surveyors knew the height of the mountains they were observing because distance could not be measured directly. Only when all stations were plotted on a map could the peak’s position be fixed and the elevation calculated. This high-level mathematics fell to the human computers in Calcutta, led by Radhanath Sikdar.

    Radhanath Sikdar
    Radhanath Sikdar

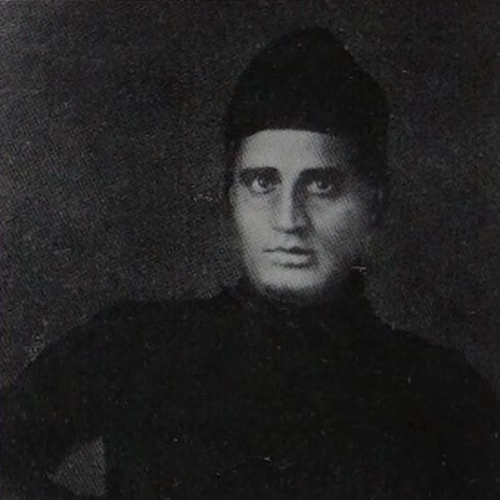
    By 1851, Sikdar had risen to chief computer, directing the department that transformed field observations into verified measurements. The 1851 Survey Manual acknowledged his distinction: “Babu Radhanath Sickdar, the distinguished head of the Computing Department…whose intimate acquaintance with the rigorous forms and mode of procedure…render his aid particularly valuable.” Yet, neither his education nor his geodetic calculation training prepared him for the complexities of the Himalaya problem. Nonetheless, he took the raw observations and calculated the mountains’ heights to determine which, if any, of the distant peaks was truly the highest point on Earth.

    Sikdar calculated the height of each of the peaks. There were many. It was slow, meticulous work. Peak XV required more than standard calculation. Six observation stations produced six independent height measurements, each requiring corrections for atmospheric refraction (light bending through air layers of varying density and temperature), Earth’s curvature (the summit was more than 100 miles away), and plumb-line deviation (the Himalayas’ mass pulled survey instruments slightly toward the mountains).

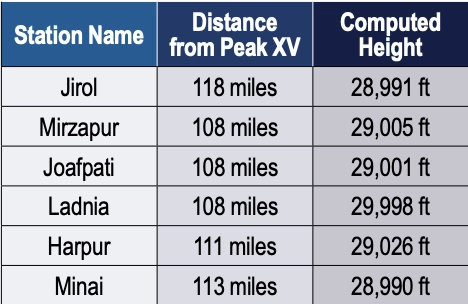
    Sikdar applied the Method of Least Squares, a statistical technique for extracting the most probable value from multiple observations. Each station’s measurement carried uncertainty; combining all six through rigorous mathematics yielded a more reliable result.

    The calculation took months. When Sikdar finished, he was stunned: exactly 29,000 ft recalculated and received the same result. The precision seemed too perfect. Sikdar knew the stakes. This wasn’t just another mountain. His calculations were correct. Peak XV was the highest point in the world, Chomolungma, meaning the goddess mother of the Earth. Such a discovery demanded the honor of delivering the news in person.

    In April 1852, Sikdar traveled 1,600 km from Calcutta to Dehra Dun. The journey took weeks. He carried the calculations in his satchel and the announcement in his mind.

    When Sikdar burst into Waugh’s office with the news, Waugh worried that exactly 29,000 ft (8,830 m) would make surveyors appear to have simply rounded. 2 ft were added, a small fiction to preserve credibility. The official height for Peak XV became 29,002 ft.

    Waugh spent four years verifying before the official announcement in March 1856. The mathematics were sound from the moment Sikdar burst into that office. Then, 20 years later, the 1875 Survey Manual erased Sikdar’s name entirely. The British press called it “robbery of the dead.”

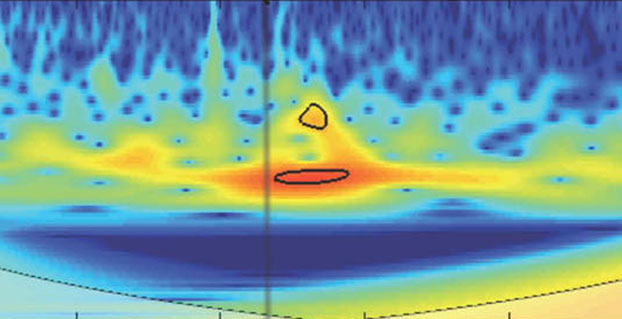
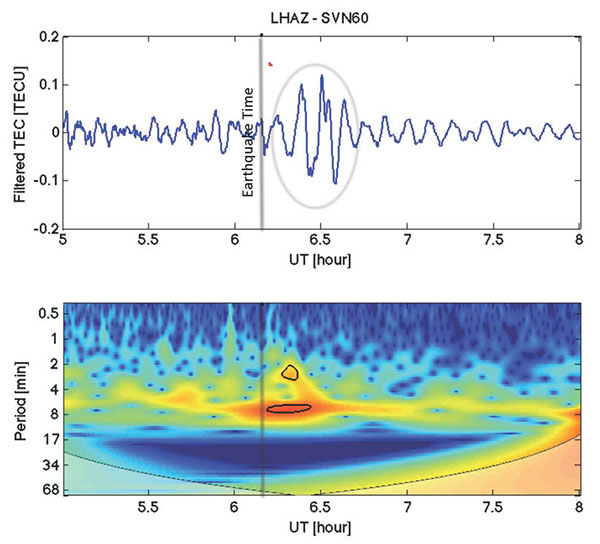
    Sikdar’s calculations have stood the test of time. The 1954 Survey of India measurement, 102 years later, yielded 29,028 ft, a minimal difference. In 1999, GPS technology placed a receiver on Everest’s summit for the first time: 29,035 ft. The 2015 earthquake prompted the most comprehensive measurement yet.

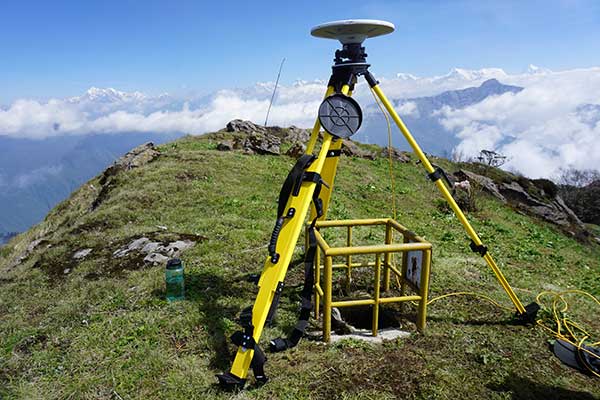
    On May 22, 2019, at 3 a.m., Nepali surveyor Khimlal Gautam departed Everest’s South Col for the 10-hour climb carrying 90 lbs (41kg) of equipment. The pre-dawn timing avoided crowds: the weight included a Trimble R10 GNSS receiver and ground-penetrating radar to distinguish rock height from snow depth. Eight continuously operating reference stations (CORS) were positioned across Nepal to receive signals from GPS, GLONASS, Galileo and BeiDou. Chinese surveyors simultaneously measured from the north.

    Gautam spent hours on the summit, collecting data while his body slowly consumed itself in the death zone. He lost a toe to frostbite. A team member nearly died from oxygen depletion. Gautam understood, “Mount Everest symbolizes something in Nepal, but it’s not only a Nepal asset, it’s a world asset.”

    The map of the Great Trigonometrical Survey. (Credit: Survey of India, via David Rumsey Collection)
    The map of the Great Trigonometrical Survey. (Credit: Survey of India, via David Rumsey Collection)

    On Dec. 8, 2020, Nepal and China jointly announced their result, agreeing for the first time the height was 29,031.69 ft. Sikdar’s error across 168 years was 31.69 ft, an accuracy of 0.11%.

    From that moment in Dehra Dun, Sikdar, dusty from the road, calculations in hand, certainty in his voice, we trace backward through 50 years of framework building to understand what made that measurement possible. Peak XV, hidden in plain view, seen for hundreds of miles, refusing to be known, was finally measured.

    Once we have measured it, we want to believe we know it, but the Indian and Eurasian tectonic plates continue to collide, pushing the mountain up four millimeters per year. Earthquakes in the region change the topography. The geoid problem persists: What does “sea level” mean 440 miles from the coast in a gravitationally dense region? Modern surveyors still grapple with the fundamental question: What does “height” mean when measured against a theoretical reference surface?

    The Great Trigonometric Survey proved that surveyors could measure what they couldn’t touch, calculate what they couldn’t reach, and verify what they couldn’t see. It required building the geodetic infrastructure across a subcontinent, maintaining mathematical precision across decades, and accepting brutal human costs.

    Then, the computer was a man. The information was in his satchel. The message was delivered in person. It was the first time the height of the highest known point was determined not by a physical barometer on a summit, but by mathematics alone, a man solving equations in a room 440 miles away. Sikdar proved the impossible: What couldn’t be touched could be measured, what couldn’t be reached could be calculated, and a man dusty from the road could hold the height of the world in the palm of his hand.

    Four names for one mountain. Each represents a different understanding. Its ancient name, Chomolungma, and Sagarmatha, its national identity. Peak XV, its cartographic name marking the audacious attempt to measure it, and the name Mount Everest, the crowning achievement, a proclamation honoring mathematics, from Hipparchus who is credited with developing trigonometry to the computers, like Sikdar. It stands as a monument to all the surveying and cartography, especially of the 19th century accomplishing the impossible against extraordinary odds.

    Surveying and mapping are jobs of courage and determination exploring the unknown, risking death in malaria-infested jungles, Everest working while stricken with partial paralysis, Abdul Hamid crossing a forbidden border, and Gautam’s predawn climb. They all understood what mattered was worth the risk. It is the surveyor’s call to arms: measure the Earth.

  • Surveyors and their global role as humanitarians

    Surveyors and their global role as humanitarians

    Every year, surveying associations worldwide celebrate Global Surveyor’s Day during the third week of March. This year is no different (even during a pandemic) and will be recognized on Tuesday, March 23.

    While this past year has been full of challenges, the role of the surveyor on a global scale has continued to grow. As a professional land surveyor in the midwestern portion of the United States, my surveying experiences have been wide-ranging at times.

    For those who know of me and/or have followed my writings here in GPS World, you probably understand how my perspective for the surveying profession has come to be. For those who have no clue about my background, let me give you a brief refresher:

    • Second-generation surveyor, born and raised in Central Illinois, United States
    • Surveyed in rural, suburban and urban environments
    • Began writing for GPS World in 2015 to share my surveying perspective

    Even though my surveying career has spanned several decades, my experience has been limited to the areas described above. From my early days of spending hours in the county recorder’s office pouring through tract index books, all the way to viewing parcel shapes, scanned documents and high-resolution aerial imagery in today’s world, it seemed at face value that my experience covered most of the duties of the typical land surveyor.

    My career has encountered robotic total stations, all iterations of GPS/GNSS data collection, laser scanning, and now UAV data collection. Throw in the development of the personal computer, COGO and CAD software, the Windows operating system, pen plotters, and countless software breakthroughs, and my perspective of the surveying profession had been front row for all the great things we now take for granted.

    However, these advancements, in tandem with growing up in middle-class America, did not prepare me for a recent experience with a surveying/geospatial group new to me.

    VCSP Wisdom Workshop

    VCSP logoA virtual workshop was recently held to discuss the Volunteer Community Surveyor Program (VCSP) instituted in 2017 by the International Federation of Surveyors (FIG) and the FIG Young Surveyors Network (YSN). More than 125 attendees from worldwide locations logged into the sessions to learn about the program and how to become involved.

    The program, titled “Sustainable Solutions for Land Based Community Problems: Tools and Modern Approaches,” spanned two days and two four-hour sessions. Before we jump into the specifics of the program, first we will offer another brief refresher on FIG and its YSN.

    The Fédération Internationale des Géomètres, now known to English speaking nations as International Federation of Surveyors, was founded in July 1878. It has grown into a worldwide non-governmental organization representing more than 120 countries and their surveying/geomatics professions.

    FIG logoThe National Society of Professional Surveyors (NSPS) is a member organization and participates at various levels throughout FIG.

    The FIG Young Surveyors Network (FIG YSN) was initially established in 2006 as a working group, and upgraded in 2009 to network status due to its rapid growth. This group of young professionals and practitioners worldwide has worked with groups such as the United Nations, World Bank, National Society of Professional Surveyors (NSPS) and Council of European Geodetic Surveyors (CLGE) to promote the profession, increase opportunities for young professionals, and be an agent for social and climate change.

    This YSN workshop set lofty goals, including providing information about the VCSP as well as informing participants of the current means and methods of surveying in underdeveloped countries. For context, here are the program topics covered over the two days:

    DAY 1: Community problems, land tenure and tools for land management

    • Experiences and opportunities of humanitarian surveyors (past volunteer community surveys)
    • Land management, community development and open technologies
    • Identifying the relationship between land management and community development
    • The skills of a humanitarian surveyor
    • Introduction to STDM and Cadasta tools
    • An implementation of the STDM and Cadasta tools for land management

    DAY 2: Building capacity and implementing modern land-management approaches

    • Leveraging land-management tools for problem solving and decision making
    • Designing country-scale solutions for land rights and tenure security issues
    • Gathering resources for land management projects
    • How much have land rights and tenure insecurity impacted your country?
    • Documenting and publishing experiences
    • What’s next? Parallel sessions by FIG region

    Introduction to the humanitarian surveyor

    Like most land surveyors in the United States, our role has been well-defined for generations. We establish and/or reestablish parcel boundaries (that is, original or retracement surveys). While our duties have expanded based upon technology, the central responsibility of the surveyor has been established as an expert measurer and provider of boundary information.

    In the 200+ years since the westward expansion and formal establishment of most of the United States, the role of the surveyor has evolved into more of a commercial purpose. A surveyor’s principal responsibility is to protect the public, but that meaning has much different connotations in lesser developed countries.

    FIG Volunteer Community Surveyor working with locals to discuss parcel possession. (Photo: FIG Young Surveyors)
    FIG Volunteer Community Surveyor working with locals to discuss parcel possession. (Photo: FIG Young Surveyors)

    In the recent past, surveying efforts in many developing countries have been like the early General Land Office surveyors in the 1800s. A surveyor in these regions is out in front of development of unclaimed lands, observing natural and manmade boundaries to guide the decision-making process in establishing parcel rights. The methods and procedures used to date in many lesser developed countries are much like 19th-century surveying — primitive instruments and crude maps sketch property claims with little to no authority.

    Surveying: The Next Generation. Here is where the concept of the community or humanitarian surveyor comes into the picture. A new generation of surveyors is using modern technology not just to map existing boundaries and improvements, but also to collect additional data that will be analyzed to help improve living conditions. With the introduction of GNSS technology, establishment of parcel boundaries now takes an accurate and precise shape in GIS databases created for improving conditions in these areas.

    Additional attributes are collected to determine utility needs, communication availability and access to medical care.

    The easy solution seems to be that, as a larger part of the surveying community, we send teams of surveyors to these countries to locate and establish boundaries as well as perform site studies to determine living conditions and potential improvements. If it were just that easy…

    Local government: Friend or foe?

    Often, these surveyors are going into regions where the local or national governments do not agree with empowering their citizens with property rights and allowing them access to basic utilities. Part of the humanitarian surveyor’s role is to get to know the “lay of the land” when it comes to local order.

    Many remote places are controlled by local gangs, tribes or other factions. These groups forbid the population around them to own their property. Even though it may seem like these physical parcel boundaries exist, most of these people do not have title or land tenure rights. This is partly because of the local control situation, but can also be due to the lack of sophistication within the local or national government.

    Communication hurdles. Another hurdle for the humanitarian surveyor has nothing to do with their professional capability — it relies solely on appearance, body language and ability to bridge a communication gap. For example, most first-world nations rely strictly on communication skills and the competence to effectively work with other people. We often easily trust those who present evidence of competency with no previous interaction.

    In third-world countries, however, locals do not trust outsiders and place competency on those who have built long-term relationships with them. They also rely heavily on body language and facial expressions to convey trust. Local citizens in these areas are less likely to trust visiting older generations who are not able to understand these visual cues.

    Combining the factors of trust of the local citizens with the unsteadiness of government and/or lawlessness, the humanitarian surveyor must also be able to determine common property lines, locate lines of occupation, and remain neutral in providing guidance to adjacent neighbors. These conditions often include areas for crops and livestock, as well as places for food growth and development.

    With little to no money and lack of commerce available, many of these regions are food poor. Locals are forced to harvest their own food, so having a plot of land to grow these crops is critical.

    The surveying procedure for the VCSP. (Image: FIG Young Surveyors)
    The surveying procedure for the VCSP. (Image: FIG Young Surveyors)

    In more established areas, it can be challenging to determine land tenant rights with many shanties and lean-tos being joined structurally. It is equally difficult to determine if any common utilities exist in these areas, such as stormwater channels to help with rainfall.

    Add to these improvement location duties the need for better census data to help with government analyzation of population to apply for aid from other countries.

    The good thing is that technology has progressed in creating tools for geographically locating all these entities, including population, with a multitude of attributes to complete proper analyzation. But there is a catch.

    Technology challenges worldwide

    One of the biggest issue surveyors face when providing services in these areas is the lack of advanced technology and computers. These areas may not have reliable utilities, such as electricity or running water, much less viable internet or Wi-Fi. If computers do exist with local government, they are often years behind in computing power and software. Even operating systems like Windows are a rarity in many of these countries.

    Networking accuracy needed. Most humanitarian surveyors will bring their own equipment and computers, so that problem can be averted. But what about geographical locations? Yes, GNSS constellations are available worldwide, but accuracy using just satellite signals is not sufficient for location of parcels and improvements.

    To get survey-grade accuracy, the surveyor will typically utilize a correction service or base station on a known value. Most of these corrections are based on Continuously Operating Reference Stations (CORS) or similar established reference stations, so creating a georeferenced datum for the surveyed location takes time and knowledge. Once the network is established, lots of work and oversight is necessary to provide quality control on the data being located.

    Tackling parcel management on a global scale. (Image: FIG Young Surveyors)
    Tackling parcel management on a global scale. (Image: FIG Young Surveyors)

    To add to these issues, most of the staff necessary to complete the surveys must be brought in due to the lack of education at the location. The role of the humanitarian surveyor will also be to teach the craft of surveying to locals, who will continue to expand the area cadaster after the volunteer surveyor has left.

    Open-Source Software. However, affording the necessary equipment, computers and software to continue the newly established system is also a hurdle for the community. While the price of computer hardware has greatly reduced over time, the advancement of software and cost of upkeep provides a greater monetary challenge.

    Enter open-source software, based upon Linux and other free computer operating systems. This software has been developed with these situations in mind. It allows for customization to each user’s specific need. There are several GIS and data-collection platforms to fit the needs of these budding communities and countries. Open-source and public-domain software allow even the most basic of cadaster needs to be completed efficiently.

    Young surveyors network to the rescue

    From a technology standpoint, it makes sense that the FIG Young Surveyors Network began this program to help underdeveloped nations begin to create simple cadasters for assessing their property and improvement needs. The younger generation has grown up with technology and can easily teach someone how to embrace it and trust the results.

    This younger generation is also the developer of open-source software and tools and sees the value in providing low- to no-cost applications to those who need it most. While the hard part is collecting the data and working with the locals to establish common boundaries, count the population, and determine the utility needs, they take pride in being part of a solution for a segment of the world that may not have any other chance or choice.

    Participants in the Volunteer Community Surveyor Program (VCSP). (Photo: FIG Young Surveyors)
    Participants in the Volunteer Community Surveyor Program (VCSP). (Photo: FIG Young Surveyors)

    One of the interesting portions of the workshop was the breaks between segments. While it was a time to step away from the computer/tablet/phone, the organizers broadcast videos of musical groups from around the world and encouraged the participants to stand up and dance, with their cameras on. While I did not partake in the dancing (it was 4 a.m. at my home), I applaud the Young Surveyors for providing a welcoming atmosphere where each person could be themselves. Several of the participants were in Africa and Asia on cellphones, so creating a workshop environment that worked for all levels of engagement was fascinating.

    What I learned

    My biggest takeaway was simply learning about the term “humanitarian surveyor.” My earlier reference trying to relate these volunteers to the GLO surveyors, while in the same vein in establishing land boundaries, misses badly in terms of overall contribution to the communities in which the volunteers visit.

    The work they perform is truly humanitarian. While I have tried to comprehend the conditions they are facing, I again fall short in fully experiencing what the role has to offer.

    One of the testimonials was regarding a group that went to Nepal following the 2015 earthquake to help re-establish towns and parcels. The pictures were stunning, and the memories shared were heartfelt. To be one of these volunteers is truly a humanitarian effort.

    Well done, FIG Young Surveyors Network and the Volunteer Community Surveyor Program. I will do my best to not take life here for granted anymore.

  • Everest survey succeeds with Trimble GNSS

    Everest survey succeeds with Trimble GNSS

    The Government of Nepal has completed fieldwork for measuring Everest’s height using GNSS equipment from Trimble, including the robust R10 receiver.

    The Survey Department of the Government of Nepal has completed fieldwork for the National Initiative for the Measurement of the Height of Sagarmatha (Mount Everest). The Nepali survey team summited at 3 (local time) May 22, 2019 (by the Nepali calendar, that’s २०७६ जेठ ८, or June 8, 2076).

    The summit team of Chief Survey Officer Khim Lal Gautam and Survey Officer Rabin Karki was supported by mountain guide Tshiring Jangbu and two of his fellow Sherpas.

    The ascent was dark, windy and treacherous — the team had to make optimal use of the limited time that the hazardous conditions and their oxygen supplies afforded. The primary surveying task was to collect GNSS observations with the Trimble R10 GNSS receiver they carried.

    On the summit: Chief Officer Khim Lal Gautam, Survey Officer Rabin Karki, Sherpa Tshiring Jangbu, and the Trimble R10. (Photo: Trimble)
    On the summit: Chief Officer Khim Lal Gautam, Survey Officer Rabin Karki, Sherpa Tshiring Jangbu, and the Trimble R10. (Photo: Trimble)

    Due to the limited time window on the summit, they had essentially one shot at the GNSS observations. The R10 was configured to begin collecting observations on power-up. During training and test observations before the ascent, the R10 had proven to be exceptionally reliable, with no malfunctions.

    Compact size, light weight and durability were important factors for the receiver chosen for the summit observations. The IP67-rated R10 with internal battery weighs 1.12 kg (2.5 lb.) and operates in a temperature range of –40° C to +65° C (–40°F to +149° F). Its solid alloy housing withstands a 1-meter drop. The only concern for the team on the final ascent was to keep the battery and spares warm.

    The R10 recorded 1 hour and 16 minutes of GNSS observations. The static data (observations from GPS, GLONASS, Galileo and BeiDou) was post-processed using Trimble Business Center software together with observations from eight GNSS reference stations established as an active control network for the survey. Several of the reference stations were Trimble NetR9 network receivers with Zephyr Geodetic antennas.

    The team also used a compact ground penetrating radar (GPR) instrument to determine the distance between the top of the ice/snow cap on the summit and the highest point of solid rock beneath.

    Many of the successive accepted heights for Everest have been to the top of the ice cap, which can vary seasonally by several meters. A goal of the survey is to provide heights for both aspects of the peak. An additional reason to establish a new height for Everest is to determine whether, and by how much, the 2015 earthquakes in the region altered the mountain.

    Photo: Trimble
    Photo: Trimble

    While the Nepalese survey team’s GNSS observations on the summit will yield the height, the final orthometric elevation will be achieved by applying an updated gravity model. The gravity model was refined from supporting surveys on the mountain and surrounding region.

    A total of 298 new gravity observations were performed over several years, with companion GNSS observations on each control point. More than 248 kilometers of precise leveling, supplemented with trigonometric leveling, was performed for the network of control and base receiver locations. Instruments employed for these terrestrial surveys included Trimble DiNi levels and S9 total stations.

    Trimble GPS/GNSS instruments have been to the Sagarmatha summit on multiple occasions, including in 1990, 1998, 2005 and 2012. The R10 represents the lightest and most compact of these to date.

    By prior agreement between Nepal and China, the results of the 2019 Nepali survey, and a May 2020 Chinese survey, will be jointly announced. Official results are expected this summer.


    Featured photo: A GNSS reference station network was established before the survey to provide data for post processing, and to support additional surveying and geophysical studies of the region. (Photo: Trimble)

  • Nepali survey team collects Everest height data

    The survey team set up the base station in Everest base camp. (Photo: Tshiring Jangbu Sherpa via Nepal24hours.com)
    The survey team set up the base station in Everest base camp. (Photo: Tshiring Jangbu Sherpa via Nepal24hours.com)

    A Nepali survey team made a successful ascent of Mount Everest to measure its official height.

    This is the first height survey conducted by the government of Nepal. The precise height of Mount Everest — now listed as 29,029 feet, or 8,848 meters — has been contested since the first survey by British officers in 1849.

    Nepal plans to end the controversy and declare both snow and rock height of the world’s tallest mountain.

    Chief Survey Officer Khimlal Gautam and surveyor Rabin Karki reached the peak of Mt. Everest on May 22 at 3 a.m. local time and collected data from a Trimble R10 GNSS receiver gifted from New Zealand.

    The surveyors stayed atop the peak for about 1 hour, 16 minutes, according to Nepal24hours.com.

    The final result of the official height measurement of Mt.Everest is expected within the next six months.

    “To make the observation of data on GNSS we spent one hour and 16 minutes in the summit which was a very challenging and trying time for us,” Gautam said. “We faced extreme difficulty mainly while descending from the summit.”

    According to Tshering Janbu Sherpa, guide leader of the survey team, the team faced difficulties because of the exhaustion of oxygen of one member, who was rescued during the descent.

    Besides a GNSS survey at the summit, teams conducted precise leveling, trigonometric leveling and gravity surveys. The GNSS survey will cover 285 points with 12 different observation stations, nine of which are in hills of Sankhuwasava, Bhojpur and Solukhumbu districts.

  • Seen & Heard: Measuring Everest, GPS Rollover boo-boos

    Seen & Heard: Measuring Everest, GPS Rollover boo-boos

    Seen & Heard is a monthly feature of GPS World magazine, traveling the world to capture interesting and unusual news stories involving the GPS/GNSS industry.

    Photo: Mount Everest/Daniel Prudek/Shutterstock.com
    Photo: Mount Everest/Daniel Prudek/Shutterstock.com

    Surveying the highest height

    The precise height of Mount Everest — now listed as 29,029 feet, or 8,848 meters — has been contested since the first survey by British officers in 1849.

    On January 2020, Nepal plans to end the controversy and declare both snow and rock height of the world’s tallest mountain. This spring a two-member Nepali survey team will summit the mountain with a Trimble R10 GNSS receiver, gifted by New Zealand.

    Besides a GNSS survey at the summit, teams will conduct precise leveling, trigonometric leveling and gravity surveys. The GNSS survey will cover 285 points with 12 different observation stations, nine of which are in hills of Sankhuwasava, Bhojpur and Solukhumbu districts.

    Photo: e-Golf cars/Volkswagen
    Photo: e-Golf cars/Volkswagen

    Takin’ it to the (Hamburg) streets

    Five electric Volkswagen Golfs are now on the streets of Hamburg, Germany, being tested with Level 4 automation.

    The cars are designed to handle complex urban traffic patterns without help from drivers, although they must be ready to intervene.

    Level 5, the highest category, requires the vehicle to perform all tasks, turning every rider into a passenger.

    The cars are driving 1.9 miles (3 km) of urban roads where new signals and traffic management systems have been installed for autonomous driving.

    Boeing 787 Dreamliner Hainan airlines/aapsky/Shutterstock.com
    Boeing 787 Dreamliner Hainan airlines/aapsky/Shutterstock.com

    GPS Rollover gone wrong

    The April 6 GPS Week Number Rollover was supposed to pass without a hitch, with plenty of notice that updates might be required for legacy receivers. Instead, several systems crashed.

    In China, as many as 15 Boeing 777s and 787s were grounded pending a GPS update (the receivers gave the date as August 22, 1999.)

    In New York City, part of the wireless grid faulted, cutting information feeds to the NYPD (license plate cameras) and remote worksite communications.

    In Australia, weather balloons were grounded. In the United States, NOAA autonomous monitoring stations went offline. Fixes for all these systems are underway.

  • GPS Data Show How Nepal Quake Disturbed Earth’s Upper Atmosphere

    GPS Data Show How Nepal Quake Disturbed Earth’s Upper Atmosphere

    The April 25 magnitude 7.8 earthquake in Nepal created waves of energy that penetrated into Earth’s upper atmosphere in the vicinity of Nepal, disturbing the distribution of electrons in the ionosphere. These disturbances were monitored using GPS signals received by a science-quality GPS receiver in Tibet, a neighboring region to Nepal.

    The data show that after the initial earthquake rupture (indicated by the vertical black line on the graphic), it took about 21 minutes for the earthquake-generated ionospheric disturbance to reach a GPS station (LHAZ) about 400 miles (640 kilometers) away from the epicenter in Lhasa, Tibet, China.

    Image Credit: NASA/JPL/Ionosphere Natural Hazards Team
    Image Credit: NASA/JPL/Ionosphere Natural Hazards Team

    The disturbance measurements, known as vertical total electron content (VTEC) (depicted in blue in the upper panel), have been filtered using processing software developed by NASA’s Jet Propulsion Laboratory in Pasadena, Calif., to show wave-like disturbances (circled in red) in the distribution of electrons in the ionosphere. The waves have periods of between two and eight minutes in length. The disturbance measurements following the earthquake rupture are circled in black in the lower panel. The colors represent the relative strengths of the earthquake-induced ionospheric disturbances as captured by the GPS signals, with red being high and blue being low.

    Attila Komjathy, a principal  investigator of the Ionospheric and Atmospheric Remote Sensing group at JPL and adjunct professor at the University of New Brunswick, is leading this effort. Komjathy is also a GPS World annual award winner and named a Fellow of the Institute of Navigation in January.

    The LHAZ GPS station is hosted at the Tibet Autonomous Regional Bureau of Surveying and Mapping Institute. The site collects both GPS and GLONASS (the Russian global navigation satellite system) data at a rate of 1 Hertz and is part of the International GPS Service (IGS).

    Scientists study ionosphere-based measurements caused by natural hazards such as earthquakes, volcanic eruptions and tsunamis to better understand wave propagation in the upper atmosphere.The ionosphere is a region of Earth’s upper atmosphere located from about 37 miles (60 kilometers) to 621 miles (1,000 kilometers) above Earth’s surface.

    The disturbances caused by earthquakes help scientists develop new first-principle-based wave propagation models. These models may become part of future early warning systems for tsunamis and other difficult-to-detect natural hazards.

    The data is available on this FTP site.

  • Esri Maps Reveal Impacts from Nepal Earthquakes

    Esri has added a pair of new maps to its Nepal Earthquake Maps gallery

    Nepal Earthquake Swipe Map

    Compare pre- and post-earthquake imagery from Airbus Defence & Space to explore damage around Nepal. This map includes several bookmarks to help users navigate around key points of interest and landmarks that were damaged or destroyed.

    Esri-Nepal-Swipe-W

    Nepal Earthquake Impact Summary Map

    Users can interactively explore demographic information about the people affected by the earthquake. The map fuses demographic data with the Shakemap from USGS to provide estimates about the population in each shake zone. Click a zone on the map to see how many people live in that area.

    Esri-Nepal-Summary-W

  • Drones Dispatched to Nepal to Search for Survivors

    Aeryon Labs, GlobalMedic and Monadrone are working together to deploy three unmanned aerial systems (UAS) in Nepal to help locate earthquake survivors. The drones are outfitted with thermal cameras and the Aeryon HDZoom30 camera, which has an extended zoom, to look at targets from more than 1,000 feet away. 

    On Saturday, April 25, a 7.8 magnitude earthquake struck Nepal — the largest quake in 81 years in the region. More than 4,000 people have died, with death tolls expected to rise as the rubble is cleared.

    In response, Aeryon Labs deployed three of its sUAS (small UAS) and a qualified Aeryon pilot to the affected region. Aeryon is collaborating with partners GlobalMedic and Monadrone to provide aerial support to international disaster relief teams on the ground.

    The Global Medic UAV team responded immediately to the crisis in Nepal. “sUAS provide us the unmatched capability to get onsite and into the air immediately to start determining how and where to provide support to the people,” said Rahul Singh, executive director of GlobalMedic.

    Damage to, or the complete loss of, fundamental infrastructure such as airstrips and refueling facilities can make manned aircraft operations in disaster relief scenarios very challenging. Sending rescue workers into damaged structures, or rubble piles, to search for survivors also puts them in harm’s way. sUAS enable ground-based rescue teams to collect critical visual intelligence and deploy rescue resources quickly, carefully and exactly where they are most needed, the companies said.

    The Aeryon HDZoom30 is a fully-integrated, ruggedized, high performance electro-optical camera payload for UAS.
    The Aeryon HDZoom30 is a fully-integrated, ruggedized, high performance electro-optical camera payload for UAS.

    The Aeryon sUAS being sent to Nepal are equipped with thermal cameras to help locate survivors by detecting body heat, as well as the companies newest imaging payload, the Aeryon HDZoom30, which can be used at extended distances to zoom in to see a target with clarity and detail. For example, operators are able to recognize a face from more than 1,000 feet (300 meters) away. The team will also undertake aerial mapping of the affected areas, building 2D and 3D maps, so that further response efforts can be planned.

    “At Monadrone, we see sUAS as mission-critical tools that not only support day-to-day military, police and fire department needs, but can also play a vital role when disaster strikes,” said Robin Morris, director at Monadrone, Monaco. “The images the Aeryon sUAS will capture will enable the creation of up-to-date maps required to aid the disaster relief in Nepal.”

    Aeryon sUAS were also deployed in the aftermath of the August 2014 landslide that devastated the region along the banks of the Sunkoshi River in northern Nepal. Despite the high altitude of Nepal, which is challenging for many aircraft, and the rugged terrain, Aeryon sUAS proved effective and more than up to the task.

    “UAS are uniquely able to provide immediate support for disaster relief, like the earthquake in Nepal, helping rescue teams search more effectively, efficiently and safely,” Dave Kroetsch, president and CEO of Aeryon Labs, told AUVSI News. “It’s an honor to see the technology you create make such a difference. We are privileged to be able assist the aid workers who are helping the people of Nepal.”

  • Airbus Releases Satellite Imagery of Nepal Earthquake

    Following Nepal’s devastating magnitude 7.8 earthquake on Saturday, Airbus Defence and Space has acquired Pléiades satellites imagery to support the International Charter and Copernicus Emergency Management Service. The data acquired will assist in assessing the damage and help rescue organizations in the delivery of humanitarian aid.

    The before and after Pléiades images over Kathmandu (full image can be downloaded here) show the devastation caused by the earthquake. The below “before” Pléiades image was acquired on Nov. 29, 2014, and the “after” Pléiades image was acquired on April 27, 2015, two days after the earthquake.

    Kathmandu, viewed by Pléiades satellites, before and after the earthquake. (Image: Airbus Defence & Space)
    Kathmandu, viewed by Pléiades satellites, before and after the earthquake. (Image: Airbus Defence and Space)

    The Airbus Pléiades 1A and Pléiades 1B satellites operate as a constellation in the same orbit, phased 180 degrees apart. The identical twin satellites deliver high-resolution optical data products and can revisit any point on the globe, according to Airbus.

    UPDATE:

    Esri has created a Nepal Earthquake Swipe Map, which allows users to compare the pre- and post-earthquake images from Airbus Defence & Space to explore damage around Nepal. This map includes several bookmarks to help users navigate around key points of interest and landmarks that were damaged or destroyed.

    Esri-Nepal-Swipe-W

  • DigitalGlobe Offers Satellite Images of Nepal Earthquake

    In response to the devastating 7.8-magnitude earthquake that struck central Nepal on April 25, DigitalGlobe has made high-resolution satellite imagery of the affected areas freely available online to all groups involved in the response and recovery effort through the company’s FirstLook initiative.

    This imagery can be accessed via http://services.digitalglobe.com.

    Username: nepal
    Password: forcrisis​

    The below before and after images show the destruction of the nine-storey Dharahara Tower, which was built in 1832 and was a UNESCO World Heritage site.

    The Dharahara Tower in Kathmandu, in a DigitalGlobe satellite image taken in October 2014. (Image credit: DigitalGlobe)
    The Dharahara Tower in Kathmandu, in a DigitalGlobe satellite image taken in October 2014. (Image credit: DigitalGlobe)

    The Dharahara Tower is shown leveled following the earthquake (Image credit: DigitalGlobe).
    The Dharahara Tower is shown leveled following the earthquake (Image credit: DigitalGlobe).

    Specifically, DigitalGlobe activated FirstLook, the subscription service that provides emergency management and humanitarian workers with fast, web-based access to pre- and post-event images of the impacted area. DigitalGlobe captured imagery of the area April 26 through heavy cloud cover with its WorldView-1, and WorldView-3 and GeoEye-1 satellites. WorldView-2 and WorldView-3 have been tasked to image the area again April 28. Pre-event imagery dating back to April 1 is also available to aid understanding and coordination for on-the-ground missions.

    In addition, DigitalGlobe has activated Tomnod, the crowdsourcing platform that allows web-connected volunteers around the globe to help disaster response teams by mapping damage from this earthquake. While satellite imagery on its own is useful, greater benefit comes from extracting meaningful information that can be used by first responder and recovery agencies.

    By visiting the Tomnod website, users can participate in the Nepal campaign by tagging damaged buildings, roads, and areas of major destruction to inform disaster response teams on the ground. Whether a person donates five minutes or five hours, anyone can analyze DigitalGlobe imagery to help make a difference.

  • Esri Hosts Info Map for Nepal Earthquake

    Esri-Nepal-Earthquake-O

    A massive 7.8 magnitude earthquake struck 77 kilometers (48 miles) northwest of Nepal’s capital Kathmandu at 0611 GMT on April 25, toppling office blocks and towers and killing thousands of people. More than two dozen people were also reported killed in neighboring India, China and Bangladesh.

    As of April 27, the Government of Nepal reported 3,351 deaths and 6,833 injured people, according to ReliefWeb. These numbers are expected to increase further as search and rescue teams reach remote areas. Most of the deaths are recorded in Bhaktapur, Kathmandu and Lalitpur. Eight million people in 39 districts have been affected, of which over 2 million people live in the 11 severely affected districts.

    The Esri disaster page is featuring news stories, video feeds, and other information about the earthquake in Nepal, on an Earthquake Public Information Map. Users can explore the locations and intensities of the various quakes that struck Nepal, along with a shakemap from the USGS. This map also includes geotagged social media from Twitter and YouTube with local content related to the quakes.

    Another Esri map, Mapping the 2015 Nepal Earthquake, provides a closer look at Nepal’s history of seismic activity, and shows how people are impacted by earthquakes. This story map also includes information about relief operations and key points of interest in the region, as well as a 3D web scene of the area affected by the avalanche on Mt. Everest.

    OpenStreetMap is also working to help with relief efforts. “Our goal is to contribute to humanitarian relief by rapidly providing a detailed and accurate map (i.e., road network, villages, buildings, etc.) to support the humanitarian organizations. These services help locate people at risk efficiently, and facilitate the delivery of goods and services to remote areas.”

    The USGS provides an earthquake map here.

    Esri-Nepal-Earthquake-map-O