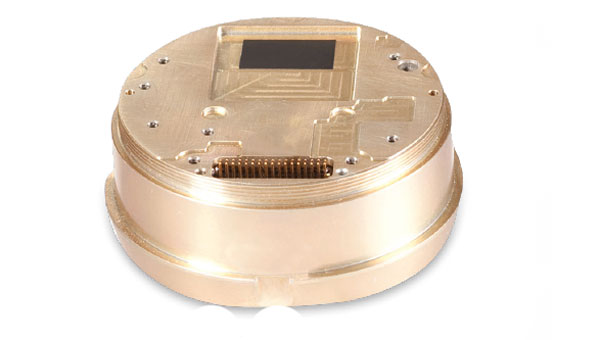
BAE Systems has unveiled NavStorm-M, a gun-hardened integrated anti-jamming GPS receiver for artillery, bombs, missiles and unmanned systems.
NavStorm-M features a layered protection approach using beamforming, anti-spoofing, resiliency and software assurance. It is an assured positioning, navigation and timing (A-PNT) device featuring M-Code GPS technology.
The capability is designed to meet the tight size, weight, power and cost (SWaP-C) requirements of unmanned aircraft systems, loitering munitions, hypersonic platforms and other weapons – especially in gun-hardened applications. NavStorm-M offers precise GPS navigation as a stand-alone system or integrated with an inertial navigation system (INS).
BAE Systems has delivered selective availability anti-spoofing module products to more than 45 countries and has begun delivering M-Code GPS receivers in multiple form factors and levels of capability to the U.S. armed forces and its allies through the Foreign Military Sales program.
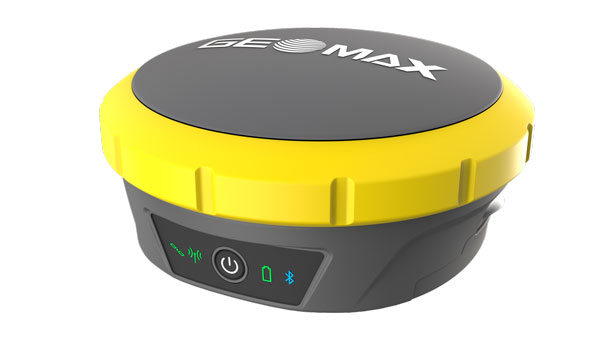
GeoMax Positioning has unveiled the Zenith60 Pro GNSS smart antenna, designed for surveyors and construction professionals.
It is a real-time kinematics (RTK) rover that features calibrated free tilt compensation to measure otherwise inaccessible points. The antenna is suited for harsh climates, urban areas, dense canopy coverage or other challenging terrains.
This multi-constellation, multi-frequency GNSS receiver features a GNSS board with more than 800 channels and IP68 protection against dust and water. It also connects with GeoMax total stations and X-PAD field software to create an efficient and flexible workflow.
NAVSYS Corporation has secured a $4.4 million contract from the Rapid Architecture Prototyping and Integration Development (RAPID) Laboratory of the Air Force Research Laboratory (AFRL). The contract is part of AFRL’s Commercial Alternative Positioning, Navigation and Timing (PNT) for RAPID (CAPR) program, which aims to provide the Department of Defense improved access to reliable and resilient PNT services, particularly in situations where GPS is unavailable or compromised.
The contract involves developing and maturing NAVSYS’ PNT as a Service (PNTaaS) system architecture. This technology uses existing SATCOM signals for PNT services, utilizing broadband signals outside of the L-band frequencies, which are often subject to jamming. The system employs multiple frequency allocations, including C-band, Ku-band and K-band, to offer high resilience and performance equivalent to GPS.
Test results previously published by NAVSYS have demonstrated the system’s capability to use satellites operated by Intelsat, Viasat, Eutelsat, SES and Telesat to deliver backup PNT capability to GPS.
Wangjie Zhao, an employee of CHC Navigation. (Photo: CHC Navigation)
For decades, surveying — which consists largely of making measurements to determine the relative positions of points above, on or beneath Earth’s surface — had much higher accuracy than mapping for geographic information systems (GIS) — which is mostly based on aerial photogrammetry for base maps and field data collection of the locations of features. When I started in this field a quarter century ago, we typically classified GPS receivers as survey grade, resource grade or consumer grade, with “resource grade” referring to field data collection for GIS.
Today, however, the accuracy of all receivers has greatly increased — thanks to improved chipsets, new GNSS constellations, and a plethora of corrections services — and those three categories are no longer relevant. Therefore, surveying and mapping are increasingly overlapping.
For this cover story, I asked the same three questions about mapping and surveying to representatives of four companies.
CHC Navigation — Rachel Wang, product manager of survey and engineering product line
Hexagon — Craig Hill, VP marketing and services, surveying solutions, Leica Geosystems
Surveying and mapping are increasingly overlapping. What are the remaining differences between them, in terms of accuracy requirements and challenges in the field?
CHC Navigation
While advances in technology such as lidar and photogrammetry are narrowing the gap, there are still notable differences between surveying and mapping. Surveying often requires centimeter- or even millimeter-level accuracy at specific points. In contrast, mapping focuses on collecting dense 3D data over large areas. Although the accuracy of mapping point clouds is steadily increasing, the integration of ground-based GNSS data collection with aerial imagery and lidar is becoming widespread. Mapping tends to be less labor-intensive and involves fewer safety risks in the field, but it requires a unique skill set, particularly in point cloud processing.
Hexagon
Traditionally, surveying and mapping differ primarily in their accuracy requirements and application scales; however, this paradigm is changing with mapping becoming increasingly accurate. Surveying focuses on high-precision geospatial data of specific points. From road, rail and tunnel construction to high-rise buildings, there is no substitution for the precision delivered by surveying equipment and procedures. In contrast, mapping focuses on larger areas.
Recent advancements in sensor technology, including both airborne and mobile mapping systems such as the Leica CityMapper-2 and the Leica Pegasus TRK, have significantly improved the efficiency and precision of mapping, bringing it closer to the levels achievable with traditional surveying equipment.
OxTS
Surveying comes with a large overhead during the data collection process. It requires meticulous preparation and attention to detail to achieve high accuracy in the raw data. GNSS quality, lever arms, user operation, etc., can all cause problems later on. Getting any part of the process wrong can have major cost implications through having to redo the process.
Mapping is focused on the act of aligning that data to datums and control points after the surveying process is completed but it also requires major attention to detail in aligning coordinate frames and origin points in order to avoid baking in any errors that lead to mistakes being made once the map data is handed over to a customer
The problem is that if the surveying process wasn’t accurate, the mapping process will not have a solid foundation in the raw data to deliver accurate maps, so they are inherently tied to each other.
Trimble
Surveyors today have many tools in their toolbox, giving them flexibility across surveying and mapping applications. There are many highly accurate, easy-to-operate data capture systems to choose from these days, but challenges grow when combining and analyzing vast amounts of data from different sensors in the office to provide final deliverables. This has made field-to-finish software that delivers technological integration, workflow optimization and adaptability essential for the job.
Mapping projects often require less accuracy, but a lot of advanced survey technology is entering the mapping domain (e.g., mobile mapping and laser scanning) because of easier field operations and increasing understanding of the value of rich data to asset management.
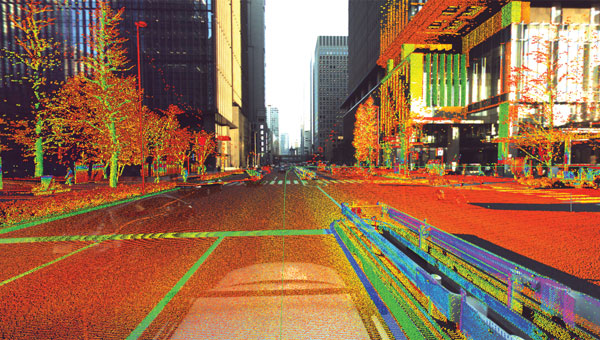
The data were collected in and around a car park to prove how Lidar Inertial Odometry (LIO) can be used to retain accuracy for longer periods without GNSS updates. (Photo: OxTS)
What is your company’s niche in surveying/mapping?
CHC Navigation
CHC Navigation (CHCNAV) has been at the forefront of positioning and navigation for more than two decades, continually adapting to meet the diverse needs of the surveying and mapping industry. Our innovative solutions often lead the industry in providing end-to-end, integrated technology fusion — GNSS, inertial measurement unit (IMU) and imaging lidar — as a standard that empowers geospatial professionals worldwide. CHCNAV strives to provide accessible, value-added solutions from the start, positioning itself as a key technology enabler for the geospatial community.
Hexagon
Whether you are mapping an entire city or surveying a site for construction, capturing reliable and precise geospatial data is essential. Hexagon’s niche lies in its commitment to innovation, its extensive portfolio and the convergence of superior hardware, intelligent software solutions and expert services — enabling precise, efficient and scalable surveying and mapping for diverse needs. Our multitude of solutions, whether handheld, tripod-mounted, flying, or vehicle-mounted, are designed to collect data efficiently and safely from complex or dangerous environments — enabling the greatest accuracy and high-value deliverables.
Furthermore, Hexagon is uniquely positioned with its robust suite of software solutions that work seamlessly with our hardware, such as Reality Cloud Studio, Leica Cyclone, Leica Captivate or Leica Infinity for collecting, processing, modeling, analyzing, and presenting data. We offer end-to-end solutions that not only provide high accuracy but also ensure productivity and ease of use.
OxTS
OxTS offers localization and georeferencing technology that can help accelerate the collection of high accuracy survey data, allowing more work to be completed in a given time frame without compromising on accuracy.
Trimble
Trimble is known for offering a wide range of highly accurate and reliable data capture sensors but our “niche” — our truly unique offering — is our ability to offer comprehensive solutions that make our customers more productive and their projects more streamlined. We do this through hardware and software solutions that enable highly efficient survey and mapping workflows that connect field and office operations. Our software helps transform the captured data into true information utilizing an increasing number of AI-powered tools while our cloud services allow customers to share the data with a variety of stakeholders, unlocking the transformational power of geospatial data.
What is your latest surveying/mapping product? What are its key specs, markets and applications?
Hexagon
Among our surveying and mapping solutions, the Leica BLK ARC stands out with its flexibility to integrate with various robotic and mobile carriers. The BLK ARC provides autonomous laser scanning with static and dynamic scans, creating 3D digital twins and ensuring operator safety. Similarly, the Leica BLK2GO introduces an agile, handheld mobile scanning solution, capturing point clouds and images, with a user-friendly design. Both solutions are great allies for professionals requiring accurate, efficient, and versatile mobile scanning solutions.
For those looking to offer wide-scale data-capturing capabilities and overcome capacity constraints, the Leica Pegasus TRK mobile mapping system stands out because it can gather extensive data quickly and accurately. Its high-resolution data capture, advanced lidar technology, and enriched 3D point cloud capabilities ensure detailed and comprehensive datasets. Building on this range of solutions, the autonomous flying laser scanner Leica BLK2FLY enhances surveying efficiency by capturing hard-to-reach areas and environments. Its user-friendly operations, advanced obstacle avoidance and seamless cloud-based data integration make it a valuable tool for enhanced productivity and safety in surveying work.
CHC Navigation
Our latest offering, the RS10, demonstrates the integration of surveying and mapping technologies by combining GNSS RTK, laser scanning and visual SLAM into a unified platform. The RS10 enhances traditional GNSS capabilities with V-lidar and SFix technologies. V-lidar enables non-contact offset measurements up to 15 m, ideal for rover applications. Meanwhile, SFix technology leverages laser and visual SLAM data to deliver 5 cm accuracy within one minute in environments with weak or absent GNSS signals. This breakthrough enables accurate GNSS measurements in challenging environments such as indoor spaces and urban canyons, bringing simplified workflows and increased productivity to professional surveying and mapping.
OxTS
OxTS recently released Lidar Inertial Odometry (LIO), which offers improved localization in GNSS-obstructed environments while maintaining a fully global frame output. It means that survey data can retain accuracy for longer in harsher GNSS environments but doesn’t give up the global reference to coordinate frames used by surveyors and does not require ground control points to be anchored to those coordinate frames.
Trimble
The newly released Trimble Business Center (TBC) v2024.00 delivers on its commitment to innovation by offering technological integration and workflow optimization, as well as adaptability and innovation for the ultimate field-to-finish workflow. A key highlight in the new release is the seamless integration of survey data delivery for pavement inspection within AgileAssets, which bridges the gap between Esri and Autodesk through feature services for more efficient pavement management.
In addition, AI technologies provide enhanced point cloud classification and new feature extraction routines for game-changing analysis of aerial, terrestrial, mobile mapping and tunneling data. Collaboration also is greatly enhanced through Trimble Connect for seamless data integration across TBC and Trimble Access field software.
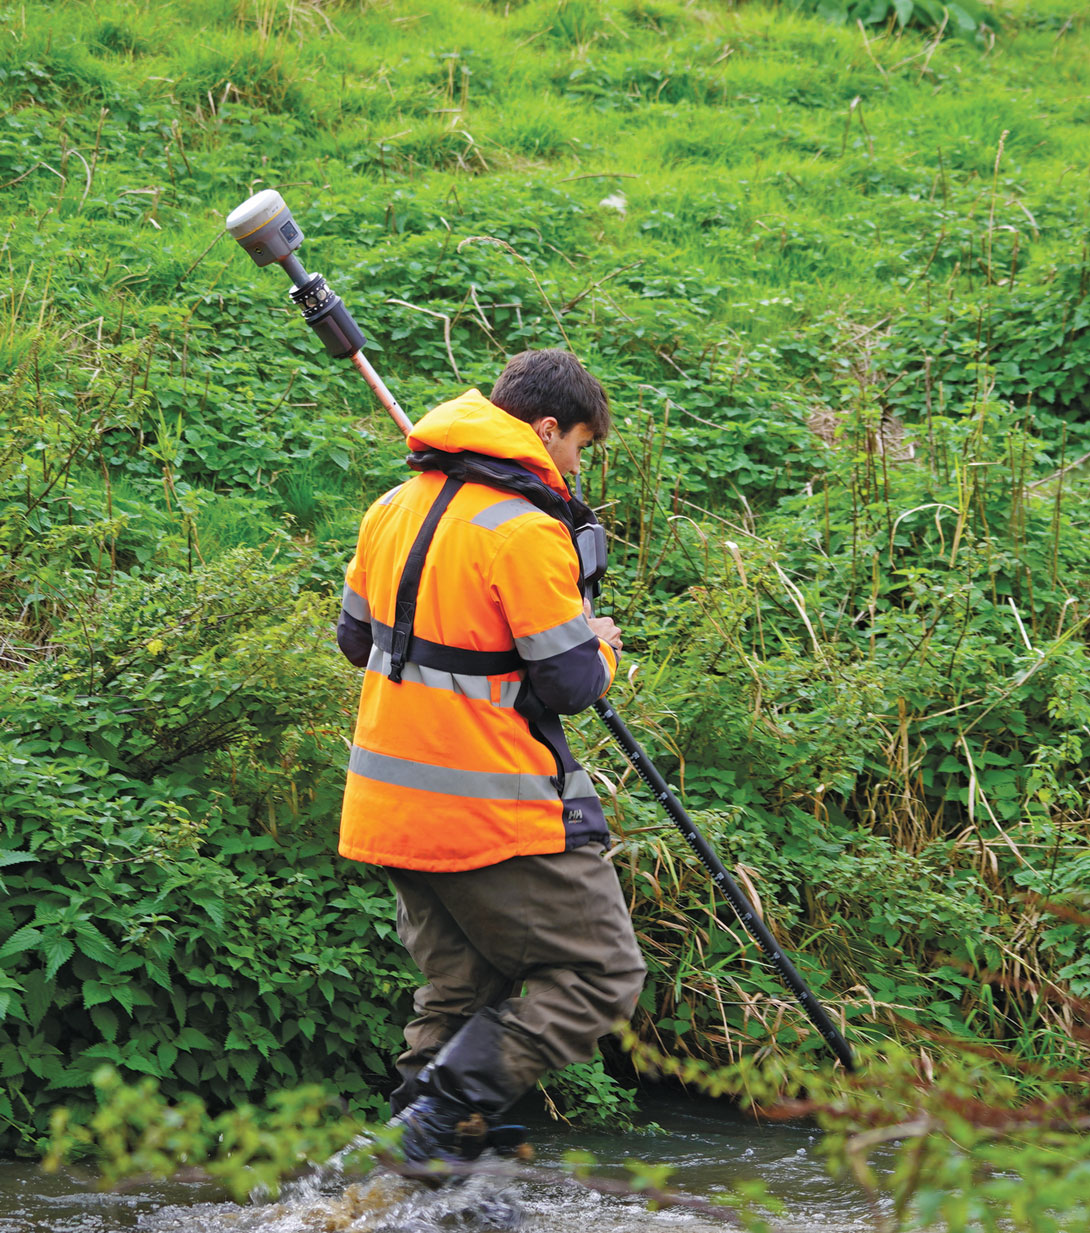
Josh Humphriss, surveyor at Storm Geomatics Limited, surveys a stream with a Trimble GNSS system in Shipston-on-Stour, Warwickshire, England in 2022. (Photo: Michael Dix, Marketing Communications Manager, Trimble, Inc.)
Point cloud and 360-degree image collected with the Leica Pegasus: Two Ultimate. (Photo: Leica Geosystems )
The latest mobile mapping innovations are transforming how we manage, design and monitor our critical infrastructure — in particular, reshaping road maintenance. Through the advance of mobile mapping and reality capture imagery, our ability to map, proactively survey and even design roads, from simulating the vibration of a vehicle on a road to mapping out city routes, is drastically improving through the symbiosis of the digital and physical worlds.
Leveraging data: Traditional vs autonomous mapping
Traditional methods for assessing damage to road surfaces are highly manual, field-based, labor-intensive and time-consuming. Visual inspection, for example, comes with resourcing challenges, data exhaustivity and inaccurate assessments, making quality assessment and control a challenge. There is limited accurate analysis of how the road changes over time, and the work involves significant safety issues, with surveyors required to work in the field near live traffic and often requiring the traffic to be interrupted to allow measurements to be taken.
By contrast, automated laser scanning solutions provide spatial geometry for precise measurements that imagery-only methods cannot capture when assessing damage to road surfaces. They overcome any inaccuracies or lack of detail regarding location and circumstances. This technology also allows professionals to study the surrounding context of the road and measure the depth of a hole or the size of a crack with spatial data, which visual methods cannot capture. Hexagon’s mobile mapping systems, used for virtual road management and maintenance, enable access to a completely virtual environment to unlock the insights this data provides, transforming how we manage our infrastructures. With spatial data collected over time, asset degradation and other factors foundational to maintaining road infrastructure can be predicted by the more effective leveraging of data.
With geospatial data allowing the accurate mapping of potholes, rutting and depressions alongside accurate location mapping using GIS, asset managers can map the data onto real-world imagery to create an interactive, 3D model integrating the physical world and geospatial data. Combined, this unlocks insights and overhauls efficiency for asset managers performing road maintenance, allowing them to prioritize and make decisions based on data live in the field.
Veris deploys Hexagon’s solutions for road mapping
Recently, Hexagon’s technology was used by Veris, a provider of spatial data services to deliver end-to-end solutions for road management and maintenance in Australia. It combined a Leica Geosystems mobile mapping system, the Leica Pegasus:Two Ultimate, with Hexagon M.App Enterprise to create a high-quality, configurable solution and designed its own bespoke software platform RoadSiDe.
Veris used the mobile mapping system on the Hume and Melba Highways to identify and assess road defects and ground penetrating radar (GPR) to rapidly perform data capture of the road corridor. Then, RoadSiDe analytics and machine learning enabled the delivery of the data and insights using M.App Enterprise and Luciad Fusion, integrating 3D visualizations and 2D dashboards to identify, assess and quantify the road condition as part of the only full 3D road condition and corridor platform. The in-house solution for scripts and automation Veris developed made it simple for their clients to visualize and interact with the data, providing analytics and value-added services on demand that offered valuable insights for its clients.
As part of the surface defects workflow they use for analysis, Veris takes the raw point cloud data and compares it with the ideal road exterior to create a surface difference model, followed by contours and improved defect definition. This cross-comparison and integration allows them to use and visualize the data they acquired by precisely measuring the gaps and holes. Veris efficiently captured road cracking in detail with its additional 12MP/20MP camera system. These are then mapped into the RoadSiDe dashboard, and cracking width and length are captured within the geodatabase. Machine learning is used to detect cracks in the road surface before pixels are classified into clusters and projected onto the original images for verification and quality assurance. This can then be integrated with location coordinates, allowing clients to see precisely where each cracking is located. With this georeferenced data digitized and visualized, Veris can leverage as much of its data as possible into the most effective platform for its users.
Expanding the scope of mobile mapping
The data captured by mobile mapping solutions is just as helpful in designing roads as in maintaining them and can be incorporated into the construction of future roads and city planning. The data even can be used to simulate, for example, the movement of a heavy truck through city streets to examine whether it will impact potholes or damage any road signs, allowing asset managers to predict and prevent damage and maintain road infrastructure for years to come.
Photo: richard johnson / iStock / Getty Images Plus / Getty Images
GNSS technology has become integral to construction work. In particular, firms rely on GNSS signals in four critical areas.
Site surveys
Surveying always has been a foundational aspect of construction planning. Mapping and staking the construction site is essential in preparing to break ground and build on site. Surveyors begin the task of bringing engineering plans from vision to reality.
This work may take place from the air and on the ground, and it now typically involves a vast array of tools to ensure accuracy, including drones, cameras, lasers, sensors, and GNSS signals. The data from GNSS are critical in helping surveyors and engineers create “digital twins” — virtual representations of the physical site they can update in real time to ensure the site matches the plan.
Robotics
Robotics have further transformed the work of construction, both in terms of site surveying and the work of building. Rovers, drones and construction robots can execute various tasks to improve project efficiency and save money.
Once again, GNSS signals play a critical role in ensuring robots carry out their tasks effectively and accurately. Land surveying rovers, for instance, rely on real-time satellite data to navigate construction sites and mark spots for construction with pinpoint precision.
Damage prevention
Construction work is highly invasive, penetrating the ground where hidden power, gas and water lines lie. Misfires during this process can have substantial cost implications or even be life-threatening for construction crews.
Construction firms can use GNSS receivers and other complex instruments to prepare for excavation. These tools provide detailed location information for underground pipes and wires and ensure contractors don’t damage critical underground infrastructure and cause costly delays or dangerous work conditions.
Engineers also can use GNSS data to pinpoint where future utility lines will be, ensuring construction does not get in the way of laying pipelines to bring the constructed building online.
Site inspections
GNSS data continue to play a critical role while construction work unfolds. As builders lay foundations, frame buildings and add finishes, engineers and inspectors can collect site reports and use satellite data to update digital twins and verify the work is on track.
With updated and accurate digital twins, planners have a real-time view of the work in progress, which they can use to inform plans, budgets and timelines as the project unfolds.
VectorNav Technologies has participated in the U.S. Air Force (USAF) NAVFEST 2024 Test Event held May 6-17, 2024. The event was hosted by the 746th Test Squadron at Holloman Air Force Base, New Mexico, at White Sands Missile Range (WSMR).
NAVFEST provides the U.S. Department of Defense (DOD) and industry partners the opportunity to test and evaluate products and solutions in real-world GNSS-contested conditions to enhance systems’ robustness and resilience in these environments.
VectorNav’s evaluated its solutions in GNSS-contested scenarios to continue advancing its capabilities for robust position, navigation and timing (PNT). The VectorNav team tested a variety of systems on both aerial and ground-based platforms and conducted both static and dynamic maneuvers.
During the event, VectorNav evaluated a variety of its single and dual-antenna GNSS-aided inertial navigation systems (INS) products, including the VN-210, VN-310, VN-210-S, VN-200, VN-300, VN-210E and VN-310E in various configurations. Additionally, these products were tested in combination with a variety of additional PNT systems, including external tactical and navigation grade IMUs, M-Code GPS receivers, anti-jam antennas, commercial L1/L2/L5 GNSS receivers in varied configurations and low-Earth orbit (LEO) satellite receivers.
The data collected from the event are being analyzed to further refine and improve the company’s solutions in GNSS-contested environments.
Mosaic has introduced the Meridian mobile mapping system designed to enhance geospatial and surveying technologies. The system integrates the Mosaic X camera with Inertial Labs INS/lidar to improve mapping accuracy.
The Meridian system offers a 74MP native resolution and 13.5K resolution panoramas using precisely synchronized camera modules. The design minimizes image overlap to offer clearer and more consistent panoramas. The integrated INS system has a vertical accuracy of 2 to 3 cm and a precision of 2 to 4 cm.
It offers seamless, out-of-the-box operations with fully integrated and calibrated components. The Meridian system is designed for ease of use and requires only minutes of training. In addition, it features a rugged design to ensure performance in challenging environments.
Safran Federal Systems has launched the BroadSim Duo, its dual-frequency GNSS simulator designed specifically for testing military receivers in an unclassified environment.
The new product integrates dual-frequency capabilities within a single compact GPS military signal testing unit. The simulator has dual-frequency capability, which is essential for testing P-Code and AES-M-Code. It features a new software-defined radio in an M.2 form factor, offering robust and reliable performance. It also seamlessly integrates with the Skydel simulation environment for improved versatility and functionality.
ANELLO Photonics and Key Dollar Cab, an OEM and technology integrator, have formed a strategic collaboration to bring ANELLO’s optical gyroscope technology to agriculture applications. The collaboration focuses on enhancing positioning accuracy in orchards and other high-value crop environments with limited GPS availability.
The partnership aims to address the growing demand for more robust and accurate positioning systems in orchards where precise navigation is crucial for optimizing operations and maximizing yield.
Optical gyroscope technology offers several advantages compared to traditional positioning systems, including improved accuracy, reliability and robustness in challenging agriculture environments. The optical gyroscope technology and positioning solutions integrated with Key Dollar Cab’s agricultural machinery and equipment is designed to offer farmers improved precision and efficiency in various orchard management tasks, including planting, spraying, fertilizing and harvesting.
My past GPS World newsletters (February 2024, March 2024, April 2024 and May 2024) highlighted the NGS Geospatial Modeling grantees which included creating a CORS Dashboard that will be very useful to NGS employees monitoring the CORSs and evaluating the Intra-Frame Deformation Model (IFDM).
I mentioned in the May 2024 newsletter that NGS announced the release of a beta version of a new NOAA CORS Network (NCN) Station Web Page. Each CORS station in the NCN will have its own page with data, metadata, maps and photos displayed in a modular layout so information is easily found in one location. This newsletter will describe some features of the new beta site.
I will highlight some of the information provided by the routine, but I would encourage others to access the beta site and provide feedback to NGS. NGS states on the site that “This is a Beta product. We are interested in your feedback. Please email us at: [email protected] and indicate the subject as “NCN Station Pages Feedback.”
When you access the website, it defaults to the CORS station GODE. The user has the option to enter their own CORS station in the box located on the right-hand side of the webpage.
Texas CORS Station TXLV.
A nice feature of the site is that the CORS data availability for the last seven days is provided under the Station Information section. For those interested in downloading data, there is a button titled “Quick Data Download,” on the top left corner. The site allows users to download daily data from the past 30, seven or two days.
In my example, I downloaded the last seven days of data for CORS TXLV. It only took a few seconds to download and provide the data in a zipped file. If a user includes this process in their standard operating procedure, they can easily download all the CORS data required for their project.
Downloading TXLV GNSS data.
Another planning tool available is the weather information for a week. Today, most users can get the weather information on their phone. However, this is a convenient option to have when you are looking at available CORS on the day of occupying marks. It can help in managing schedule changes.
There is an option to show the five nearest CORS relative to your selected CORS by clicking on the button titled “Show Closest 5 on Map.”
CORS Located near TXLV.
Clicking on the button labeled “Show Legend” provides information about the CORS depicted on the map. This is a useful feature especially if selecting CORS that provide GNSS data other than GPS and/or data at different sampling rates.
If a user clicks on the button “Open NGS Map,” the site will access the NGS Map website and provide information about the selected CORS. This allows users to get information about the CORS. I found that the beta site provided most of the same information using the various options on the NGS Map website.
NGS Map depicting CORS TXLV.
The site provides photos and equipment history that may help in troubleshooting an issue associated with processing sessions or during the analysis of the adjustment results. I have highlighted that a new antenna was installed at the TXLV CORS on August 5, 2021. I will explain later in this newsletter how this information helped me during my analysis of a GNSS project.
Photos and equipment history of TXLV.
Under the Coordinates and Velocities section, the site provides information about the latest coordinates and velocities along with superseded values for the selected CORS. The superseded values may not be of interest to most users, but I am always looking at the changes in CORS coordinates. It is my nature to try to understand the reason why something has changed; especially for CORS that I am including in a GNSS project.
Coordinates and velocities.
Clicking on the link titled “Position and Velocity” under the Coordinates and Velocities section provides the coordinate and velocity information for your selected CORS. I have highlighted the ITRF2014 velocities, the NAD 83 (2011) velocities, the latest antenna type, installation date and the dates the positions and velocities were revised.
As shown in the image above, the position and velocity sheet provide the dates that the position was revised. Clicking on the link titled “Datasheet with GRP/MON included (if available)” in the Coordinates and Velocities section provides the datasheet that lists the NAD 83 (2011) superseded survey control values. The superseded ellipsoid heights from the datasheet are provided in the box titled “Excerpt from TXLV Datasheet.”
When you are trying to estimate heights to the 2 cm level, changes in published NAD 83 (2011) CORS heights at the 2 cm level are significant and should be investigated and understood. This beta CORS website offers useful information that can help understand some of these changes. I will explain later in the newsletter how this information and other data from the beta site helped me in the analysis of my GNSS project.
Excerpt from TXLV data sheet.
The beta site provides plots that depict the daily positions and residuals for a CORS. In my May 2024 newsletter, I stated that NGS has developed a Beta CORS Time Series Tool that provides information that assists users in selecting appropriate CORS for a project. The Beta CORS Time Series Tool provides the residual differences from the daily NGS OPUS-NET solutions with the coordinates from the official CORS’ coordinate functions. The excerpt below explains the plots and residuals:
This tool computes and displays the residuals for up to 50 CORS stations within the NCN. The mean, standard deviation, and root-mean-square error of the residuals are also provided in a summary table that is available for download. This tool is informational, not authoritative.
The residuals are calculated as the difference between the daily observation at a station and the official daily coordinates for a station. The daily observation is processed from the GPS L1 and L2 signals only, using a network adjustment program. There must be a minimum of 8 hours of data present in a 24 hour file for a solution to be generated. The network adjustment program is an internal application developed by NGS for monitoring the position of the CORS stations in the NCN (Gillins et al., 2019). The official daily coordinates for a station are calculated using the reference epoch (2010.0) position and velocity published as the station coordinate function in the Position and Velocity File. An example of a Position and Velocity File for NCN station GODE can be found here. To obtain Position and Velocity Files for NCN stations please visit the NCN Station Pages and navigate to the Coordinates and Velocities section.
This tool is optimized for plotting data extending between 30 to 90 days in length but can be customized to other time frames. The earliest start date currently available is October 27, 2018, which is the completion date of the MYCS2 and the end date can be as recent as 3 days before the present day. This three-day time lag is so that the final orbits can be used in the network adjustment to create the daily solutions. Then, please enter the 4-character station ID for at least one and up to 50 CORS stations in the NCN and submit this request to obtain a map, summary table of comparative statistics, and residual plots during the date range.
The beta NGS NCN station pages show similar plots to the Beta CORS Time Series Tool. the station pages also allow users to create position and residual plots at different periods. I find these plots very useful when selecting CORS to be included in a GNSS project. The latest plots are of interest to users when selecting CORS to be included in their GNSS project but there are reasons to look at plots depicting older time periods.
Position and residual plots for TXLV.
I previously mentioned that the antenna of CORS TXLV was changed on August 5, 2021, so I used the option to plot the last five years to include data before and after the date the antenna was changed. I highlighted August 7, 2021, on both plots. This was two days after the antenna was changed on CORS TXLV.
There appears to be a 2 cm upward shift in the up component after the new antenna was installed. There was also a change of about 1 cm in the north component. Something else to notice in the position plot is that the east component has a significant tilt during the five years. The below provides the ITRF2014 velocities — the eastward component velocity is —1.21 cm/year. In 5 years, one could expect to see about a 6 cm change.
Position and residual plots for TXLV.Five-year position plot of TXLV.Five-year residual plot of TXLV.Position plot of TXLV for selected time interval.
These small changes affected my analysis and network adjustment results. During the past several years, I have participated in several Harris-Galveston Subsidence District (HGSD) GNSS projects performed in the Houston-Galveston, Texas, region. I have been involved with estimating subsidence in the Houston-Galveston, Texas, region for about 40 years so when I see changes in height values indicating an apparent uplift it makes me question my results. Therefore, I started investigating the CORS involved in the GNSS project. I looked at the Texas CORS surrounding the GNSS project: WHARTON CORS, COLUMBUS CORS, HEMPSTEAD CORS, LIVINGSTON CORS, and LIBERTY CORS.
The table below provides the differences between the published ellipsoid height and the previous superseded height for the five CORS. As the table indicates, the published ellipsoid height of the CORS increased by about 2 cm from the superseded height. This led me to use the NGS NCN Station Pages to investigate these CORSs. I found that all five of these CORSs had new antennas installed in 2021 and their position plots depicted a similar shift.
I want to emphasis that I am not saying that anyone did anything wrong or incorrect. The CORS manager of these sites provided the appropriate metadata to the NGS CORS team so the site information could be updated and correctly reported. What this indicates to me is that the installation of the new antenna and setup may have affected the height component of these CORS, that is, it may have changed the official position of the monument’s reference point. Again, I want to emphasize that I am not saying that anyone did anything wrong or incorrect. NGS’s process includes monitoring all CORS that are part of the NOAA CORS Network (NCN). The NGS CORS Team noticed the significant change in the up component comparing it to its expected value, so they computed a new coordinate and published the new coordinate in 2022. In my opinion, anyone using these CORSs as constraints in their GNSS projects after the date that the new antenna was installed and before the new coordinate was published could have generated adjusted heights that are in error by 2 cm. As previously stated, when you are estimating heights to the 2 cm level, changes in published NAD 83 (2011) CORS heights at the 2 cm level are significant. In my opinion, this type of analysis should be performed by all users that are incorporating CORS in their GNSS processing.
CORS ID
PID
Station Name
Published Ellipsoid Height (m)
Published Date
Date the New Antenna was Installed
Date Station Coordinates Superseded
Superseded Ellipsoid height (m)
Difference Between Published and Superseded Heights (cm)
txwh
DL9086
WHARTON
8.615
04/22
4/28/2021
06/19
8.595
2.0
txcm
DL9812
COLUMBUS
45.481
04/22
3/17/2021
06/19
45.459
2.2
txhe
DH3608
HEMPSTEAD
48.823
04/22
5/06/2021
06/19
48.803
2.0
txlv
DN4508
LIVINGSTON
29.100
04/22
8/05/2021
06/19
29.075
2.5
txli
DH3612
LIBERTY
-9.782
02/22
5/06/2021
06/19
-9.802
2.0
Keep checking NGS beta site because NGS makes changes based on user feedback. As I previously stated, I would encourage everyone to access the beta site and provide your feedback to NGS. NGS states on the site that “This is a Beta product. We are interested in your feedback. Please email us at: [email protected] and indicate the subject as “NCN Station Pages Feedback.” I have talked to the CORS team and they really would like feedback. The team will make changes to the website based on feedback from users.
RapidFlight has been awarded a $10 million contract from the United States Department of the Air Force (DAF) under the AFWERX Autonomy Prime program. Under the contract, RapidFlight will develop and produce the SPX, a customizable, autonomous fixed-wing aircraft system.
The project objective is to design and produce the SPX UAV, featuring a 12 lb. payload capacity, 150 nm range, and a modular payload bay. The RapidFlight Common Avionics 2.0 will be used to support autonomous flight with various payloads.
During the initial phase of the 36-month contract, RapidFlight will design SPX UAVs for testing at the Autonomy Prime Proving Ground. This will be followed by a contractor-owned, contractor-operated (COCO) demonstration at the RapidFlight facility in Manassas, Virginia. Comprehensive training for USAF operators is also included.
Each SPX system includes four airframes, a ground control station, a field kit and a compact launcher. The system’s modular design supports a range of payloads, sensors and autonomy packages for rapid and economical real-world flight testing.