“Seen & Heard” is a monthly feature of GPS World magazine, traveling the world to capture interesting and unusual news stories involving the GNSS/PNT industry.
Photo: NOAA Ocean Exploration
Exploring the Largest Deep-Sea Coral Reef
Scientists have mapped the largest deep-sea coral reef, stretching hundreds of miles off the U.S. Atlantic Coast. While researchers have known since the 1960s that some corals were present off the Atlantic Coast, the reef’s size remained a mystery until new underwater mapping technology made it possible to construct 3D images of the ocean floor. The National Oceanic and Atmospheric Administration (NOAA) and a team of scientists recently published maps of the reef in the journal Geomatics. The reef extends for about 310 miles from Florida to South Carolina. The total area is nearly three times the size of Yellowstone National Park.
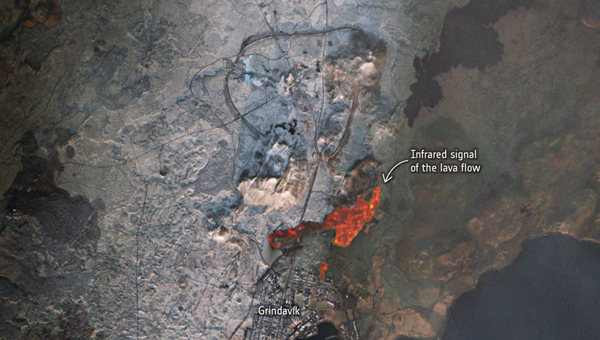
Photo: ESA
Lava in Iceland
Grindavík, a tiny town in Iceland, stands on the brink of volcanic lava flow in images captured by the European Space Agency (ESA). The lava originates beneath the Svartsengi volcano system — roughly 2.5 miles north of the town — which erupted on December 18 and January 14. ESA’s Sentinel2 satellite revealed the glow of the lava flow’s heat, not far from houses and other infrastructure within Grindavík. The town, with just 3,800 residents, has faced constant evacuations, as well as mini-earthquakes as a result, The Guardian reported.
Photo: Maris Maskalans / iStock / Getty Images Plus / Getty Images
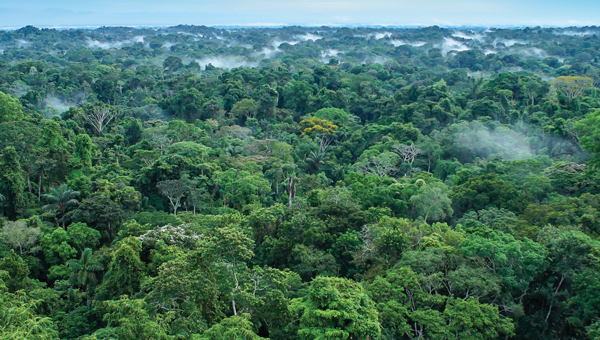
Lidar Reveals Lost Cities in the Amazon
In the Amazon rainforest, archeologists have discovered a vast and highly complex system of ancient cities dating back nearly 3,000 years. Located in Ecuador’s Upano Valley, the structures lie in the eastern foothills of the Andes mountains, according to a study published in the journal Science. After more than 20 years of research, the ancient urban centers were only discovered when the Ecuadorean government employed lidar technology. Researchers from France, Germany, Ecuador and Puerto Rico conducted a lidar survey that covered roughly 300 km2, which revealed a landscape full of organized human activities, including more than 6,000 rectangular earthen platforms, as well as agricultural terraces and drainage systems. According to the study, these structures formed at least 15 distinct settlements, which were connected by a system of wide, straight roads.
Australian scientists are attempting to track 1,000 cattle and buffalo using artificial intelligence (AI), and GPS satellites, reported euronews.next. An estimated 22,000 cattle and buffalo roam free in a remote area of Arnhem Land, Australia, though the exact number is unknown. Scientists are now collaborating with stockmen and indigenous rangers in a four-year program that involves monitoring feral animals from space. Titled SpaceCows, the remote herd management system is backed by the Australian government’s Smart Farming Partnership initiative. Local rangers and stockmen are chasing and catching animals to attach solar-powered tags with GPS receivers.
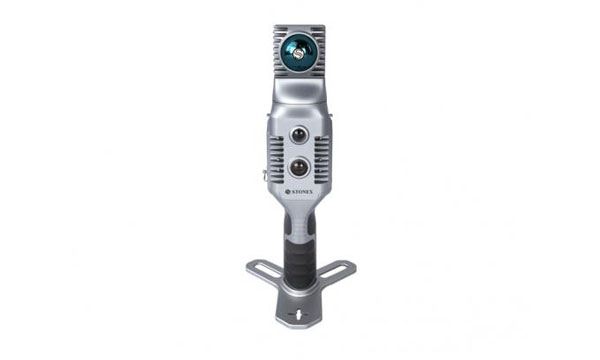
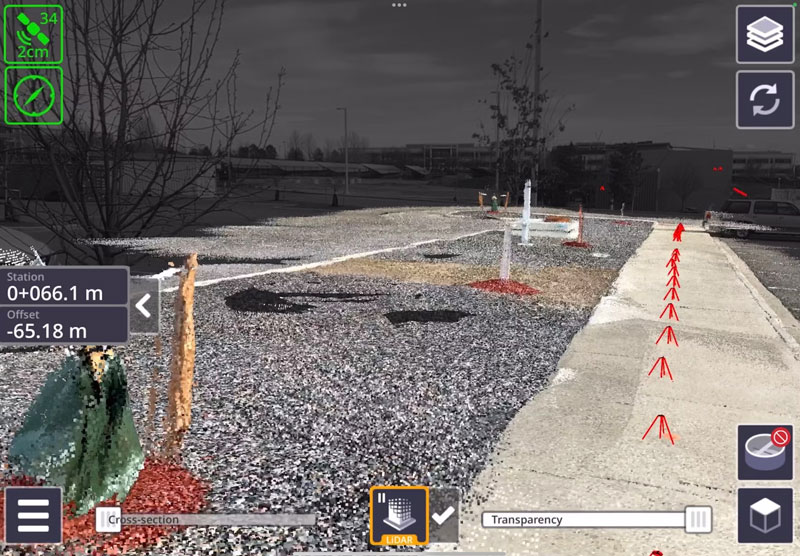
Stonex has launched the X70GO SLAM laser scanner designed for fast and efficient large-area surveys. It combines mobile scanning with a stationary mode to scan with high resolution to enhance overall surveying capabilities.
X70GO is a real-time 3D model reconstruction device that integrates an inertial navigation module, high-performance computer and storage system. It is equipped with a 360° rotating head, which, combined with the SLAM algorithm, can generate high-precision point cloud data. The built-in 512GB memory disk stores survey results and the dismountable handle has a 1.5-hour battery life.
A 12MP RGB camera offers texture information, while a visual camera aims to enhance the real-time preview with the GOapp. Mapping results can be generated immediately inside the scanner. Users can then color the points and improve their accuracy during post-processing with GOpost software.
The system comes with a hybrid scanning capability. The X-Whizz mode combines the advantages of SLAM mode with the resolution of a static scan, which eliminates the need for multiple scan stations. Users can move around the scene to collect the entire 3D point cloud without time-consuming cloud-to-cloud alignment.
The technology incorporated in the new scanner is designed to provide extended range, a higher number of points per second and advanced onboard processing algorithms. The SLAM laser scanner is well-suited for challenging and demanding environments and can be used in a variety of applications, including BIM, industrial sites, real estate, heritage preservation, tunnels and mining.
Users can add an RTK module to set a point cloud in a global coordinate system. This can support the addition of GNSS information to lidar and inertial measurement unit (IMU) in the SLAM algorithm. In situations with limited GPS connectivity – such as indoors or in challenging environments – the system will rely on lidar and the IMU for positioning purposes.
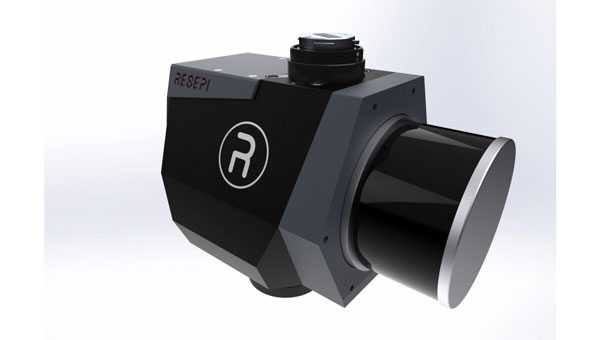
Inertial Labs has launched the RESEPI lidar Gen-II remote sensing payload instrument. It comes in three modes to cater to users’ individual operational needs: aerial mode for comprehensive airborne data collection, mobile mode for dynamic vehicular data collection and a versatile handheld/backpack that aims to provide portability and ease of use for ground personnel.
The RESEPI lidar Gen-II has a 175% increase in computing power, designed to speed up processing and enhance efficiency during complex tasks. Its memory capacity has been increased by 700%, which allows for extensive data handling and improved system performance. The system’s 50% increase in storage capacity aims to facilitate longer durations of data collection without frequent offloads.
The Gen-II features seamless integration capabilities with UAVs and other platforms. The system’s sensor-agnostic design allows for external sensors to be easily integrated, including lidar and cameras. It can also compute point clouds, trajectories and solutions in real time, which is critical in time-sensitive missions. The system can be used in a variety of applications including mapping, inspection, autonomous, navigation and robotics.
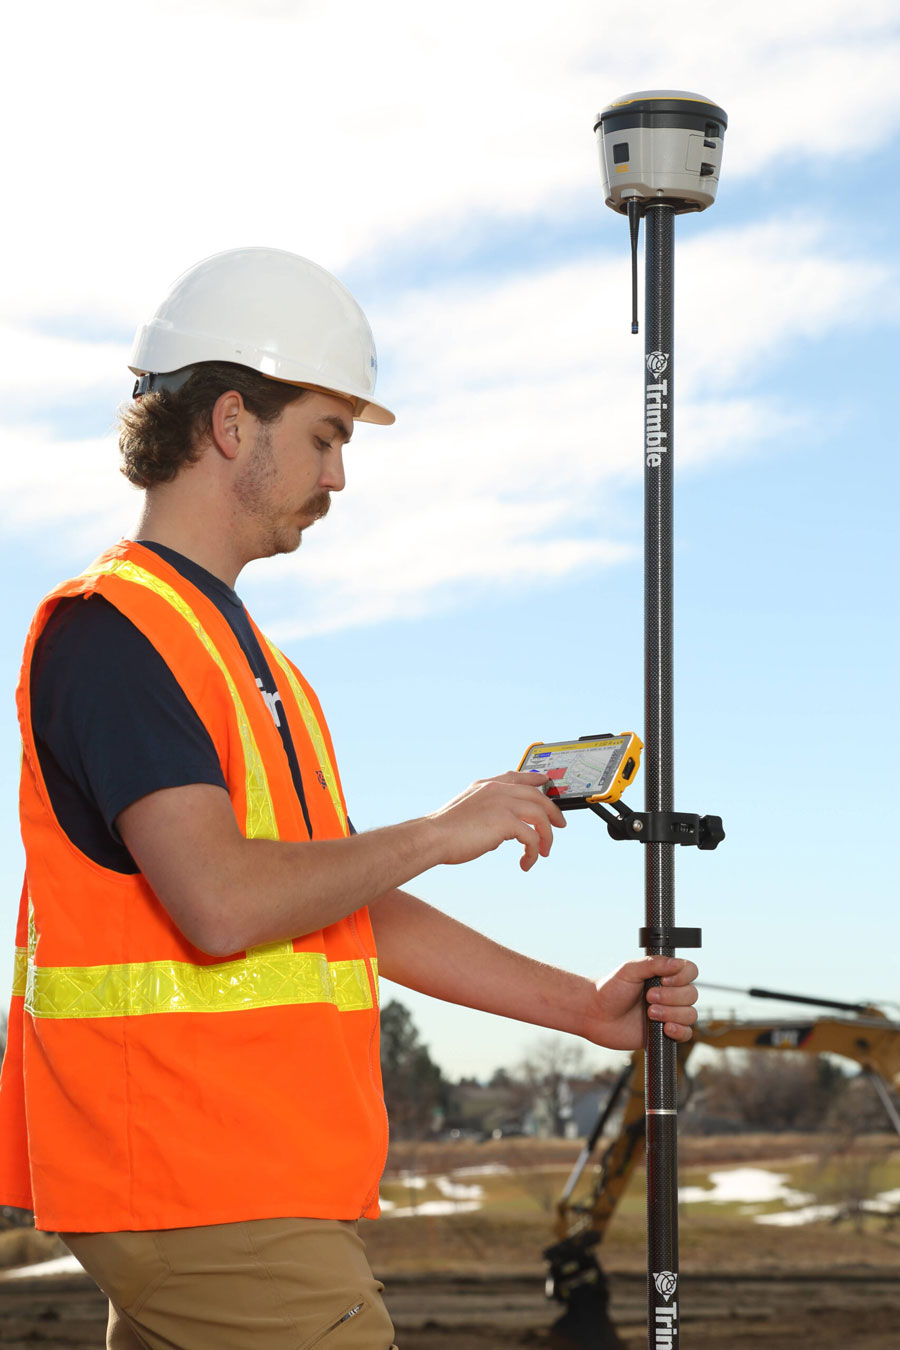
Trimble has released three new surveying and mapping products: SiteVision 5.0, TDC6 and Trimble Radio. All three products are available through Trimble Geospatial authorized distributors.
SiteVision Software 5.0. (Image: Trimble)
SiteVision Software 5.0 is a high-accuracy outdoor augmented reality system, now with a 3D scan tool. The new 3D scan tool allows users to use lidar sensors available on some Apple Pro devices. The Trimble DA2 GNSS receiver is designed to capture point clouds efficiently and accurately with a single handheld solution.
Users can visualize 3D scan data directly in the field with SiteVision’s augmented reality view. The software allows users to create as-builts of the job site on the go, measure and plan resource allocation, reduce scan times, supplement UAV data and more by combining scanning and precision in a mobile solution. The product aims to facilitate practical and accessible field-to-office workflows for surveyors, contractors and engineers.
TDC6. (Image: Trimble)
TDC6 is a handheld GNSS data collector designed for high-performance construction surveying.
The device allows contractors to work with more complex data sets more effectively in the field, connect to the office for on-the-spot approvals, and quickly communicate changes to field crews.
The small, rugged device offers integrated Wi-Fi and Bluetooth, built-in cameras and 5G compatibility in a lightweight, shock-, dust- and water-resistant package. The device integrates seamlessly with Trimble data collection applications, including Trimble TerraFlex GIS software and Trimble Access survey field software, as well as third-party apps such as Esri ArcGIS Field Maps.
TDL450B radio. (Image: Trimble)
The TDL450B radio is a 450 MHz external radio with Bluetooth for transmitting, receiving and repeating GNSS corrections. It offers flexible configuration options and rugged reliability for efficient use of GNSS in various applications. Designed to support Trimble and third-party RTK base stations, this sophisticated radio modem puts Trimble’s newest data link technology in the hands of users on the job site. The TDL450B radio is an advanced, high-speed, wireless UGH data radio built to endure harsh conditions.
SimActive has released upgraded cloud capabilities for its Correlator3D mapping software. With its distributed processing capabilities, Correlator3D allows users to scale their processing to match individual operational needs.
With the upgrade, Correlator3D can process large mapping projects and deliver results from UAV, aircraft and satellite imagery. It features a software package – a patented, end-to-end photogrammetry solution — designed to generate high-quality geospatial data from a variety of sources, including satellite and aerial imagery and UAVs. The upgrade aims to improve the technology’s performance in diverse cloud scenarios.
Correlator3D is designed to provide aerial triangulation (AT) and generate dense digital surface models (DSM), precise digital terrain models (DTM), point clouds, orthomosaics, 3D models and vectorized 3D features. By using GPU technology and multi-core CPUs, Correlator3D offers enhanced processing speed to support the rapid production of large datasets.
“Seen & Heard” is a monthly feature of GPS World magazine, traveling the world to capture interesting and unusual news stories involving the GNSS/PNT industry.
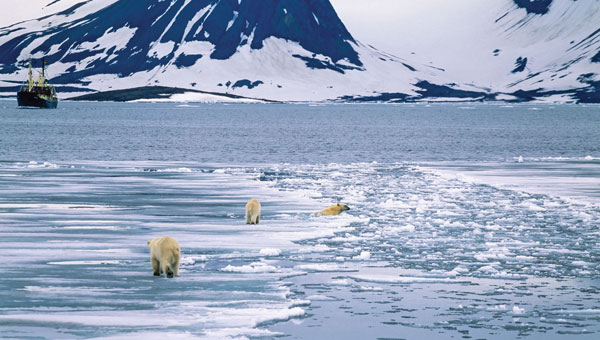
According to the 2023 Arctic Report Card by the National Oceanic and Atmospheric Administration (NOAA), new records have been documented showing that human-induced warming of the atmosphere, ocean and land is creating adverse impacts on people, ecosystems and communities across the Arctic region. The report states the Arctic is experiencing a faster rate of warming than any other part of the world. Overall, it was the Arctic’s sixth-warmest year on record. Sea ice extent continued to decline, with the past 17 Septembers now registering as the lowest on record.
Researchers from Chang’an University in China have developed a new method of tracking landslides. The team combined GNSS precise point positioning (PPP) techniques with a cumulative sum control chart (CUSUM) method. Conducted at the Tengqing landslide in Liupanshui, Guizhou Province, Southwest China, the study aims to enhance the precision in tracking the movements of the landslides and improve the overall reliability of the monitoring results.
Crabs on the move
Image: United States Geological Survey (USGS)
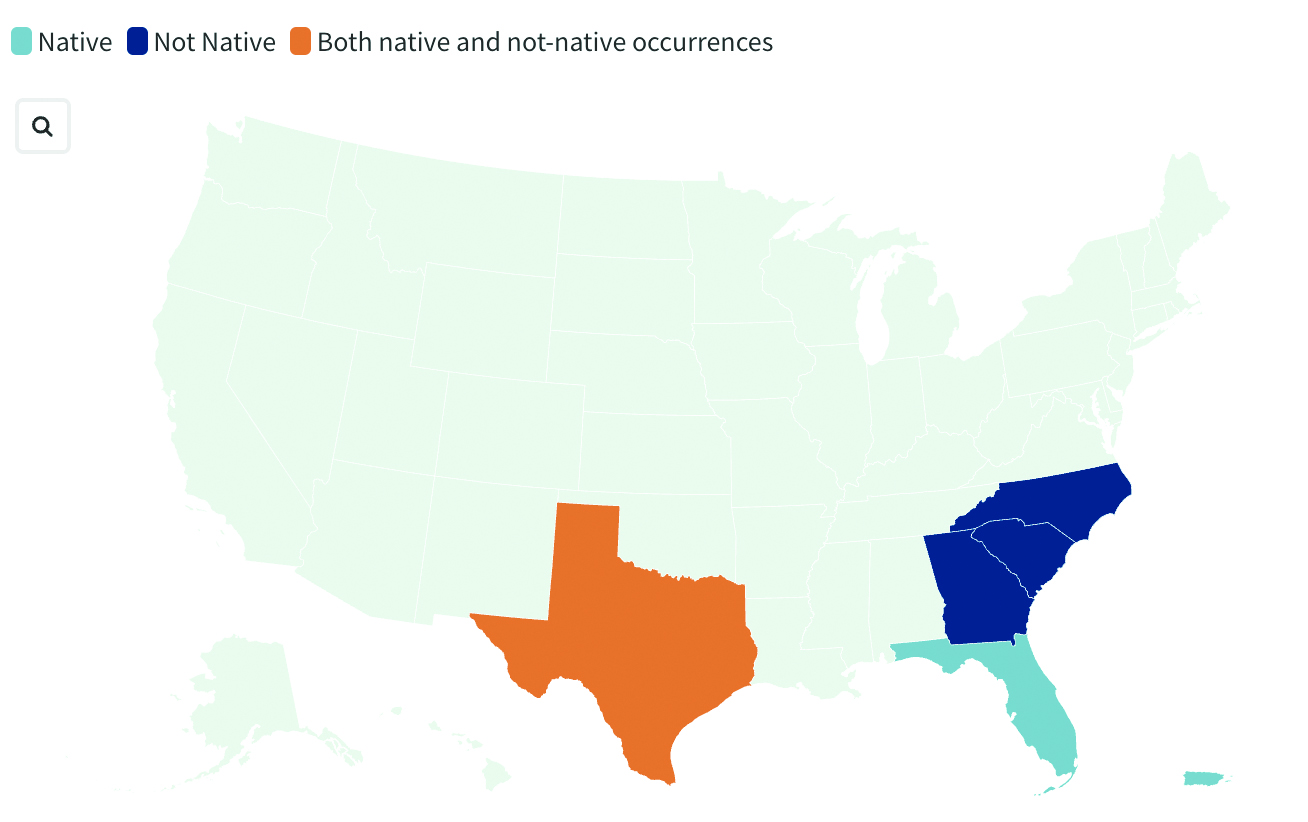
Georgia officials are asking the public for help in spotting non-native blue land crabs as they appear to be moving north in recent years, according to data collected by the United States Geological Survey (USGS). According to USGS, it is unclear whether this movement is driven by humans or by the crabs themselves, or if the crabs are breeding in their non-native homes. Officials worry about the damage caused by the crabs’ burrowing behavior. While scientists learn about how the species interacts with its new environment, several states are asking residents to report sightings.
India’s war on drugs
Image: evandrorigon / E+ / Getty Images
India’s border security force (BSF) has said it is battling an unprecedented UAV “menace” infiltrating the border with Pakistan, fueling the drug crisis in the state of Punjab and raising serious security issues, reported The Guardian. UAVs have dropped weapons such as pistols and Chinese-made assault rifles, as well as consignments of opium and heroin believed to be from Afghanistan.
For centuries before sonar, lidar and unmanned surface vehicles (USVs), sailors would measure depths by throwing a line overboard with a lead weight at the end — called a leadline — and record its length to the seafloor. Mapping large areas of the seafloor, therefore, required thousands of these measurements.
However, even after extensive measurement efforts, the acquired data was often inaccurate or incomplete, which forced navigators and surveyors to estimate the seafloor’s bathymetry until remote sensing was introduced in the 1970s.
Since then, the growing need for increasingly accurate and rapidly available data has led to a worldwide effort to develop sensors and alternative techniques for measuring depths.
In the ongoing Florida Seafloor Mapping Initiative (FSMI), the Florida Department of Environmental Protection tasked Woolpert Geospatial Program with acquiring bathymetric survey data using lidar technologies to produce a comprehensive, publicly available, high-resolution seafloor surface model of Florida’s coastal waters by 2026.
Similar initiatives across the globe have kick-started innovations in underwater data collection and interpretation. In this feature, SBG Systems, CHC Navigation (CHCNAV) and Advanced Navigation describe how they used modern hydrographic surveying to aid defense departments, produce 3D topographic maps, and analyze the depth of The Great Blue Hole in Belize.
Exploring challenging waters
SBG Systems
Advancements in hydrographic surveys can lead to the exploration of depths previously unknown. The Great Blue Hole, located off the coast of Belize, is the largest marine sinkhole in the world, with a diameter of 300 m and a depth of 125 m. This major scuba hotspot is part of the Belize Barrier Reef Reserve System and a UNESCO World Heritage Site.
Aquatica Submarines conducted an expedition survey of the Blue Hole. For two weeks, a team of scientists, explorers, and filmmakers collected survey data and captured photos and videos of this geological wonder. It is the first time in history that an expedition of this scale was attempted at the Blue Hole.
The challenge: Finding submersibles to equip with sonar
The expedition team chose two submarines to carry out the survey: its Stingray 500 and the Roatan Institute of Deepsea Exploration’s IDABEL. Both vessels can carry up to three persons for a maximum of 12 hours.
Norwegian technology group Kongsberg’s dual-axis sonar technology was used to create a 3D representation of the sinkhole. The surface and submarine-mounted sonar equipment were also equipped with SBG Systems’ Ellipse miniature inertial navigation system (INS).
The Ellipse was used to mark the Blue Hole perimeter and scientists then processed the recorded data using MS1000 processing software.
Additional steps and results: Analyzing 3D sonar maps
A key outcome of the expedition is the creation of a complete 3D sonar map of the Blue Hole using point-cloud data collected by Kongsberg’s dual-axis sonar to create a 3D map of the site. The sonar was pole-mounted on the survey vessel with the GPS receiver and motion reference unit directly over the scanner’s head.
Sonar expert Mark Atherton from Kongsberg’s Canadian subsidiary, Kongsberg Mesotech, was a key member of the science-based sonar and data collection team. Atherton operated the sonars aboard the Research Vessel Brooks McCall, contributing to an invaluable high-resolution map of the entire sinkhole.
“By understanding the geological history and geometric structure at the Blue Hole, we can contribute new data to the global scientific community studying sinkholes and cenotes,” Atherton said.
The team was able to conduct more than 20 dives into the large sinkhole, taking videos and 3D images during each trip. They also completed a two-hour live broadcast featured on The Discovery Channel.
“What [the Great Blue Hole] tells us is that sea level rise is not [always] a gradual process,” said Erika Bergman, Aquatica’s chief pilot and oceanographer. “We carefully measured the terraces and layers built up in the hole and we can see that sea level rise can happen dramatically.”
Producing 3D hydrodynamic models
CHC Navigation
Flood control structures — such as dikes, dams, spurs, drainage channels, and floodways — are designed to protect coastal and riverine areas of cities and farms and, above all, the people who live there.
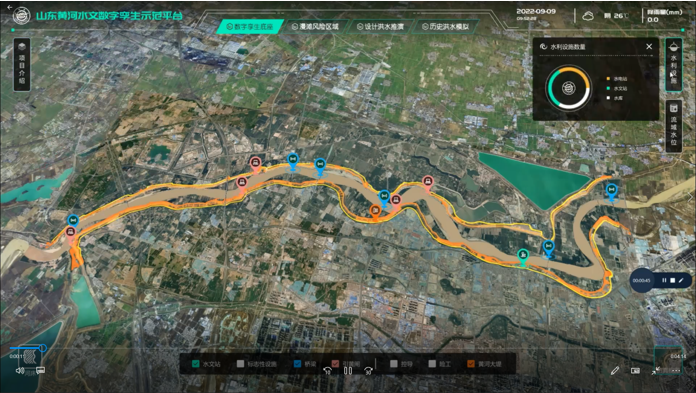
To prevent flooding in low-lying regions and support national ecological protection and development strategies in the Yellow River Basin in China, the Ministry of Water Resources launched the “Digital Twin Yellow River Construction Plan (2022-2025)” project. The Chinese Bureau of Hydrology and Water Resources was tasked with building a digital twin flood model based on part of the country’s Yellow River, targeting the 28-km section of the river basin.
The challenge: Building and designing a digital twin flood model
The first step was to acquire 3D data underwater, on land, and from the air. CHC Navigation (CHCNAV) provided its Apache 6 and Apache 4 USVs to collect underwater data using multi-beam and single-beam echo sounders. The AlphaUni lidar system mounted on the BB4 UAV was used to gather the land data. Finally, the team obtained aerial data using an oblique photographic system from CHCNAV mounted on a UAV.
As a result, researchers obtained large-scale remote sensing images, laser point clouds, terrain data, oblique photography, CAD drawings, and BIM models.
The simulation and analysis of the historical flood events on the third party software; based on the data collected by CHCNAV’s USV and UAV. (Image: CHCNAV)
CoPre software, a 3D laser scanning pre-processing software that can process captured raw data, including POS trajectories, lidar data, and RGB images, was used for the Tilt and DOM modeling.
CoProcess software, designed for reality capture post-processing tasks and DEM/DTM generation, generated high-precision DEM models, a 3D representation of a ground surface created from elevation data, with a point cloud density of more than 50 points/m2 for the areas above and below the water.
Additional steps
The remotely operated vehicles and generated models obtained site data such as climate records, flood maps, flow records, hydrologic summaries, groundwater level records, water quality, and resource data to use as the basis of the analysis.
The team also used historical flood information during the scoping phase to develop a conceptual model of the flood mechanisms. Based on the actual flood records, a third-party flood simulation platform was used to produce the entire flood process for the different years.
The real-time flood extrapolation was processed on the third-party software, which simulated steady and unsteady flow patterns using hydrodynamic modeling algorithms.
“Advancements in bathymetric surveying, incorporating cutting-edge technologies such as UAVs with lidar, USVs with echo sounders, and high-precision positioning systems, have transformed the creation of digital twin models for water bodies, particularly the Yellow River in China,” said Taxiya Wang, Business Development Manager of Marine Survey at CHC Navigation. “This bathymetric surveying effort has laid the foundation for hydraulic models, flood maps, and customized applications, emphasizing the importance of up-to-date, high-quality data in watershed engineering and construction projects.”
The result
Based on the developed digital flood model, the next step for the digital watershed twin project is to collaborate with technical staff, experts, and users to create customized applications for watershed engineering and construction. The project is ongoing and will end in 2025.
Surveying wet gaps
Advanced Navigation
Defense departments are continuously looking to improve the safety of military personnel and equipment in conflict regions. With this aim, the UK Defense Science and Technology Laboratory (DSTL) launched its “Map the Gap” competition. It invited engineering firms to design and build an unmanned surface vessel (USV) capable of quickly, reliably, and safely surveying wet gaps — including rivers, streams, canals, and waterways — without putting engineers and other personnel at risk. Commanders can then view the survey data to determine the safest crossing points for troops and equipment.
DSTL relied on Advanced Navigation’s Spatial FOG Dual fiber optic gyroscope to conduct the hydrographic surveying project.
The challenge: Building a USV to assist defense forces
Challenges in the project included measuring water depths and flow rates, crossing lengths, river-bed topography, and riverbank heights, as well as shape profiling and assessing ground load handling capabilities. The vehicles also had to be either remotely operated or fully autonomous and deliver the collected data in a way that could be easily interpreted for quick decision-making.
The survey required multiple sensor technologies for simultaneous above- and below-water 3D surveys. For above-water use, dual lidar sensors produce high-resolution point clouds of the surrounding environment. For below-water mapping, a sensor suite consisting of a multibeam sonar, an Acoustic Doppler Current Profiler/Doppler Velocity Log (ADCP/DVL), and a cone penetrometer were used to measure current and water flow as well as to test substrate density.
Ultrabeam Hydrographic won the DSTL competition. Its team integrated multiple sensors into a single housing and selected the four-wheeled Axolotl vehicle for the second phase of the project.
Additional steps
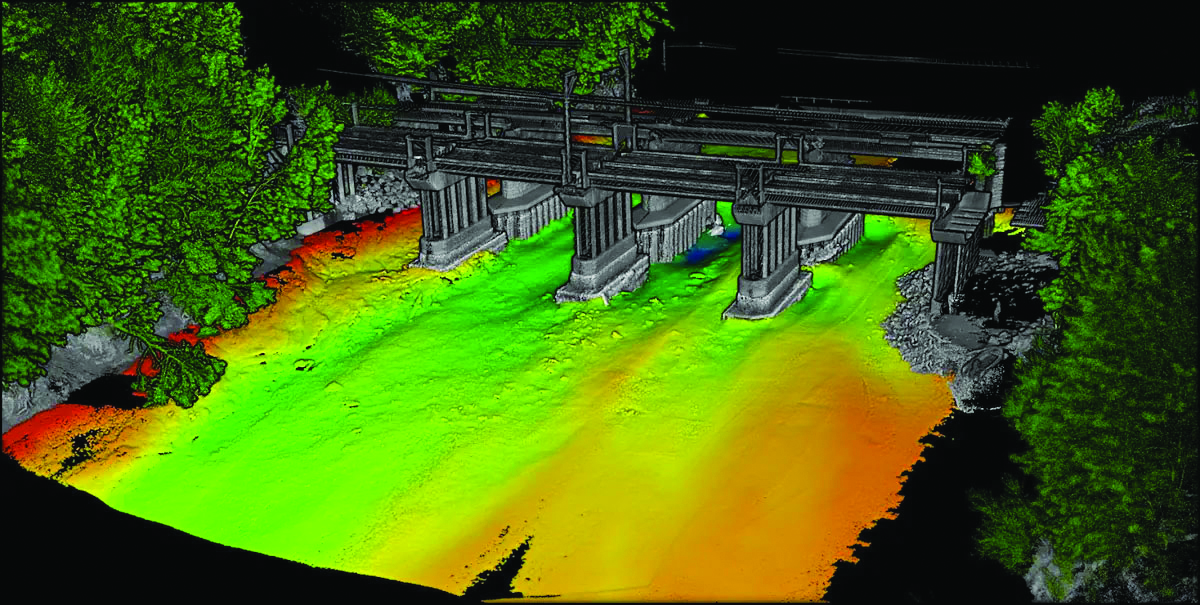
An example of the highly detailed single-3D survey output from the Axolotl, showing features both above and below the water. (Image: Advanced Navigation)
The team was in search of a GNSS/INS device capable of dead-reckoning and maintaining accurate heading for extended periods of time, which led them to Advanced Navigation’s Spatial FOG Dual GNSS/INS.
Ultrabeam Hydrographic had previously been using a MEMS-based solution that could maintain a suitably accurate heading without GNSS for up to approximately 60 seconds. However, tests with the Spatial FOG Dual showed that it could maintain an accurate heading for more than 15 minutes.
“The MEMS can hold onto heading for maybe 30 seconds to a minute, accurately. After that, it’s not reliable,” Gabriel Walton, Ultrabeam Hydrographic’s technical director said. “We have used the Spatial FOG Dual in certain circumstances where we went 10 to 15 minutes without GNSS. I do believe it will go on for longer.”
The team integrated the Advanced Navigation solution into their survey management and mission control software. This allowed the Spatial FOG Dual to be used for survey purposes and to provide motion data to the robot’s artificial intelligence (AI) for autonomous mission control and object detection and avoidance.
The result
“Map the Gap” Phase 2 demonstrated that the Axolotl’s mechanical design, sensor suite integration, extensive use of AI for autonomous mission control, decision-making and precise navigation can serve as a significant advancement for bathymetric surveying.
Since “Map the Gap,” Ultrabeam Hydrographic has deployed the Axolotl on commercial waterway survey missions, such as surveying bridge sites and attaining a clear understanding of riverbed and water conditions.
GNSS has transformed the way both individuals and machines navigate across the globe, leading to a growing number of organizations utilizing positioning data in the development of products and applications. GNSS technology plays a crucial role in enabling autonomous vehicles, robots, logistics fleets, and emergency response systems to accurately determine the precise locations of places, people, and things on Earth’s surface. As a result, routes are not only more accurate and efficient but also safer.
As a satellite-dependent navigation system, various atmospheric and technological factors can impact the accuracy and precision of GNSS signals. These signals often need to be corrected by receivers before they can be used for positioning, and various correction methods exist today to achieve this. Each method has its own advantages and disadvantages, catering to diverse accuracy requirements and application scenarios.
Five causes of GNSS signal inaccuracies
When choosing the best GNSS correction method for a specific project, it is important to comprehend signal errors and their underlying causes. GNSS errors result from a combination of elements, such as ephemeris inaccuracies, disparities in satellite clocks, conditions in the ionosphere and troposphere, and inconsistencies between various satellite systems. Each signal correction method addresses these elements differently, resulting in pros and cons that must be weighed before selecting and implementing a solution.
1. Inaccurate ephemeris data
To calculate their position on Earth, GNSS receivers need to know the exact position in space of the satellites they use. Satellite positioning and orbital parameters are represented in ephemeris data, but sometimes this data is incorrect. Ephemeris inaccuracies cause the receiver to not know the satellites’ exact positions, thereby degrading the accuracy of their position calculation.
2. Differences in satellite clocks
Even the highly accurate atomic clocks on GNSS satellites can introduce errors in the timestamps receivers use to calculate positions. The exceptionally high speed at which GNSS satellites travel in space (approximately 7,000 mph) adds another layer of complexity to these calculations because even a nanosecond of difference can lead to substantial positioning errors.
3. Conditions in the ionosphere
The ionosphere, the outermost layer of Earth’s atmosphere, consists of charged particles that can affect the speed of light and radio signals as they pass through it. Fluctuations in solar radiation and other ionospheric conditions can result in delays or distortions in GNSS signals, introducing measurement errors that require correction for precise positioning. Although the influence of the ionosphere can result in significant signal interpretation errors, correction methods can effectively model and account for them.
4. Conditions in the troposphere
Weather, which occurs in the troposphere, the innermost layer of Earth’s atmosphere, also impacts GNSS signals as they travel from satellites in space to receivers. Temperature, humidity, and pressure can affect the speed of light and radio signals much like the charged particles of the ionosphere, leading to even more delays and distortion in GNSS calculations. However, because weather is highly localized, tropospheric errors must be modeled and corrected from a relatively close distance to achieve the level of accuracy needed for precise positioning.
5. Group delay (code bias)
Different countries and organizations around the world operate GNSS satellites. While they are generally aligned, minor discrepancies in time references and frequencies exist that can impact the accuracy of GNSS positioning. This is known as group delay or code bias and must also be corrected to ensure that signals are interpreted correctly.
Types of GNSS corrections
Understanding the origin of errors is critical when selecting the optimal GNSS signal correction method for a particular product or application. Each method has advantages and disadvantages ranging in importance depending on the application of GNSS positioning
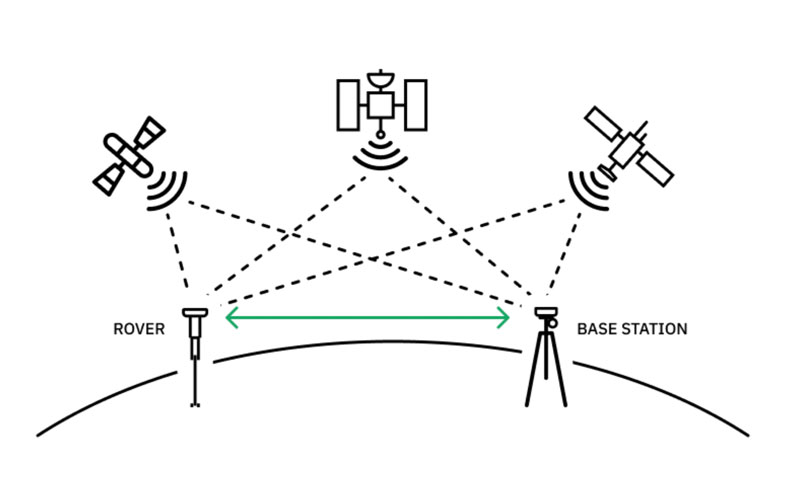
Real-time kinematic positioning (RTK) correction is widely regarded as the best method for achieving precise GNSS signal correction. It requires setting up a base station with a GNSS receiver at a very well surveyed location near the target area (usually within 30-50 kilometers), which transmits corrections to the end user’s GNSS receiver (called the rover). The proximity between the base station and the rover mitigates the impacts of signal errors. Any signal disparities that do exist can be analyzed to measure positional differences between the base and the rover, enabling the latter to calculate its position very precisely.
Real-time kinematic positioning (RTK) yields efficient and highly precise GNSS corrections but requires an extensive network of base stations to support receivers across a large geographic area. (Image: Point One Navigation)
However, classical RTK solutions have a notable limitation: to achieve corrections over wide areas they require an extensive infrastructure of base stations, which can significantly escalate costs. Therefore, RTK is best for autonomous vehicles and consumer navigation and sub-optimal for positioning applications in remote areas.
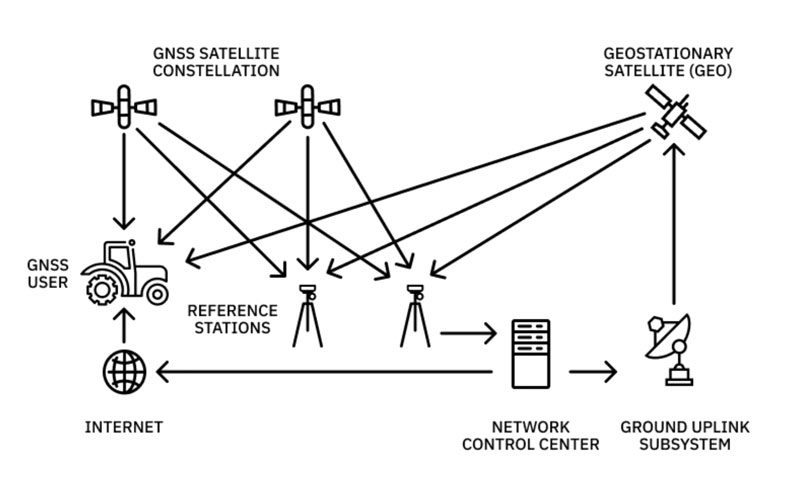
Precise point positioning (PPP) utilizes a limited number of highly precise and accurate stations to correct GNSS signals. The PPP algorithm divides the responsibility for correction between these stations and GNSS receivers. As a first step, the PPP stations model various known sources of error within GNSS, such as ephemeris inaccuracies, clock discrepancies, and group delay. They then transmit this information to GNSS receivers to conduct further calculations based on local conditions and refine the error estimation. By combining the accumulated signal data with the known error sources provided by the PPP stations, GNSS receivers gauge both global and localized errors (including ionospheric and tropospheric effects), ultimately calculating the necessary signal corrections for accurate positioning.
Despite its high accuracy, the limited number of existing PPP stations results in a longer time for signal correction. Using the PPP method, signal correction may take approximately 20-25 minutes. Particularly challenging conditions can further prolong the time needed to correct the signal, as the receiver independently calculates both ionospheric and tropospheric effects.
PPP is best for heavy equipment operating in open water or remote locations and sub-optimal for consumer GNSS receivers and autonomous vehicles.
Precise point positioning (PPP) produces accurate signal corrections, but at a much slower speed than other solutions. (Image: Point One Navigation)
The forefront of GNSS signal correction technology today is state space representation (SSR). In addition to providing ephemeris, clock, and code bias discrepancy data like PPP, SSR offers valuable insights into other signal accuracy factors, even the highly localized interferences caused by the ionosphere and troposphere. Nonetheless, many GNSS receivers lack the capability to effectively process and convert this extensive data into meaningful positions. To address this challenge, SSR data can be transformed into a virtual base station (VBS), effectively simulating an RTK base station for legacy receivers. This bleeding edge method enables the utilization of SSR data even with conventional GNSS receivers, expanding access to high-precision positioning capabilities to more users. SSR is best for the automotive and robotics industries and sub-optimal for teams using generic receivers.
Choosing a GNSS correction method
Like all technology, GNSS correction methods are constantly evolving, making high-precision positioning more accessible and reliable across a wide range of applications. However, to serve the increasing demands of organizations using GNSS for applications requiring precise positioning, correction methods must be scalable, efficient and accurate.
Different methods for correcting GNSS signals offer varying levels of accuracy and suitability for specific applications. As they select which is best suited to their use case, users must prioritize their needs, as well as the benefits and trade-offs of each correction method. RTK produces fast, hyper-accurate results in developed areas but can be expensive to deploy in areas without the proper infrastructure. PPP methodology enables users in remote locations to access precise positioning information but can take a substantial amount of time. SSR is powering some of the most innovative applications in technology today, but is not as accessible as other methods due to the limitations of legacy receivers. Once they have assessed cost, speed and accessibility, developers can select the GNSS correction method that is best for their product or application. As this continued innovation in the GNSS space increasingly helps organizations overcome challenges in signal correction, it will be interesting to see what new cutting-edge technology develops to shape the future of our world.
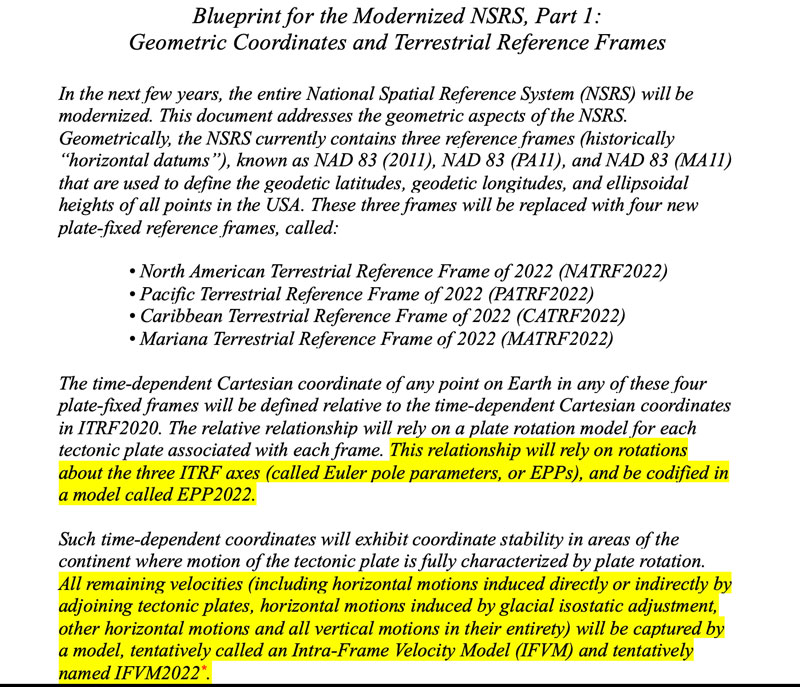
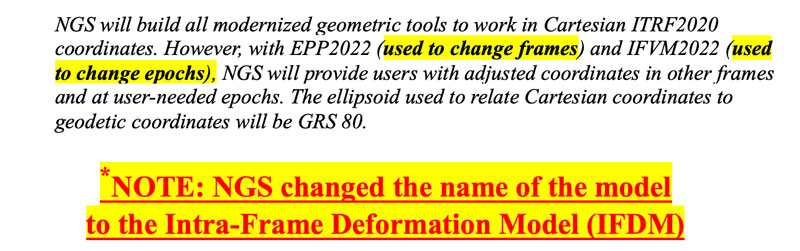
In my November 2023GPS World newsletter, I highlighted the announcement made by the National Geodetic Survey (NGS) of the recipients of the National Oceanic and Atmospheric Administration (NOAA) FY 2023 Geospatial Modeling Competition Awards. As stated in the newsletter, NGS awarded the grants for projects that will research emerging problems in the field of geodesy and develop tools and models to advance the modernization of the National Spatial Reference System (NSRS). A significant improvement in the new, modernized NSRS is the time-dependent component being incorporated in the computation of reference epoch coordinates (RECs). That said, developing models that accurately capture the time-dependent component is extremely important to providing reliable, consistent, and accurate RECs. This is not a simple problem to solve. Two of the grantees, Scripps Institution of Oceanography (SIO) and The Ohio State University (OSU) include developing models to address what NGS denotes as the Intra-Frame Deformation Model (IFDM).
This newsletter is going to highlight OSU’s geospatial award and my March newsletter will highlight the SIO proposal.
Summary of the OSU Geospatial Awards. (Image: NGS website)
The time-dependent models for the new, modernized NSRS — that is, Euler pole parameters (EPP) and Intra-Frame Deformation Model (IFDM)] — are discussed in NOAA Technical Report NOS NGS 62, “Blueprint for the Modernized NSRS, Part 1: Geometric Coordinates and Terrestrial Reference Frames” and NOAA Technical Report NOS NGS 67, “Blueprint for the Modernized NSRS, Part 3: Working in the Modernized NSRS.” The EPP2022 and IFDM2022 models will make time-dependent geodetic control useable for most surveyors, engineers, and geospatial users.
So, what are EPP2022 and IFDM2022? What does it mean to users of the new, modernized NSRS? Basically, the EPP model changes the reference frame of the coordinates but not the epoch and the IFDM model changes the epoch of the coordinates but not the reference frame.
For the OSU grant proposal, I had the opportunity to talk with Dr. Demián Gómez, the lead principal investigator (PI) for the OSU grant. Demián has extensive experience in modeling time-dependent coordinates and is the lead author on several papers published in the Journal of Geodesy that address this topic.
Articles by Gómez in the Journal of Geodesy
Gómez, D., Piñón, D.A., Smalley, R. et al (2015) Reference frame access under the effects of great earthquakes: a least squares collocation approach for non-secular post-seismic evolution. J Geod. https://doi. org/10. 1007/s00190-015-0871-8
Gómez, D.D., Bevis, M. G. & Caccamise, D.J. Maximizing the consistency between regional and global reference frames utilizing inheritance of seasonal displacement parameters. J Geod 96, 9 (2022). https://doi. org/10. 1007/s00190-022-01594-0
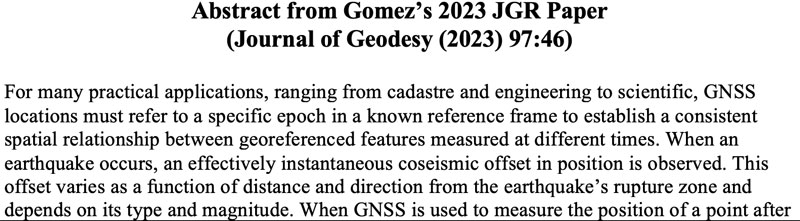
Gómez, D.D., Figueroa, M. A., Sobrero, F. S. et al. On the determination of coseismic deformation models to improve access to geodetic reference frame conventional epochs in low-density GNSS networks. J Geod 97, 46 (2023). https://doi. org/10. 1007/s00190-023-01734-0
In his latest paper, titled “On the determination of coseismic deformation models to improve access to geodetic reference frame conventional epochs in low-density GNSS networks,” the authors applied their methodology to two earthquakes in Chile: the 2010 Maule and 2015 Illapel earthquakes. The paper describes their methodology for estimating coseismic displacements in areas with low-density continuous GNSS coverage by using geophysical models in a hybrid (dynamic-kinematic) mode. Their methodology provided coseismic estimates on survey GNSS stations with rms (95% confidence interval) residuals of ~ 3 cm for Maule, and ~ 2 cm for Illapel. They also tested their models using InSAR and found that the models correctly predicted the near-field deformation. The authors believe that their methodology to obtain coseismic surface displacement models, based on a spherical layered Earth, for GNSS trajectory prediction models (TPMs) using sparse GNSS data represents a major improvement relative to coseismic models incorporated in TPMs, such as NGS’s Horizontal Time-Dependent Positioning model (HTDP) and Transformations in Four Dimensions (TRANS4D). This is important to users of the new, modernized NSRS because the accuracy of the IFDM2022 model is important to providing accurate RECs in the new, modernized NSRS.
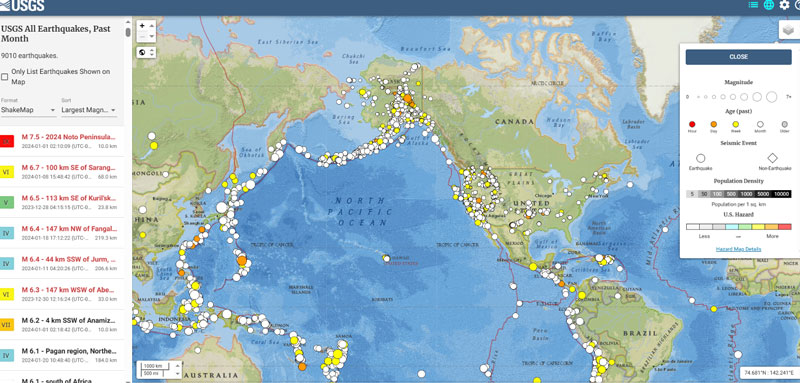
Most individuals in the United States associate earthquakes with California, but earthquakes occur every day in NGS’s area of responsibility. The USGS has a website that lists the location and magnitude of earthquakes.
Plot of earthquakes — 12/21/2023 to 01/20/2024. (Image: USGS website)
The box below highlights the earthquakes in the conterminous United States during a 30-day period. Most of these earthquakes have small magnitudes. The question is, what effects do these earthquakes have on nearby published marks in the NSRS?
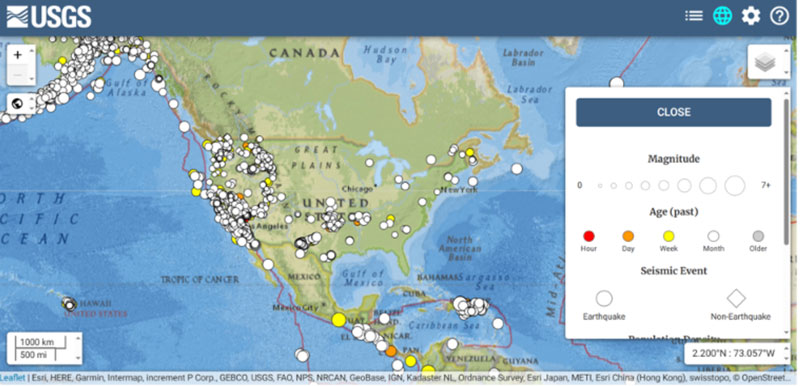
Plot of earthquakes in CONUS — 12/21/2023 to 01/20/2024. (Image: USGS website)
The website provides information on both earthquake and non-earthquake events.
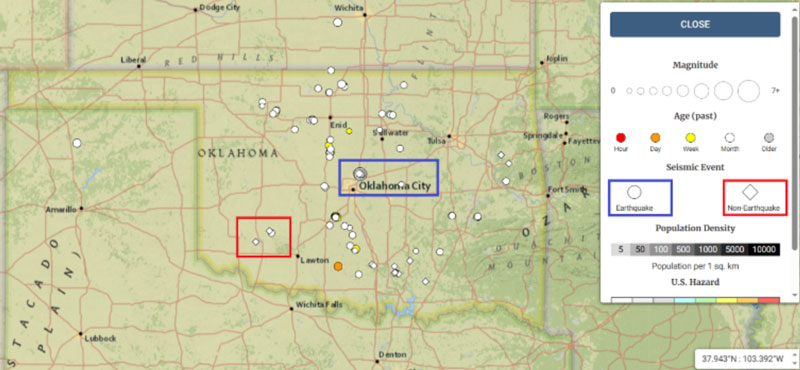
Plot of earthquakes in Oklahoma — 12/21/2023 to 01/20/2024. (Image: USGS website)
I was wondering what it meant by non-earthquake events, so I clicked on some of the icons. As indicated on the plot, a quarry blast registered on the USGS system. Again, the question is, do these earthquakes and non-earthquake events affect the coordinates of marks in the ground?
Plot of non-earthquakes in Oklahoma. (Image: USGS website)
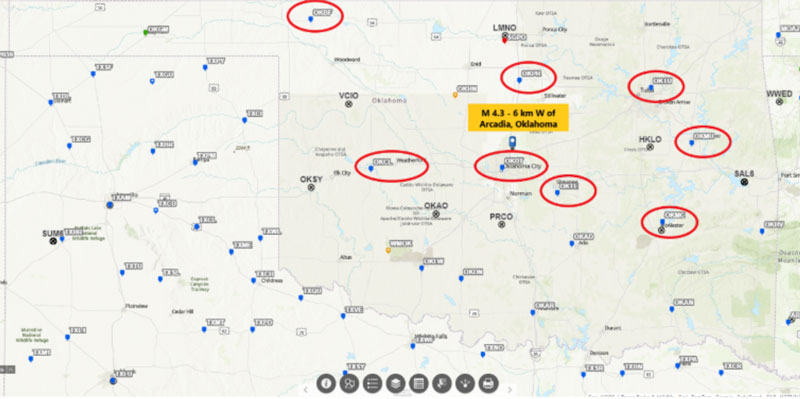
Something to note in the plots of Oklahoma is the large number of earthquakes around Oklahoma City during a 30-day period.
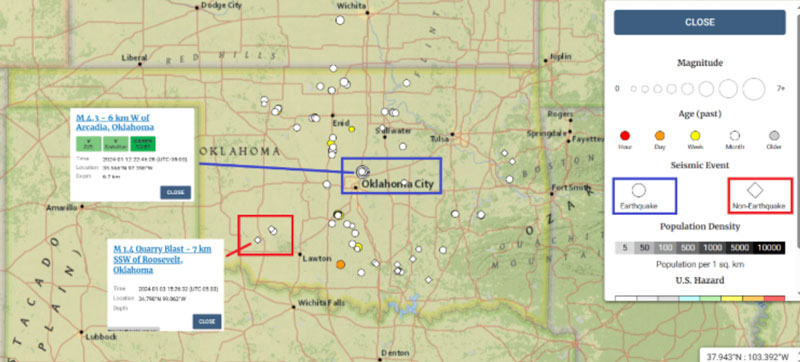
Plot of earthquakes north of Oklahoma City. (Image: USGS website)
Notice that there are several CORSs that surround the location of the earthquakes but only one CORS is close to the area. The box below shows a plot of CORS surrounding the area of earthquakes.
Demián’s latest paper describes their methodology for estimating coseismic displacements in areas with low-density continuous GNSS coverage by using geophysical models in a hybrid (dynamic-kinematic) mode. Since many earthquakes occur throughout the United States, it will be interesting to see how well this approach will work in the development of an Intra-Frame Deformation Model.
Earthquake M 4. 3 – 6 km W of Arcadia, Oklahoma. (Image: NGS website)
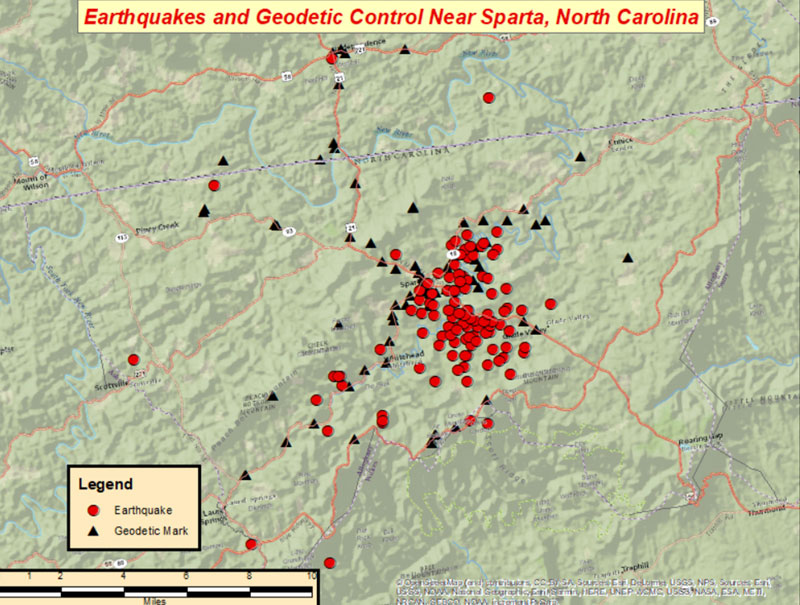
As previously stated, outside of California, most of these earthquakes have small magnitudes. That said, on August 9, 2020, a magnitude 5.1 earthquake occurred in Sparta, North Carolina. There were reports of damage to roads, water mains, and structures, but what were the effects on nearby published marks in the NSRS?
Widespread damage occurred in Sparta, which had already been debilitated by the COVID-19 pandemic in North Carolina. [23] Damages include collapsed ceilings, chimneys, and masonry; damaged water mains; cracked and deformed roads; uprooted headstones; and displaced appliances and items. [24][23][25] Wes Brinegar, the town’s mayor, issued a state of emergency to apply for FEMA and state financial aid. [25][23] Damage was worse than initially thought, with at least 525 structures being damaged, and 60 with major damage, meaning at least 40% of the structure was a total loss. Nineteen people lost their homes, 25 were declared uninhabitable, and scammers took advantage of the damage, charging people up to $500 USD for repairs, but never showing up.[26]
Governor of North Carolina, Roy Cooper, toured the damage in Sparta, releasing a statement later, stating “We’ve dealt with a hurricane, a violent tornado, and now an earthquake all in the middle of a pandemic: North Carolinians are resilient.”[27]
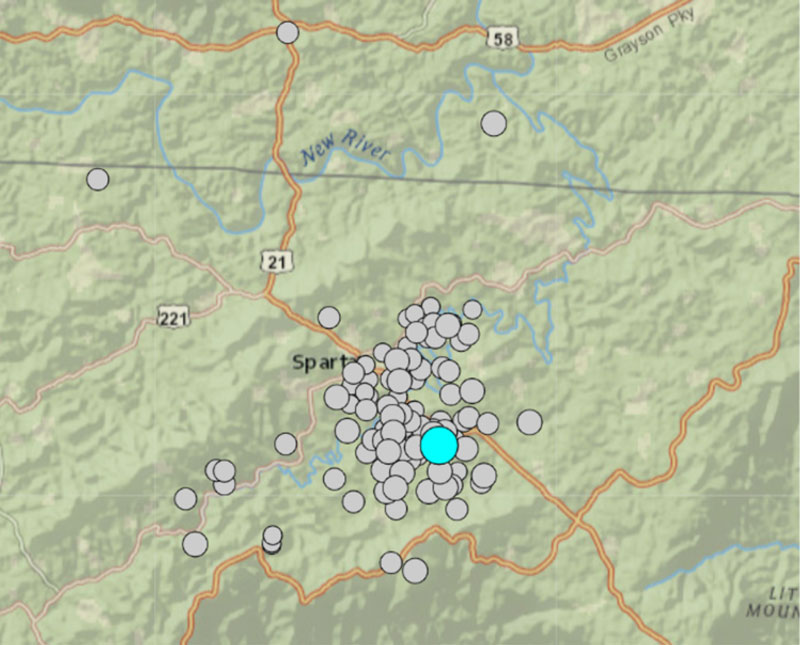
The box below shows the locations of earthquakes that occurred near Sparta, North Carolina. The plot indicates that there was not just one earthquake in the area, but many that may have affected the coordinates of monuments in the region.
Plot of earthquakes near Sparta, North Carolina. (Image: USGS website)
The image below shows the locations of earthquakes and NGS published geodetic marks in the Sparta region.
Image: Dave Zilkoski
Again, the real issue that needs to be addressed is what effect do these earthquakes and other geophysical activities such as subsidence have on the coordinates of geodetic marks in the region?
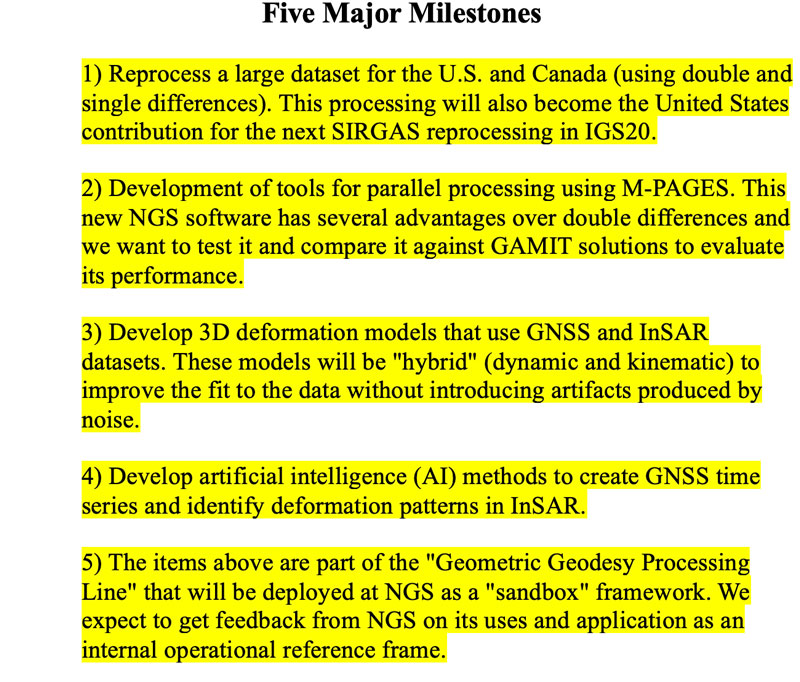
OSU’s grant proposal includes merging GNSS and InSAR using deep learning to better estimate the Intra-Frame Deformation Model. Obviously, developing time-dependent models for the new, modernized NSRS is very complex and technical. I contacted Demián and asked him for a list of his major milestones associated with his project.
Based on Demián’s major milestones, I had a few follow-up questions.
1) Reprocess a large dataset for the U.S. and Canada using double and single differences. This processing will also become the United States’ contribution for the next SIRGAS reprocessing in IGS20.
I asked Demián if he had an estimate of the amount of data he was talking about?
He told me that he did not have an exact number yet because they are still adding data. He said that, at this time, they have 878 stations in the US and Canada which amounts to 4,648,269 station days (i.e., 4. 6M RINEX files, just in the US and Canada). This is the latest number he retrieved from his database but this number increases every day (January 16, 2024).
2) Development of tools for parallel processing using M-PAGES. This new NGS software has several advantages over double differences and we want to test it and compare it against GAMIT solutions to evaluate its performance.
Demián stated that M-PAGES has several advantages so I asked him to explain what he meant.
He told me that one advantage is that it can process all constellations at once using single differences which allows processing of more stations simultaneously. Another advantage is because single differences produce “lighter” systems of equations (compared to double differences), they can process more stations simultaneously.
3) Develop 3D deformation models that use GNSS and InSAR datasets. These models will be “hybrid” (dynamic and kinematic) to improve the fit to the data without introducing artifacts produced by noise.
[Note: this approach is described in the paper titled “On the determination of coseismic deformation models to improve access to geodetic reference frame conventional epochs in low-density GNSS networks,” J Geod 97, 46 (2023).]
Demián said“they are in the process of collecting all the GNSS data that they can to process and then they will identify which gaps can be filled with InSAR data.”
I wanted to better understand what Demián meant by “hybrid” model. So, I asked him about his “hybrid” approach and he provided the following explanation:
When we say “kinematic” we refer to a model that does not consider the underlying mechanism to explain the observed effect. A good example are the trajectory models of GNSS stations that describe their motions as a sum of mathematical functions (there are no physics in them). A dynamic model does use the underlying physics to explain the observations. A “hybrid” model is in the middle: it uses a dynamic model but allows some unrealistic model parameters to improve the data fit.
I mentioned to Demián that users would be very interested in the spatiotemporal uncertainties of the intra-frame deformation model. I asked him if, at this time, he had any idea of the size or range of uncertainties.
Demián said “that it will be variable and very dependent on the density of the input data. He said that they are aiming for cm-level uncertainties. Our experience in Argentina tells us that a 5 mm uncertainty level can be achieved on stable regions while about 2 to 3 cm is expected on high deformation areas. We will have to wait and see to understand the model’s performance. ”
I told Demián that the Houston-Galveston, Texas region of the United States is an area of subsidence that would benefit with an accurate Intra-Frame Deformation Model. The Harris-Galveston Subsidence District has a variety of GNSS CORS and PAMS that are not part of NGS’s CORS. My April 2022 GPS World Newsletter, which included the HGSD CORS and PAMS, described the effects of vertical movement on NGS’s modernized 2022 NSRS. I also asked if he was willing to use this data
He had a very simple answer: “Absolutely!” He said “The more data we incorporate, the better the models will describe reality. Part of the project is related to providing a processing line that can handle large amounts of data. The issue with some data is metadata. Metadata and how we collect it is what really prevents us from reaching that “final mm” uncertainty level we are all looking for. We should be pushing very hard on metadata standardization. In my opinion, the biggest problem is twofold: 1) incorrect antenna identification in RINEX files (due to improper data curation) and 2) lack of a unified/globally accessible database of metadata that is adequately cured.”
4) Develop AI methods to create GNSS time series and identify deformation patterns in InSAR.
Part of the OSU project is to use ML to improve the development of the IFDM.
Excerpt from OSU Proposal on trajectory modeling
Trajectory modeling
For each station, we will obtain KTM parameters, including their uncertainties, for
stations velocities (and acceleration if needed), mechanical and/or geophysical jumps (earthquakes), logarithmic transients after earthquakes (following recommendations from Sobrero et al., 2020), and seasonal coordinate variations. Other parameters for stations affected by volcanic activity, episodic subsidence, etc will also be added when needed. We routinely generate these KTMs for thousands of GNSS stations (for the definition of our in-house geodetic RF) using software developed within the Division of Geodetic Science at OSU. Earthquake detection is performed automatically following formulations also developed by the project’s PIs.
Trajectory modeling enhancement using machine learning
We will enhance the capabilities of the KTMs by including a physics-based machine
learning (ML) component to the model that automatically detects, e. g., discontinuities in the time series. Detecting and mitigating the effects of mechanical jumps (those generated by unreported equipment changes and other effects) will increase the overall reliability of the GGPL. ML is well suited for this task and indeed ML algorithms like Random Forests have been explored in a recent work (e. g., Crocetti et al., 2021). We will test a similar approach, as well as more sophisticated convolutional neural networks to automatically detect discontinuities in coordinate trajectories. These ML algorithms will be trained on OSU’s database of trajectory models (~4000 stations). Using this ML algorithm we will also automatically detect other ‘harmful’ residuals in the time series. For example, large residuals can appear right after an earthquake if the postseismic transient does not have the appropriate relaxation time, or if two transients are needed to model the event.
I find AI and ML fascinating. Basically, machine learning is a field of study in artificial intelligence.
[As a side note: According to Wikipedia, Alan Turing, a mathematician, was the first person to conduct substantial research in the field that he called machine intelligence. Mr. Turing was considered the father of modern computer science. He was famous for his work in decoding the encryption of German Enigma machines during the second world war, and documenting a procedure, known as the Turing Test, that formed the basis for artificial intelligence. Turing was not directly involved with the successful breaking of these more complex codes, but his ideas proved of the greatest importance in this work.]
5) The items above are part of the “Geometric Geodesy Processing Line” that will be deployed at NGS as a “sandbox” framework. We expect to get feedback from NGS on its uses and application as an internal operational reference frame.
The fifth milestone includes developing what Demián calls a “Geometric Geodesy Processing Line (GGPL).” GGPL has three phases, but I am very interested in the first phase. The first phase will begin by analyzing the different components of the GGPL, including the interactions with various geospatial stakeholders, both within and outside of the United States. The plan includes developing a workflow that involves data curation, processing, and analysis to create an operational, fully kinematic reference frame (KRF) for CONUS and Canada. The KRF, once implemented, would at first constitute an experimental or ‘sandbox’ frame executed jointly with NGS’s Geosciences Research Division.
I asked Demián what plans he has for involving users. Especially, how is he going to include surveyors, engineers, photogrammetrists, and spatial data managers?
“My goal is to bring some of the lessons learned in Argentina when we implemented the kinematic reference frame in 2019,” Demián said. Back then, we had discussions with small groups of people in industry to know what their needs were. For example, surveyors will probably need to deal with epoch transformations in a different way than engineers or spatial data managers. The GGPL should facilitate the products that will help these stakeholders. In my experience, the issue is how the data (or model) is accessed so I do not foresee any major issues with users.”
He said that he is open to any suggestions others might have about this.
In phase two, OSU will augment the KRF with locally ‘dynamic’ densifications, which allow
the reference frame to be ‘interpolated’ to locations between the reference stations. Using advanced techniques, such as deep learning, complementary datasets, such as GNSS and InSAR, will be combined and assimilated leading to a kinematic/dynamic reference frame. During phase two, NGS would be assessing the utility and performance of the sandbox GGPL, while OSU works on its dynamic extensions.
In a third phase, the GGPL and the associated KRF and models would undergo any necessary modifications and adaptations, all guided by NGS. By the end of the proposed project, NGS will have a sandbox frame that can implement any new International Terrestrial Reference Frame (ITRF) in a manner that is completely transparent to NSRS users, including all associated models to operate continuously and without interruption.
This newsletter highlighted NGS’s grant to OSU for developing a fully kinematic reference frame for the Continental United States of America and Canada. The primary objectives of this project are to modernize geodetic tools and models and to develop a geodetic workforce for the future. The OSU project will include interactions with various geospatial stakeholders, both within and outside of the United States. In my opinion, it is very important to engage the geospatial user community when developing these new tools so the tools will be useful during the implementation of the new NSRS. A significant improvement in the new, modernized NSRS is the time-dependent component being incorporated in the computation of reference epoch coordinates (RECs). That said, developing models that accurately capture the time-dependent component is extremely important to providing reliable, consistent, and accurate RECs. The goal of the OSU project is to provide an accurate Intra-Frame Deformation Model which will provide reliable, consistent, and accurate reference epoch coordinates (RECs). Throughout the project, OSU would train M.S. and Ph.D. students, and postdocs, providing a source of trained new employees for governmental agencies as well as private industry. Future newsletters will address other NGS recipients of the NOAA FY 23 Geospatial Modeling Competition Awards.
A roundup of recent products in the GNSS and inertial positioning industry from the January 2024 issue of GPS World magazine.
SURVEYING & MAPPING
Laser Scanning Measurement System Compatible with specialized kits
The LS300 3D laser scanning measurement system utilizes simultaneous localization and mapping (SLAM) technology and advanced real-time mapping techniques. The LS300 3D operates autonomously, independent of GNSS positioning, making it ideal for harsh conditions in both indoor and outdoor environments.
LS300 includes a 120-meter working range and a sampling rate of 0.32 million points per second. Its point cloud accuracy is designed to perform in low reflectivity extended-range mode. The system is compatible with specialized kits, including the handheld form, back kit, car mount, and UAV kit.
By using data processing software specifically designed and developed for the LS series, users can handle large volumes of point cloud data and simplify complex tasks, including point cloud denoising, point cloud splicing, shadow rendering, coordinate transformation, automatic horizontal plane fitting, automatic point cloud data report generation, forward photography, and point cloud encapsulation.
During data post-processing, users can input absolute coordinates of control points, allowing these control points to adjust the data and improve scanning data accuracy. The LS300 incorporates a redundant battery design with two hot-swappable batteries, designed to prolong operation without frequent charging or interruptions. ComNav Technology, comnavtech.com
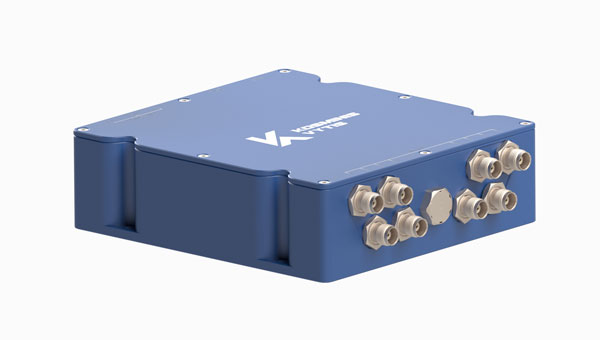
Anti-jamming receiver A jamming protector for legacy receivers
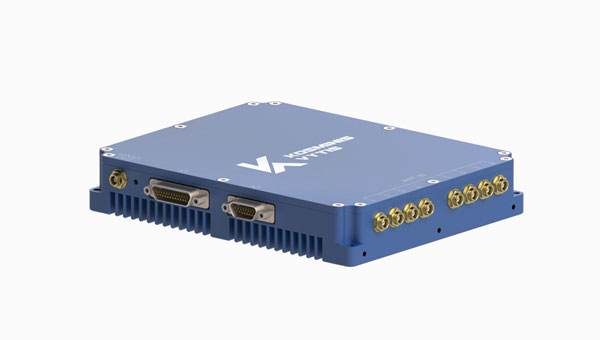
The KV-AJ3 tri-band anti-jamming receiver combines a digital antenna control unit (DACU) and a GNSS receiver. KV-AJ3 can be used as a jamming protector for legacy receivers or as a stand-alone GNSS receiver solution.
The tri-band solution decreases interferences from up to three directions in three frequency bands, including S-band. This approach is designed to provide significantly higher protection against interference compared to single-frequency devices.
The receiver has a digital port for navigation data output. Jamming-free RF signals can also be delivered to external non-protected GNSS receivers to obtain position, velocity, and time.
KV-AJ3 contains a MEMS inertial sensor, which allows for GNSS-aided INS solutions where coordinates and attitude angles are required. Kosminis Vytis, kosminis-vytis.lt
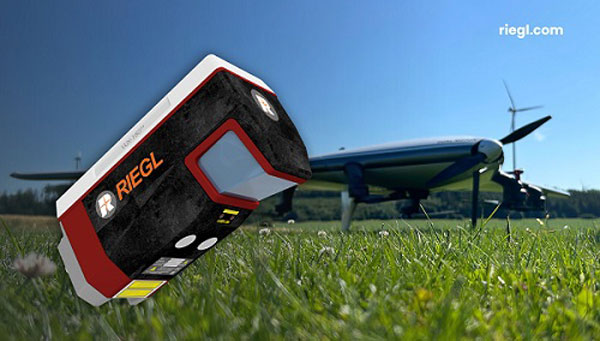
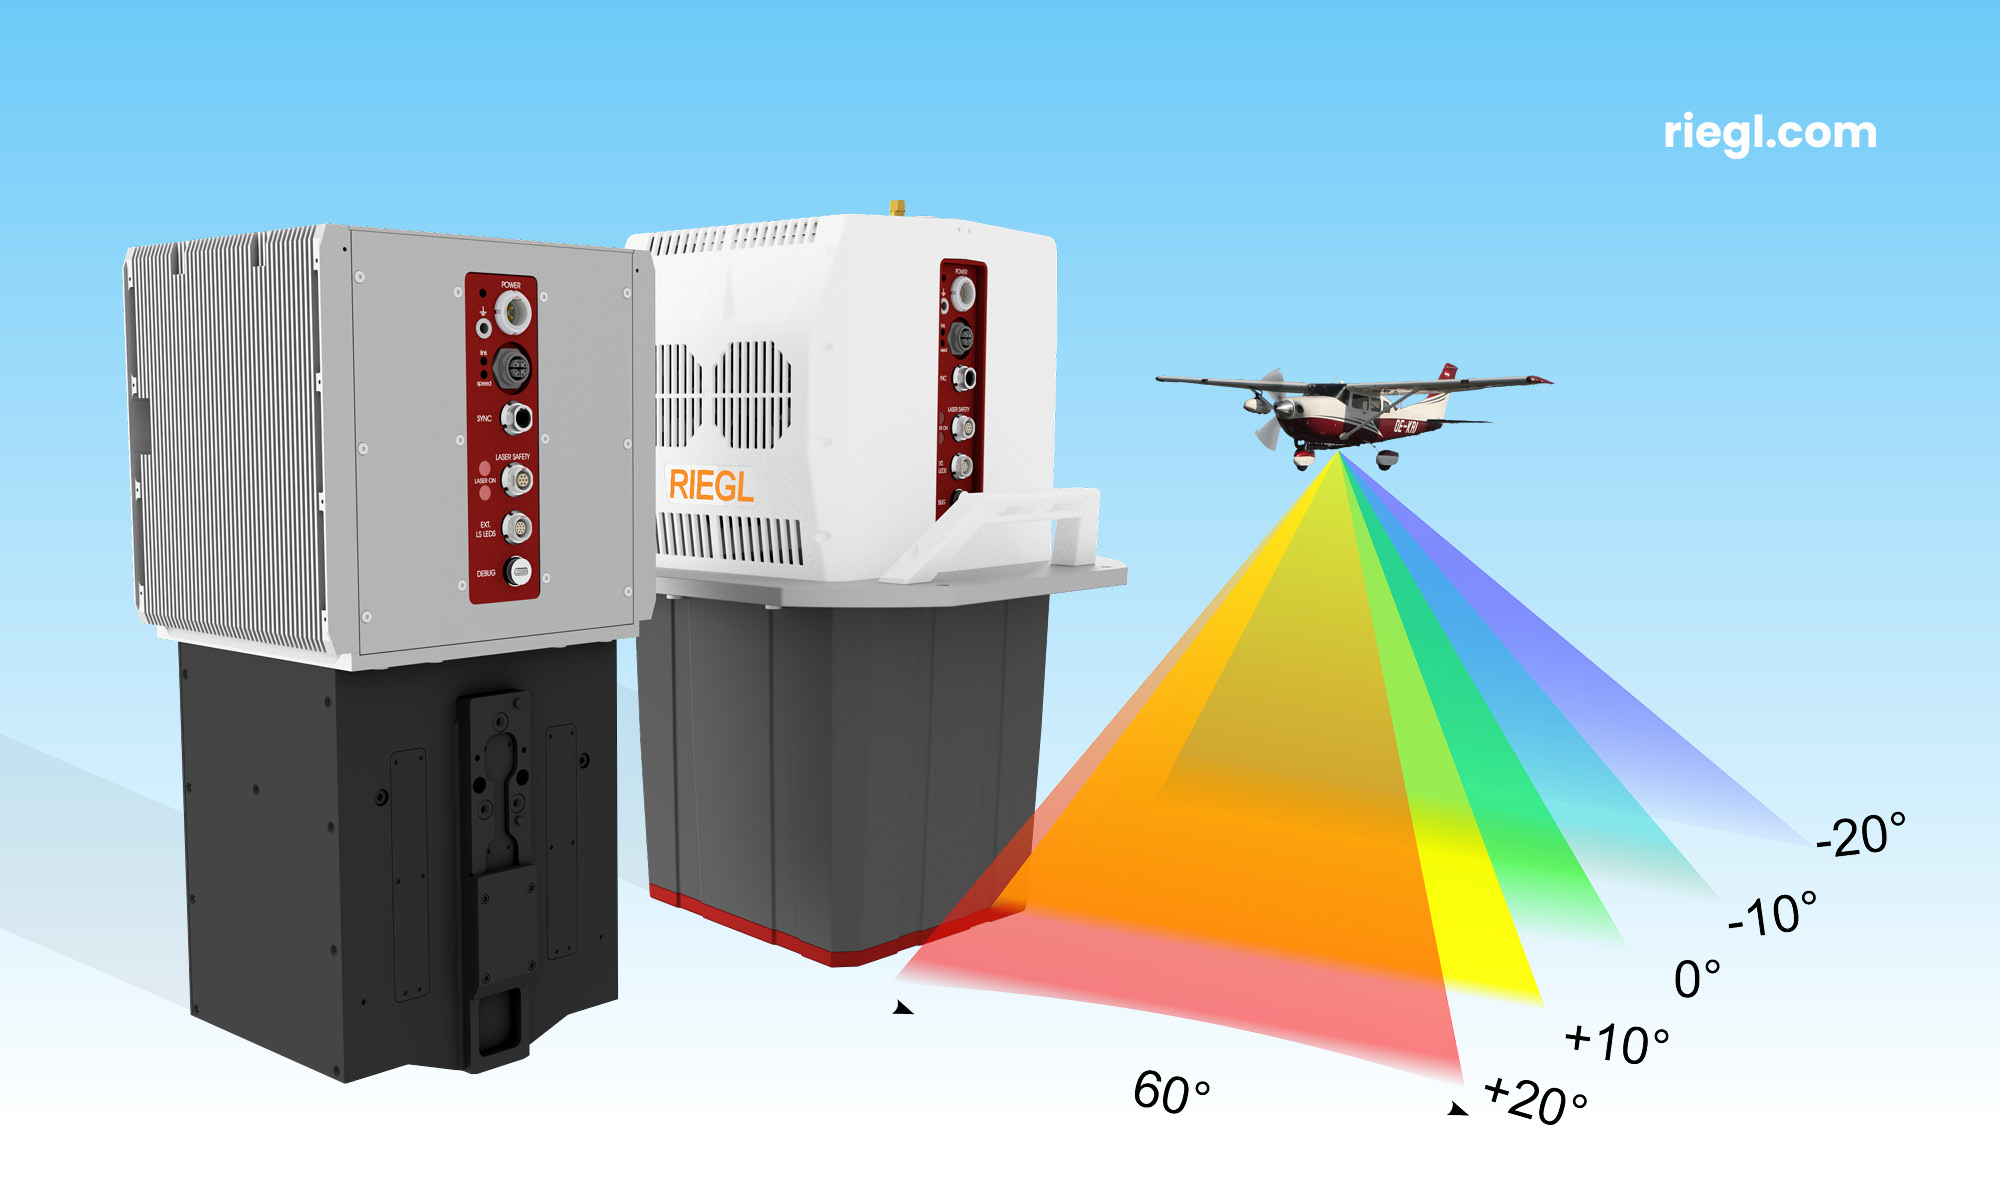
Lidar sensor Designed for high-speed airborne missions
The VUX-180-24 offers a field of view of 75º and a pulse repetition rate of up to 2.4 MHz. These features – in combination with an increased scan speed of up to 800 lines per second – which makes the VUX-180-24 suitable for high-speed surveying missions and applications where an optimal line and point distribution is required.
Typical applications include mapping and monitoring of critical infrastructure such as power lines, railway tracks, pipelines, and runways. The VUX-180-24 provides mechanical and electrical interfaces for IMU/GNSS integration and up to five external cameras.
This sensor can be coupled with RIEGL’s VUX-120, VU-160, and VUX-240 series UAVs. The system is available as a stand-alone sensor or in various fully integrated laser scanning system configurations with IMU/GNSS systems and optional cameras. RIEGL, riegl.com
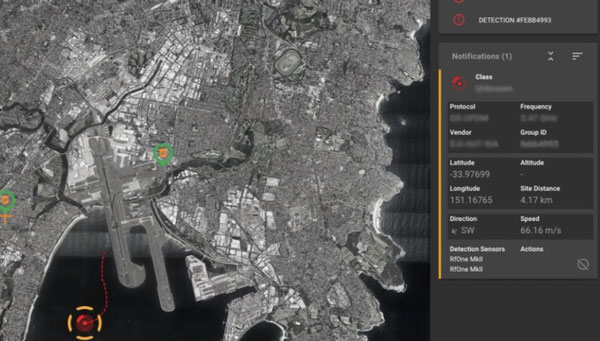
UAV detection technology A 3D data fusion engine for complex environments
SensorFusionAI (SFAI) is a sensor-agnostic, 3D data fusion engine for complex environments. It accommodates all common UAV detection modalities, including radiofrequency, radar, acoustics, and cameras.
SFAI allows third-party C2 manufacturers to integrate SFAI into its C2 systems. This integration can be achieved through a subscription-based software-as-a-service (SaaS) model, enhancing system performance.
Key features of SFAI include behavior analysis to track an object to determine classification and predict trajectory; threat assessment that determines threat level based on a range of data types; and an edge processing device called SmartHub for reduced network load and high scalability. DroneShield, droneshield.com
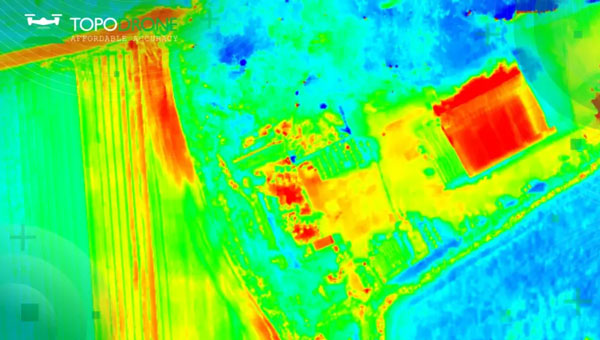
Thermal mapping solution Designed for UAVs
The PT61 camera is a thermal mapping solution for UAVs. The camera system provides detailed thermal orthomosaic maps and accurate 3D models. Developed in partnership with Agrowing, the PT61 is a versatile tool designed for multispectral data collection in renewable energy and other domains.
The PT61 combines a 61-megapixel camera with integrated thermal imaging capability. It can also switch between RGB and multispectral modes, which aims to increase its versatility and address the increasing need for comprehensive data acquisition in various industrial and environmental applications.
Integrated with Agrowing’s multispectral lenses, the camera offers detail across 10 spectral bands and an infrared band, making it ideal for solar plant inspection and dam management.
The enhanced Topodrone post-processing software complements the hardware by streamlining remote sensing tasks, ensuring surveyors and researchers can achieve high levels of efficiency. Topodrone, topodrone.com
OEM
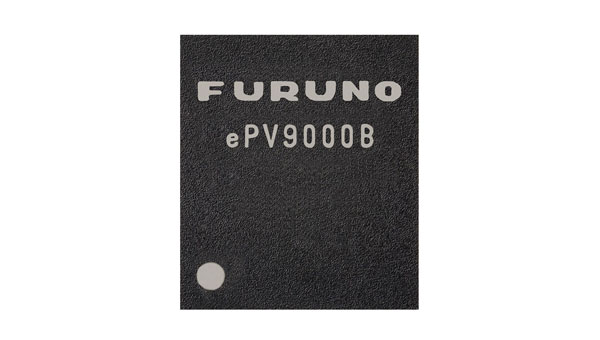
Dual-band GNSS receiver Achieves 50cm position accuracy without correction data
eRideOPUS 9 is a dual-band GNSS receiver chip that achieves 50cm position accuracy without correction data. eRideOPUS 9 is designed to provide absolute position information and can be used as a reference for lane identification, which is essential for services such as autonomous driving. It also serves as a reference for determining the final self-position through cameras, lidar, and HD maps.
The eRideOPUS 9 supports all navigation satellite systems currently in operation, including GPS, GLONASS, Galileo, BeiDou, QZSS, and NavIC. It can also receive L1 and L5 signals. The L5 band signals are transmitted at a chipping rate 10 times higher than L1 signals, which improves positioning accuracy in environments where radio waves are reflected or diffracted by structures, such as in urban areas — a phenomenon known as multipath.
A dual-band GNSS module incorporating eRideOPUS 9 is being jointly developed with Alps Alpine Co. and is scheduled for future release as the UMSZ6 series. Furuno Electric Co., Furunousa.com
Lidar scanning module Designed for OEM integration
The VQ-680 compact airborne lidar scanner OEM is designed to be integrated with large-format cameras or other sensors in complex hybrid system solutions.
It can be mounted inside a camera system connected to the IMU/GNSS system and various camera modules through a sturdy mechanical interface. The VQ-680 has laser pulse repetition rates of up to 2.4 MHz and 2 million measurements per second.
The VQ-680 is ideal for large-scale applications in urban mapping, forestry, and power line surveying. With a field view of 60º and RIEGL’s nadir/forward/backward (NFB) scanning, the system offers five scan directions up to ± 20º.
RIEGL, riegl.com
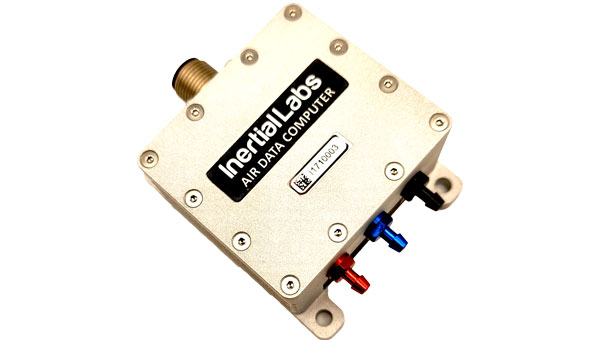
INS A product for avionic applications
The ADC inertial navigation system (INS) is designed to calculate and provide air data parameters, including altitude, air speed, air density, outside air temperature, and windspeed for avionic applications.
ADC’s compact form simplifies integration into existing UAV systems with strict size and weight requirements. The INS calculates the air data parameters using information received from the integrated pitot and static pressure sensors, along with an outside air temperature probe.
This compact device consumes less than one watt of power. It is designed for demanding environments, has an IP67 rating, and integrates total and static pressure sensors to calculate indicated airspeed accurately. ADC supports aiding data from external GNSS receivers and ambient air data, enhancing its precision in a variety of flight conditions. Inertial Labs, inertiallabs.com
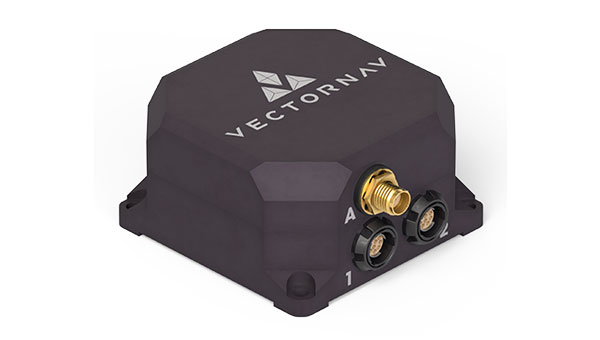
Two tactical-grade IMU With L5 capabilities
The VN-210-S GNSS/INS combines a tactical-grade inertial measurement unit (IMU) comprised of a 3-axis gyroscope, accelerometer, and magnetometer with a triple-frequency GNSS receiver. The integrated 448-channel GNSS receiver from Septentrio adds several capabilities, including L5 frequencies, moving baseline real-time kinematics with centimeter-level accuracy, support for Galileo OSNMA, and robust interference mitigation.
These capabilities and high-quality hardware offer improved positioning performance in radio frequency-congested and GNSS-denied environments.
The VN-310-S dual GNSS/INS leverages VectorNav’s tactical-grade IMU and integrates two 448-channel GNSS receivers to enable GNSS-compassing for accurate heading estimations in stationary and low-dynamic operations. The VN-310-S also gains support for OSNMA and robust interference mitigation, offering reliable position data across a variety of applications and environments.
The VN-210-S and VN-310-S are packaged in a precision-milled, anodized aluminum enclosure designed to MIL standards and are IP68-rated. For ultra-low SWaP applications, VectorNav has introduced L5 capabilities to the VN-210E (embedded) when using an externally integrated L5-band GNSS receiver. VectorNav, vectornav.com
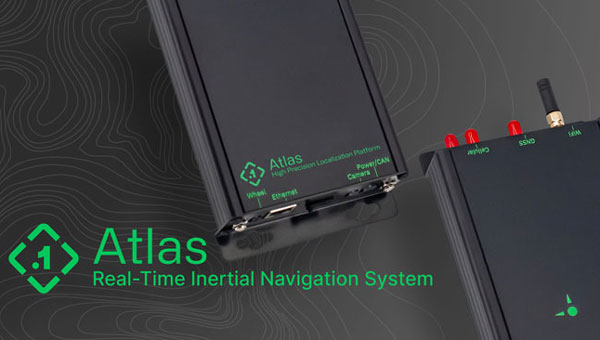
Real-time INS Used in large fleets
The Atlas inertial navigation system (INS) is designed for autonomous vehicles, mapping, and other applications. Atlas provides users with ground-truth level accuracy in real-time, which can streamline engineering workflows, significantly reduce project costs, and improve operational efficiency.
Atlas is designed to be used in large fleets. It integrates a highly accurate, low-cost GNSS receiver and IMU with the Polaris RTK corrections network and sensor fusion algorithms. The company aims to make it easier for businesses to equip their entire autonomous fleets with high-accuracy INS.
The system features a user-friendly interface, on-device data storage, and both ethernet and Wi-Fi connectivity. Field engineers can easily configure and operate Atlas using smartphones, tablets, and in-car displays.
Atlas can be used in a variety of sectors, including autonomous vehicles, robotics, mapping, and photogrammetry. Its real-time capabilities and affordability can enhance the widespread deployment of ground truth-level location in fleet operations. Point One Navigation, pointonenav.com
UAV
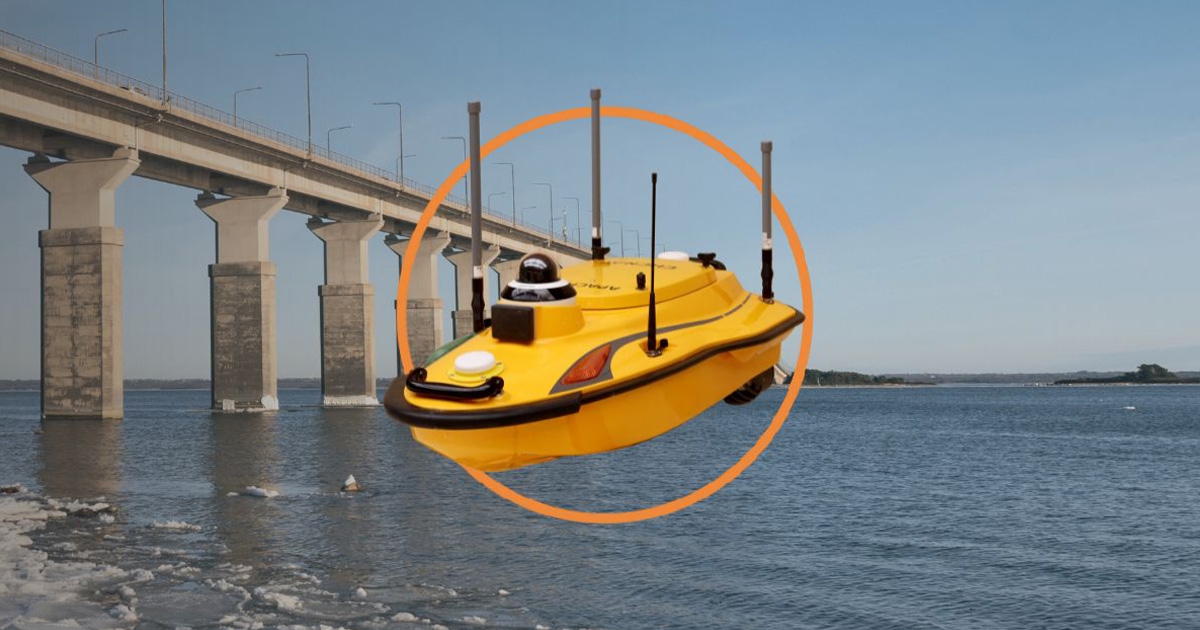
USV For autonomous bathymetric surveys
The Apache 3 Pro is an advanced compact hydrographic unmanned surface vehicle (USV) designed for autonomous bathymetric surveys in shallow waters. With its lightweight carbon fiber hull, IP67 rating, and semi-recessed motor, the Apache 3 Pro offers exceptional durability and maneuverability.
The Apache 3 Pro uses CHCNAV’s proprietary GNSS RTK + inertial navigation sensor to provide consistent, high-precision positioning and heading data even when navigating under bridges or in areas with obstructed satellite signals. The built-in CHCNAV D270 echosounder enables reliable depth measurement from 0.2 m to 40 m.
The USV is equipped with a millimeter-wave radar system that detects obstacles within a 110° field of view. When an obstacle is encountered, the USV autonomously charts a new course to safely navigate around it. The vessel uses both 4G and 2.4GHz networks to facilitate effective data transfer.
Even with a fully integrated payload, the USV can be easily deployed and controlled by a single operator in a variety of environmental conditions.
The Apache 3 Pro ensures reliable communications through its integrated SIM and network bridge with automatic switching. It also features seamless cloud-based remote monitoring that offers real-time status updates to enhance control and security. Its semi-recessed brushless internal rotor motors minimize drafts, which can improve the USV’s maneuverability in varying water depths. CHC Navigation, chcnav.com
Anti-jamming receiver Provides stable navigation in three frequency bands
KV-AJ3-A provides a stable navigation signal in three frequency bands, including S-band, even in the presence of jamming and other harsh conditions. The technology is MIL-STD compliant and meets the EMI/EMC requirements for avionics.
The direction of interfering signals is determined using a phased array antenna, which can then remove jamming signals from up to three directions. The original signal is either restored and delivered to external GNSS receivers or processed by the internal receiver to obtain position data.
The key components of this anti-jamming device are based on custom ASICs that allow users to achieve high jamming suppression and SWaP. KV-AJ3-A can be used for fixed installations and land, sea, and air platforms, including UAVs.
Kosminis Vytis, kosminis-vytis.lt
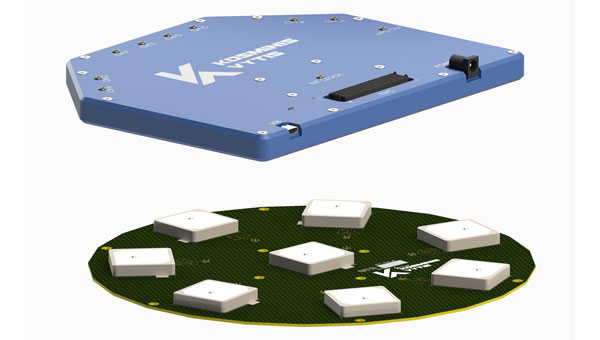
Development kit With anti-jamming and anti-spoofing capabilities
This eight-channel, CRPA, anti-jamming development kit is a set of instruments designed to help users add anti-jamming and anti-spoofing capabilities to their receivers.
The main development tool is NT1069x8_FMC — an eight-channel receiver board. The eight coherent channels are based on NT1069, the RF application-specific integrated circuit (ASIC) that supports a high dynamic range of input signals.
Each channel performs amplification, down-conversion of GNSS signal to intermediate frequency (IF) and subsequent filtering and digitization by 14-bit ADC at 100 MSPS.
The board is compatible with GPS, GLONASS, Galileo, BeiDou, NavIC, and QZSS signals in the L1, L2, L3, L5 and S bands. Each RF channel has an individual RF input with the option to feed power to an active antenna.
The board also has an embedded GNSS receiver and an up-converter, or modulator, which can provide connection to an external GNSS receiver.
Kosminis Vytis, kosminis-vytis.lt
Dublin City University (DCU) has partnered with Bentley Systems to create an advanced digital twin of its campus as part of its Smart DCU initiative. The partnership combines artificial intelligence (AI) and immersive digital twin technology. The campus will be used as a testing ground for innovative smart city solutions, with the aim of creating sustainable, efficient, and enjoyable urban spaces worldwide.
Bentley’s open 3D and reality modeling technology can create a campus model intricately linked with Internet of Things (IoT) data, which results in an immersive digital twin on its iTwin Platform.
The campus digital twin offers users a seamlessly interconnected and smart environment by integrating AI-powered analysis with a user-friendly interface for visualizing complex analytics. This allows for proactive problem-solving, optimization of resources, and informed decision-making intending to improve urban functionality and sustainability.
The digital twin has inspired environmental initiatives and simplified data visualization on campus, empowering agencies, and individuals to implement intelligent processes that shape the future of their cities, DCU said.
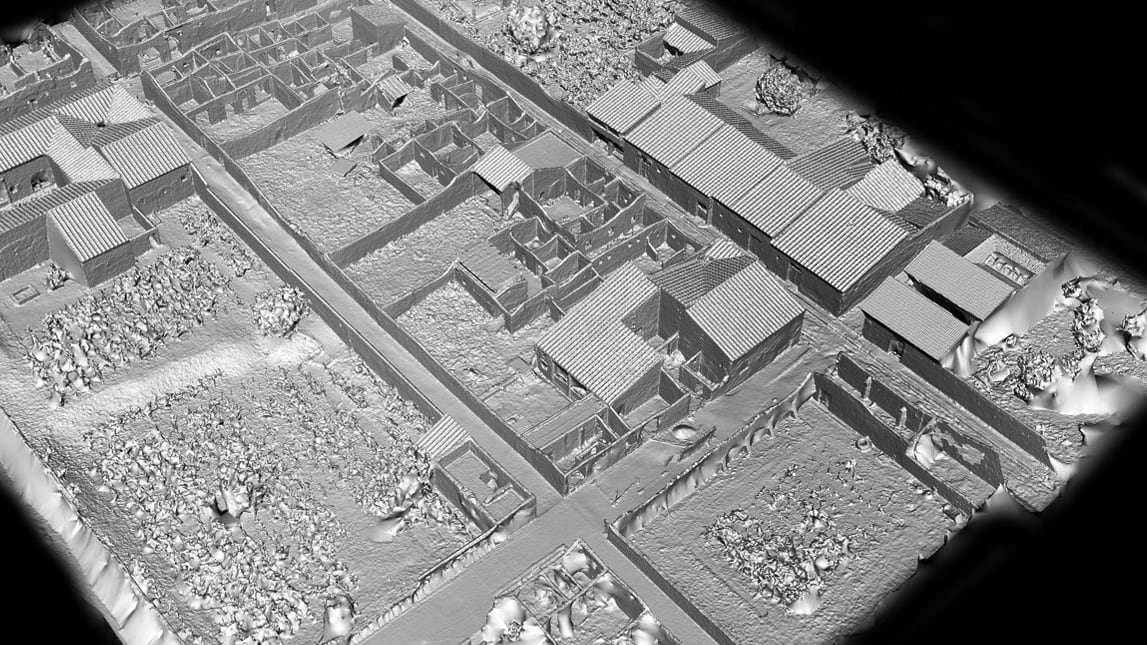
A street in Pompeii shows the structures that were remarkably preserved after Mount Vesuvius covered the city in ash in 79 CE. Everything about Porta Nocera, Region I 14 is being digitized by archaeologists. (Image: Allison Emmerson)
At the edge of Pompeii, along a city gate known as the Porta Nocera, professor Allison Emmerson of Tulane University directs a team of archaeologists. The famous Roman city, frozen in time when Mount Vesuvius erupted and covered it with ash, continues to reveal new insights to archaeologists nearly 275 years after the site was first discovered.
Within a building long believed to be a home around 2,000 years ago, the team unearthed a different story — one unraveling traces of economics, urban design, and social life among an elite and a lower class. To tell the story, Emmerson and her team have created a location-aware digital twin of the excavation site, which incorporates 2D maps, smart maps, and 3D models. The team is also able to share live data via a fully digital workflow using iPad Pros and Apple Pencils.
Revolutionary documentation with mobile app workflows
The latest geographic information system (GIS) technology allows Emmerson’s team to digitize everything they unearth at Porta Nocera, Region I Insula 14 as part of the Pompeii I.14 Project run by Tulane.
The team first used UAV imagery, terrestrial photography, and a technique called structure-from-motion photogrammetry to create a base map and 3D base model of the site. They then used tablets loaded with GIS apps to layer data over that 3D base model.
Leading the GIS data collection workflow is professor Alex Elvis Badillo, cohead of the project’s digital data initiatives team. Badillo said the archeologists use GIS documentation on the iPad Pro to record and explore data in layers to avoid information destruction.
Using ArcGIS Survey123, the team can share data on-site and implement paperless workflows. That data can also be linked to digital ArcGIS Dashboards to keep track of progress and foster collaboration during the excavation.
Interpreting the dig site
Emmerson and her team determined that the structure they initially uncovered was used for commercial activity such as shopping and dining, often identified with the lower classes at the time. Meanwhile, an elite residence was located right next door and the two buildings shared resources.
Lidar (light detection and ranging) uses laser light to densely sample the surface of the Pompeii I.14 site, producing highly accurate x,y,z measurements that provide the foundation for the digital twin. (Image: Allison Emmerson)
The Pompeii I.14 Project is ongoing. Once it is complete, the data will be incorporated into a larger digital twin from the Pompeii Bibliography and Mapping Project (2017) led by Eric Poehler, an associate professor of Classics at the University of Massachusetts Amherst. It will also be added to Pompeii’s central archaeology database and be available to policymakers, educators, archaeologists, and the public.
Researchers hope that a new understanding of the economic and social life of an ancient city such as Pompeii can not only inform us about the past but also help us create a better future.
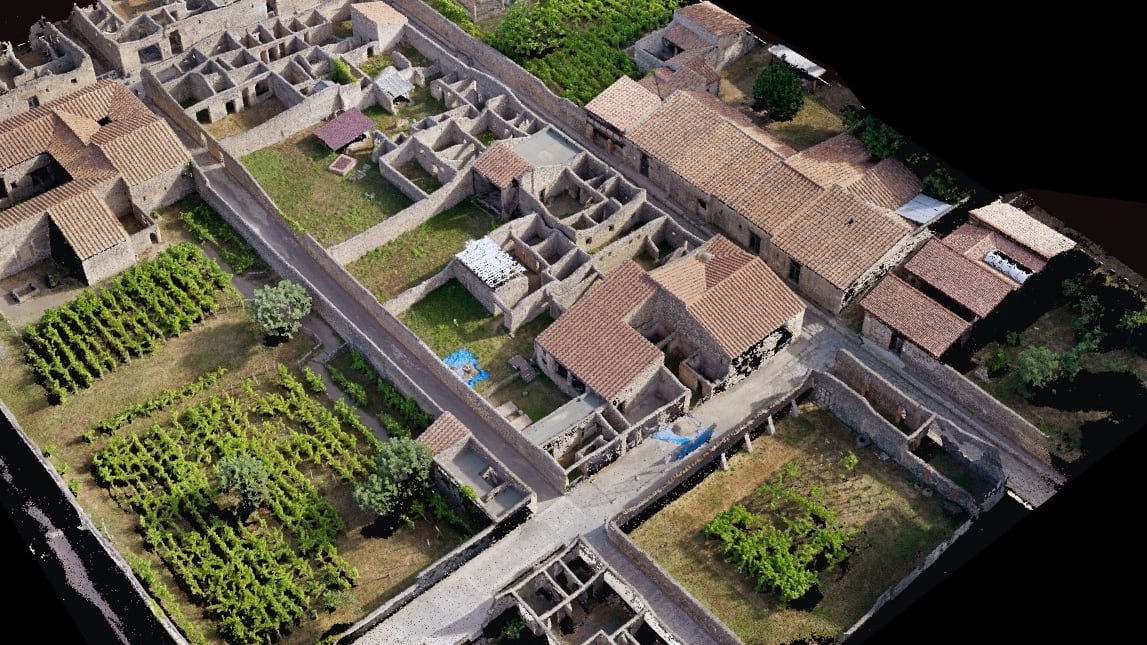
UAV imagery draped over the lidar data provides a photorealistic surrogate of the Pompeii I.14 Project site, which serves as the centerpiece for project data collection. (Image: Allison Emmerson)