“Seen & Heard” is a monthly feature of GPS World magazine, traveling the world to capture interesting and unusual news stories involving the GNSS/PNT industry.
According to Guinness World Records, a 982.53-mile, seven-day ride by David Schweikert was the “largest GPS drawing by bicycle”. His drawing of a cross spanned three U.S. states: Wisconsin, Nebraska and South Dakota. “GPS drawings,” or Strava art, are growing in popularity, with two other notable record attempts being made in the past 12 months. Schweikert completed his ride in May, but for Guinness World Records to consider a record official all documentation and data must be verified. There are also strict rules and regulations relating to mileage that deviates from the course. To stick strictly to the profile of the cross, Schweikert rode 35% of his trip on unpaved roads.
The Connecticut State Police is under fire for failing to archive vehicle location data. While all police cruisers are equipped with location technology, only live data is available, reported CT Insider. Officials can locate a police cruiser when the vehicle is in use but cannot determine where it has been in the past. Experts and lawmakers told CT Insider that not archiving location data for some period of time is unusual, and they are worried that it could make it harder to hold troopers accountable when their conduct comes into question — including in multiple ongoing investigations examining allegations of ticket falsification within the force.
The Saving Wildcats conservation project, based at Cairngorms National Park in the Scottish Highlands, is using tracking collars to study endangered wildcats. For the project, 19 wildcats were released into the park while a field research team monitored movement data and was alerted if any of the animals were hurt or killed. This project is a collaboration between the Royal Zoological Society of Scotland (RZSS), NatureScot, Forestry and Land Scotland, and the Cairngorms National Park Authority. The new kittens, born at RZSS’s Highland Wildlife Park, will be released into the wild next summer once they are aged six to eight months.
Photo: Croydon High School
High School Launches Weather Balloons
Croydon High School, in partnership with the University of Bath, has completed the Astrogazers project, which involved launching a weather balloon into space. On September 12, a team of girls from grades 5 through 11 successfully launched two meteorological balloons that ventured to an altitude of 32,380 m. The balloons carried essential equipment, including cameras, data loggers and GNSS receivers — all designed to explore how different materials respond to atmospheric conditions.
savvy navvy has partnered with ProtectedSeas to bring ProtectedSeas Navigator data to boaters through the savvy navvy app.
After eight years of research and development, boaters and watersport users worldwide can now have access to comprehensive data and resources of ocean regulatory information, including marine protection areas, through the savvy navvy app.
ProtectedSeas Navigator provides boaters with 22,000 marine protected and managed areas in more than 220 countries. These areas include speed-limit zones to protect marine mammals, fisheries management areas and more.
ProtectedSeas compiles marine protection information into the Navigator database of marine protected areas (MPAs). It collects both large and small amounts of data and created the first public digital maps for more than 2,400 areas.
savvy navvy – often referred to as ‘Google Maps for boats’ – is an award-winning boat navigation app. It integrates multiple sustainable data sources from different conservation agencies and bodies.
Since launching its first global view of marine life protections, ProtectedSeas has been complimented by several industry-renowned leaders and bodies, including the U.S. National Oceanic and Atmospheric Administration (NOAA), Dr. Sylvia Earle, American marine biologist and oceanographer, and Gavin Newsom, governor of California.
Some ProtectedSeas data is already available in the savvy navvy app, with more to follow soon. Click here to learn more about the sustainable data or to download the app.
IBM, a global technology provider, has released its latest geospatial artificial intelligence (AI) initiative to address climate change. These efforts involve collaborations across various regions and uses advanced AI models designed for geospatial applications.
Central to these initiatives is IBM’s geospatial foundation model, developed jointly with NASA. These models aim to generate environmental insights and solutions related to climate change. Unlike traditional AI models, these use a vast amount of climate-relevant data to accelerate the analysis of various environmental aspects that are affected by climate change.
“AI foundation models utilizing geospatial data can be a game-changer, allowing us to better understand and address climate-related events with unprecedented speed and efficiency,” said Alessandro Curioni, IBM fellow and vice president of Accelerated Discovery.
Analyzing urban heat islands in UAE
IBM and the Mohamed Bin Zayed University of Artificial Intelligence (MBZUAI) have partnered to map urban heat islands in Abu Dhabi using a fine-tuned version of IBM’s geospatial foundation model. The goal of the project is to understand the impact of local landscapes on temperature anomalies, the company said. The initial results show a decrease in heat island effects, which can provide valuable insights for future urban design strategies.
Reforestation and water sustainability in Kenya
In partnership with Kenya’s Special Envoy for Climate Change, Ali Mohamed, IBM is supporting the National Tree Growing and Restoration Campaign. The initiative aims to plant 15 billion trees by 2032, particularly in critical water tower areas affected by deforestation. IBM’s geospatial model powers a digital platform to track tree planting activities, aiding local efforts in restoring forests and measuring carbon sequestration impact.
Elevating climate resiliency in the UK
In collaboration with the Science and Technology Facilities Council (STFC) and Royal HaskoningDHV, IBM is developing AI-driven tools for climate risk assessment in the UK. These tools will focus on assessing weather impacts on aviation operations, the company said. Additionally, the TreesAI research project aims to map areas suitable for tree planting to mitigate surface water flooding and offer urban developers a digital planning platform.
IBM extends collaboration with NASA for weather forecasting
IBM and NASA have partnered to develop an AI foundation model dedicated to weather and climate applications. The collaboration aims to enhance the accuracy and speed of weather forecasting, predict wildfire conditions and understand meteorological phenomena. IBM researchers will work closely with NASA to train and validate this model, IBM said.
On Oct. 26, 2023, I participated in an American Society for Photogrammetry and Remote Sensing (ASPRS) Pacific Southwest Region Fall Technical webinar. The webinar provided an overview of the ASPRS Positional Accuracy Standards for Digital Geospatial Data (Edition 2, Version 1.0 – August 2023). The document can be downloaded here.
ASPRS Webinar Announcement. (Image: ASPRS)
I also participated — virtually — in the Nov. 2, 2023, California Spatial Reference Center (CSRC) Coordinating Council fall meeting where Dr. Riadh Munjy, California State University, Fresno, discussed the revisions to the ASPRS Positional Accuracy Standards for Geospatial Data.
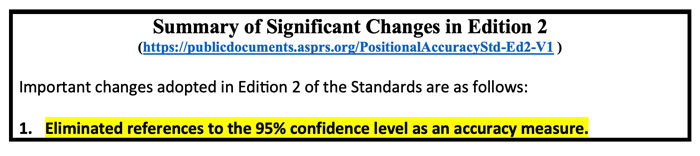
The most significant changes introduced in this second edition of the standards include:
Elimination of references to the 95% confidence level as an accuracy measure.
Relaxation of the accuracy requirement for ground control and checkpoints.
Consideration of survey checkpoint accuracy when computing final product accuracy.
Removal of the pass/fail requirement for Vegetated Vertical Accuracy (VVA) for lidar data.
Increase the minimum number of checkpoints required for product accuracy assessment from 20 to 30.
Limiting the maximum number of checkpoints for large projects to 120.
Introduction of a new term: three-dimensional positional accuracy.
Addition of Best Practices and Guidelines Addenda for:
General Best Practices and Guidelines
Field Surveying of Ground Control and Checkpoints
Mapping with Photogrammetry
Mapping with Lidar
Mapping with UAS
As outlined above, Edition 2 contains Best Practices and Guidelines for (1) General Best Practices and Guidelines and (2) Field Surveying of Ground Control and Checkpoints. The three addenda listed in the table of contents: Mapping with Photogrammetry, Mapping with Lidar, and Mapping with UAS will be available for public comment later, and will be added to Edition 2, Version 2.0.
Dr. Abdullah informed me that these addenda are on track to be put out for public comments during December 2023, therefore he believes they will probably be published in January or February 2024. The box titled “Summary of Significant Changes in Edition 2” provides the changes with the reason and justification for each change. The document can be downloaded from ASPRS here.
One of the changes is to relax the accuracy requirement for ground control and checkpoints. At first glance, this seems like the wrong thing to do. However, after understanding the justification, the requirement for ground truth still needs to be at least twice as accurate as the product.
Both Dr. Abdullah and Dr. Munjy’s emphasized in their presentations that the current accuracy requirements for ground controls in photogrammetric work of four-times better than the produced products, and the checkpoint accuracy requirement is three-times better than the assessed product. This makes it difficult, if it is not impossible, to use RTK-based techniques for this type of surveying. This by itself is not the reason for the change. During Dr. Abdullah’s presentation, he provided the following reasons for the change:
“Experience taught us that the requirements of four-times and three-times adopted in edition 1 of the standards are excessive and too restrictive, partly due to the reason outlined in (b) below.
Today’s sensors, software, and processing methodology are more accurate and the room for errors in the product is diminishing, therefore we do not need a safety factor of 3 or 4 to obtain accurate products.
Increasing demand for higher accuracy geospatial products.”
The new standards now factor in the accuracy of the survey checkpoints when determining the accuracy of the product. During Dr. Abdullah’s presentation, he provided the following reason for the change, “As we are producing more accurate products, errors in surveying techniques of the checkpoints used to assess product accuracy, although small, can no longer be neglected and it should be represented in computing the product accuracy.” He also highlighted that, “As product accuracy increases, the impact of error in checkpoints on the computed product accuracy increases.” The document provides equations used to compute the values. See below.
A very significant change, in my opinion, is the removal of the standards for Vegetated Vertical Accuracy (VVA) for lidar data. See below.
VVA not used as a criterion for acceptance. (Image: ASPRS)
I am not sure I agree with the reasoning, but I understand why it was done. GNSS-based surveys do not perform well in vegetated areas, and this is the technology used to validate the non-vegetated vertical accuracies (NVA). That said, there are non-GNSS technologies — sometimes denoted as traditional surveying methods — that could be used to validate VVA, so this seems like an elimination of a requirement based on the limitation of a particular technology.
Traditional surveying methods that use geodetic levels, theodolites, and total stations to measure distances, angles, and heights are still used by surveyors to perform certain projects. Since there are other surveying methods that could be used for evaluating the VVA, it does not seem like a valid reason for a change.
The ASPRS standards does state that, “for projects where vegetated terrain is dominant, the data producer and the client may agree on an acceptable threshold for the VVA.” Therefore, the client can require the surveyor to meet a specific accuracy level for vegetated areas. I am sure this was discussed during the working meeting, so I leave it to the experts to make the appropriate decisions and recommendations.
Finally, it should be noted that, as discussed above, the new ASPRS standards eliminated the reference to the 95% confidence level as an accuracy measure. The document provides the following statement about the National Standard for Spatial Data Accuracy (NSSDA):
“The National Standard for Spatial Data Accuracy (NSSDA) documents the equations for the computation of RMSEX, RMSEY, RMSER and RMSEZ, as well as horizontal (radial) and vertical accuracies at the 95% confidence levels — AccuracyR and AccuracyZ, respectively. These statistics assume that errors approximate a normal error distribution and that the mean error is small relative to the target accuracy. The ASPRS Positional Accuracy Standards for Digital Geospatial Data reporting methodology is based on RMSE alone, and thus differs from the NSSDA reporting methodology. Additionally, these Standards include error inherited from ground control and checkpoints in the computed final product accuracy.”
Appendix D of the ASPRS document provides the equations with an example for computing the accuracy statistics. The document also has a section with examples for users who wish to relate the ASPRS 2023 Standards to the FGDC National Standard for Spatial Data Accuracy (NSSDA).
Dr. Munjy ended his presentation at the CSRS 2023 fall meeting with the following statements:
“ASPRS Accuracy Standards 2023 have become more aligned with science and statistical theory,” and “These Standards are intended to be a living document which can be updated in future editions to reflect changing technologies and user needs.”
I would encourage all users to download the document to better understand the changes and reasons for the changes. It can be downloaded here.
Hexagon’s Safety, Infrastructure & Geospatial division has partnered with Pitkin County Regional Emergency Dispatch Center to upgrade its digital mapping and response for 911 calls in Colorado’s premier mountain tourist destination. The partnership aims to make the county safer for residents and visitors.
By using HxGN Connect software, Pitkin County can bring modern mapping capabilities to its computer-aided dispatch (CAD) system, as well as incorporate Smart Advisor, Hexagon’s assistive artificial intelligence solution.
Pitkin County, home of Aspen and its four major ski areas, hosts 1.5 million tourists per year. The upgrades will improve emergency response capabilities for major events such as the X Games and JAS Aspen music festival, the company says.
The cloud-based solution, hosted in Microsoft Azure, is designed to map 911 calls and conduct long-term resource planning. Smart Advisor will work in the background to help dispatchers and first responders connect related incidents and provide geofencing to concentrate resources on large events. Officials plan to expand the system to take advantage of its cross-organization collaboration capabilities by potentially linking the county’s CAD system with the fire department’s network of mountaintop smoke detectors and the Department of Public Works’ snowplows.
Pitkin County dispatchers will use HxGN Connect for digital mapping within its CAD system in the mountainous tourist destination.
The Global Positioning System (GPS) project started 50 years ago, in 1973. I was fortunate to be part of incorporating GPS into the National Spatial Reference System (NSRS) when I worked for the National Geodetic Survey (NGS). GPS was not considered operational until 1993, but NGS started performing GPS surveys in 1983. Geodetic control surveys that formerly took six to 12 months to perform using classical methods could be performed with GPS in a few weeks using fewer personnel and resources. It changed the way NGS and others performed their surveying operations.
While one group in NGS was developing programs to evaluate and compute coordinates using GPS, another NGS group was completing the readjustment of the North American Datum of 1983 [NAD83 (1986)]. The analysis of GPS indicated that some of the latitude and longitude values estimated using GPS did not agree with the published NAD83 coordinates. The classical techniques used a triangulateration process (involving angles and distances) that required several triangles to connect two stations that were not intervisible. GPS, on the other hand, could directly measure the distance between the two stations, resulting in more accurate coordinate differences.
To support surveyors, NGS, working with other federal agencies under the auspices of the Federal Geodetic Control Subcommittee (FGCS), developed a GPS test network in the Washington, D.C., area to demonstrate whether a specific manufacturer’s GPS receiver and associated geodetic post-processing software was an accurate relative positioning satellite survey system. This facilitated the use of GPS for incorporating geodetic control in the NSRS. As mentioned above, GPS surveys exposed many inconsistencies between existing NAD83 (1986) control. Organizations such as NGS and state transportation departments that performed control surveys used GPS as soon as equipment met the federal testing requirements because it was more efficient and cost-effective than classical techniques. This led individual states to perform statewide geodetic network projects to upgrade their NAD 83 (1986) coordinates. These surveys were ultimately designated as High Accuracy Reference Networks (HARN).
In the beginning, the attitude of the individual surveyor accepting GPS was one of “trust after verifying.” Many surveyors considered it to be a “black box” that could not be trusted. Surveyors were accustomed to having angles and distances they could write down and check the results. Also, there were some key challenges and limitations of using GPS for surveying in the early days. This included the cost and size of the equipment, the peripheral devices required, the power requirements (including 12v car batteries and generators), “black box” computer processing software, obstructions near monuments, and limited visibility of GPS satellites.
Prior to GPS becoming fully operational, some surveys had to be performed in the middle of the night to have four or more satellites visible during the observing session. This required a significant amount of technical planning, which sometimes required complicated logistics for coordinating observing sessions. Also, at that time, most private surveyors did not perform control projects, so even though GPS may be more accurate, it was not more cost-effective than classical techniques for their typical projects.
Over time, after GPS became operational, more surveyors (and other professionals) embraced using GPS after the cost of receivers decreased, user-friendly processing software became available (e.g., NGS OPUS), Continuously Operating Reference Stations were densified (e.g., NOAA CORS), and statewide Real-Time Networks (RTN) were established (e.g., North Carolina RTN). GPS technology now underpins many sciences, large areas of engineering (such as driverless vehicles and UAVs), navigation, and precision agriculture. GPS (today GNSS) and its applications have changed the way surveyors and geospatial users perform their work, and the world has seen the development of applications that were not ever imagined 50 years ago.
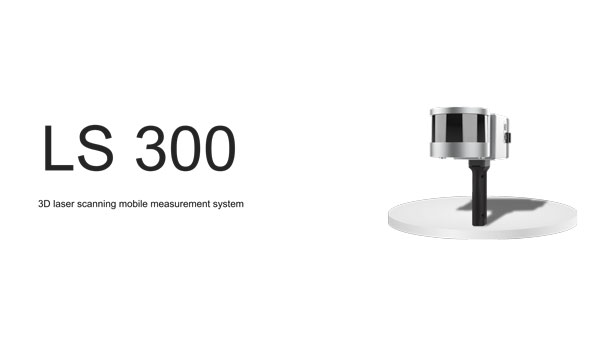
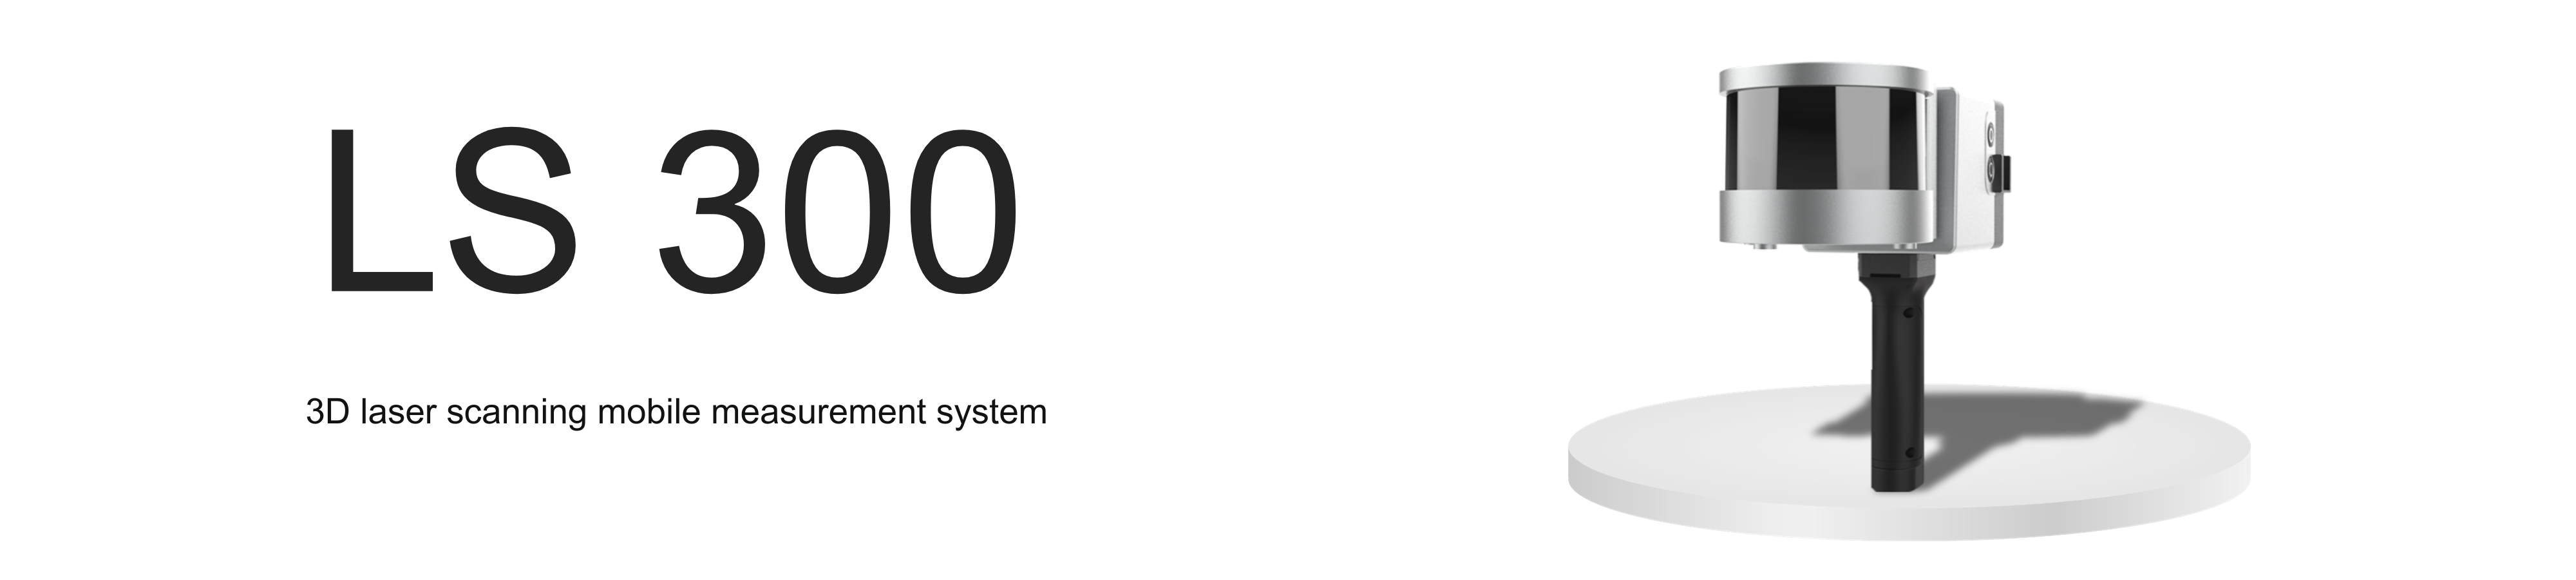
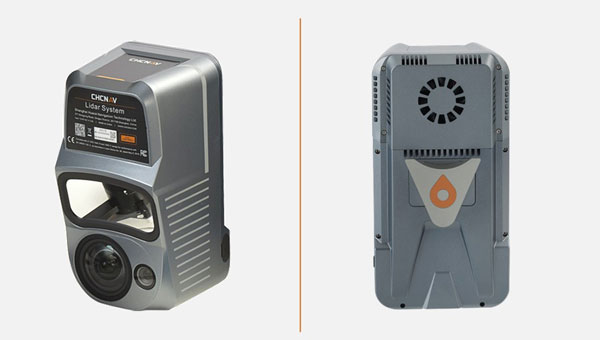
ComNav Technology has released the LS300 3D laser scanning measurement system.
The scanner utilizes simultaneous localization and mapping (SLAM) technology, and advanced real time and mapping techniques. It operates autonomously, independent of GNSS positioning, which makes it ideal for harsh conditions in both indoor and outdoor environments.
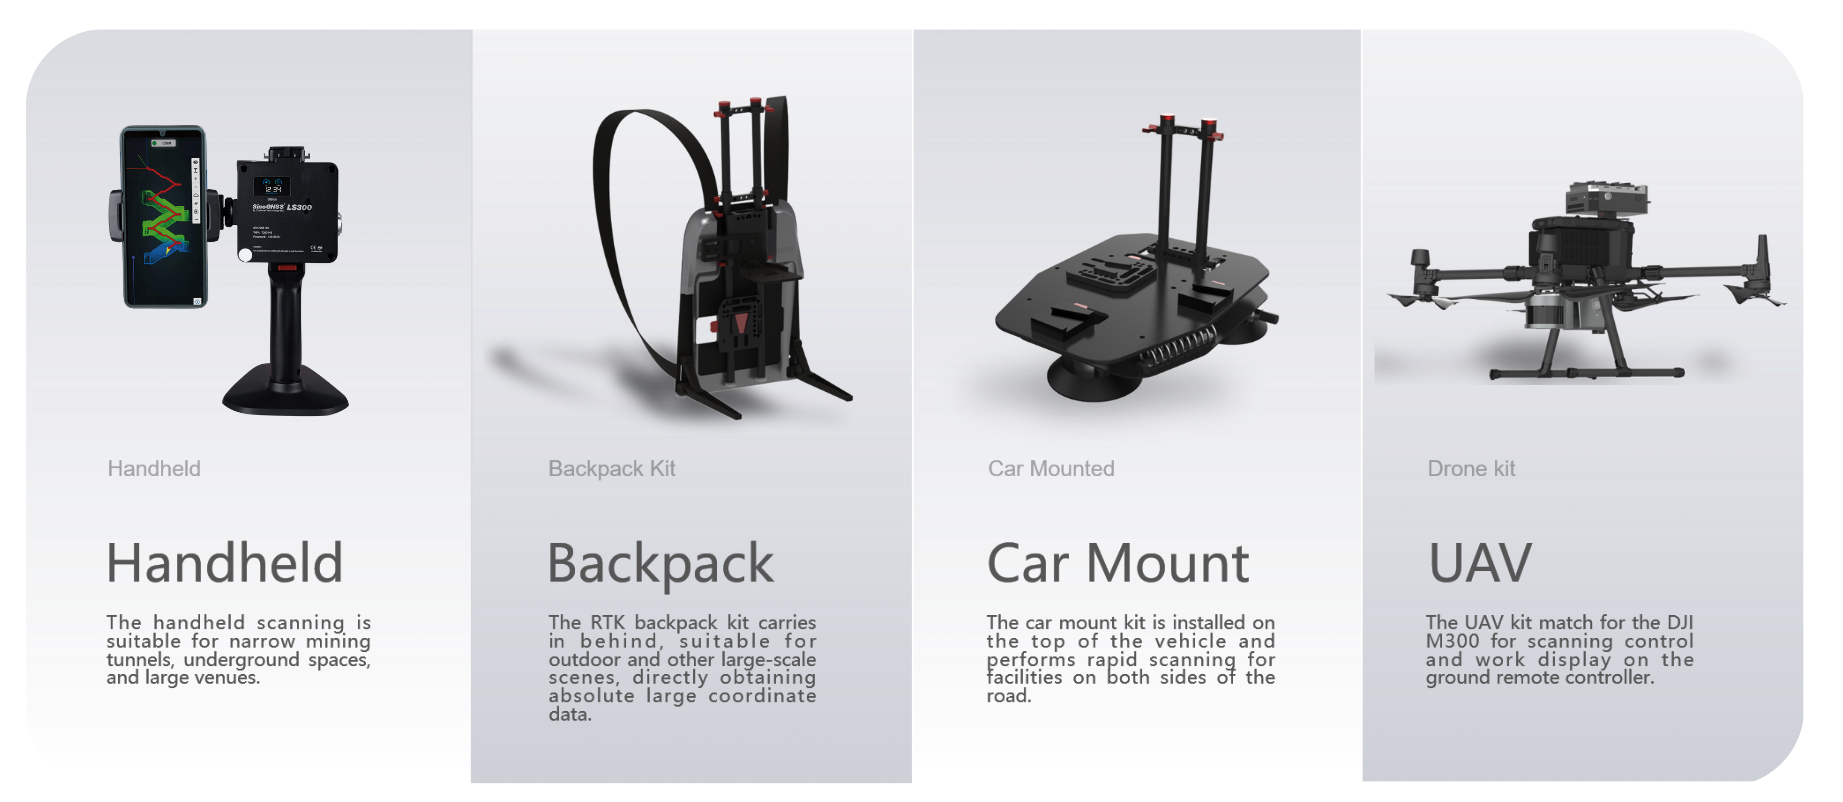
LS300 includes a 120-meter working range and a high sampling rate of 0.32 million points per second. Its point cloud accuracy is designed to perform in low reflectivity extended-range mode. The system is compatible with specialized kits, including the handheld form, back kit, car-mount and UAV kit.
Image: ComNav Technology
The handheld mode is best suited for navigating narrow tunnels and large venues, while the backpack is designed for outdoor environments. The car mount can rapidly scan roadside facilities, and the UAV kit seamlessly pairs with the DJI M300 for aerial control. The LS 300 is suitable for a variety of applications, including smart city, digitization of underground facilities, geology, surveying and mapping, agriculture, mining and forestry.
The scanner uses a unique hybrid HSL technology. This allows for preliminary processing during the scanning process, which aims to accelerates the collection of high-precision data and expedites data processing. It offers real-time viewing of point cloud data through a mobile application and supports multiple interaction modes.
By using data processing software specifically designed and developed for the LS series by ComNav, users can handle large volumes of point cloud data and simplify complex tasks, including point cloud denoising, point cloud splicing, shadow rendering, coordinate transformation, automatic horizontal plane fitting, automatic point cloud data report generation, forward photography, and point cloud encapsulation. This allows users to efficiently process intricate point cloud data, resulting in precise measurement and modeling outcomes.
During data post-processing, users can input absolute coordinates of control points, which allows these control points to make comprehensive adjustments to the data and improve scanning data accuracy.
The LS300 also incorporates a redundant battery design with two hot-swappable batteries, designed for prolonged operation without frequent charging or interruptions. This innovative approach contributes to enhanced safety, reliability, and efficiency, the company says.
Originally developed for navigation and timing applications, signals from global navigation satellite systems (GNSS) are now commonly used for geophysical remote sensing applications, including observation of Earth’s surface and atmosphere using near sea-level ground stations as well as mountaintop, airborne and spaceborne platforms. GNSS reflectometry (abbreviated GNSS-R), which is the technique of using reflected signals to measure properties of Earth’s surface, has been a growing area of research and application for GNSS remote sensing. Notably, the Cyclone Global Navigation Satellite System (CYGNSS) satellite mission produces delay-Doppler maps (DDMs) that are used to monitor ocean surface wind speeds during hurricanes. Meanwhile, terrestrial and airborne GNSS-R has been used to monitor soil moisture, snow depth and vegetation growth. One area of increasing interest is precision reflectometry using signal carrier-phase measurements. The first attempt to perform precision (phase) altimetry over sea ice using GPS reflectometry measurements from the low-Earth orbiting TechDemoSat-1 was reported by researchers in 2017. Subsequently, researchers demonstrated the use of reflections collected by a Spire satellite to perform altimetry over Hudson Bay and the Java Sea and how reflections off ice in the polar regions can be used to measure ionospheric total electron content over the polar caps. While these demonstrations of GNSS-R for precision carrier-phase-based reflectometry are promising, more work needs to be done to characterize when carrier-based altimetry is feasible and what challenges it faces.
To study the challenges associated with processing reflected and low-elevation-angle radio occultation signals, the University of Colorado (CU) Boulder Satellite Navigation and Sensing (SeNSe) Laboratory has deployed a GNSS data collection site on top of Mount Haleakalā on the island of Maui, Hawaii. Recent collection campaigns aim to use this site as a testbed for GNSS-R algorithms that utilize multi-frequency and multi-polarization measurements. Previously, we carried out delay map processing for left-hand circular (LHC) and right-hand circular (RHC) polarizations for L1 and L2 GPS signals. Those results validate the open-loop processing methodology and provide an initial assessment of the data quality. We observed that the received reflected signals show deep and rapid fading in amplitude. In the work reported in this article, we extend our assessment to triple-frequency GPS (L1CA, L2C, L5Q) signals and document our methodology for extraction of the signal carrier phase. Our initial results indicate that coherent signal phase extraction is challenging, and may not be feasible for this particular experiment setup. We discuss ways in which the experiment may be improved for the purpose of obtaining coherent ocean surface reflections in the future.
EXPERIMENT BACKGROUND
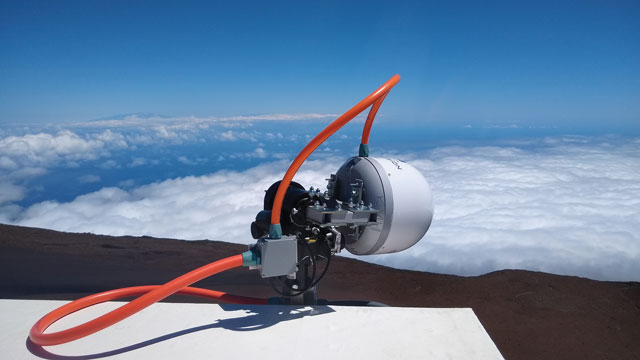
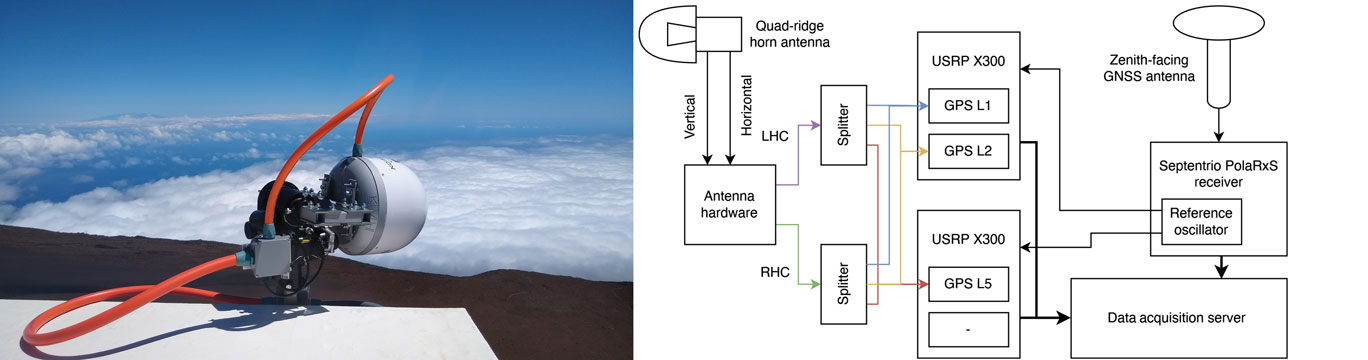
The current form of the CU SeNSe Lab Mount Haleakalā GNSS experiment was deployed in June 2020. It consists of a side-facing dual-polarization horn antenna, which is shown in the left panel of FIGURE 1, along with a zenith-facing reference antenna. The horizontally- and vertically-polarized wideband signals from the horn antenna are fed into front-end hardware and are combined using 90-degree phase combiners to form LHC and RHC polarized signals, which are then recorded by a set of Ettus Universal Software Radio Peripherals (USRPs). Meanwhile, the signal from the reference antenna is sent to a Septentrio PolaRxS receiver. The right panel in Figure 1 illustrates the system setup. Note that the Septentrio onboard oven-controlled crystal oscillator is used to drive the USRPs. This allows us to use the Septentrio outputs to estimate the receiver clock variations and use them in the receiver clock component of our open-loop models, which we discuss below.
Figure 1: The side-facing horn antenna in its radome enclosure (left panel) and the hardware block diagram of the data collection system (right panel). (All figures provided by the authors)
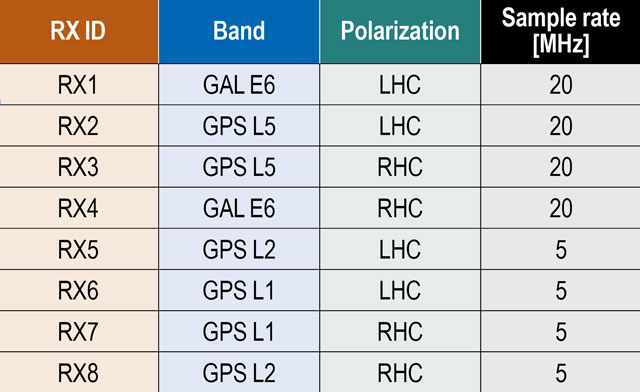
Each USRP can record up to four signals at two different mixdown frequencies, allowing for recording of both the RHC and LHC polarized signals on up to four different bands. The first USRP records the L1 and L2 bands with center frequencies at 1575.42 and 1227.6 MHz, respectively, at a bandwidth of 5 MHz. The second USRP records the L5 and E6/B3 bands at center frequencies of 1176.45 and 1271.25 MHz and at a 20 MHz bandwidth. TABLE 1 lists the IDs for each receive channel along with its corresponding band, polarization and sampling rate. Note that the recorded signals covering the E6 band also capture BeiDou B3 signals, but we restrict our analysis to GPS L1, L2 and L5 signals in this article. The samples from these USRPs are written to disk along with the Septentrio Binary Format (SBF) output of the PolaRxS receiver.
Table 1: Receiver IDs with corresponding band and polarization.
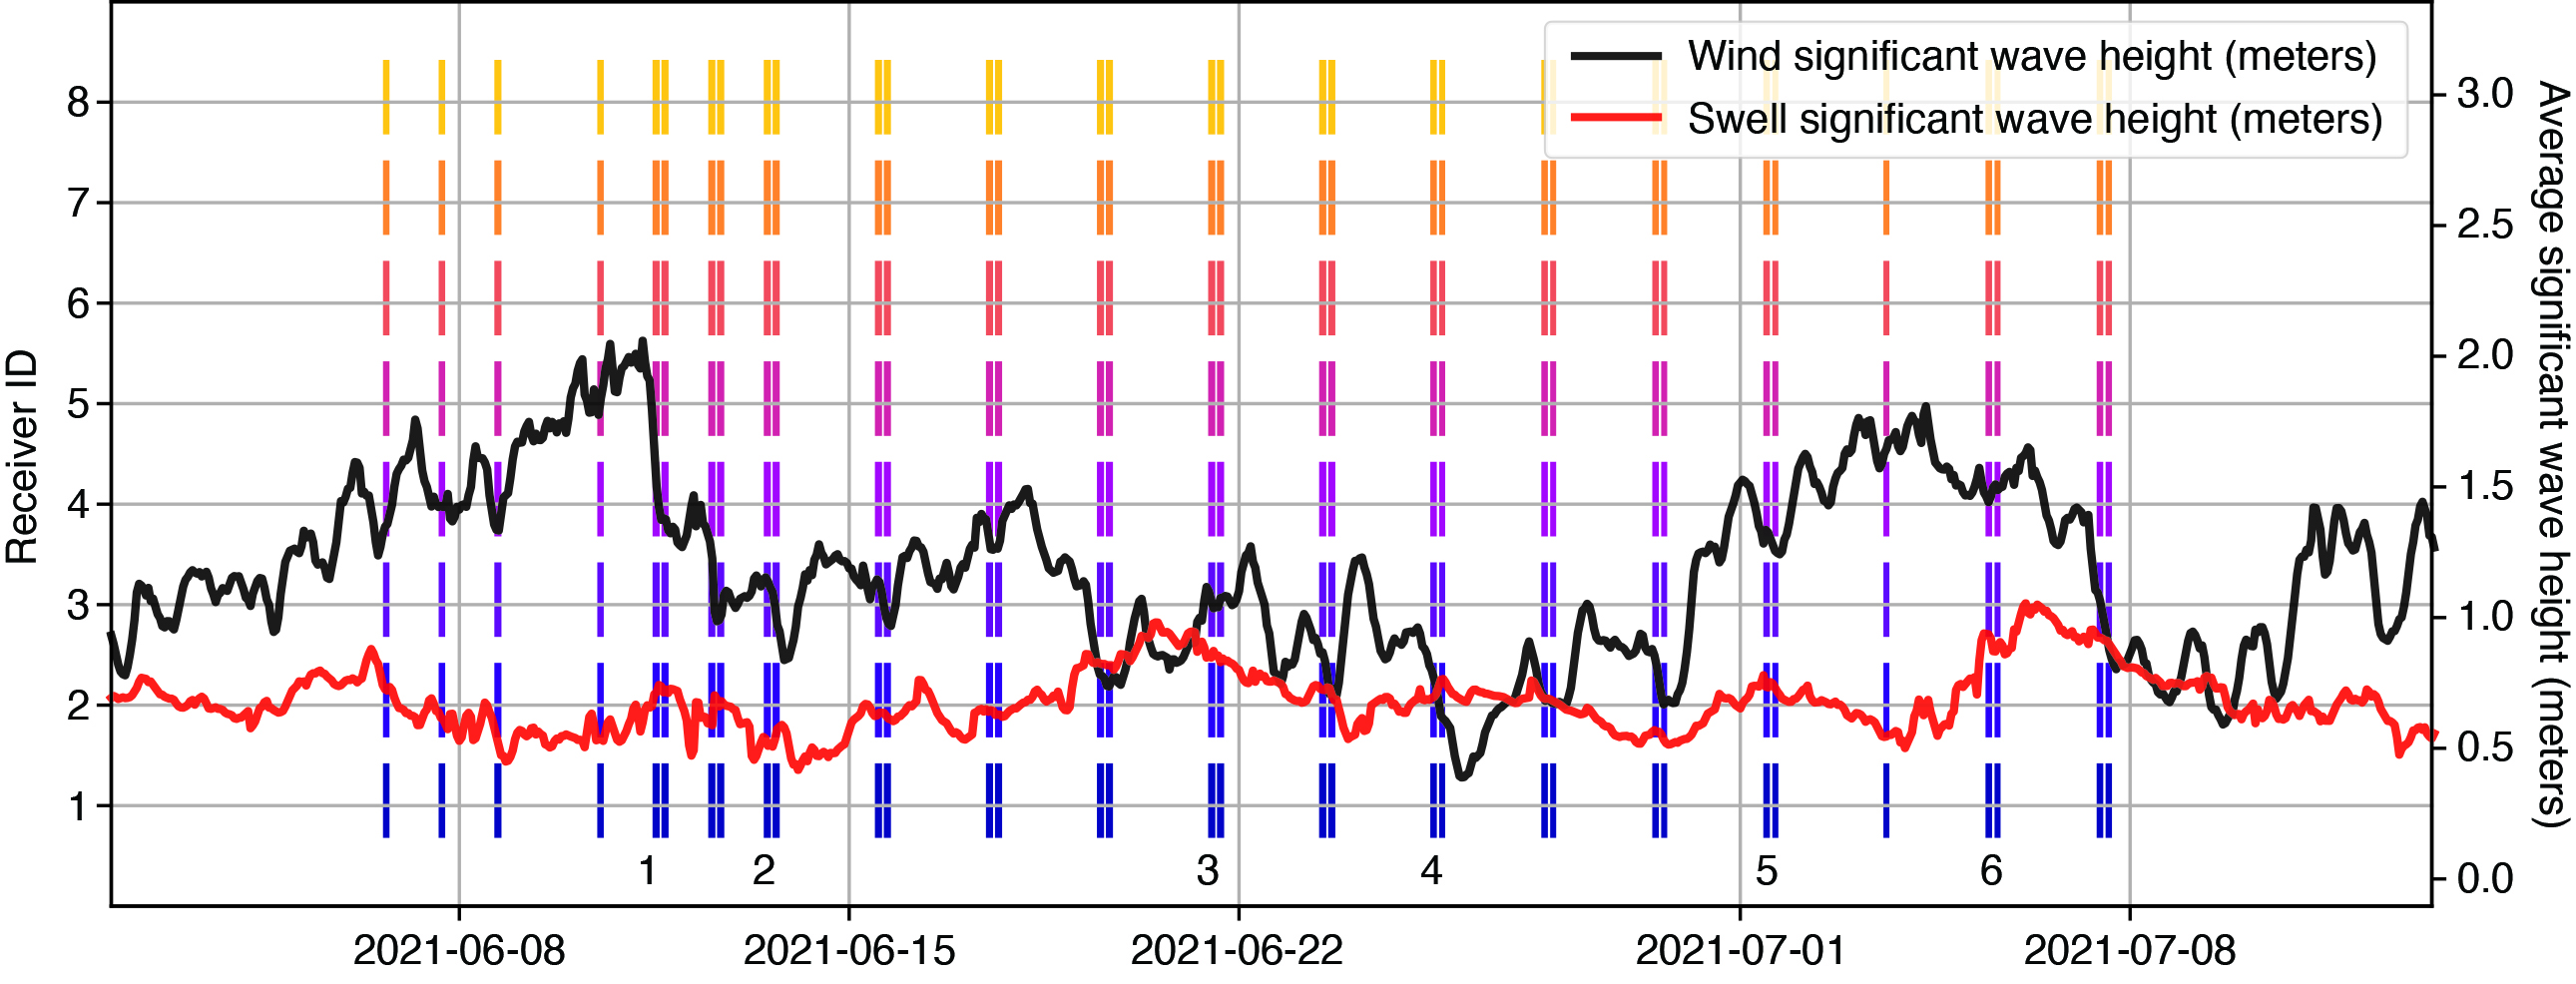
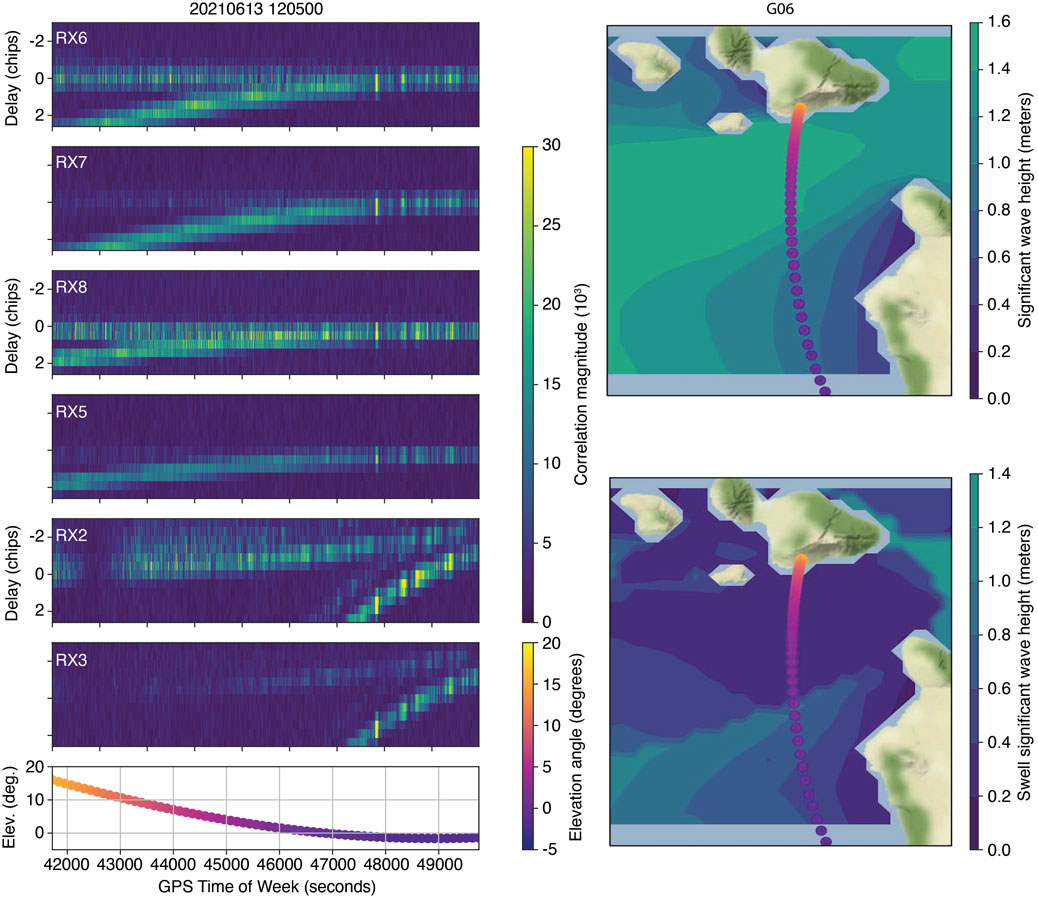
Starting in June 2021, periodic collections were taken for around one hour at a time, which is about the amount of time it takes for a GPS satellite to pass from an elevation angle of 0 degrees to one of more than 20 degrees. The collection times were adjusted to target the passes of satellites whose specular reflection point passed within the azimuthal range of the horn antenna, which faces roughly to the south and has a beam width of around 60 degrees. FIGURE 2 summarizes the available datasets from the first month of collections. The right-most panels of FIGURE 3 show examples of the specular track for GPS PRN 6 as it sets over the horizon on June 13, 2022, at around 12:00-13:00 UT. This is the pass on which we focus in this work, since PRN 6 transmits the L1CA, L2C and L5 signals and consistently had a specular point in our region of interest.
Figure 2: Available data during the first month of collections. The average significant wave height in the region south of Haleakalā is also plotted. Numbers near the bottom indicate the datasets analyzed for this article.
METHODOLOGY
Our processing method for open-loop tracking of the reflected GNSS signals is based on our previous work in which we produced DDMs and delay maps of the signal-to-noise ratio (SNR) measurements for multiple signal frequencies and received polarizations.
Pseudorange Model. We start by generating a model of the pseudorange for both the direct and reflected signal. The model only needs to be accurate down to the chip level, since we correlate across several chips of delay for the received signals. Setting a somewhat arbitrary accuracy requirement of 0.5 chips (equivalent to a delay of around 150 meters for L1CA/L2C or 15 meters for L5 signals), allows us to ignore path delays from the ionosphere and troposphere, which should only account for up to several meters of delay. The model has three terms that we estimate relative to GPS System Time (GPST): the receiver clock error, the satellite transmitter clock error and the geometric range. We use a surveyed position of the horn antenna along with International GNSS Service precise orbit and clock products for the transmitter clock error and positions. These allow us to compute the transmitter clock error and path delay for the direct signal. The reflected signal path delay can be found by computing the specular reflection point on the WGS84 ellipsoid and adding the distances from the transmitter to the specular point and the specular point to the receiver. The remaining term to estimate is the receiver clock error. Recall that our USRPs are driven by the Septentrio internal oscillator. Therefore, the clock error in Septentrio measurements is associated with variations in the reference oscillator for the USRPs. We utilize a geodetic detrending technique to estimate these clock variations and apply them to our pseudorange model. To construct the full receiver clock error, we estimate the time-alignment of the samples near the beginning of the collections to GPST by tracking one minute of a strong, mid-elevation-angle satellite and decoding its timing information. This provides us with an estimate of GPST at the start of the file, which we can use to construct a full estimate of the GPST at any sample in the file. Also, given our pseudorange model, we can find the received code phase and the Doppler frequency.
Figure 3: Example of delay maps from GPS PRN 6. The panels to the left show delay maps for the L1CA, L2C and L5 signals, both RHC and LHC polarizations. The bottom panel shows the corresponding elevation angle over the duration of the pass. The maps to the right show the specular point location during the pass, along with a contour of the WW3 model for significant wave height and swell-significant wave height.
Signal Correlation. Using the established code phase and Doppler models, we generate correlations for both reflected and direct signals. We correlate a reference signal over each 1-millisecond interval, and for sanity-checking purposes, we compute correlations over ± 3 chips at 0.5 chip spacing. This results in in-phase and quadrature (I/Q) correlation outputs every 1 millisecond. The left panels in Figure 3 show examples of the processed reflected signals for RHC and LHC polarization L1CA, L2C and L5Q signals from PRN 6 on June 13, 2021, at 12:00-13:00 UT. Note that as the satellite sets, at around 4 degrees elevation angle, the reflected signals merge with the stronger direct signal on the L1 and L2 signals. This happens later on L5 due to its higher bandwidth. We use the 0.0 chip bin to obtain I/Q outputs for carrier-phase processing for L1 and L2. For L5, we use the 0.0, -0.5, or -1.0 chip bin to account for model mismatch toward the end of the file.
Signal Fading and the WW3 Ocean Model. An eventual goal of the Haleakalā reflectometry experiment is to compare the characteristics of processed reflected signals with the ocean surface parameters near the specular point and glistening zone. To this end, we have incorporated data from the Hawaii regional WaveWatcher 3 (WW3) model. The model outputs information about wave height, direction and period due to both wind and swell, and has a resolution of around 5 kilometers. The data from this model is available in NetCDF format from several web services. The right panels of Figure 3 show contours of the wind- and swell-significant wave height in the South Haleakalā region. Meanwhile, note that the reflected signals (left panels) show high variability in the received power throughout the duration of the collection. While we hoped to be able to immediately observe a correlation between these wave parameters and the power fluctuations, it is clear that we need additional processing to tease out such a signal, and the changing satellite geometry will likely make this difficult to observe and validate. Even still, our results at the end of this article will show that there is likely some correlation between fading and wind parameters, though to what extent is unknown. Finally, note that the LHC polarizations (RX6, RX8, RX2) show much stronger reflected signals than the RHC polarizations. Since we are interested in processing the phase for the reflected signals, we report exclusively on the use of the LHC polarization signals in the rest of this article.
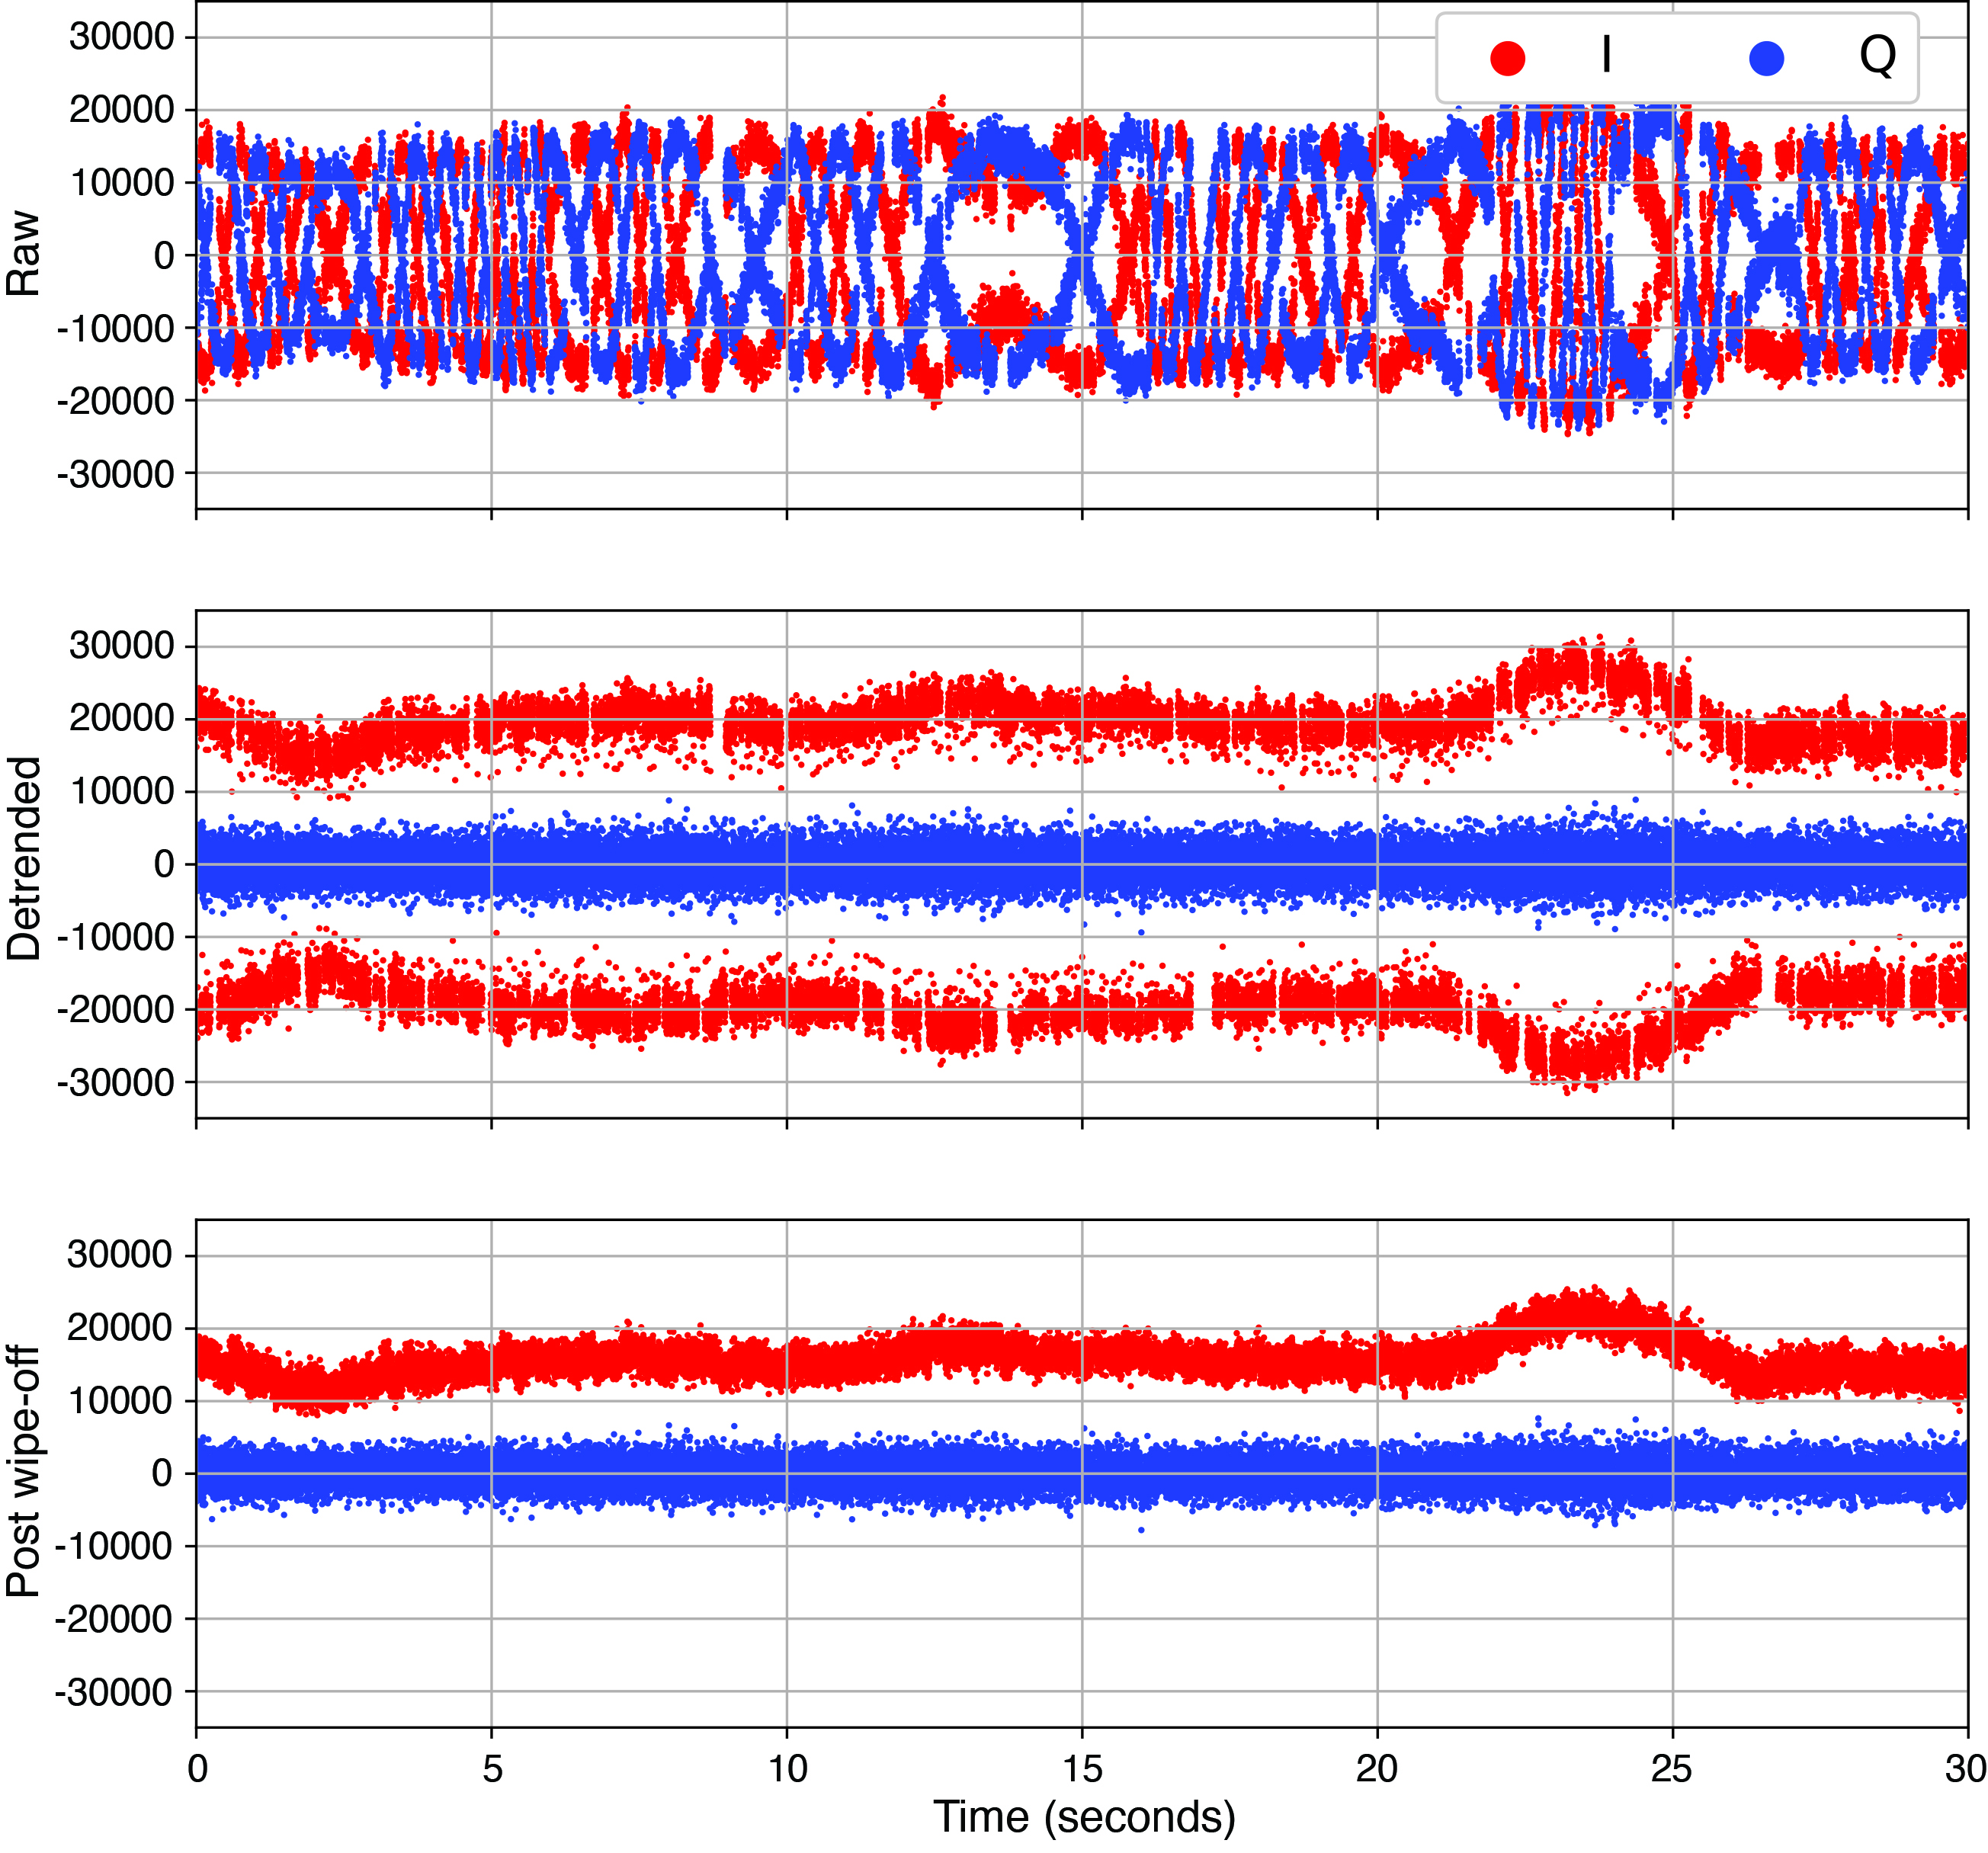
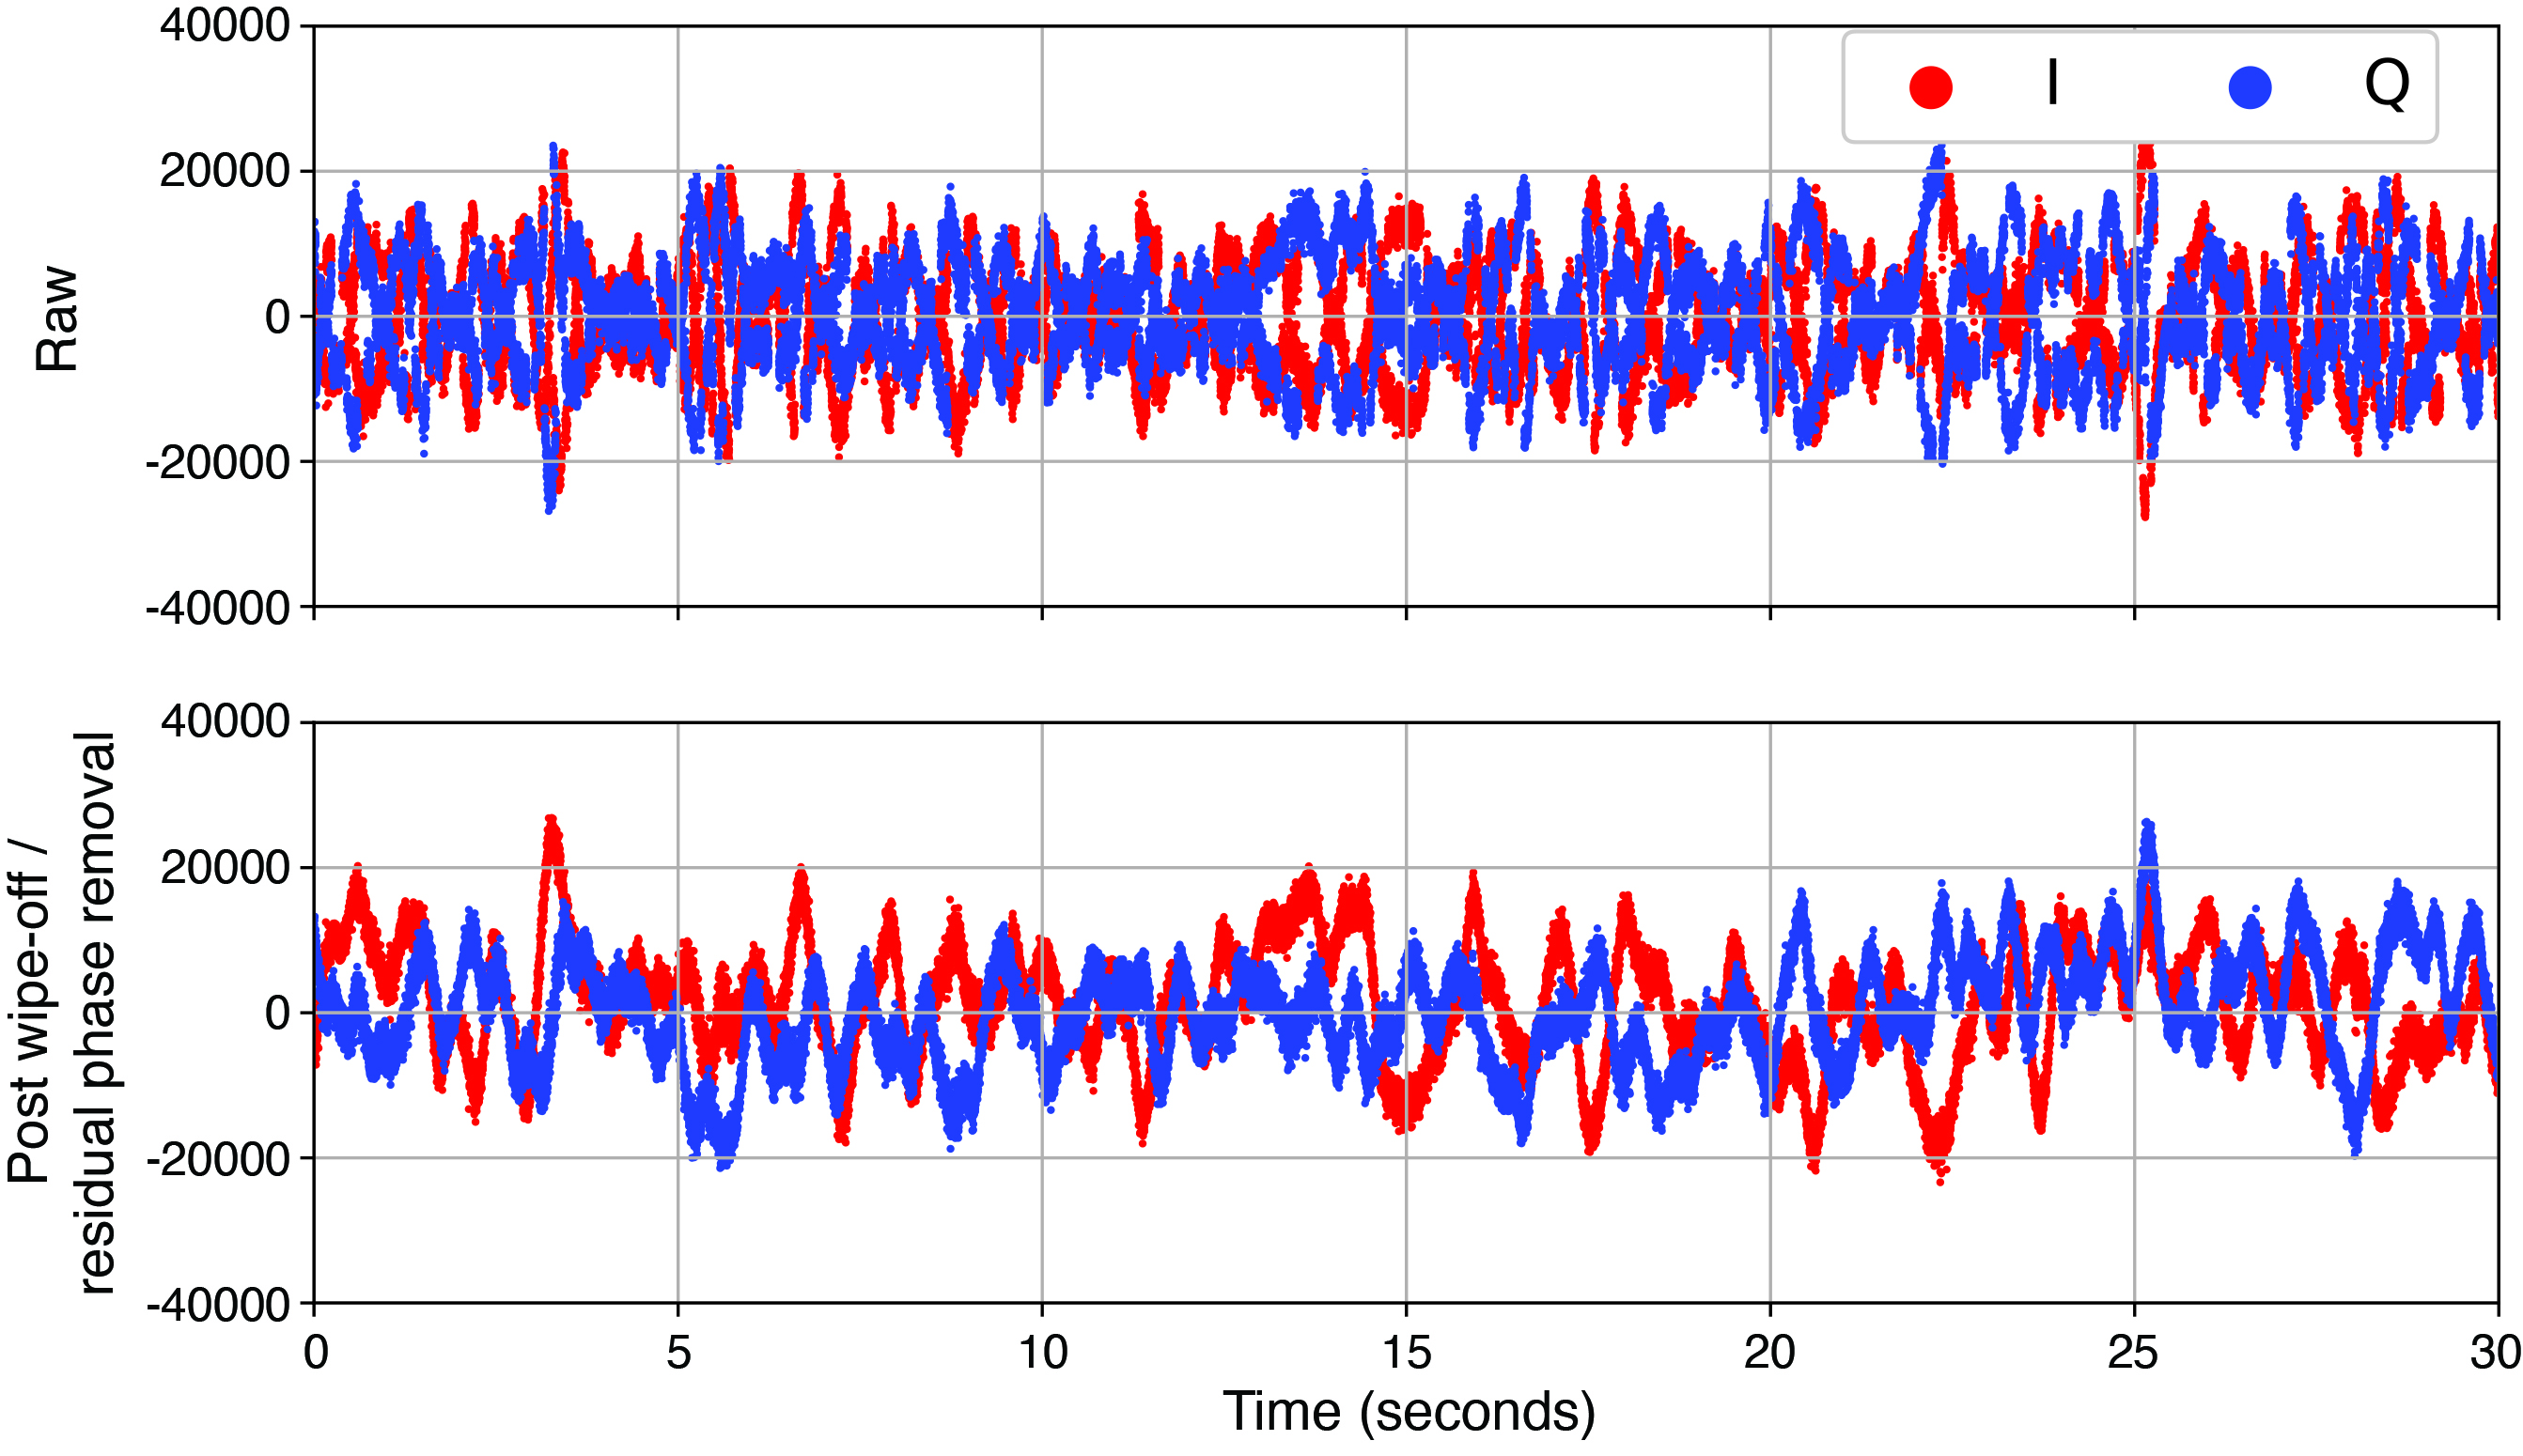
Carrier-Phase Processing. Once the correlations are performed, we take the I/Q correlations for both direct and reflected signals and process them to retrieve the cleaned reflected signal phase. The first series of steps in this process involve processing the direct signal to determine navigation / overlay symbol alignment and to estimate any residual phase fluctuations, which are mostly due to unmodeled receiver clock fluctuations. FIGURE 4 illustrates this process for the L1CA signal. The raw I/Q correlations are shown in the top panel. To these we apply a Costas phase-lock loop (PLL) to track the residual phase fluctuations without being sensitive to navigation / overlay symbol transitions. Next, we remove these residual phase fluctuations to obtain the detrended I/Q values.
Figure 4: The I/Q data cleaning process for the L1CA direct signal.
As shown in the second panel, these quadrature components of the detrended I/Q values are centered at zero while the in-phase component now shows the data bits / overlay symbols. We use the detrended I/Q values to estimate the navigation bit sequence on the L1CA and L2C signals. Likewise, we estimate the alignment of the Neumann-Hoffmann overlay sequence for the L5 signal. Finally, we wipe off the estimated data bits or overlay sequence to verify the procedure. The results of wiping off the estimated navigation bits for the L1CA signal are shown in the third panel of Figure 4.
Having obtained the residual phase fluctuations and navigation / overlay symbols for the direct signal, we next apply these to clean up the reflected signal. Specifically, we remove residual phase fluctuations from the raw reflected signal I/Q values and then wipe off the corresponding navigation bits or overlay code. FIGURE 5 shows an example of the reflected I/Q data before and after this procedure. The navigation bits are clearly removed, but the reflected signal still shows fairly significant fluctuations in the cleaned I/Q values. It is from these values that we hope to extract the residual reflected signal phase.
Figure 5: The reflected signal raw I/Q (top) and the I/Q after detrending and wiping off navigation bits for the L1CA signal.
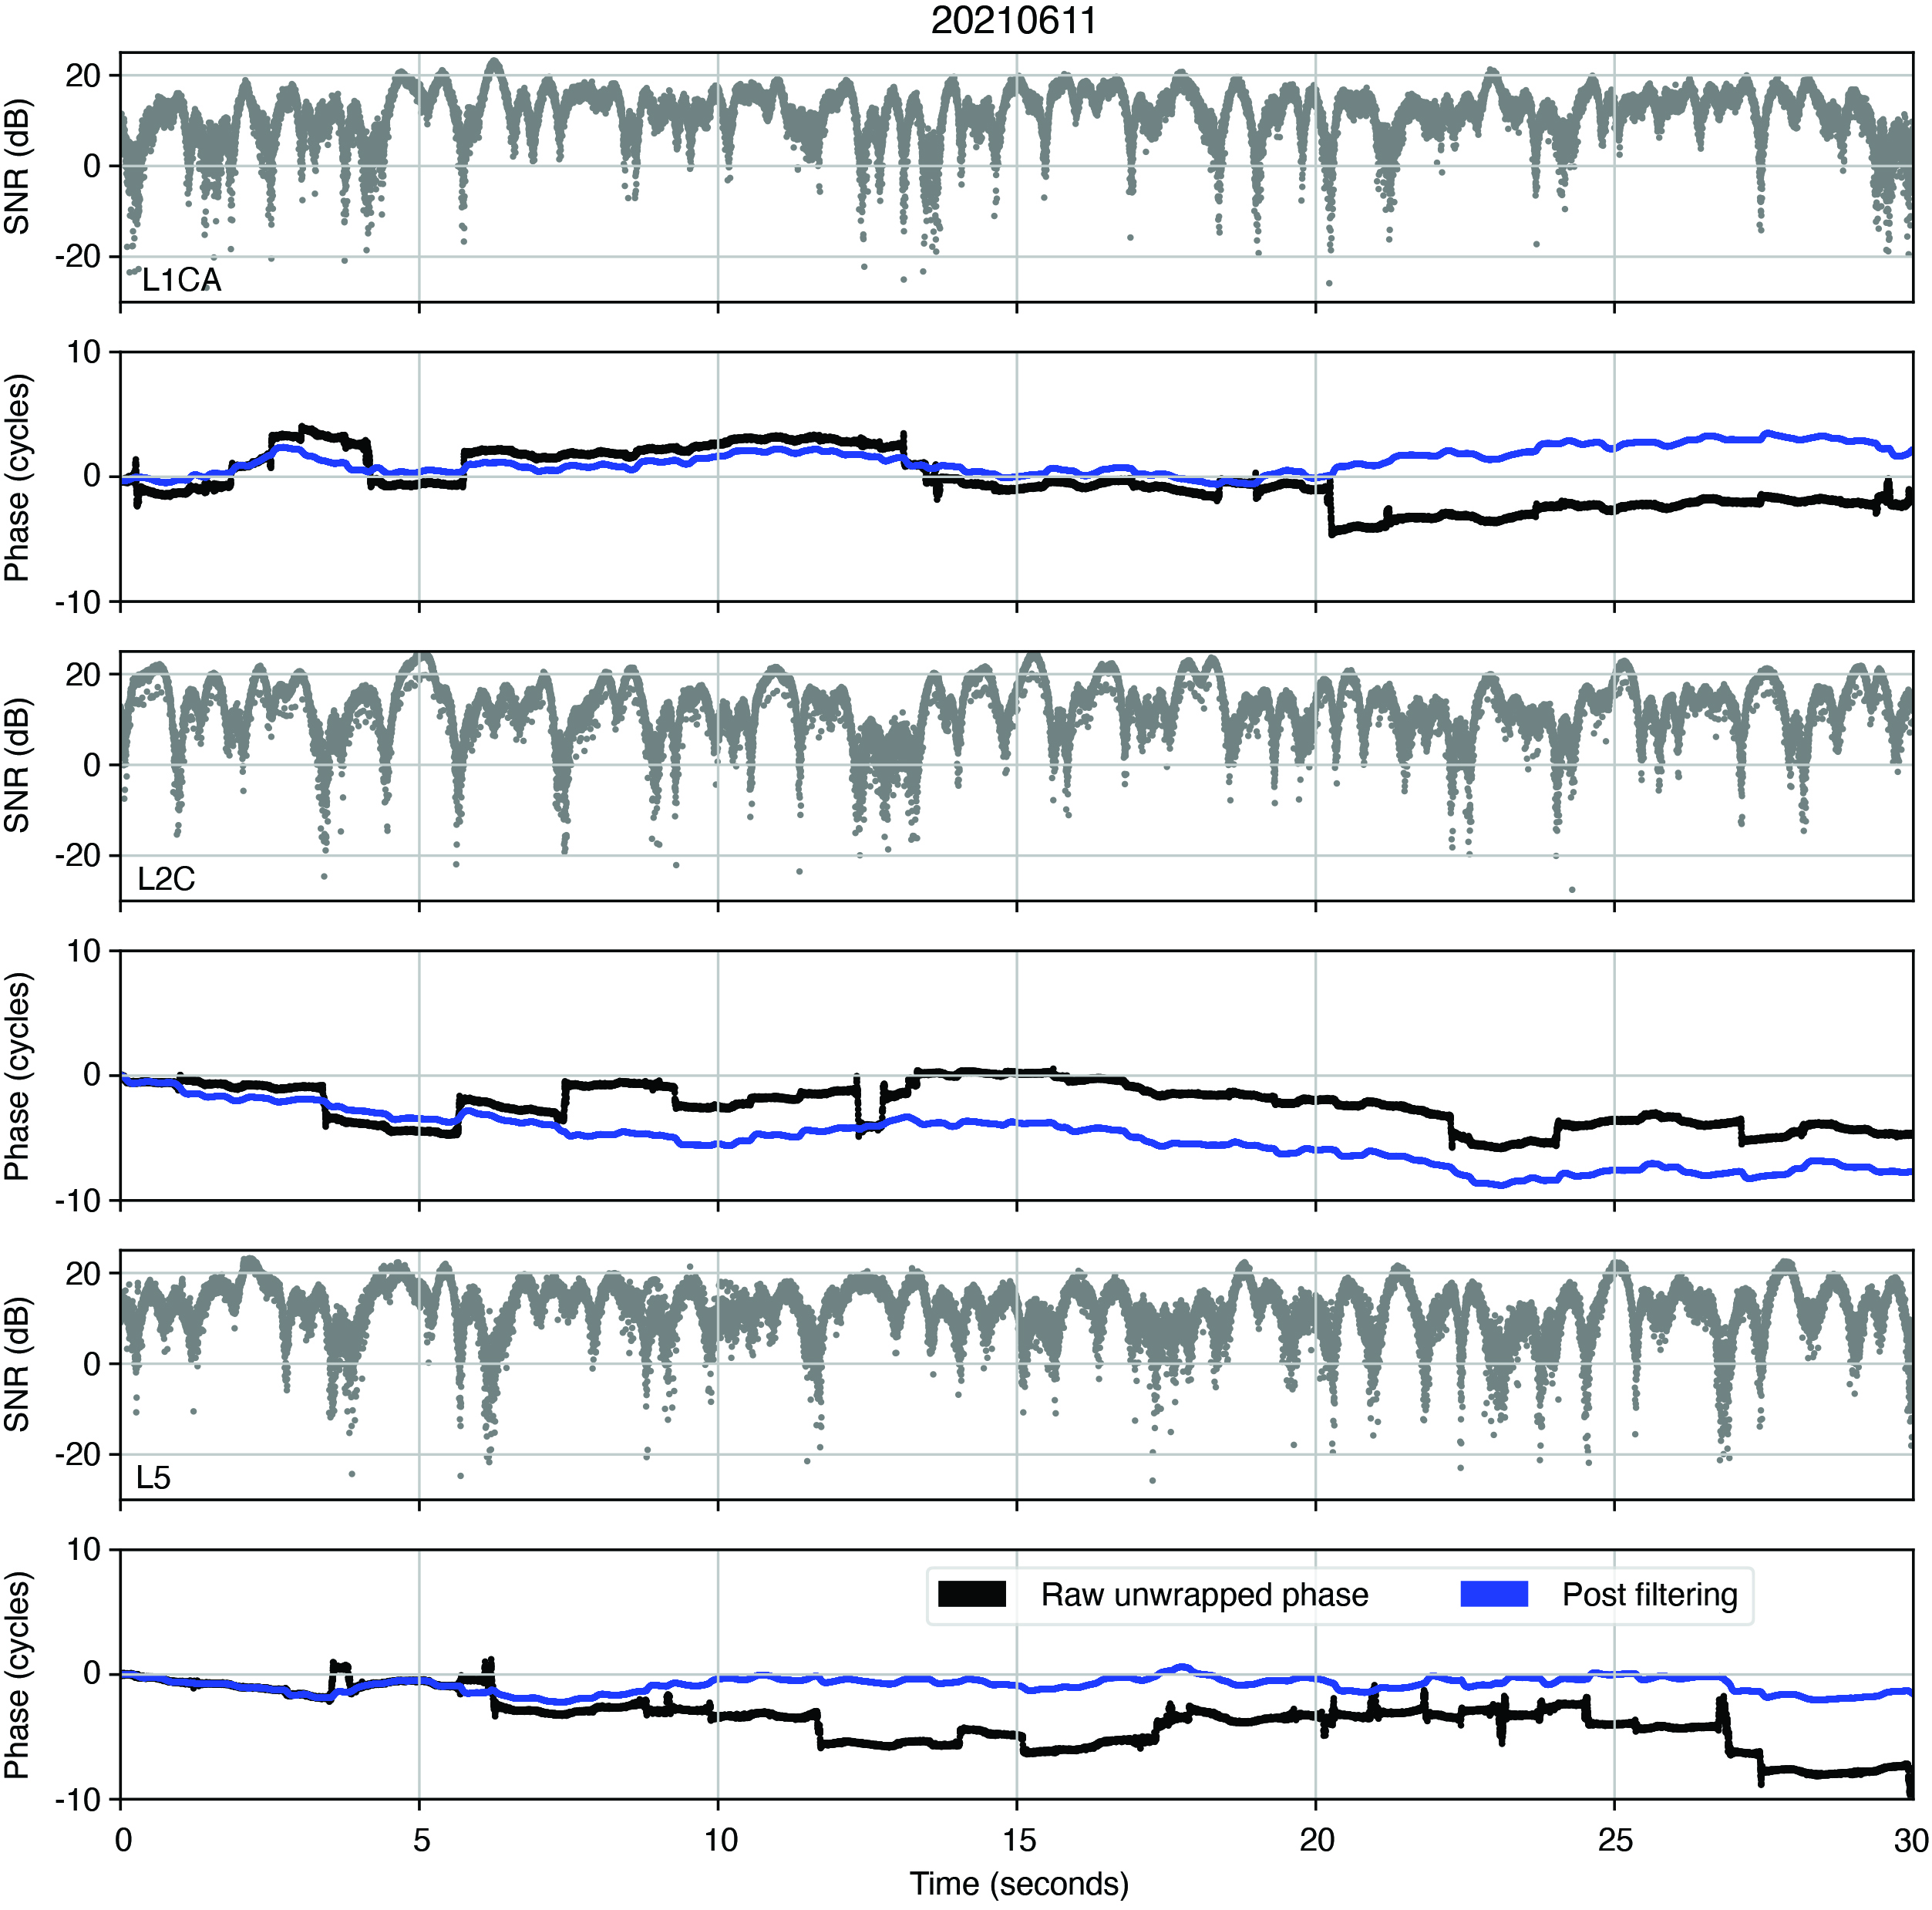
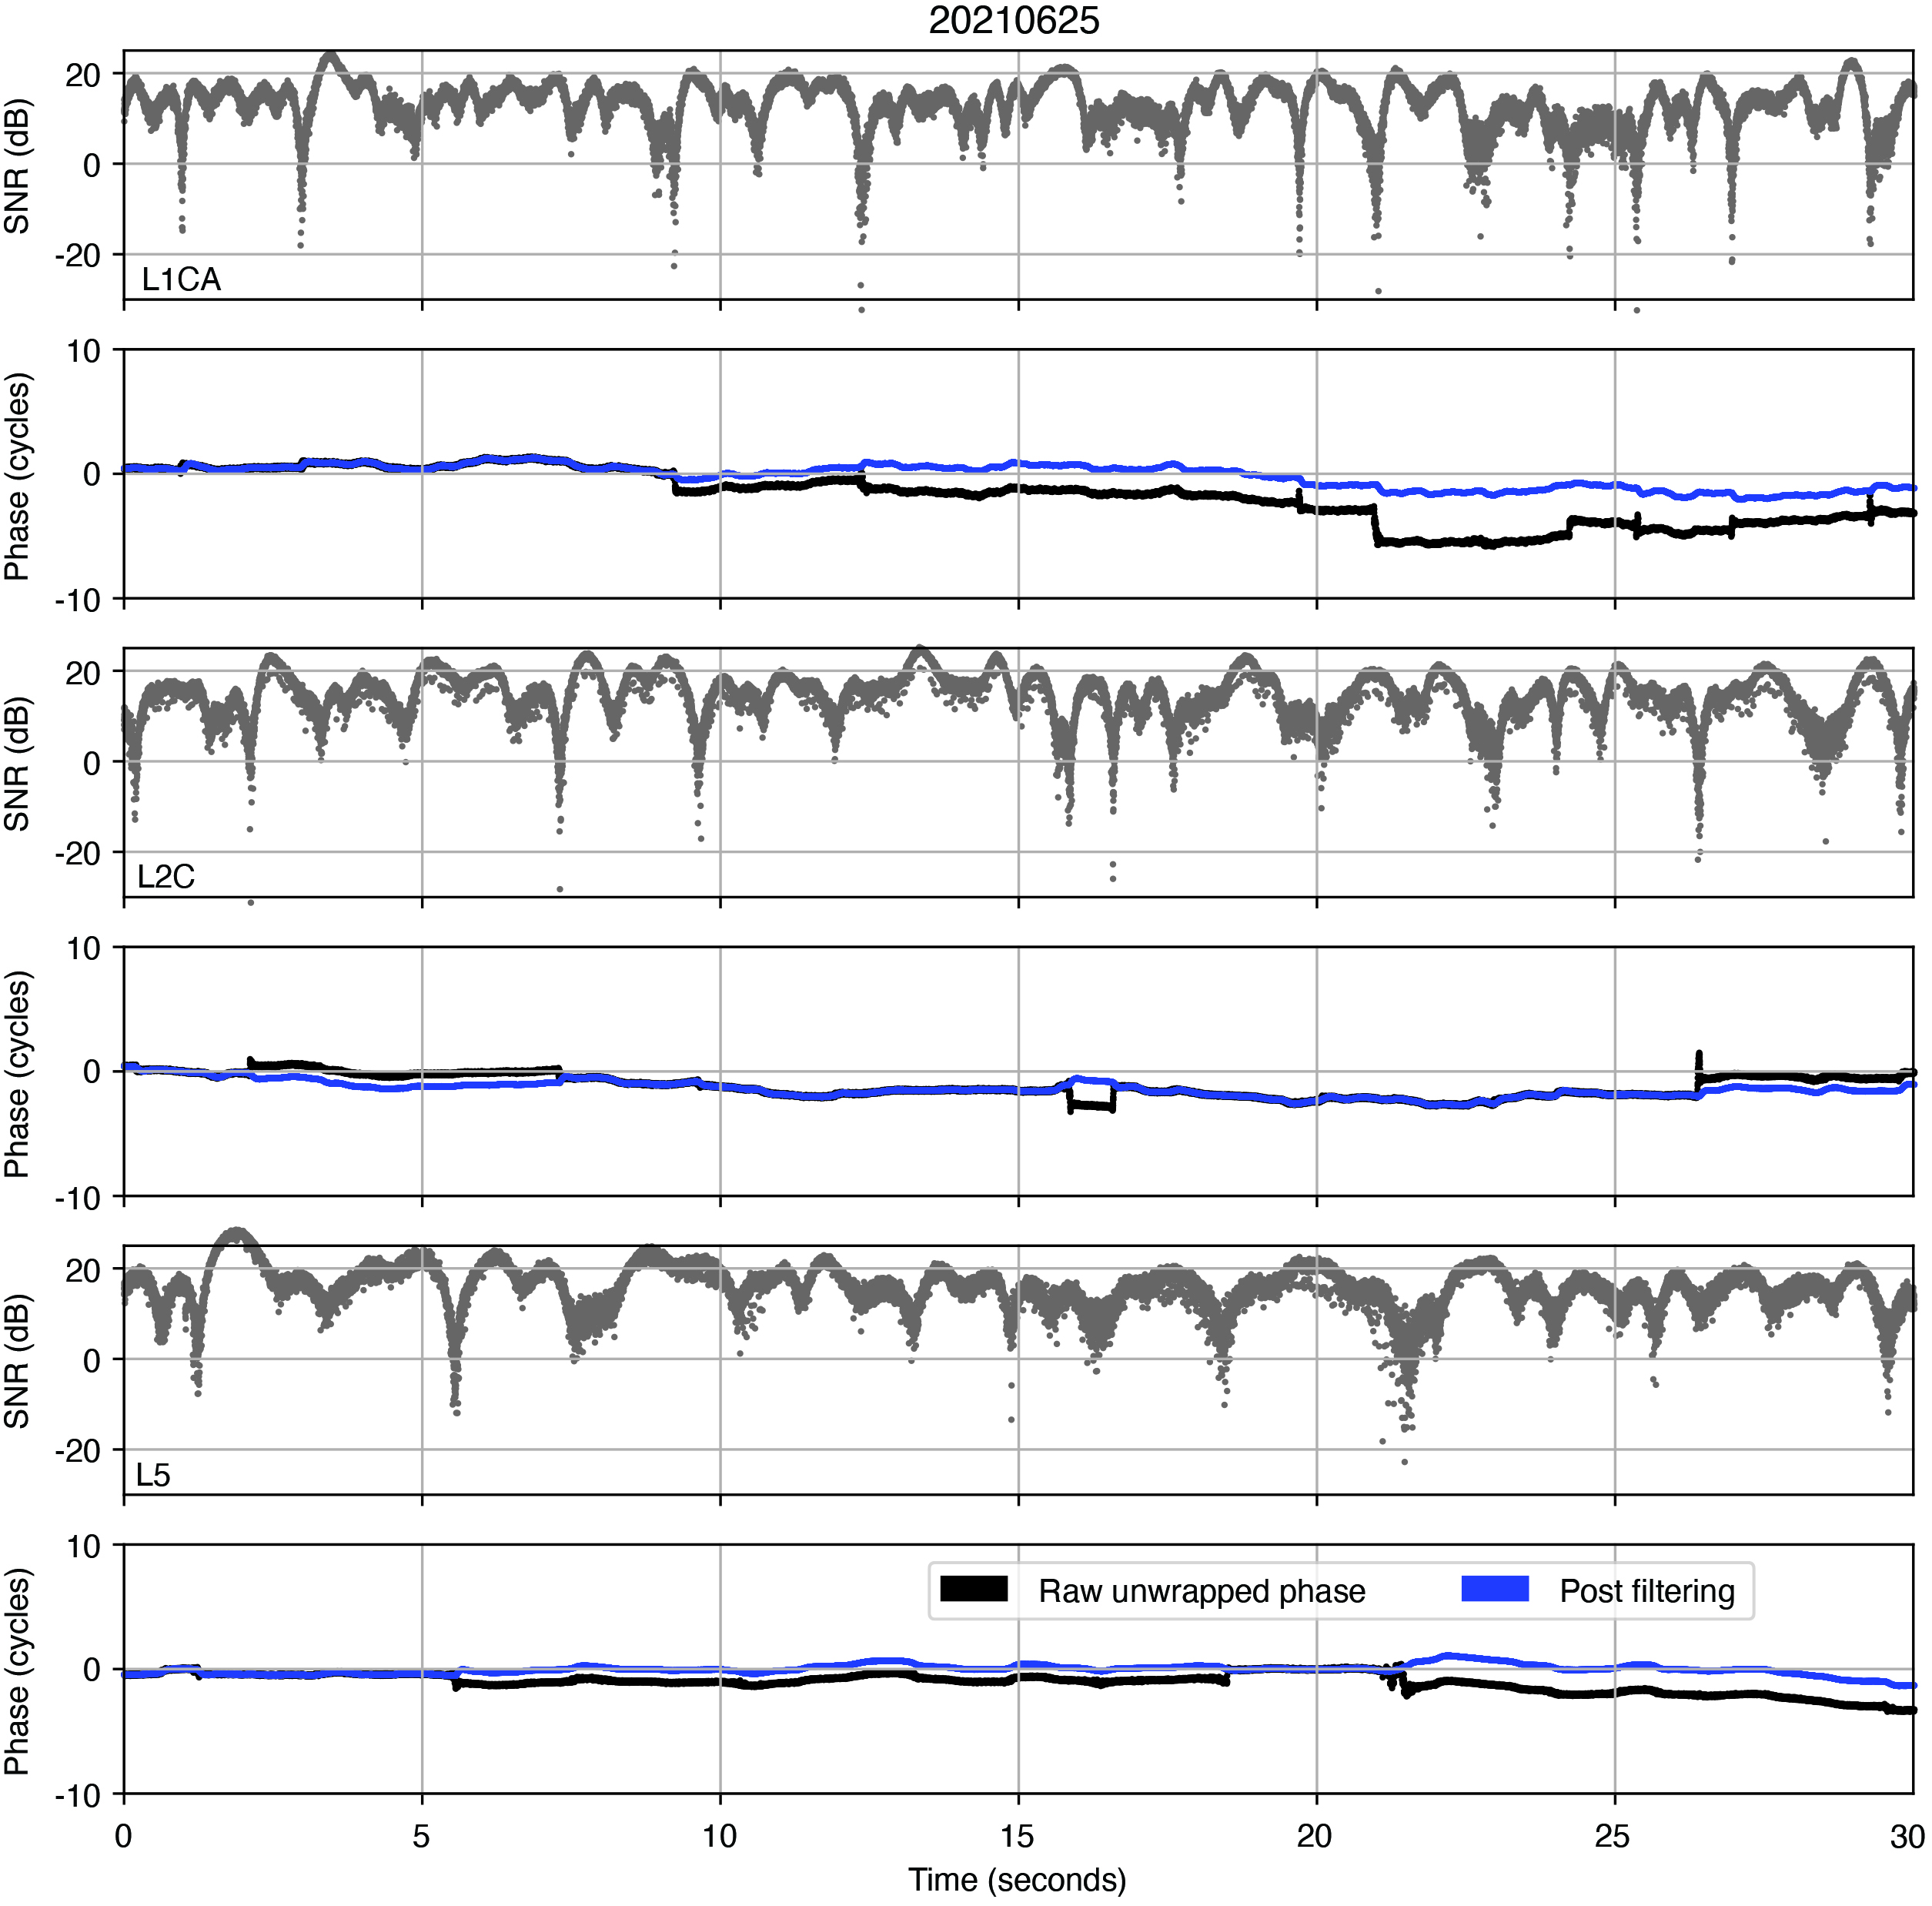
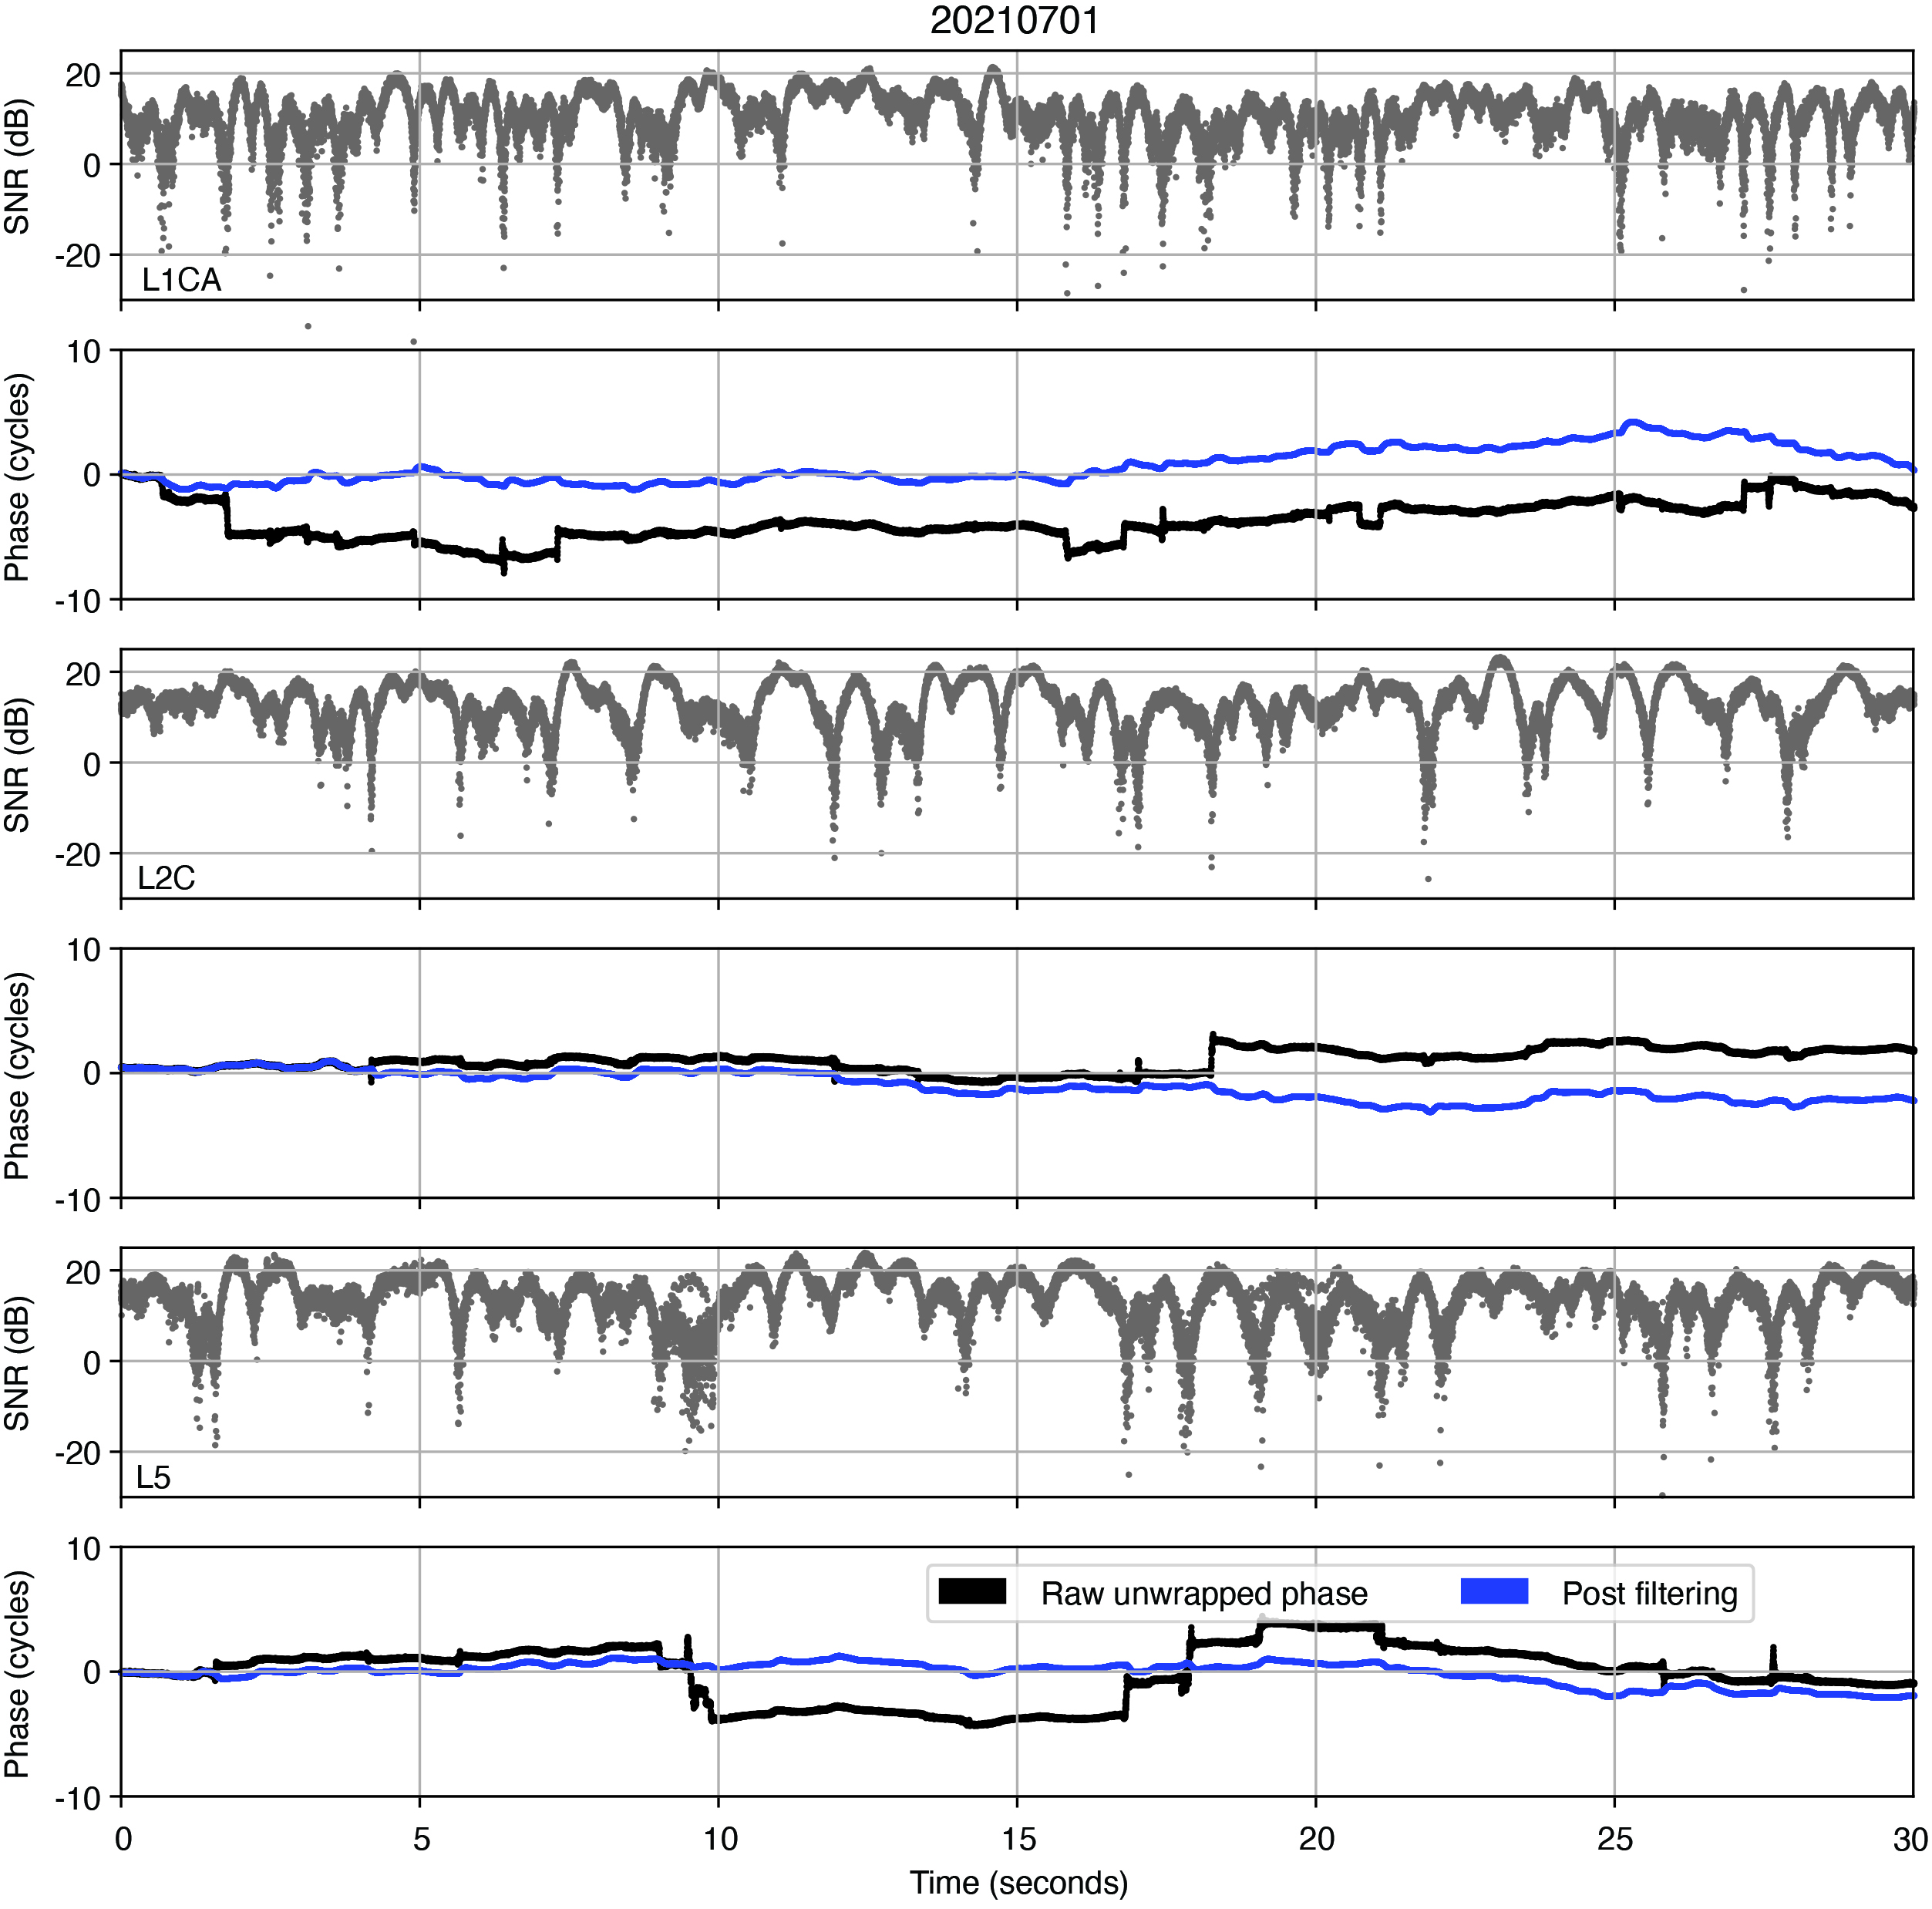
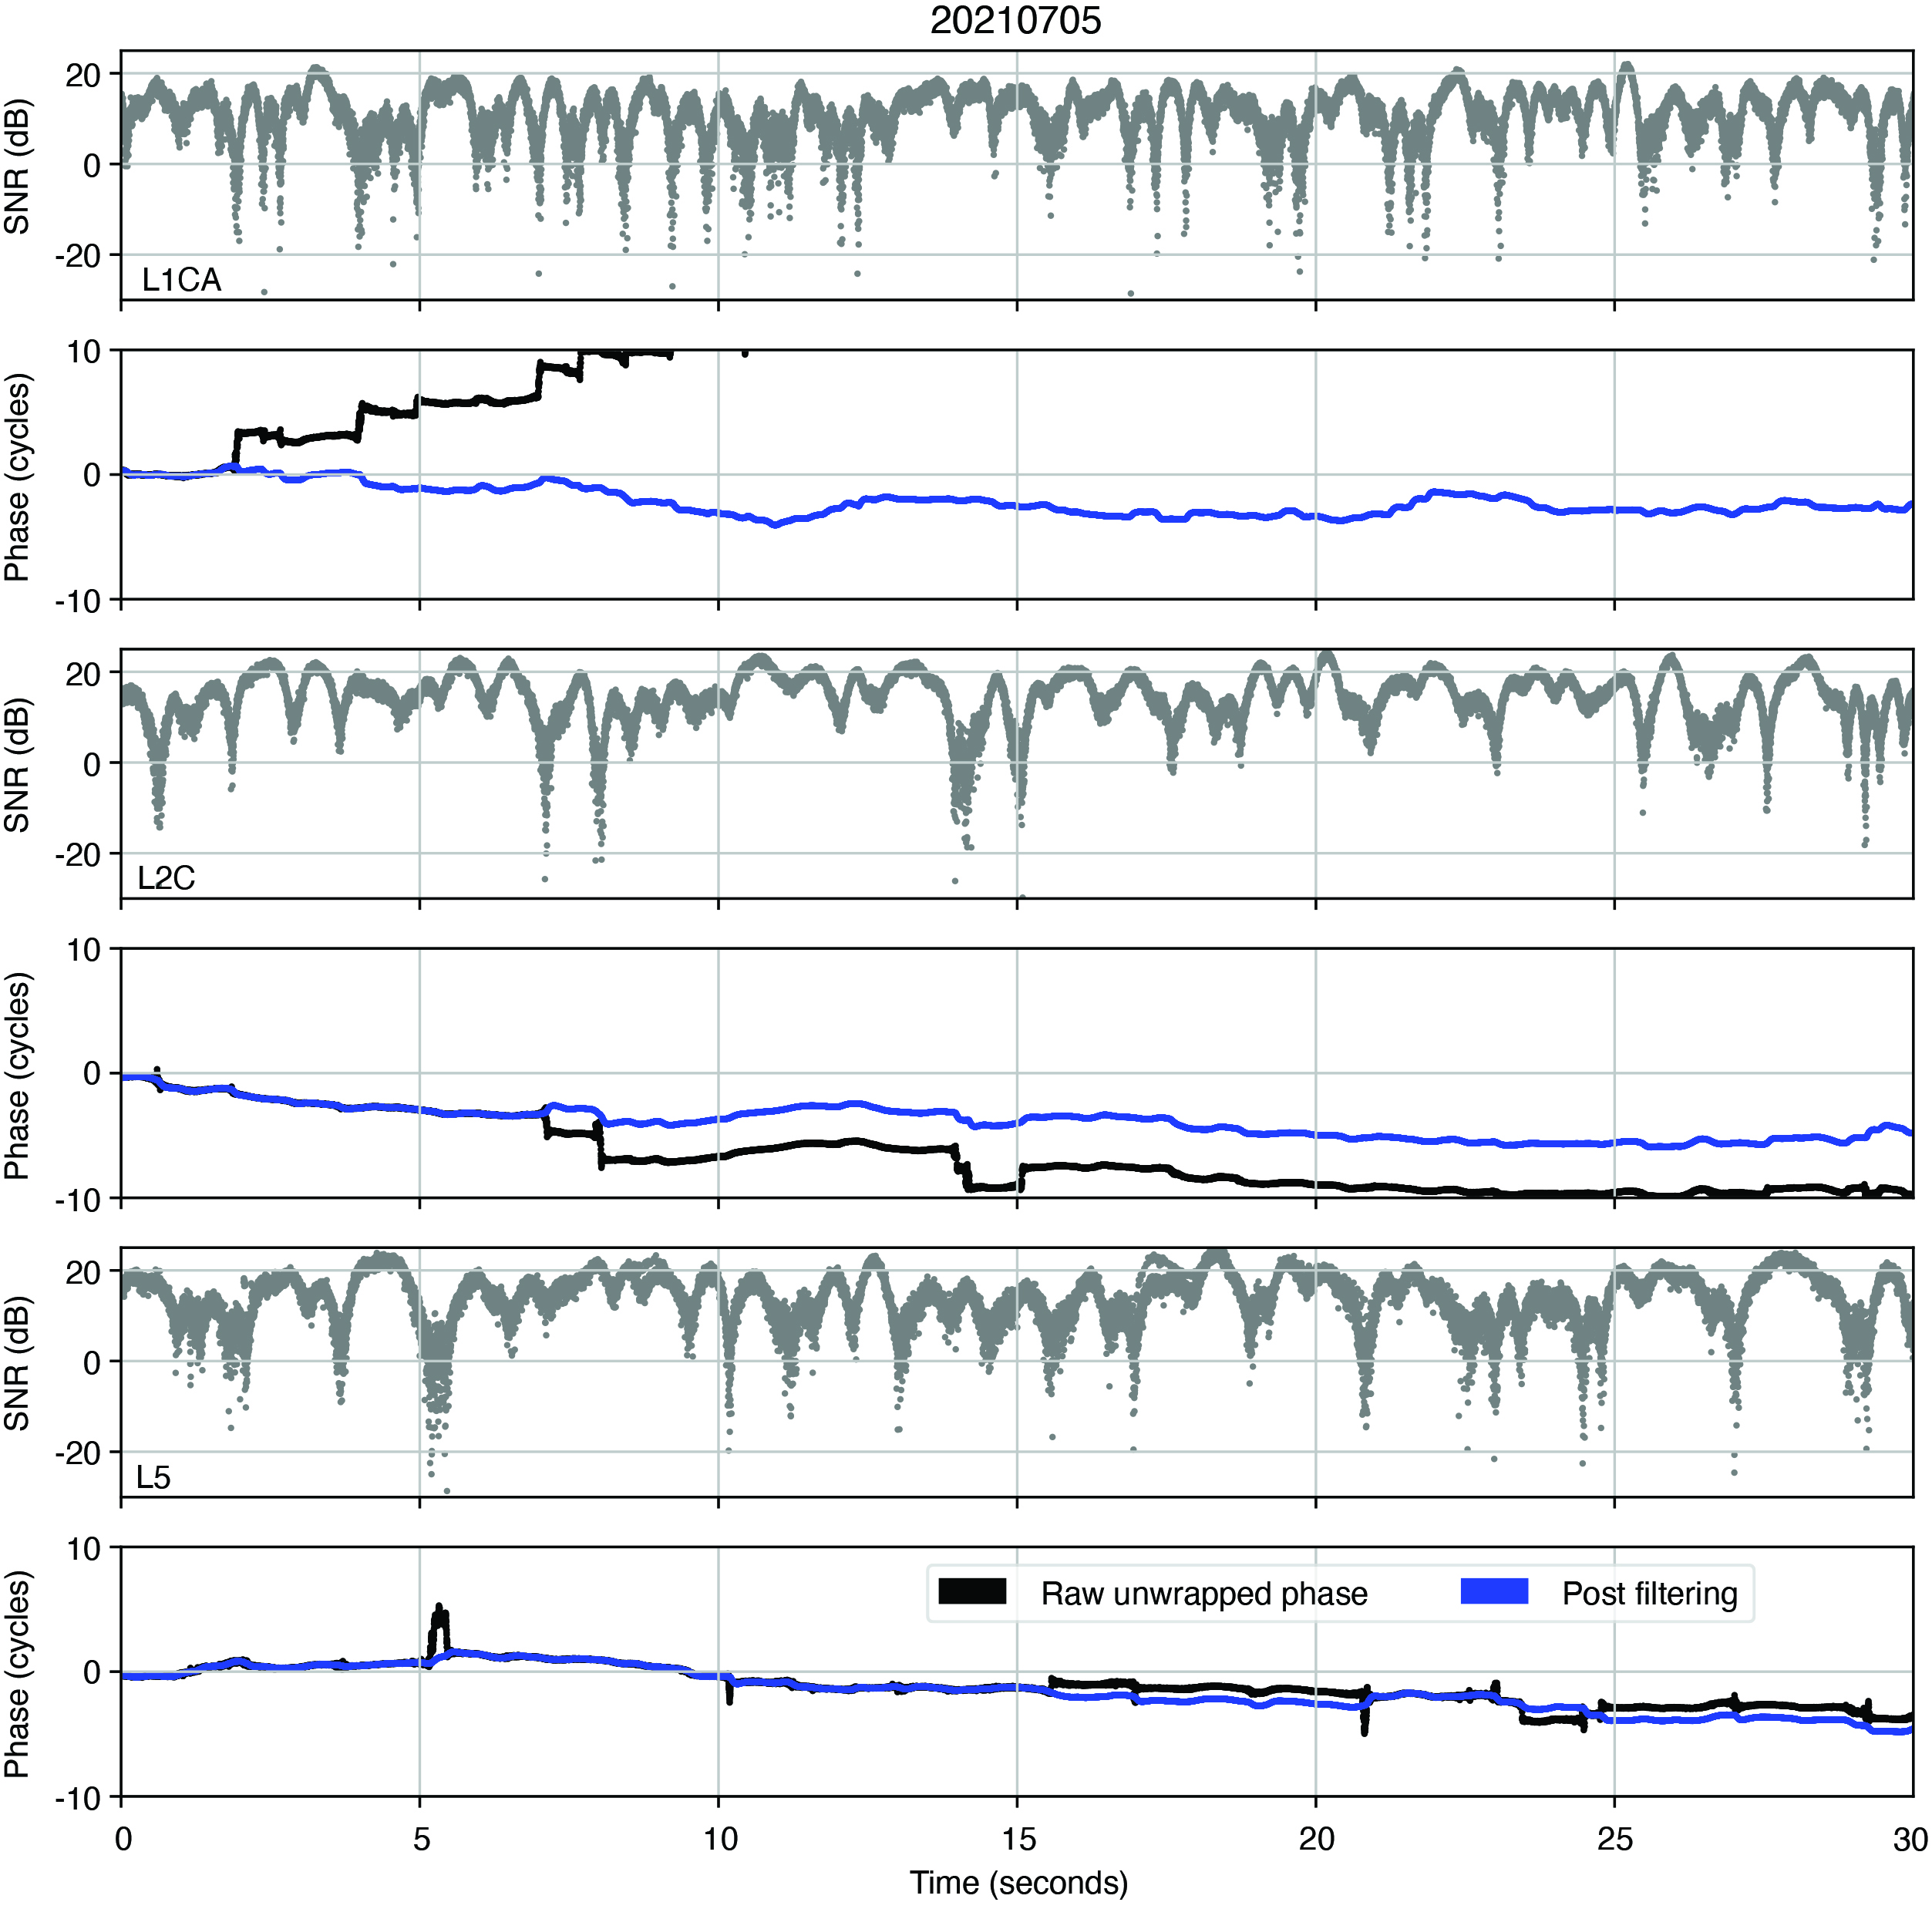
Under coherent conditions, the phase of the clean reflected I/Q data should contain only the unmodeled effects, including any signature of ocean surface height variation. However, the effect of multipath due to the rough ocean surface causes fluctuations in the received signal amplitude and phase, and can additionally cause cycle slips when we unwrap the phase. To filter out these cycle slips, we apply our simultaneous cycle slip and noise filtering (SCANF) method, which is essentially just a Kalman filter PLL with an additional step that tries to estimate and remove cycle slips. The figures in the next section show the results of applying this entire procedure to the reflected signals. The black and blue lines show the phase before and after applying SCANF. The reflected signal I/Q SNR is also included for reference. Note how the jumps in the black line coincide with SNR fades, and the blue line effectively recreates the phase trend of the black line without these jumps. This is good qualitative evidence that the SCANF algorithm was effective.
RESULTS
FIGURES 6, 7, 8, 9, 10, and 11 show the reflected signal SNR and phase for GPS PRN 6 on 6 different days. Note that these days correspond to the marked days in Figure 2, from which we observe that the wind-significant wave height is relatively high on days 1, 5, and 6, moderate on days 2 and 3, and relatively low on day 4. We noticed that the SNR fluctuations on days 1, 5, and 6 are comparatively more frequent than on other days, which we believe may be a signature of the ocean surface conditions. A more detailed analysis of this result is a topic for our future work.
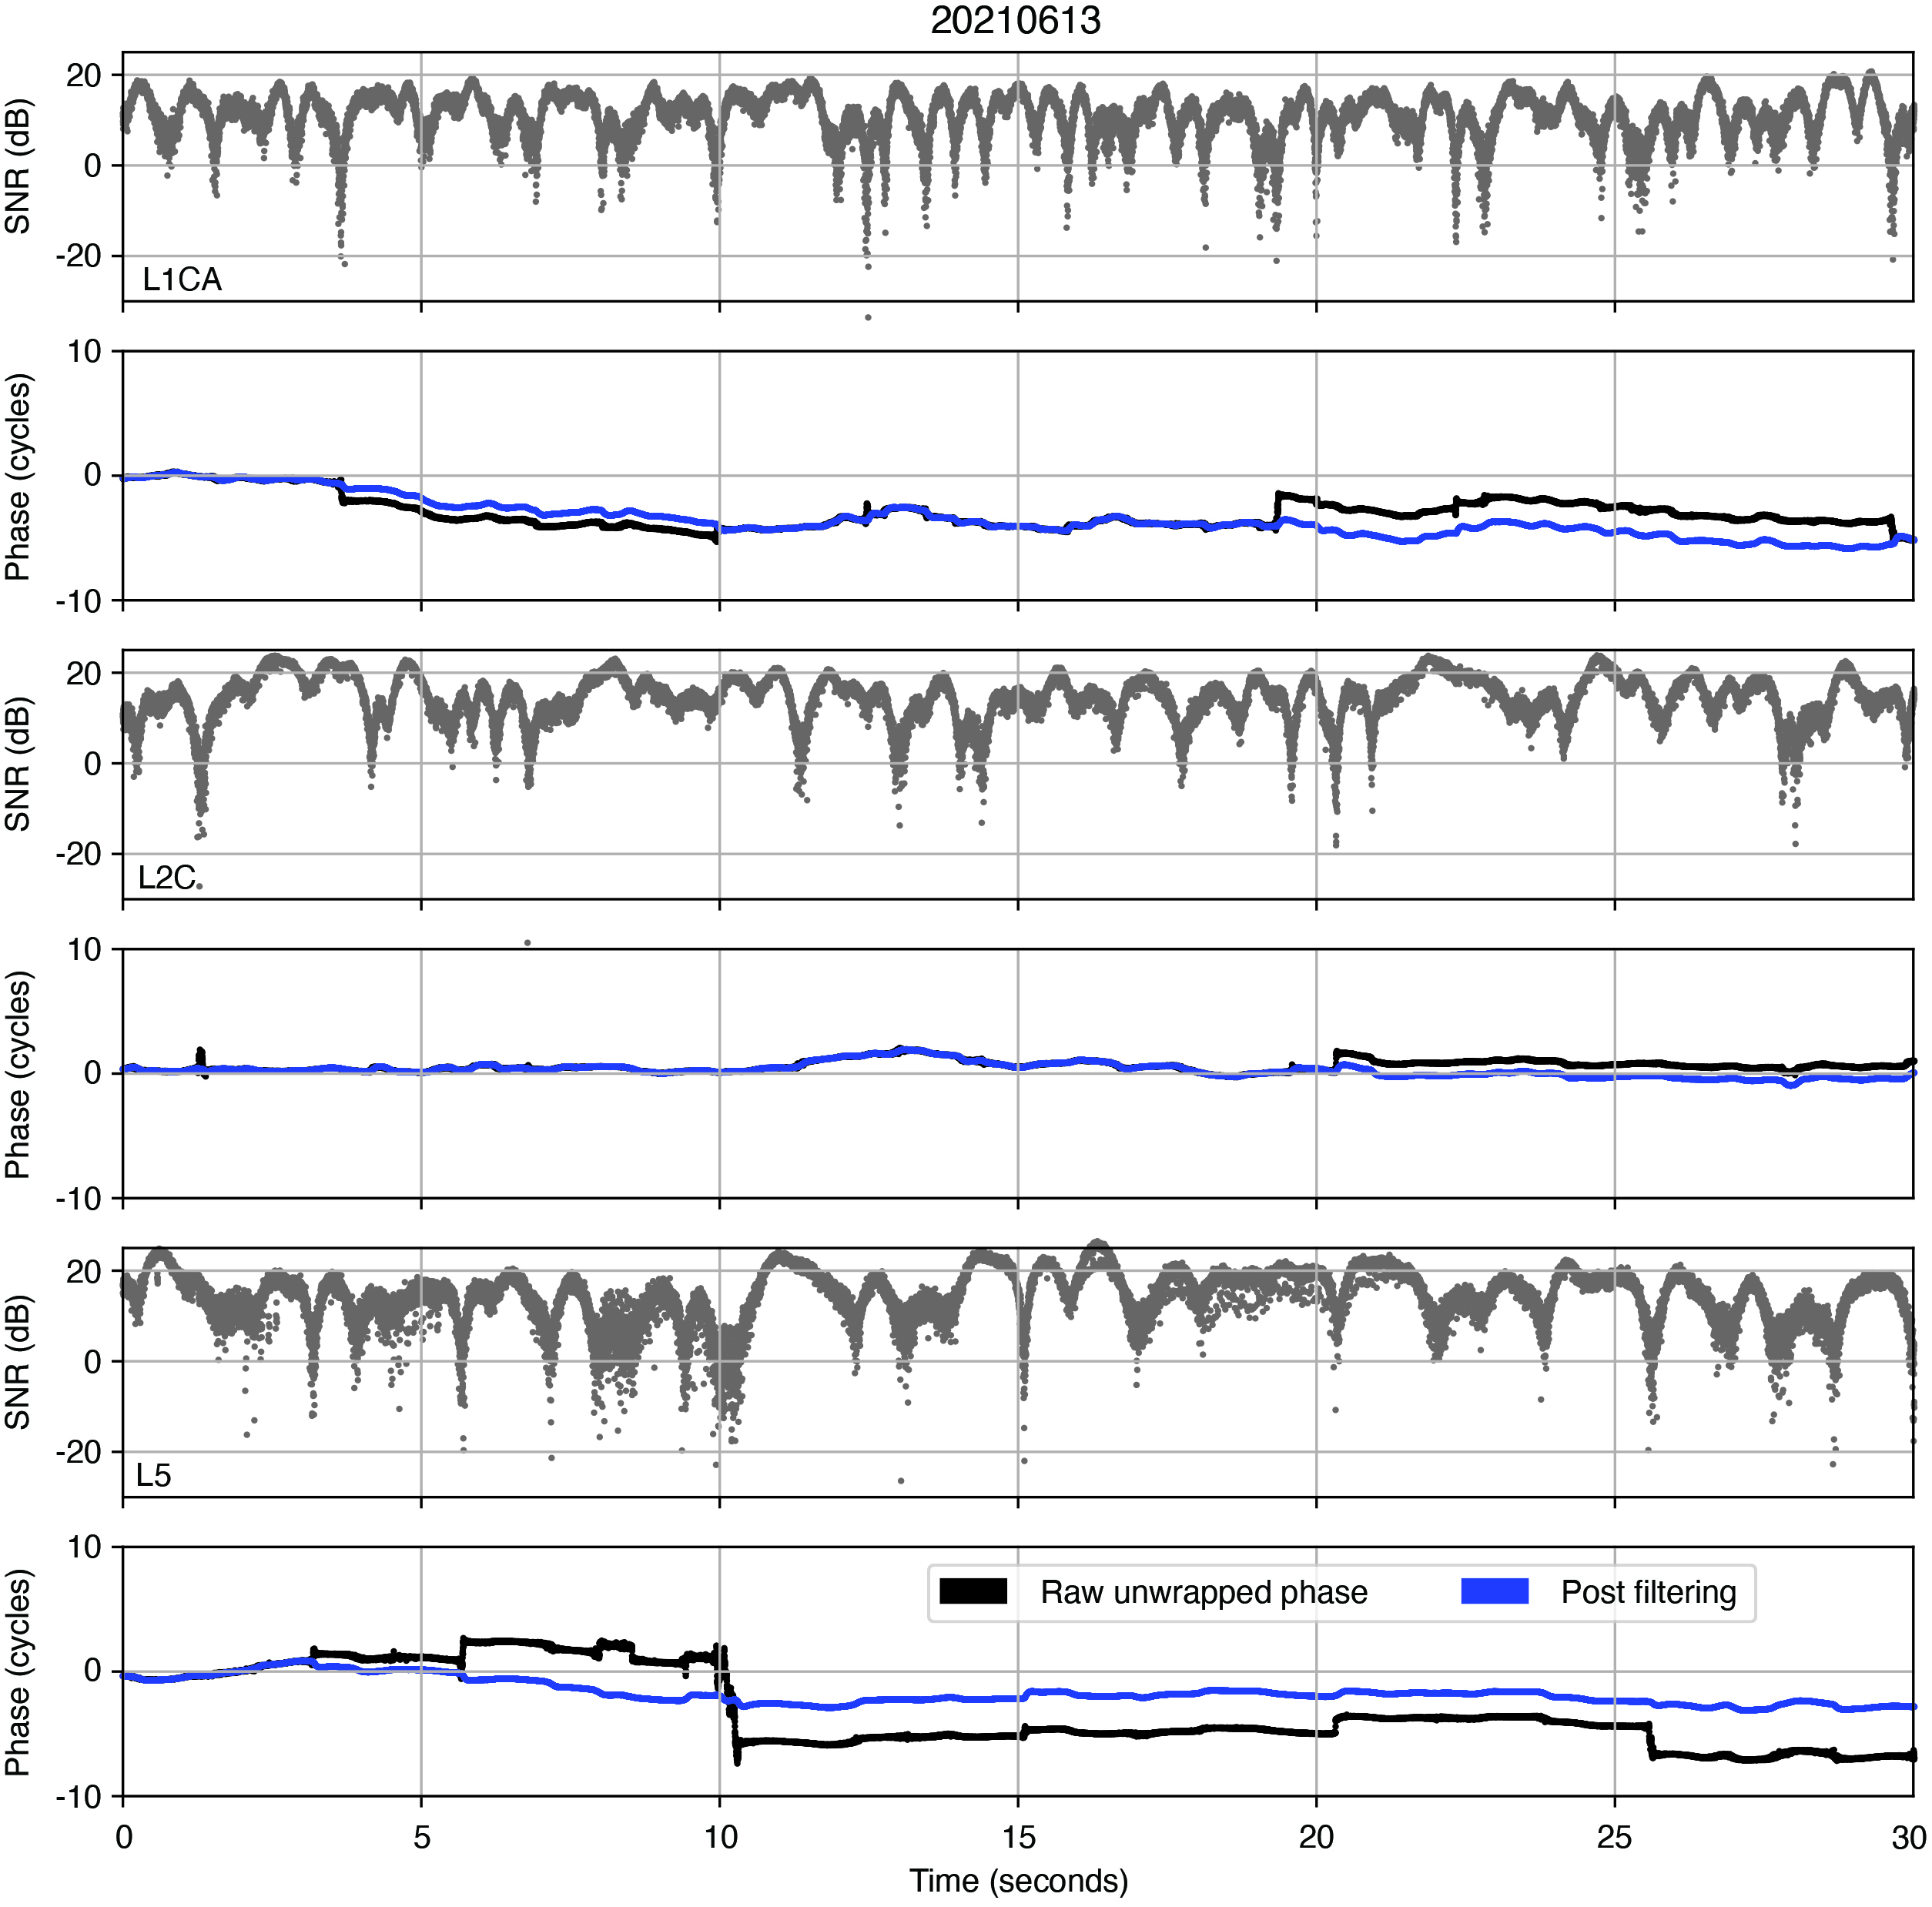
Figure 6: Reflected signal residual phase before (blue) and after (black) applying the SCANF filtering for the June 11, 2021 dataset. Amplitude and phase are shown in alternating panels for L1CA, L2C and L5 respectively.Figure 7: Phase processing results for June 13, 2021.
Overall, we observe that the phase trend is not consistent across the three signals (L1CA, L2C, L5) for any of the days. With all the multipath signatures in the cleaned reflected signal, it was uncertain whether the extracted phase will be useful for applications such as ocean surface altimetry, and these qualitative results suggest that they probably will not be. However, season and hours of the day that were processed for our work discussed in this article are very limited. It is possible that processing more data will shed further insight onto whether the reflected signal phase is usable in this experiment.
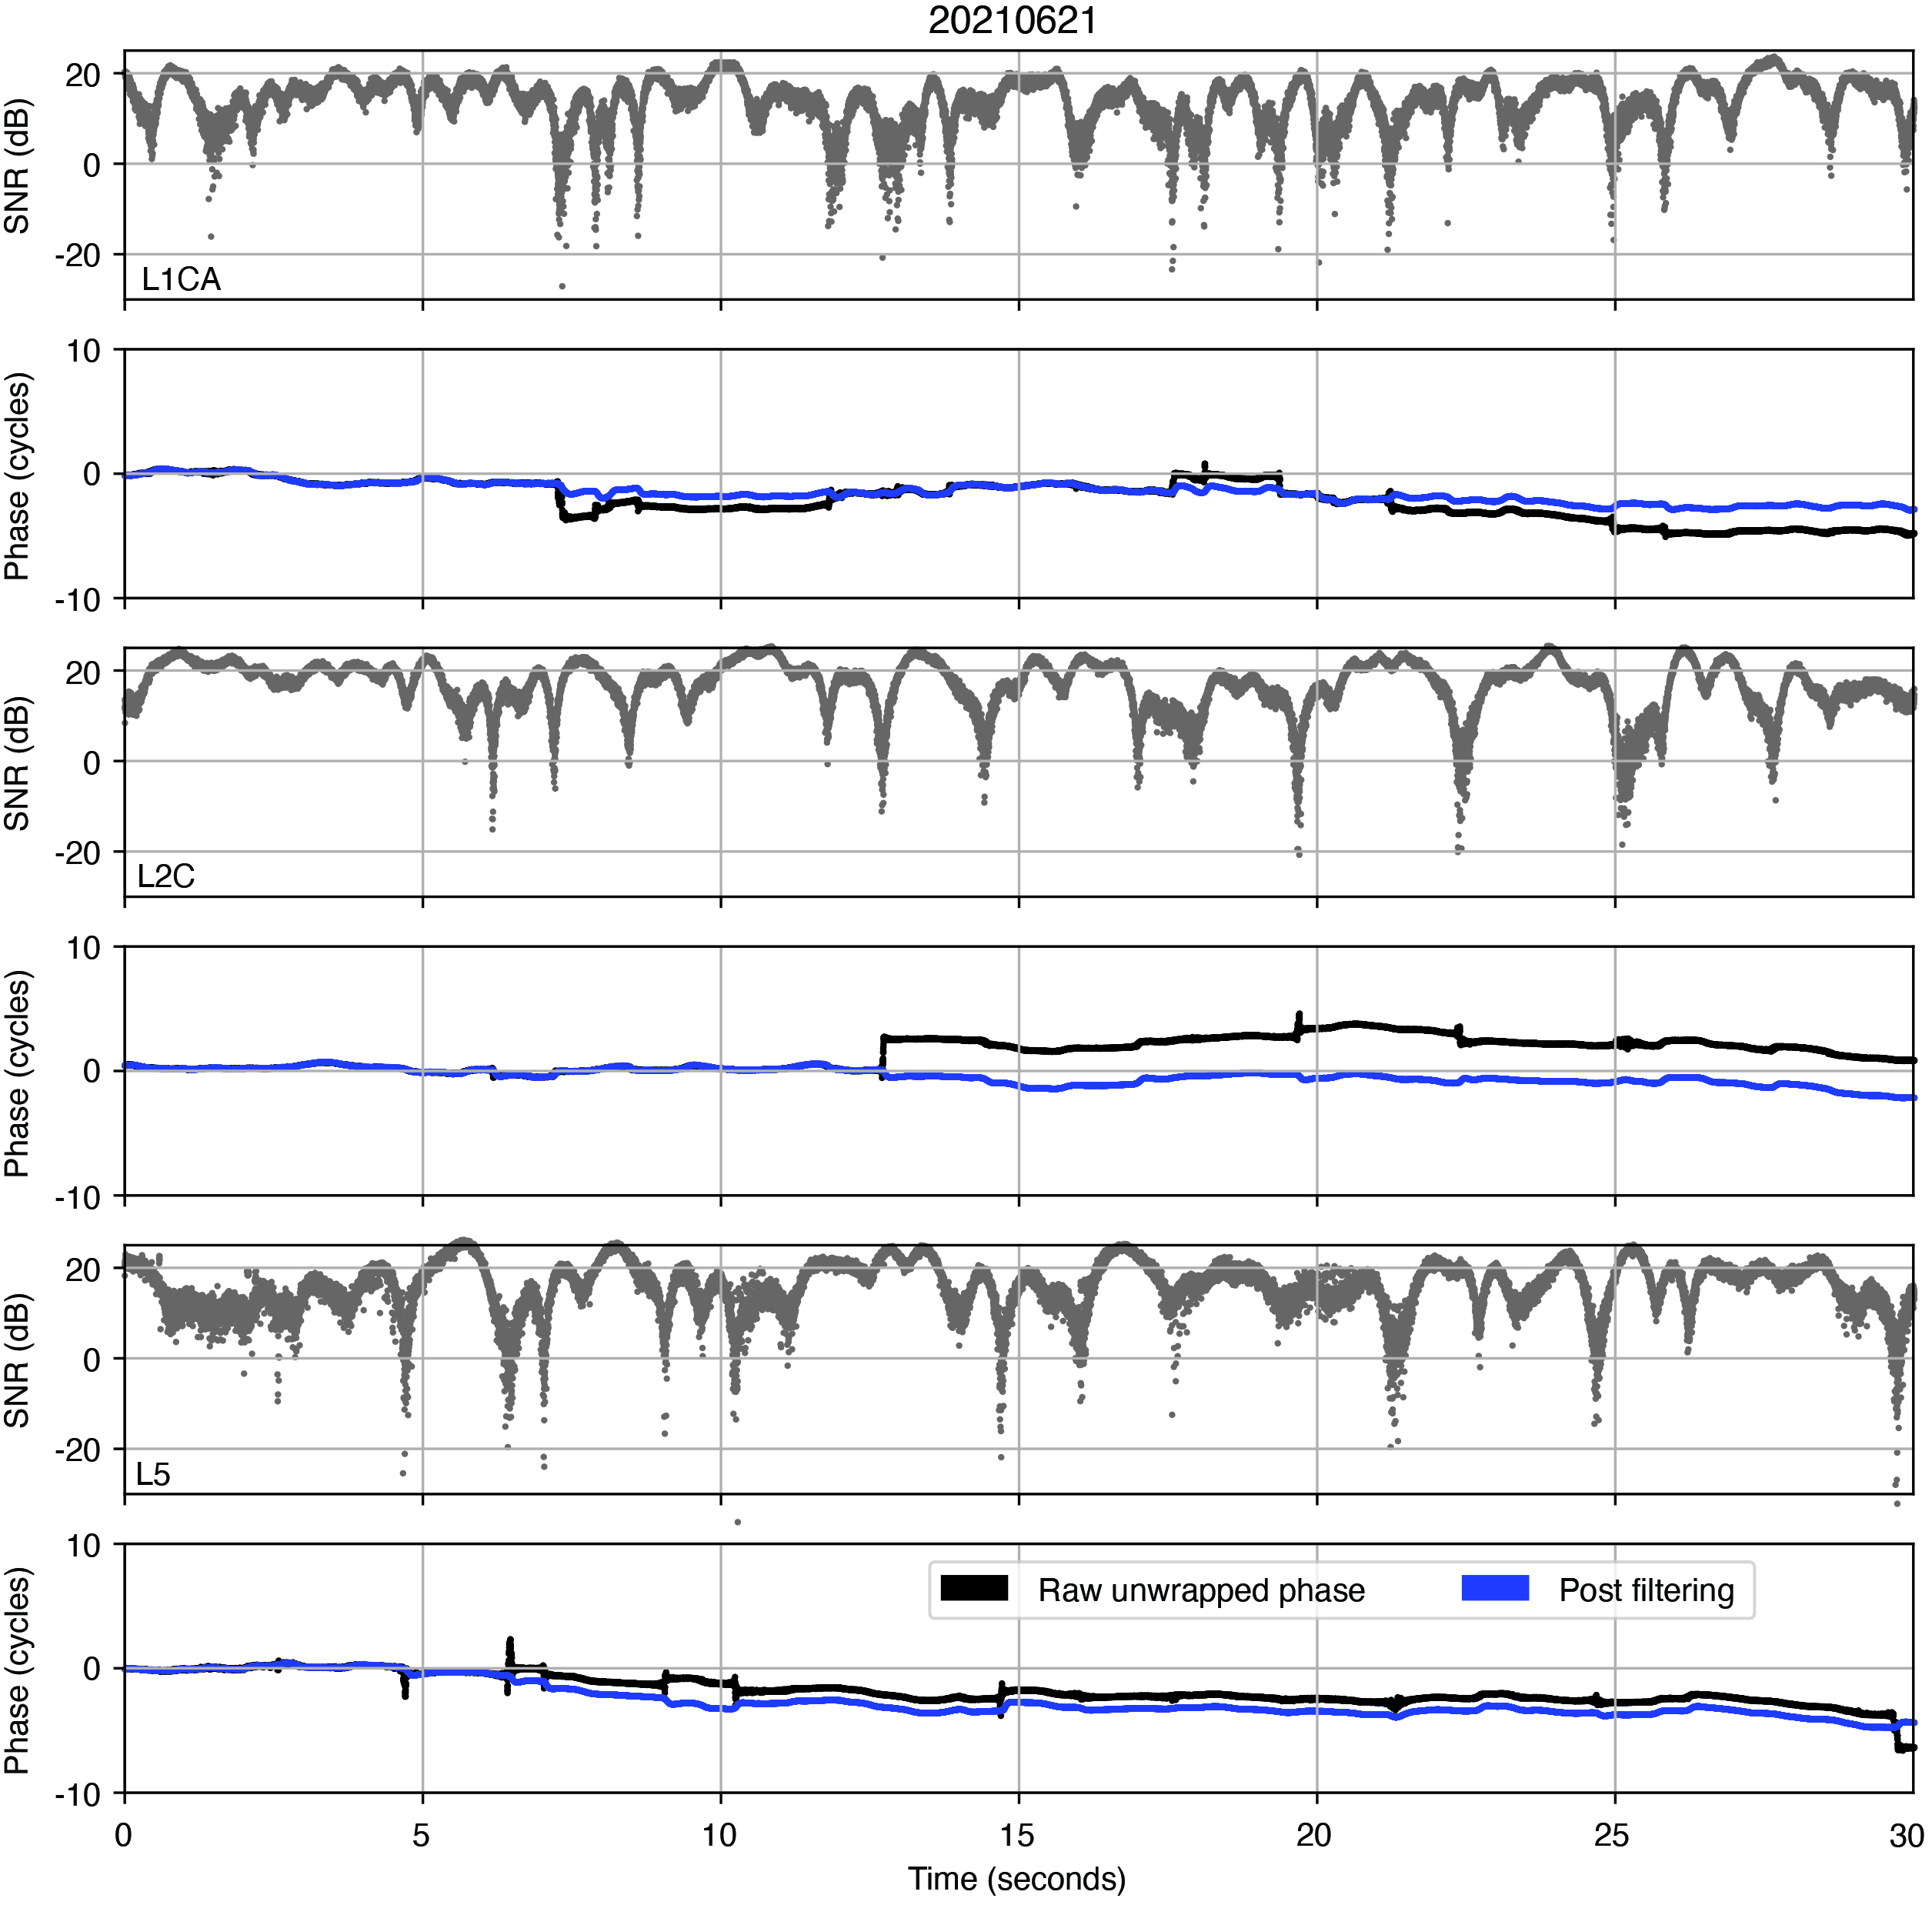
Figure 8 Phase processing results for June 21, 2021.Figure 9: Phase processing results for June 25, 2021.
ACKNOWLEDGMENTS
The Haleakalā data collection system has been established with support from the University of Hawaii Institute of Astronomy, and the Air Force Research Laboratory. The authors appreciate the assistance from Michael Maberry, Rob Ratkowski, Daniel O’Gara, Craig Foreman, Frank van Graas and Neeraj Pujara. This research is funded by a subaward from the National Oceanic and Atmospheric Administration through the University Corporation for Atmospheric Research to CU Boulder and with partial funding support from the NASA Commercial Smallsat Data Acquisition program.
This article is based on the paper “Initial Carrier Phase Processing for the Haleakala Mountaintop GNSS-R Experiment” presented at ION ITM 2023, the 2023 International Technical Meeting of the Institute of Navigation, Long Beach, California, Jan. 23–26, 2023.
Figure 10: Phase processing results for July 1, 2021.Figure 11: Phase processing results for July 5, 2021.
BRIAN BREITSCH is a postdoctoral fellow at the University of Colorado (CU) Boulder, where he received his Ph.D. in aerospace engineering sciences. JADE MORTON is a professor in the Ann and H.J. Smead Department of Aerospace Engineering Sciences and the director of the Colorado Center for Astrodynamics Research at CU Boulder.
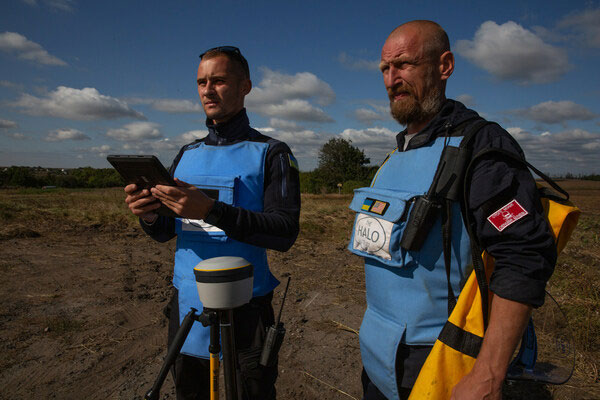
Trimble has partnered with HALO Trust, a landmine-clearing non-profit organization, to help expand its demining operations across Ukraine.
The grant from the Trimble Foundation Fund will focus on strengthening the HALO Trust’s ability to locate and remove landmines, unexploded ordnance and other explosive hazards from civilian areas to create safer communities. In addition, it will allow HALO to support the Ukrainian national authorities in planning and coordinating landmine clearance activities by streamlining the mapping and data flow from the operational teams in the field to the national database.
The Russian invasion of Ukraine has left areas of the country contaminated with landmines, unexploded ordnance and improvised explosive devices. These hazards block access to farmland, impede reconstruction efforts, prevent displaced persons from returning to their homes and continue to hinder the safety of Ukrainian civilians. The Ukrainian government estimates that 174,000km2 of the country’s land may be contaminated.
More than a thousand HALO staff members are active daily, both to clear explosives in critical priority areas and to recruit and train hundreds of new staff members to help keep communities safe from dangerous weapons left behind.
Surveying and mapping technology has played a significant role in the success of HALO’s operations around the world, including in Ukraine. Over the last six years, Trimble R1 and Trimble R2 GNSS receivers along with Esri ArcGIS Survey123 software have been used by HALO to identify and clear landmines.
Trimble’s Geospatial and Positioning Services businesses provided HALO with a new deployment of 255 high-precision Trimble DA2 GNSS receivers with Trimble Catalyst corrections service, allowing HALO to modernize and transform its landmine clearance operations by providing improved accuracy for more detailed maps, streamlined data flows and increased operational efficiency and safety.
Skydio has entered a strategic collaboration with Trimble to create an integrated workflow of accurate data capture, visualization and analytics. The workflow is designed to address the needs of critical infrastructure industries such as surveying, mapping and inspections.
The collaboration, currently in the developmental stage, aims to offer users centimeter-level accuracy in surveying and mapping projects by integrating Skydio autonomous UAVs with Trimble GNSS receivers and software. The technology can be used by construction and utility companies, as well as state transportation agencies, to streamline workflows for greater precision and project efficiency.
Industry leaders rely on autonomous UAVs with powerful visual and thermal camera sensors, such as Skydio’s X10, for their ability to capture real-time condition reports of critical infrastructure conditions. By capturing images and geospatial data early and frequently throughout construction projects, organizations can easily ensure on-site work matches the design and reduce costly rework.
When bridge or utility site inspections need to scale, the Skydio and Trimble integration can be used to collect comprehensive data and improve the necessary workflow to identify issues early and take action to prevent failures.
According to Skydio, key benefits of the collaboration include:
Automated data integration: An automated, API-based integration enables seamless transfer of aerial imagery and metadata from Skydio Cloud to Trimble Industry Cloud. It accelerates the conversion of reality-capture data into actionable insights to improve efficiency. Further refinement and analysis of the output data can be carried out in professional surveying and mapping environments such as Trimble Business Center (TBC).
Survey-grade accuracy with Skydio X10: The X10 UAV will be fully compatible with Trimble’s GNSS receivers, allowing mutual users to achieve survey-grade accuracy in mapping missions when employing Skydio alongside Trimble’s base stations and GNSS receivers. Beyond RTK, users will also be able to conduct PPK based corrections post-flight.
A roundup of recent products in the GNSS and inertial positioning industry from the November 2023 issue of GPS World magazine.
SURVEYING & MAPPING
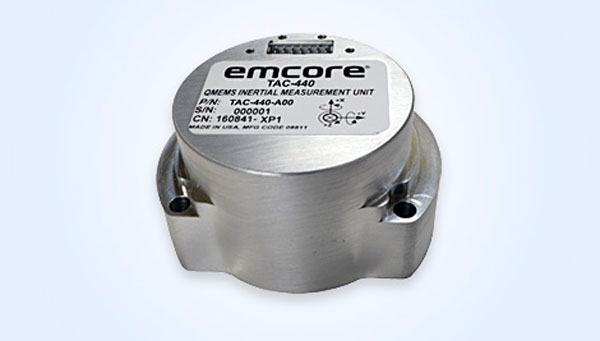
MEMS IMU Suitable for rugged environments
The TAC-440 MEMS inertial measurement unit (IMU) is designed for demanding, mission-critical, rugged environments in a wide variety of defense, commercial, industrial, and marine applications. The TAC-440 features 1°/hr gyro bias and 1 mg accelerometer bias stability with 0.05°/√hr angle random walk over a wide temperature range. The solid-state quartz sensors and hermetically sealed IMU construction provide reliable MTBF and storage life, EMCORE stated. The TAC-440 supports four data message synchronization methods with either input synchronization pulse capability or an output time of validity capability. The user can choose whether the synchronization pulse is internally generated and output as a time of validity of the output data or whether the TAC-440 software will identify the synchronization pulse input and synchronize the output data to the input pulse. EMCORE Corporation, emcore.com
RTK GNSS Tablet A rugged device designed for geospatial and mapping operations in the field
The LT800H offers users robust outdoor performance, data security and centimeter-level accuracy for a variety of applications, including construction, environmental surveying and any industry in which Android tablets are used. Featuring a high-performance 1,408-channel GPS, GLONASS, Galileo and BeiDou module and a tracking GNSS helix antenna, the LT800H RTK Android tablet offers centimeter-to-decimeter positioning accuracy in challenging environments. It also comes equipped with a 4G modem to simplify connectivity to GNSS RTK network corrections. The technology also offers an eight-hour battery life, allowing users to collect data in the field uninterrupted. CHC Navigation, chcnav.com
PPK Software For land surveying, hydrography, airborne surveys, construction, and applications that require precise positioning
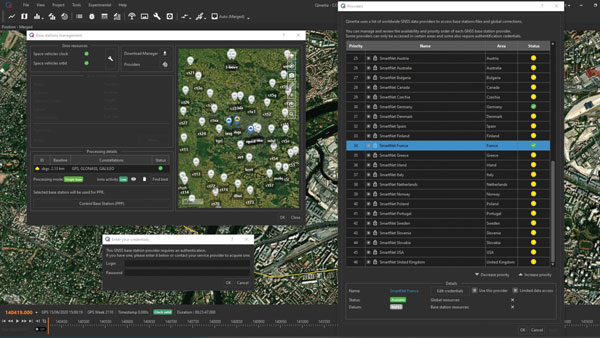
The Qinertia 4 contains an enhanced geodesy engine that has an extensive selection of preconfigured coordinate reference systems (CRS) and transformations, making it a suitable solution for applications that use diverse geodetic data. To tackle the challenges of variable ionospheric activity, Qinertia 4 features an Ionoshield post-processed kinematic (PPK) mode. This feature compensates for ionospheric conditions and baseline distances, enabling users to perform PPK even for long baselines and/or harsh ionospheric conditions. This ensures surveyors can achieve centimeter accuracy even in regions with unpredictable ionospheric disturbances. Another addition to the Qinertia 4 is an extended network support for continuously operating reference stations (CORS). This feature gives users access to a network of 5,000 SmartNet CORS for reliable GNSS data processing. These base stations add to the network of base stations directly available in Qinertia, bringing the total to more than 10,000 bases in 164 countries.
For data that cannot be processed using PPK, Qinertia 4 offers an alternative solution with its tightly coupled precise point positioning algorithm. This new processing mode, available for all users with active Qinertia maintenance, provides post-processing anywhere in the world without a base station, with a horizontal accuracy of 4 cm and a vertical accuracy of 8 cm. SBG Systems, sbg-systems.com
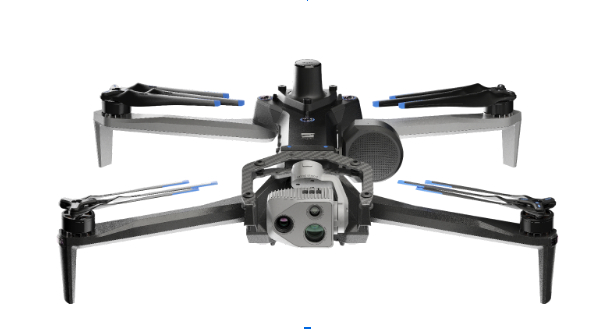
Airborne Lidar + RGB System Designed to enhance the details of aerial mapping operations
The AlphaAir 10 (AA10) features a high-precision navigation algorithm that provides 5 mm repeated range accuracy and achieves absolute precision in the 2 cm to 5 cm range, even in complex environments. The AA10 is capable of long-range measurements of up to 800 m, rapid scanning at 500,000 points per second, and features a continuously rotating mirror that enables scanning speeds of 250 scans per second. The AA10 enables the creation of mesh models by generating high-quality point clouds. It is powered by a 45 MP orthographic internal camera that provides high-resolution image mapping textures for 3D model reconstruction with realistic point cloud colorization. The AA10 also supports automated reality capture and real-time data visualization accessible directly from the UAV controller. The AA10 lidar system is lightweight and compact, weighing 1.55 kg, and provides a 30 min operating time when integrated with UAVs such as the DJI M350. The system is also IP64-rated. CHC Navigation, chcnav.com
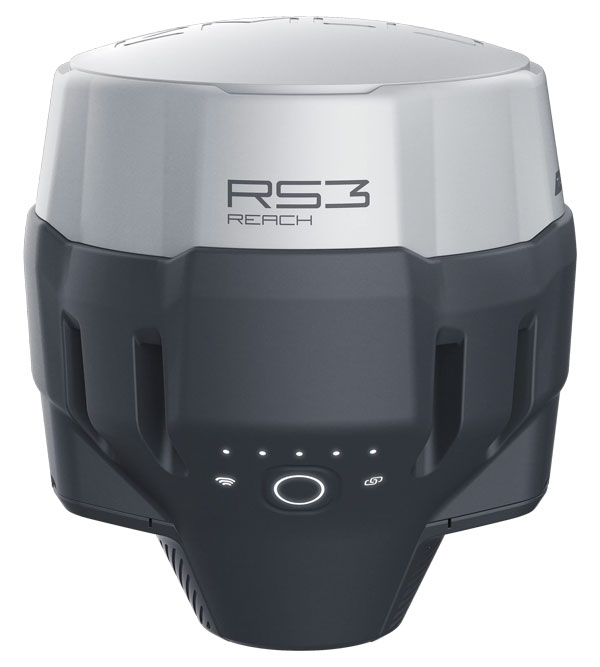
GNSS Receiver Designed for survey projects
The Reach RS3 is a GNSS receiver that features inertial measurement unit (IMU) tilt compensation and a dual-band radio for enhanced compatibility with third-party receivers. The Reach RS3 enables users to survey at large tilt angles while maintaining survey-grade accuracy. The multi-band receiver works both as a base and a rover and comes factory calibrated. The receiver offers versatile options to get corrections from continuously operating reference stations (CORS), another Reach device, or a third-party base, so users can mix and match real-time-kinematic (RTK) receivers in a fleet. Its NTRIP connectivity enables corrections from CORS, NTRIP service, or a GNSS receiver using Emlid NTRIP Caster. When connected over NTRIP, Reach works on a baseline of more than 60 km in RTK and 100 km in post-processed kinematic. Emlid, emlid.com
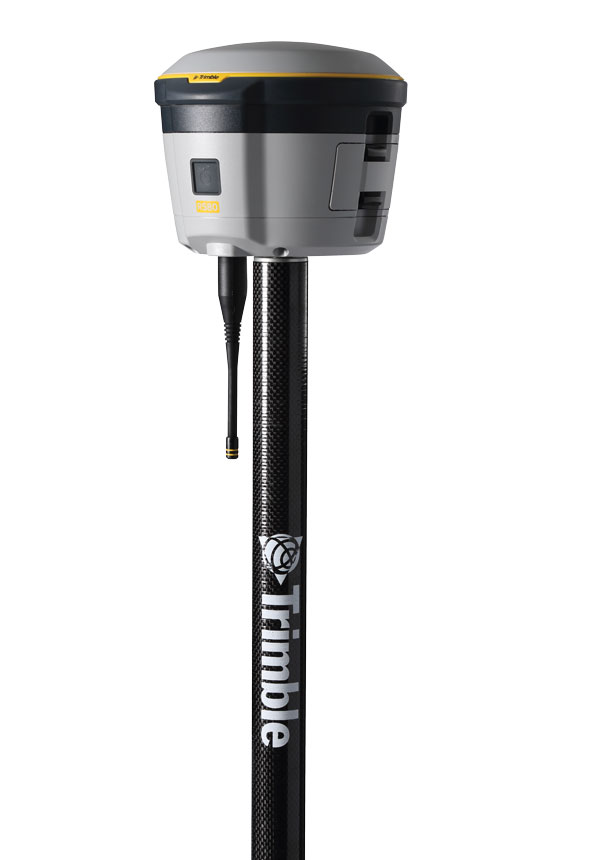
GNSS Receiver Includes Trimble ProPoint and delivers survey precision and productivity in the field
The R580 GNSS receiver enables professionals in surveying, mapping and GIS, civil construction, and utilities to capture centimeter-level positioning. With the Trimble ProPoint GNSS engine embedded, users can measure points in challenging environments, such as under tree canopy or near buildings, while EVEREST Plus technology can identify and remove unwanted multipath signals for improved accuracy and data confidence. Using the Maxwell 7 chipset technology, the receiver provides fast processing, anti-spoofing capability and the ability to track all available GNSS constellations. The R580 supports Trimble RTX correction services for RTK-level precision without the use of a local base station or VRS network wherever correction sources are available. The receiver can be paired with all current mobile devices on a variety of operating systems and platforms —from a Trimble handheld or controller to a modern smartphone or tablet. It can also be mounted on a pole, vehicle or backpack. Trimble, trimble.com
OEM
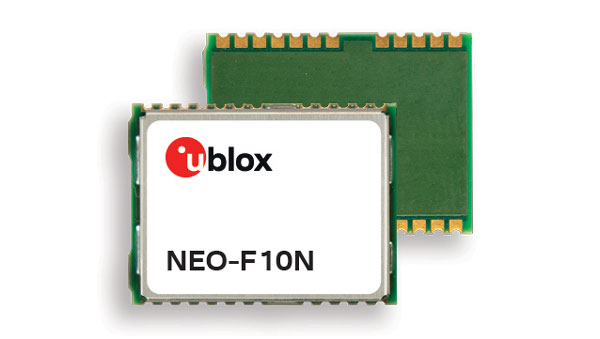
GNSS Module Supports L1/L5 GNSS bands from multiple constellations, including NavIC
The NEO-F10N positioning module is based on the u-blox NEO form factor and is equipped with u-blox F10 dual-band GNSS technology. The NEO-F10N supports L1/L5 GNSS bands from multiple constellations — including NavIC — to provide meter-level position accuracy in urban areas. Its firmware is upgradeable and configurable to support several applications such as the vehicle telematics and micromobility markets or industrial applications requiring meter-level position accuracy. The NEO-F10N improves position accuracy in urban environments with its enhanced resilience against multipath interference. By leveraging signals from both the L1 and L5 bands, this module achieves better accuracy than using the L1 band alone. Users currently employing receivers based on modules such as the u-blox NEO-M8 and NEO-M9, can migrate to the new NEO-F10N generation. The module enhances accuracy, reduces power consumption, and offers an alternative solution to users who do not want to deploy dead reckoning set-ups. u-blox,u-blox.com
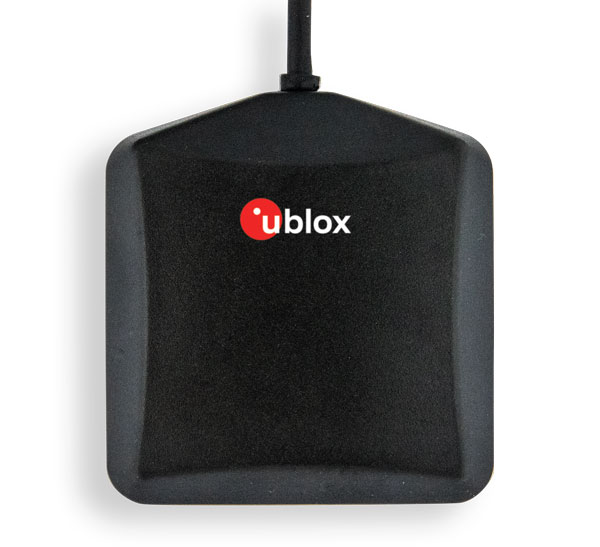
Multi-Band GNSS Antenna Designed to enhance meter-level positioning solutions
The ANN-MB5 is a multi-band (L1/L5/E5a/B2a) GNSS antenna that is optimized for the u-blox F10 platform and enables precise, reliable, and robust positioning, even in challenging environments. The antenna features concurrent reception of multiple navigation systems, including NavIC. The ANN-MB5 has a compact design with a magnetic base. u-blox, u-blox.com
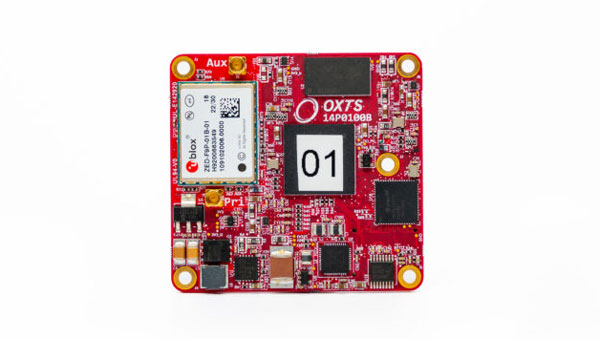
INS A product for mobile mapping, autonomy, and more
The xRED3000 inertial navigation system (INS) offers quad-constellation GNSS support for multiple applications. The INS weighs 20 g, making it suitable for aerial payloads. At 53.6 mm x 50.6 mm x 9.5 mm in size, it can be incorporated without drastically changing a user’s design. When in a GNSS-denied area, the xRED3000 provides a position accuracy of 0.5 m even after 60 seconds. It features gx/ix tight-coupling algorithms, which improve accuracy in urban canyons and speed up real-time kinematic reacquisition after temporary GNSS outages. The xRED3000 features lidar inertial odometry, which takes data from lidar in post-processing to reduce inertial measurement unit drift and improve accuracy in areas with poor or no GNSS signal. Additionally, embedded NTRIP makes it easier to get GNSS corrections. OxTS, oxts.com
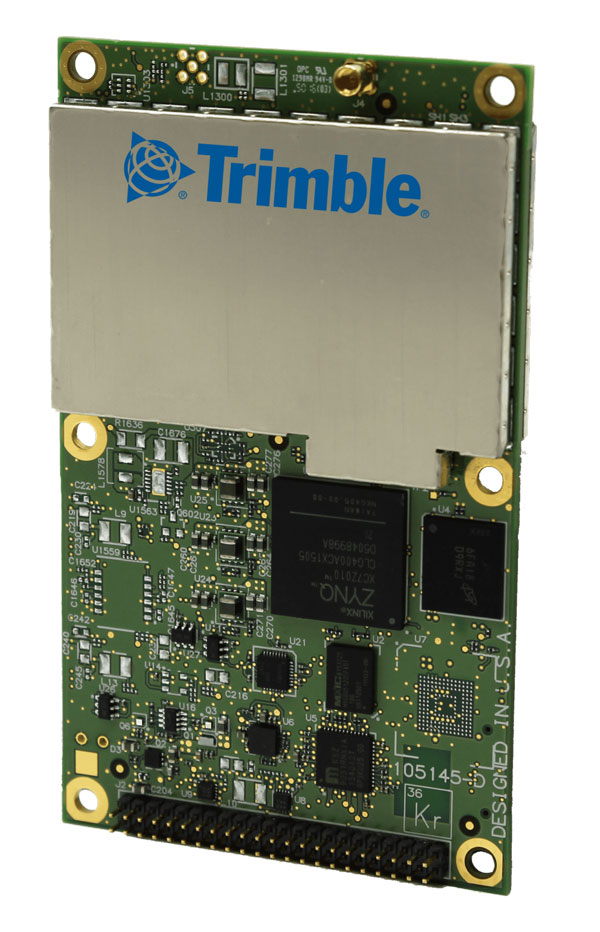
Triple Frequency GNSS Receiver Complete with a compact design for mobile applications
The BD990 supports triple frequency for the GPS, GLONASS, BeiDou and Galileo constellations. The receiver offers quick and reliable real-time kinematic (RTK) initializations for centimeter positioning. It features Trimble Maxwell 7 technology, which provides 336 tracking channels, Trimble Everest Plus multipath mitigation, and advanced RF spectrum monitoring and analysis. With the option of utilizing OmniSTAR or RTX services, the BD990 delivers varying levels of performance down to centimeter-level without the use of a base station. The BD992 also supports dual antenna GNSS heading while the BD992-INS supports position and orientation at high update rates. Trimble, oemgnss.trimble.com
MACHINE CONTROL
Automated Steering System Designed for precision agriculture applications
The SAgro150 automated steering system aims to provide farmers with an easy way to get started with auto-steering. With full-constellation tracking capability, the SAgro150 realizes ±2.5 cm auto-steering accuracy to maximize land use and yield while saving resources such as water and fertilizer. When compared to the first-generation SAgro100 system, the SAgro150 auto-steering system uses a single-antenna solution instead of a dual-antenna solution. It also features simpler integration options, only requiring a strong magnetic chuck to securely attach the antenna to the top of the tractor for satellite signal tracking. The new system also adopts dual gyroscope mode, enhancing the heading data reliability and compatibility with different tractors. The new system aids in applications such as rotary tillage, ridging, sowing and harvesting in straight line, curve, U-turn and more. SingularXYZ, singularxyz.com
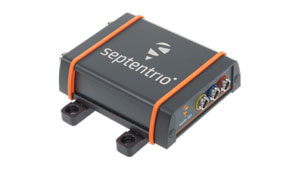
Positioning and Heading Receiver Designed for multiple applications
AsteRx SB3 Pro+ is a housed multi-frequency GNSS receiver that uses triple-band GNSS technology for reliable centimeter-level real-time kinematic (RTK) positioning and sub-degree heading. With flexibility to be used as a rover or a base station, AsteRx SB3 Pro+ also has an ultra-high update rate and logging functionality. Enclosed in a ruggedized IP68 housing, the device is suitable for harsh environments. The AsteRx SB3 Pro+ has a high update rate and low latency for fast moving vehicles or machine parts. Septentrio, septentrio.com
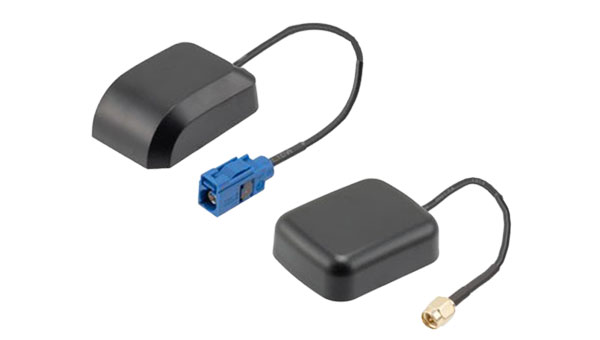
GPS Antennas Offers enhanced navigation and tracking for automotive applications
The KP Performance vehicle GPS antennas come equipped with a gain of 28 dB to capture weak signals, even in the most challenging environments. The antennas also feature high out-of-band rejection. By minimizing signal interference and multipath effects, the antennas provide good signal quality and stability. The features of the antennas enable more precise navigation and enhanced user experiences for personal vehicles, commercial fleets, or autonomous systems. The antennas have a IPX6- or IP66-rated waterproof and dustproof design for reliable operation in harsh conditions. KP Performance, kpperformance.com
Septentrio has been working on port automation projects with Kalmar, a Finnish company that offers a wide range of cargo handling solutions and services to ports, terminals, distribution centers and heavy industry. I discussed this collaboration with Stef van der Loo, market access manager at Septentrio. Following are excerpts of our conversation. For a much longer version, click here.
What are the challenges operating in a port?
In a container terminal or port, everything is interconnected and, therefore, complex. Lately, GNSS has become more popular, especially when coupled with inertial navigation, because the technology has become more capable of delivering centimeter-level accuracy even in challenging environments where the line-of-sight to GNSS satellites may be partially blocked by containers or structures.
What drives higher accuracy?
this Kalmar container handler has a Septentrio high-accuracy GNSS/INS receiver and an inertial system, which operate in challenging environments of low satellite visibility. (Image: Kalmar)
Every year, every terminal stacks a certain number of containers, but not all the information about them is given to the terminal operating system (TOS) automatically. Sometimes, operators must search for misplaced containers, which may require stopping operations and deploying additional personnel. Additionally, it is not very safe to go into these yards. This is one reason why ports began to deploy positioning systems. However, ten years ago, with meter accuracy, they were failing all the time. Now, improvements in the technology have enabled GNSS to become fit for the challenge. In terminals, you can use GNSS or INS systems for vehicle traffic management, autonomous vehicles and tasks, or to get the position of a container.
For example, when a reach stacker reaches into a stack and locks a container in place, it’s crucial to have a very reliable centimeter-level position. Errors grow as the data is processed from the control systems to the TOS. To know for certain the position of a container when it was placed in a stack errors must not exceed half a meter. Therefore, the reliability and accuracy of the GNSS/INS is crucial for container positioning.
Do you buy the IMUs and do all the integration?
We buy the IMUs mostly from Analog Devices. The integrated inertial navigation solution is our own. We focus on inertial navigation in several markets — including logistics, autonomous mining, and agricultural robotics.
What is the division of labor between you and Kalmar?
Kalmar is both an OEM and an integrator. They are a guru for the automation of logistics terminals. We work with them mainly as an integrator. They will go to a terminal, like other integrators, and install the systems and other equipment. Kalmar built a whole sensor stack with all types of sensors and integrated this in their packages, such as SmartPort. With a train-the-trainer principle, our engineers trained Kalmar employees, so they have first line control of the installations and troubleshooting. Then we are ready to support them where we can. We have a continuous feedback loop with several logistics customers for suggestions and product recommendations for the evolution of our products and services for this segment.
Straddling containers
JAVAD GNSS
Straddle carrier in operation equipped with DELTA-3S. (Image: Canva)
One of the largest container companies in the world needed a solution to manage its straddle carriers, which are specialized container handling vehicles at ports that can pick up large containers and move them to trucks, trains, or other container stacks. This is very challenging for container terminal operators because ports are highly complex operating environments that also provide other maritime services, such as storing and managing cargo, forwarding freight, and clearing customs. To handle containers safely and efficiently, modern terminals have buildings, equipment, and cranes in addition to straddle carriers. All this infrastructure creates a lot of multipath that stresses the capabilities of GNSS receivers.
To develop and install this new system for straddle carrier vehicles, the container company turned to JAVAD GNSS and to ALLSAT GmbH, a German engineering, geodetic and electronic company founded in 1991 that has been JAVAD’s German distribution partner since 1995. To address the challenge, in 2022, ALLSAT GmbH applied a new digital twin concept to supply and support the commissioning of several hundred JAVAD GNSS rover solutions at three international seaports. This required obtaining real-time and highly accurate positional data for moving straddle carriers and uploading it to a terminal information system for control and documentation.
ALLSAT deployed a geodetic conceptual design that integrates JAVAD GNSS Delta-3S receivers and RingAnt G5T and GrAnt-G5T antennas to deliver precise surveying of two GNSS reference stations per port, then commissioned the system on all the straddle carrier vehicles from a single source. It also developed a solution employing two redundantly operating reference stations that broadcast RTK correction data for all GNSS (GPS, Galileo, GLONASS, and BeiDou) on different IP addresses/radio frequencies. All the JAVAD RTK rovers can receive and process data from both correction sources in parallel thanks to their 874 channels and parallel processors. This offers two advantages. First, it provides a comprehensive fallback in the unlikely event that one reference station fails. Second, it greatly improves the reliability, speed and accuracy of the rovers, which operate in an environment rife with signal shadowing and multipath influences.
Working closely with its client and JAVAD GNSS, ALLSAT was able to implement this project, from initial idea to verification and commissioning, in only a few weeks. The combination of redundant, multi-constellation reference stations and JAVAD GNSS multi-base RTK yielded a solution that is highly reliable and available, providing for continuous operation despite the challenging environmental conditions. Additionally, JAVAD GNSS provides firmware updates for the life of the devices, which will enable the customer to rely on this base rover solution for the next 10 years.
Tracking trains
M3 Systems
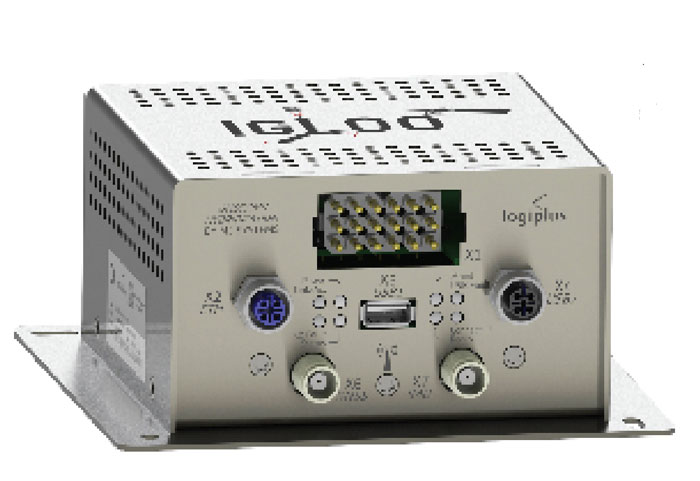
(Image: Logiplus)
M3 Systems, a French-Belgian geolocation company founded in 1999, has long supported the R&D activities of European space and civil aviation agencies. It also markets products that it developed through its R&D activities. In recent years, M3 Systems expanded its activities into the automotive and rail sectors. To develop a new device for trains, it partnered with two Belgian companies: Logiplus, which makes onboard electronic systems for trains, and ALSTOM Belgium, a division of ALSTOM group, which builds trains and equipment for train tracks. “The objective during the product design was the development of a hybrid sensor that uses both a GNSS sensor to provide absolute positioning, and an inertial measurement unit (IMU) to compensate for environmental obstructions such as trees and urban canyons by calculating the train’s position based on its last GNSS-based absolute position,” explained Jérémy Skelton, project lead at M3 Systems.
IMUs have long been coupled with GNSS because each technology compensates for the other one’s limitations: IMUs suffer from drift and GNSS receivers from signal loss in certain environments. In theory, surveying the tracks and using odometry to monitor a train’s linear position on them would suffice to locate it. In practice, however, wheel encoders “are prone to errors because the wheels are subjected to a lot of sliding and skidding,” Skelton said.“So, we need completely independent sensors.”
This requirement led ALSTOM to propose the development of the IGLOO (an acronym for IMU & GNSS vehicle odometry) input device, which integrates all the different sensors. Logiplus designed and manufactured the hardware, while M3 Systems wrote the algorithm.
The project, which was partially funded thanks to a grant from the European Regional Development Fund and supported by the Région Wallonne of Belgium, was divided into three components:
The software to couple the IMU and the GNSS to compute the train’s velocity.
The auto-calibration solution, which eliminates the need for automatic calibration when starting the sensor.
A hardware platform that incorporates a low cost IMU.
The consortium defines three kinds of zones in which a train will operate, depending on the trustworthiness in each zone of the GNSS signals. “For example, an environment with a clear view of the sky and no nearby obstacles is trustworthy,” Skelton said, “while a forest, an urban canyon, or the entry into a tunnel are not. Without GNSS support, eventually the IMU will also become unreliable.”
At very low speeds, errors must be very low, but at higher speeds a greater speed error is allowed. Operators can extract different levels of data from a GNSS receiver. To achieve a tight GNSS-INS coupling, they can use the Doppler delays and hybridize them with the IMU or use the tracking loop and set the range and Doppler. For a loose coupling, they can directly use the GNSS receiver’s positioning, velocity, and timing data. All couplings are performed by using Bayesian filters, for example the Kalman filter. “Loose coupling will give you less accuracy, reliability, and integrity, but it will also be less CPU-intensive,” Skelton said.
For data acquisition on a train, M3 Systems generated a printed circuit board (PCB) with a u-blox GNSS receiver, a Septentrio Asterix GNSS receiver, nine IMUs (which enables them to choose the best one for the use case), a reference trajectory unit that provides ground truth, and a computer that takes the data from the GNSS receivers and the IMUs. “Everything was integrated for measurement purposes on a rack on a train that runs here in Belgium,” Skelton said, “and all the data was retrieved automatically via a 4G internet connection. We have collected a few thousand kilometers traveled, a few hours of tunnels, and both trustworthy and untrustworthy GNSS signals.”
M3 Systems’ partner Logiplus designed the product to support the hybridization software and interface with the European vital computer (EVC), which monitors and continuously calculates the train’s maximum speed and braking curve. “It is critical for the EVC to have perfect knowledge of the train’s speed, which is the main reason we designed this new device,” Skelton said. “What is specific in that hardware is the computing power, the two systems (GNSS and inertial), and the data fusion algorithm, which allows the hardware to evolve. For example, we can switch to a different IMU.”
The IGLOO system complies with the specified safety requirements, contributing to a more reliable knowledge of the train speed, which reduces the risk of accidents and fatalities, improves traffic flow, and improves the efficiency and safety of the train operations, Skelton pointed out.
Surveying a railroad
Eos Positioning Systems
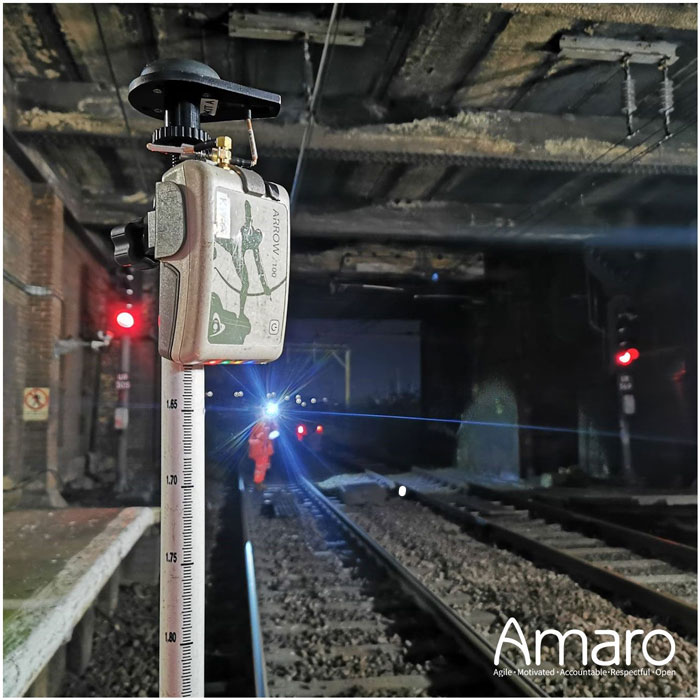
A rail tunnel at Leigh-on-Sea in East of England. Arcadis used Eos Arrow 100 GNSS receivers alongside Esri’s ArcGIS Survey123 to collect rail assets with submeter accuracy in real time. (Image: Amaro)
Network Rail, which owns and manages the railway infrastructure in England, Scotland and Wales, needed an as-is survey of up to 50,000 electrical assets along 400 miles of rails in the eastern region of the country. It turned to Arcadis, a design and consultancy firm that specializes in sustainable design and engineering services. The project required delivering accurate building information modeling (BIM) plans of the rail line to support operations and maintenance of the electrified infrastructure, while ensuring a safe working environment for the surveying teams. Using Arrow 100 GNSS receivers from Canadian manufacturer Eos Positioning Systems and Esri’s ArcGIS Survey123 and ArcGIS Hub software, Arcadis was able to efficiently capture the data with sub-meter accuracy and share it with Network Rail in real-time.
Arcadis decided to conduct a digital field survey to collect the data and to use GIS to manage it, said Gideon Simons, Associate Director of GIS and Geospatial Consultant at Arcadis. “We provided the survey teams iPads, the Esri application, and the GNSS receivers.” For corrections, it used the Ordnance Survey’s OS Net. “We found through a few assessments and testing that the Eos Arrow’s precision was good enough to meet the project’s requirements.”
The region surveyed is mostly rural but the rail line traverses some very urbanized areas. “One of the first challenges was surveying under cover in stations and in quite a few tunnels. So, we developed methodologies using georeferenced plans and imagery and taking temporary datums using GNSS outside the tunnels, to measure distance and offsets to the assets in the tunnels with measuring wheels that allowed for post-survey processing and the location accuracy required,” said Simons.
Photography was also a key to the success of the project. “In just one depot, we surveyed thousands of assets with many inside train sheds,” said Simons. “We use 360-degree cameras and train view cameras, so that we really understand where assets should be placed.”
The next stage for Network Rail is to maintain that equipment — whether it’s replacing it, bringing it up to code, or potentially installing new assets, Simons pointed out. “In the UK, we use a variety of measurements — imperial and metric. So, it’s been very helpful for the client to have just one source of truth reference that supports their work yet that can still link with other systems and ease communication with wider teams.”