Category: Applications

  • From “We don’t need it” to “We can’t live without it”

    From “We don’t need it” to “We can’t live without it”

    The Air Force was initially opposed to GPS. How did that change?

    Between 1978 and at least the mid-1980s, maybe even the late 1980s, the Air Force tried several times to cancel the program. At the time, I was a Capitol Hill staffer for the House Intelligence Committee. In one of those efforts to cancel GPS, Tom Cooper, who was a lead staffer for the House Armed Services Committee, came to me and said, “Can you guys give any reason for keeping GPS?” And I said, “Yes, it greatly improves the accuracy of SIGINT [signals intelligence] locations. It makes a very big difference.”

    So, Tom used that, along with other arguments, for why we should keep GPS. The Committee and Congress ultimately decided they would, despite the Air Force’s resistance.

    The Air Force’s resistance came from the Strategic Air Command, which in the 1980s believed it would never use satellites. They were concerned about the satellites being shot down. I found this amusing because they were flying around in aircraft at a few thousand feet and were concerned about satellites flying at 11,000 miles. But they were, so they were laggards.

    Two U.S. Marine Attack Squadron 211 F-35B Lightning IIs and two U.S. Air Force F-15 Eagles assigned to the 67th Fighter Squadron, fly over United Kingdom aircraft carrier HMS Queen Elizabeth over the west Indo-Pacific region in August 2021. (Photo: USAF/Staff Sgt. Kyle Johnson)
    Image: USAF/Staff Sgt. Kyle Johnson

    Which service adopted GPS first and why?

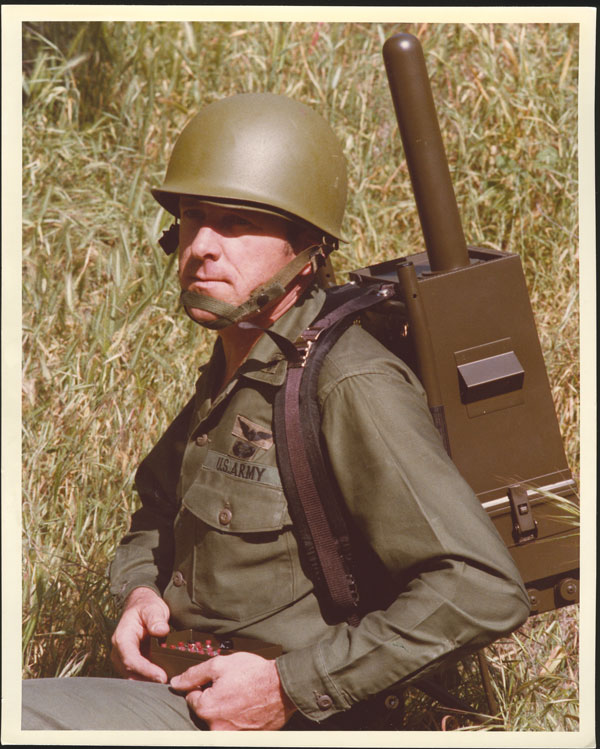
    The service that by far led the way was the Army. It spent $100 million a year absorbing NRO capabilities. They also spent money on GPS, though not as much. By the time we got to the first Gulf War, in 1991, we had a partial GPS constellation — I think of 18 satellites of the 24 required — and that meant that you didn’t have 100% coverage all day long. So, coverage maps of their areas of interest were generated every day to let people in the field know when they would have service. Most of them didn’t have receivers either. Most of the receivers they did have were Precision Lightweight GPS Receivers (PLGR), knows as “pluggers”, which were the first “handheld” receivers, but they were pretty big.

    Once the fight got going, many of the troops wrote home and asked their moms and dads to send them civilian receivers.

    Yes! Thousands and thousands of them showed up in theater. Some troops taped them to the windscreens of their helicopters or jet aircraft. They were just jury-rigged into everything because, despite their limitations at the time, they were very, very useful, unlike anything else. So, now everybody realized, “Oh my goodness, this is really a big deal. This is a game changer!”

    Then we got more modern receivers, integrated receivers, the whole thing. However, at the end of the Gulf War, the Air Force still had no plan to equip any of its aircraft with GPS. As Assistant Secretary of the Air Force, I was called over to the Armed Services Committee and asked, “What is your plan for integrating GPS receivers into your aircraft fleet?” I said, “There is no plan.” and they were incredulous. They looked at me like “Well, you’re an idiot.”

    It wasn’t me, however, and the staff knew my story before I gave it. As a result, Congress mandated it. They put it in that year’s National Defense Authorization Act (NDAA). Within less than 10 years you had Joint Direct Attack Munitions (JDAM) and other GPS-guided weapons. So, that got it moving quickly.

    By the end of the 1990s, the Air Force was fully on board and were equipping their aircraft with many weapons that depended on GPS. Meanwhile, GPS had moved to a full constellation of 24 satellites. Full operating capability was declared in 1995. The Navy proceeded similarly, but they were somewhat less affected. So, the Army remained a leader in using space.

    The Chief of Staff of the Air Force asked me about Air Force use of GPS. I said, “Chief, the Air Force builds a lot of space stuff, but it doesn’t use it.” Of course, a short time later it was using it extensively. So, this ramp-up was very rapid — just a few years from “I don’t give a darn about these things” to “I can’t live without them.”

    Brad Parkinson and his successors as JPO directors designed and built the system but had no role in its adoption, right?

    No. They were going turn it over to the production house, if you will, and they did. Once the Air Force got on board with GPS guided weapons, adoption proceeded rapidly.

    What about the Navy?

    I don’t recall the Navy particularly. I do not at all accuse them of being laggards. I think they did what they needed, whatever that was.

    Did later NDAAs expand that mandate to the other services?

    I don’t know. I was out of the government by that time, so I lost track. I don’t think it was necessary. What people didn’t understand immediately was that you could do anything with this system. At the end of the day, it is a super accurate timing signal. There are many things you could do with that and people have done them. It quickly became evident that it was so pervasively useful, that anything you could think of involves GPS, from the era of the first Gulf War onward. By 10 years later, many weapons systems in all the services were GPS-guided. I later served on the board of ATK and we were building GPS-guided artillery rounds. I am pretty sure that the ATACMS [Army Tactical Missile System] you hear about today is GPS guided.

    So, in a couple of years, all the services wanted to integrate GPS in all their platforms and weapons.

    Well, except that the amazing thing was, despite all the things that people had done with GPS in the Gulf War — starting with those helicopters that went in the first night and took out the command and control system, which were guided by Army-provided pluggers taped onto the windscreens by their pilots, and downed pilots using GPS to give their coordinates to the rescue teams — at the end of the war the Air Force still didn’t have a plan to put them on its aircraft! That’s when Congress mandated it. It was amazing.

    Despite that, once they got going, particularly once they got going with GPS-guided weapons, everything changed. I don’t know whether the Air Force became leaders, but they were certainly aggressive integrators of the program into the service. There was no more, “We won’t use satellites” and all that.

    That was after my time. I left government in early 1993. There were other big fish to fry at the same time. As important as I realized it was, I still didn’t realize how important it was, and I was way ahead of most everybody else, in the Air Force anyway.
    The Federal Aviation Administration’s (FAA’s) chief scientist at the time said, “The great thing about GPS is that it is a tool around which you can build myriad capabilities.” He outlined a few for the FAA, many of which they have since done. The same thing began to happen in the services, particularly in the Air Force, in which GPS-guided weapons were pervasive within 10 years.

    Part of Brad’s motto for JPO was “The mission of this program office is, number one, to drop five bombs in the same hole.”

    Yeah. By the way, one mistake that people make a lot is they think there were GPS-guided weapons during the first Gulf War. That was not the case. There were none by then. There were precision guided munitions that were guided by maps and lasers and a variety of means. But, despite the belief of many authors, there were no GPS-guided weapons at that time.

    So, which was the first conflict in which GPS was used?

    It was the Iraq War, in 2003. It was a major user of GPS-guided weapons.

    Any other thoughts on the 50th anniversary from the military side of things?

    It is impossible to overemphasize the importance to military operations and, frankly, to civilian life as well, of being able to easily and accurately navigate or have highly accurate time.
    You can do it with a $100 receiver, whereas it used to require a $10,000 receiver and you had to have it re-initialized from a standard. So that’s what everybody does. Now, this has created probably more dependency than is healthy and many nations have backup that we don’t have.

    Such as Loran-C. That’s a big subject of debate these days, as you know.

    Well, it’s been a subject of debate for 20 years. Everybody agrees, but nobody moves.

    The Department of Transportation recently released an action plan on the adoption of complementary PNT systems. So, there’s some movement.

    As a one-time government bureaucrat, what you do when people are on your back is launch a study and say, “Well, it will be done in a year or two.” They have done this time, after time, after time.

    There was the Volpe study more than 20 years ago.

    Exactly.

  • Lost in the desert, they demanded GPS: The adoption of GPS by the US Armed Services

    Lost in the desert, they demanded GPS: The adoption of GPS by the US Armed Services

    “I know where we are. I do not need a satellite system to tell me!” In the 1970s and 1980s, this was the number one military and civilian response to what GPS does. The existing military hardware included navigation systems and the defense industry had a vested interest in keeping its business. Civilian interest in GPS was low because of the program’s uncertain funding. The armed services saw no reason to add a new program to their budgets and were opposed to GPS.

    The military program approval process was also inconsistent with the rapid changes in digital technology. The first GPS satellite was launched in February 1978, the first PC was released in August 1981, and the first Mac in January 1984. GPS went through a development process to build user equipment, test it to make sure it met military requirements and then build the limited-rate production equipment with a design about six years old.

    Early GPS Manipack worn by JPO Army deputy Lt. Col. Paul Weber. This photo graced the cover of the first ever GPS brochure. (Image: GPS World archives)
    Early GPS Manipack worn by JPO Army deputy Lt. Col. Paul Weber. This photo graced the cover of the first ever GPS brochure. (Image: GPS World archives)

    My favorite joint service story is that our low cost, 19-lb, $55,000, hand-carry man pack flunked its first testing sequence. The Army placed it into an alkaline bath in September 1985, that ate the o-ring and caused it to fail the bio/chem decontamination requirement. The o-ring was an Air Force requirement because at 60,000 ft without venting the device would become a potential bomb. Yet, pressure relief failed to meet the Navy Seals’ requirement for underwater operation. The fixed man pack was now our limited rate production set. Developments in digital technology during the process made it overweight, over cost and unsuitable. To get hand-carry receivers, it became necessary to purchase modern civilian sets at the unexpected outbreak of the First Gulf War in 1990.

    JPO ran a competition for 200 civilian receivers that had no military requirements to send them to the operational forces for training. Trimble won the competition and when the war came the following year with only 12 GPS satellites operational, JPO asked Trimble to deliver as many sets as it could produce at the price bid for the competition to augment the deliveries of the limited rate production military set. Talk about an operational education! The Army tank drivers who did not want GPS because “The war comes to us, so we do not need GPS” instantly demanded GPS receivers when they began to get lost by more than 10 miles on the featureless desert. The deployed troops began asking their parents for GPS receivers for personal use. The war integrated GPS into all military operations.

    Realizing the value of GPS inter-service integration of forces, the military believed the civilian signal should only have degraded accuracy. But in May 2000, President Clinton decided the civilians also should have good accuracy and ordered that the degradation of the civilian signal (called Selective Availability) should cease. Today everybody is aware of what GPS provides. You never hear anyone say, “I know where I am, I do not need satellites to tell me.”

  • Point One Navigation expands location solutions to cover Great Britain

    Point One Navigation expands location solutions to cover Great Britain

    Image: Point One Navigation
    Image: Point One Navigation

    Point One Navigation has integrated Ordnance Survey base stations into the Polaris Network, which is designed to improve accuracy, precision, reliability and interoperability in the UK. The solutions aim to aid in applications such as advanced driver assistance (ADAS), robotics, mapping and more.  

    Polaris is a real time kinematic (RTK) corrections network that offers cm-level accurate GNSS positioning. Polaris’ global RTK network now includes the entire United States, EU, Australia, Canada and the UK. 

    Existing Polaris customers can utilize the UK integration immediately, at no additional cost. 

    This technology is complemented by the company’s FusionEngine software, which further integrates inertial measurement, wheel odometry and additional sensors to achieve the desired level of precision, even in the absence of satellite signals.  

    Polaris supports all major GNSS constellations and has a dense global network of base stations, which offers improved precision acquisition time in more places, the company says. The network supports all modern navigation signals across all mobile networks. 

    According to Point One, it is the first localization service with a modern GraphQL-based API, which aims to improve the integration of Polaris RTK into developer-built applications. It can be used by software developers to integrate RTK into demanding applications, including industrial autonomy, precision agriculture, logistics and delivery, robots and ADAS.  

    It will support State Space Representation (SSR) corrections delivered by L-band satellites in early 2024, the company says, which will allow for operations to continue in the absence of cellular networks or in bandwidth constrained applications.   

  • RIEGL launches three airborne survey systems

    RIEGL launches three airborne survey systems

    RIEGL has released three airborne survey products. The three systems are designed to enhance sensor performances and capabilities in various segments, from terrestrial, to mobile and airborne applications.

    RIEGL VQX-2 – Helicopter pod for airborne surveying

    Image: RIEGL
    Image: RIEGL

    The VQX-2 helicopter pod is  designed for airborne data collection. It integrates a RIEGL laser scanner, a high-performance IMU/GNSS unit, and up to five cameras. It also can be easily mounted and dismounted onto UAVs.

    The VQX-2 can be used in a variety of applications such as corridor mapping, surveying large areas from high altitudes, monitoring glaciers and landslides and more. The solution includes the corresponding cabling; a “Minor Change Approval” is already available for Airbus Helicopters AS350 series helicopters.

    RIEGL VQ-680 OEM – Airborne lidar scanning module for OEM integration

    Image: RIEGL
    Image: RIEGL

    The VQ-680 compact airborne lidar scanner OEM is designed to be integrated with large-format cameras or other sensors in complex hybrid system solutions.

    The module can be mounted inside a camera system connected to the IMU/GNSS system and various camera modules through a sturdy mechanical interface. It also has laser pulse repetition rates of up to 2.4 MHz and 2 million measurements per second.

    The VQ-680 is ideal for large-scale applications in urban mapping, forestry and power line surveying, the company says. With a wide field view of 60º andRIEGL’s nadir/forward/backward (NFB) scanning, the system offers five scan directions up to ± 20º. This technology provides users exceptional coverage of vertical structures such as building facades or power poles at high accuracy.  

    The OEM’s sister type, the VQ-680, is offered as a high-end airborne lidar scanner that offers the full range of performance in a compact and lightweight scanner. This scanner can be coupled with up to six high-resolution RGB/NIR cameras and mounted onto appropriate aircraft hatches with or without using stabilized platforms. 

    RIEGL VUX-180-24 –UAV lidar sensor for high-speed surveying missions 

    Image: RIEGL
    Image: RIEGL

    The VUX-180-24 offers a wide field of view of 75º and a high pulse repetition rate of up to 2.4 MHz. These features – in combination with an increased scan speed of up to 800 lines per second – make it suitable for high-speed surveying missions and applications where an optimal line and point distribution is required.

    Typical applications include mapping and monitoring of critical infrastructure such as power lines, railway tracks, pipelines, and runways. The  VUX-180-24 provides mechanical and electrical interfaces for IMU/GNSS integration and up to five external cameras. For smooth and straight forward data storage, an internal SSD memory with 2 TByte storage capacity and a removable CFast memory card are available.

    This sensor can be coupled with RIEGL’s VUX-120, VU-160, and VUX-240 series UAVs. The system is available as a stand-alone sensor or in various fully integrated laser scanning system configurations with IMU/GNSS systems and optional cameras.

  • ComNav introduces 3D laser scanning system

    ComNav introduces 3D laser scanning system


    Image: ComNav Technology
    Image: ComNav Technology

    ComNav Technology has released the LS300 3D laser scanning measurement system.

    The scanner utilizes simultaneous localization and mapping (SLAM) technology, and advanced real time and mapping techniques. It operates autonomously, independent of GNSS positioning, which makes it ideal for harsh conditions in both indoor and outdoor environments.

    LS300 includes a 120-meter working range and a high sampling rate of 0.32 million points per second. Its point cloud accuracy is designed to perform in low reflectivity extended-range mode. The system is compatible with specialized kits, including the handheld form, back kit, car-mount and UAV kit.

    Image: ComNav Technology
    Image: ComNav Technology

    The handheld mode is best suited for navigating narrow tunnels and large venues, while the backpack is designed for outdoor environments. The car mount can rapidly scan roadside facilities, and the UAV kit seamlessly pairs with the DJI M300 for aerial control. The LS 300 is suitable for a variety of applications, including smart city, digitization of underground facilities, geology, surveying and mapping, agriculture, mining and forestry.

    The scanner uses a unique hybrid HSL technology. This allows for preliminary processing during the scanning process, which aims to accelerates the collection of high-precision data and expedites data processing. It offers real-time viewing of point cloud data through a mobile application and supports multiple interaction modes.

    By using data processing software specifically designed and developed for the LS series by ComNav, users can handle large volumes of point cloud data and simplify complex tasks, including point cloud denoising, point cloud splicing, shadow rendering, coordinate transformation, automatic horizontal plane fitting, automatic point cloud data report generation, forward photography, and point cloud encapsulation. This allows users to efficiently process intricate point cloud data, resulting in precise measurement and modeling outcomes.

    During data post-processing, users can input absolute coordinates of control points, which allows these control points to make comprehensive adjustments to the data and improve scanning data accuracy.

    The LS300 also incorporates a redundant battery design with two hot-swappable batteries, designed for prolonged operation without frequent charging or interruptions. This innovative approach contributes to enhanced safety, reliability, and efficiency, the company says.

  • CHC Navigation introduces USV for bathymetric surveys

    CHC Navigation introduces USV for bathymetric surveys

    Image: CHCNAV
    Image: CHCNAV

    CHC Navigation (CHCNAV) has launched the Apache 3 Pro, a compact hydrographic uncrewed surface vessel (USV) designed for autonomous bathymetric surveys in shallow waters. A lightweight carbon fiber hull with IP67-rated ingress protection and semi-recessed motor provides durability and maneuverability.

    Featuring CHCNAV’s GNSS RTK + inertial navigation sensor, the Apache 3 Pro offers consistent, high-precision positioning and heading data even when navigating under bridges or in areas with obstructed satellite signals. The built-in CHCNAV D270 echosounder allows for reliable depth measurement from 0.2 to 40 meters.

    The Apache 3 Pro is also equipped with a millimeter-wave radar system that detects obstacles within a wide 110° field of view. When an obstacle is encountered, the USV autonomously charts a new course to safely navigate around it. The vessel uses both 4G and 2.4GHz networks to facilitate effective data transfer.

    Weighing only 10 kg, it features a lightweight macromolecular polyester carbon fiber and Kevlar composite hull for improved resilience. Even with a fully integrated payload, the USV can be easily deployed and controlled by a single operator in a variety of environmental conditions.

    The Apache 3 Pro ensures reliable communications through its integrated SIM and network bridge with automatic switching. It also features seamless cloud-based remote monitoring that offers real-time status updates to enhance control and security. Its semi-recessed brushless internal rotor motors minimize drafts, which can improve the USV’s maneuverability in varying water depths.

  • Beyond the frontlines: The far-reaching effects of electronic warfare

    Beyond the frontlines: The far-reaching effects of electronic warfare

    Image: guvendemir/ E+/Getty Images
    Image: guvendemir/ E+/Getty Images

    Electronic warfare in the Middle East and Ukraine is affecting air travel far beyond the battlefields, unnerving pilots and revealing unintended consequences of a tactic that experts believe will become more widespread, reported The New York Times 

    Planes are losing satellite signals, flights have been diverted and pilots have received false location reports or inaccurate warnings that they were flying close to terrain, according to European Union safety regulators and an internal airline memo viewed by The New York Times. The Federal Aviation Administration (FAA) has also warned pilots about GPS jamming in the Middle East. 

    Following Russia’s invasion of Ukraine in early 2022, radio frequency interference only continues to increase across the Middle East as of autumn 2023. These interferences can involve jamming GNSS signals to obstruct or block them using noise, or mimicking signals to trick GNSS receivers into picking up counterfeit satellite signals, known as spoofing.  

    Aircraft systems have been unable to detect GPS spoofing and ultimately correct for it. According to Opsgroup, an organization that monitors changes and risks in the aviation industry, one Embraer jet bound for Dubai nearly veered into Iranian airspace in September before the pilots figured out the plane was chasing a false signal. 

    “We only realized there was an issue because the autopilot started turning to the left and right, so it was obvious that something was wrong,” crew members reported to Opsgroup. 

    Issues arise 

    With the rise of electronic warfare, the strain on aviation could be a sign of more serious economic and security issues.  

    The U.S. government calls GNSS signals “an invisible utility.” Smartphones, cars, stock exchanges, data centers and countless industries rely on them for time, navigation or both. Similar systems exist around the world, such as Galileo in Europe, Glonass in Russia, QZSS in Japan, NavIC in India and BeiDou in China. One study from Britain said a five-day disruption of satellite signals could cost the country $6.3 billion. 

    Minor interference with GPS signals is fairly common. GPS jamming devices, while illegal to use, are inexpensive and easy to obtain from vendors on the internet. Governments, too, have been more willing to overtly interfere with signals as a tactic in electronic warfare. 

    It is not always possible to distinguish jamming from spoofing, or to determine who is behind the interference. Israel said in mid-October it had restricted GPS in the region and had warned pilots not to rely on satellite navigation systems for landing.  

    Russian interference is well-documented. A 2019 report by the Washington-based analytical nonprofit group C4ADS showed extensive spoofing from a Russian-controlled air base in Syria. Reports also indicated that, when Russian President, Vladimir Putin, traveled to remote locations or Russian-occupied Crimea, he was flanked by mobile GPS-spoofing technology. 

    Russia has disrupted GPS signals to misdirect Ukrainian UAVs and throw precision-guided shells off their targets. Ukraine also jams Russian receivers but lacks the same level of sophistication 

    Jamming is common in conflict zones. Spoofing, until recently, was considered rare.   

    The interference has been felt up to 190 miles away from battlefields and “appears to go well beyond simple military mission effectiveness,” according to Eurocontrol, Europe’s primary air-traffic-control manager. The worst-affected regions include the aerial space above the Black Sea area from Turkey to Azerbaijan; the Mediterranean Sea extending from Cyprus to Libya; the Baltic Sea near Poland and Latvia; and the Arctic near Finland and Norway. 

    Airbus said it recorded nearly 50,000 interference events on its aircraft last year, more than four times as many as the year before. This came on top of an over twentyfold jump in radio-interference events from 2017 to 2018, as recorded by a voluntary incident reporting system run by Eurocontrol. Eurocontrol said the increased jamming since 2018 was most likely meant to interfere with battlefield UAVs. 

    In the Middle East, there have been reports of false signals telling pilots their aircraft were directly above the airport in Tel Aviv despite being far away. Opsgroup said it had received around 50 similar reports. In some cases, onboard equipment showed that planes were approaching airports in Baghdad, Cairo or Beirut, Lebanon, when they were not. 

    Looking ahead 

    Spoofing is hard to distinguish because the signal appears legitimate. Only Europe’s Galileo incorporates an authentication system that can verify when a signal is from its satellites. Galileo, which currently is the most accurate and precise navigation satellite system, plans to introduce an even stronger level of authentication, according to the European Commission. 

    But even Galileo’s authentication cannot protect against one of the most dreaded types of spoofing, known as “meaconing.” In a meaconing attack, a spoofer would record satellite signals, and then rebroadcast them with an amplification or a delay. Experts have not publicly confirmed any meaconing attacks in the Middle East. 

    Opsgroup said the latest events should prompt manufacturers to re-examine the integration of satellite signals in aircraft electronics, known as avionics, without a safeguard that can identify false signals.

    In this environment of intentional GPS jamming and spoofing, Israel has produced a leading anti-jam technology company, InfiniDome, located in Caesarea. According to co-founder Omer Sharar, the company has been working to defend GPS signals for more than seven years and has also seen the rise of devices to jam the GPS L1 frequency that anyone can buy online for $100.   

    Gpsdome-1 (left) protects GPS L1. GPSdome-2 (right) protects GPS L1/L2 or GPS L1/GLONASS L1.
    Gpsdome-1 (left) protects GPS L1. GPSdome-2 (right) protects GPS L1/L2 or GPS L1/GLONASS L1. (Image: InfiniDome)

    Most readily available jammer electronics only output interference disrupting GPS L1, which is commonly installed for vehicle tracking and UAV guidance. InfiniDome says it has successfully protected trucking, UAV operations and others in Israel and around the world with its Infinidome GPSdome-1 and GPSdome-2 anti-jam products. 

    It is clear the conflict’s repercussions extend well beyond the battlefield, highlighting the critical need for security assessments or alternative PNT systems to protect civilians. While there is going to be a significant impact on commercial airline travel to and from Israel while hostilities continue, there is hope for a possible long-term solution for the intense jamming that has plagued the region for years.  

  • BAE Systems enhances GPS technology for Eurofighter Typhoon

    BAE Systems enhances GPS technology for Eurofighter Typhoon

    BAE Systems’ digital GPS anti-jam receiver (DIGAR) has entered the next phase of the Phase 4 Enhancements (P4E) capability program for the Eurofighter Typhoon.

    DIGAR is designed to enhance the Typhoon’s ability to withstand GPS signal jamming, spoofing, and radio frequency (RF) interference, ensuring optimal mission execution in challenging RF environments.

    The receiver uses advanced antenna electronics, high-performance signal processing and digital beamforming for improved GPS signal reception and jamming immunity, which aim to increase the level of GPS jamming protection. These capabilities are critical for combat aircraft as they maneuver through a contested battlespace.

    This upgrade, coupled with BAE Systems’ GEMVII-6 airborne digital GPS receiver, reinforces the Eurofighter Typhoon’s role as a component in air security for the UK and its international allies.

    In recent years, BAE Systems delivered the first Eurofighter Typhoon fighter aircraft to the Royal Air Force of Oman and the Italian Air Force officially received its final Eurofighter Typhoon, which completed its order for 21 aircraft.

    In addition to Typhoon, DIGAR is also installed on the F-16, F-15, and other special-purpose aircraft in the United States such as air interdiction and force protection platforms, intelligence, surveillance or reconnaissance aircraft and UAVs.

  • Seen & heard: BeiDou birds and spoofing target airlines

    Seen & heard: BeiDou birds and spoofing target airlines

    “Seen & Heard” is a monthly feature of GPS World magazine, traveling the world to capture interesting and unusual news stories involving the GNSS/PNT industry.


    galitskaya/iStock/Getty Images Plus/Getty Images
    Image: galitskaya/iStock/Getty Images Plus/Getty Images

    The scooter burglar

    By using location data and a username from a Lime rental scooter, police have identified a man caught on video scootering around a Denver, Colorado, neighborhood loading up on stolen goods from surrounding homes, reported 9 News. Police obtained a search warrant for the scooter’s location data and account information. The suspect appears to have used his real name when renting the scooter to conduct the burglaries. 9 News is not naming the man identified as the scooter user as he hasn’t been arrested or charged. However, a background check on his name revealed he’s currently wanted on two theft cases that occurred in 2022, also in Denver.


    Doordashing goes wrong

    Image: ProjectB/E+/Getty Images
    Image: ProjectB/E+/Getty Images

    A DoorDash driver followed his navigation system into a wooded area and then into a body of water while attempting to deliver an order to a residential neighborhood in Middleton, Massachusetts, reported the Daily Caller. After following the navigation system straight into water, the driver called police. The Middleton Police Department is now charging the DoorDash driver for “negligent operation of a motor vehicle” and has put in a request to suspend the driver’s license.


    BeiDou birds

    Image: Paola Iamunno/iStock/Getty Images Plus/Getty Images
    Image: Paola Iamunno/iStock/Getty Images Plus/Getty Images

    Researchers at the Jiangxi Nanfengmian National Nature Reserve in China are utilizing BeiDou during bird banding to monitor their migration period from September to October. Bird banding involves attaching customized tags to birds’ legs or wings to track their movements and patterns. Out of 614 birds, 36 are being equipped with specially designed positioning devices that will continuously transmit data for researchers to analyze migration routes, stopping places, and migration time, according to a nature reserve official.


    Spoofing targets airlines

    Image: Chalabala/iStock/Getty Images Plus/Getty Images
    Image: Chalabala/iStock/Getty Images Plus/Getty Images

    More than 20 airline and corporate jets flying over Iran overnight on October 1, were targeted by spoofed GPS signals. The spoofed signals were sent from the ground, infiltrated the navigation systems of the jets, and steered them off course, reported The Times of India. According to the Ops Group, which runs a flight data intelligence crowdsourcing website, a majority of the GPS spoofing occurred in airway UM688 in Iran’s airspace. In response, the U.S. Federal Aviation Administration issued this warning to airlines: “Iraq/Azerbaijan — GPS jamming and spoofing poses safety risk.”

  • Point One Navigation launches real-time INS

    Point One Navigation launches real-time INS

    Image: Point One Navigation
    Image: Point One Navigation

    Point One Navigation has introduced the Atlas inertial navigation system (INS) designed for autonomous vehicles, mapping and other applications.

    Traditional INS solutions have typically relied on extensive post-processing to reach the high precision levels needed for accurate mapping and observability applications. In contrast, Atlas can provide users with ground-truth level accuracy in real-time, which can streamline engineering workflows, significantly reduce project costs and improve operational efficiency.

    Atlas is designed to be used in large fleets. It integrates a highly accurate, low-cost GNSS receiver and IMU with the Polaris RTK corrections network and Sensor Fusion algorithms. The company aims to make it easier for businesses to equip their entire autonomous fleets with high-accuracy INS.

    The system features a user-friendly interface, on-device data storage and both ethernet and Wi-Fi connectivity. Field engineers can easily configure and operate Atlas using smartphones, tablets and in-car displays.

    Atlas aims to drive innovation across a variety of sectors, including autonomous vehicles, robotics, mapping and photogrammetry. Its real-time capabilities and affordability can enhance the widespread deployment of ground truth-level location in fleet operations.

  • Inertial Labs awarded SBIR Phase III contract for CAPSS

    Inertial Labs awarded SBIR Phase III contract for CAPSS

    Image: U.S. Army logoInertial Labs has been awarded an SBIR Phase III contract by the Army Applications Laboratory of Army Futures Command. This award supports Inertial Labs development, design and fabrication of the Cannon Artillery Pointing and Sighting System (CAPSS) for potential use on the U.S. Army’s Paladin and the extended range cannon artillery (ERCA) vehicles.

    The CAPSS aims to dramatically reduce weight on the target vehicle platforms by providing a digital replacement for the vehicle’s current panoramic telescope (PANTEL). The PANTEL is used as a sighting system for the gun when the fire control system is inoperable. The CAPSS prototype is being designed to physically replace the PANTEL.

    CAPSS is a collection of cameras, inertial measurement units (IMUs), advanced electronics and an intuitive tablet-based user interface. Designed to digitally mirror the PANTEL, the CAPSS system allows soldiers to emulate all PANTEL functions via the tablet, bypassing the need to physically manage the telescope.

    More than 400 lbs in equipment weight is eliminated by replacing the current equipment with CAPSS, which improves the vehicle’s operational efficiency. Additionally, the features integrated within CAPSS eliminate the need for warfighters to leave the vehicle cabin for typical aiming and sighting activities connected to the PANTEL setup, such as working with the auto-collimator. All of the functionalities are inherently embedded in the CAPSS, which simplifies operations.

    The CAPSS camera technology is also used for semi-automated ranging capabilities. Warfighters can effortlessly zoom in on specific objects, offer estimated data based on the object’s attributes, such as size estimation, and the system will generate the estimated range to that particular object.

    Looking ahead, Inertial Labs plans to continue research on optical/inertial-based GPS-denied navigation designed for land vehicles, integrating both camera systems and inertial sensor data.

  • Using GNSS Phase Reflectometry on Maui’s Haleakalā

    Using GNSS Phase Reflectometry on Maui’s Haleakalā

    Read Richard Langley’s introduction to this article:Innovation Insights: Science in paradise”


    Originally developed for navigation and timing applications, signals from global navigation satellite systems (GNSS) are now commonly used for geophysical remote sensing applications, including observation of Earth’s surface and atmosphere using near sea-level ground stations as well as mountaintop, airborne and spaceborne platforms. GNSS reflectometry (abbreviated GNSS-R), which is the technique of using reflected signals to measure properties of Earth’s surface, has been a growing area of research and application for GNSS remote sensing. Notably, the Cyclone Global Navigation Satellite System (CYGNSS) satellite mission produces delay-Doppler maps (DDMs) that are used to monitor ocean surface wind speeds during hurricanes. Meanwhile, terrestrial and airborne GNSS-R has been used to monitor soil moisture, snow depth and vegetation growth. One area of increasing interest is precision reflectometry using signal carrier-phase measurements. The first attempt to perform precision (phase) altimetry over sea ice using GPS reflectometry measurements from the low-Earth orbiting TechDemoSat-1 was reported by researchers in 2017. Subsequently, researchers demonstrated the use of reflections collected by a Spire satellite to perform altimetry over Hudson Bay and the Java Sea and how reflections off ice in the polar regions can be used to measure ionospheric total electron content over the polar caps. While these demonstrations of GNSS-R for precision carrier-phase-based reflectometry are promising, more work needs to be done to characterize when carrier-based altimetry is feasible and what challenges it faces.

    To study the challenges associated with processing reflected and low-elevation-angle radio occultation signals, the University of Colorado (CU) Boulder Satellite Navigation and Sensing (SeNSe) Laboratory has deployed a GNSS data collection site on top of Mount Haleakalā on the island of Maui, Hawaii. Recent collection campaigns aim to use this site as a testbed for GNSS-R algorithms that utilize multi-frequency and multi-polarization measurements. Previously, we carried out delay map processing for left-hand circular (LHC) and right-hand circular (RHC) polarizations for L1 and L2 GPS signals. Those results validate the open-loop processing methodology and provide an initial assessment of the data quality. We observed that the received reflected signals show deep and rapid fading in amplitude. In the work reported in this article, we extend our assessment to triple-frequency GPS (L1CA, L2C, L5Q) signals and document our methodology for extraction of the signal carrier phase. Our initial results indicate that coherent signal phase extraction is challenging, and may not be feasible for this particular experiment setup. We discuss ways in which the experiment may be improved for the purpose of obtaining coherent ocean surface reflections in the future.

    EXPERIMENT BACKGROUND

    The current form of the CU SeNSe Lab Mount Haleakalā GNSS experiment was deployed in June 2020. It consists of a side-facing dual-polarization horn antenna, which is shown in the left panel of FIGURE 1, along with a zenith-facing reference antenna. The horizontally- and vertically-polarized wideband signals from the horn antenna are fed into front-end hardware and are combined using 90-degree phase combiners to form LHC and RHC polarized signals, which are then recorded by a set of Ettus Universal Software Radio Peripherals (USRPs). Meanwhile, the signal from the reference antenna is sent to a Septentrio PolaRxS receiver. The right panel in Figure 1 illustrates the system setup. Note that the Septentrio onboard oven-controlled crystal oscillator is used to drive the USRPs. This allows us to use the Septentrio outputs to estimate the receiver clock variations and use them in the receiver clock component of our open-loop models, which we discuss below.

    Figure 1 The side-facing horn antenna in its radome enclosure (left panel) and the hardware block diagram of the data collection system (right panel). (All figures provided by the authors)
    Figure 1: The side-facing horn antenna in its radome enclosure (left panel) and the hardware block diagram of the data collection system (right panel). (All figures provided by the authors)

    Each USRP can record up to four signals at two different mixdown frequencies, allowing for recording of both the RHC and LHC polarized signals on up to four different bands. The first USRP records the L1 and L2 bands with center frequencies at 1575.42 and 1227.6 MHz, respectively, at a bandwidth of 5 MHz. The second USRP records the L5 and E6/B3 bands at center frequencies of 1176.45 and 1271.25 MHz and at a 20 MHz bandwidth. TABLE 1 lists the IDs for each receive channel along with its corresponding band, polarization and sampling rate. Note that the recorded signals covering the E6 band also capture BeiDou B3 signals, but we restrict our analysis to GPS L1, L2 and L5 signals in this article. The samples from these USRPs are written to disk along with the Septentrio Binary Format (SBF) output of the PolaRxS receiver.

    Table 1 Receiver IDs with corresponding band and polarization.
    Table 1: Receiver IDs with corresponding band and polarization.

    Starting in June 2021, periodic collections were taken for around one hour at a time, which is about the amount of time it takes for a GPS satellite to pass from an elevation angle of 0 degrees to one of more than 20 degrees. The collection times were adjusted to target the passes of satellites whose specular reflection point passed within the azimuthal range of the horn antenna, which faces roughly to the south and has a beam width of around 60 degrees. FIGURE 2 summarizes the available datasets from the first month of collections. The right-most panels of FIGURE 3 show examples of the specular track for GPS PRN 6 as it sets over the horizon on June 13, 2022, at around 12:00-13:00 UT. This is the pass on which we focus in this work, since PRN 6 transmits the L1CA, L2C and L5 signals and consistently had a specular point in our region of interest.

    Figure 2 Available data during the first month of collections. The average significant wave height in the region south of Haleakalā is also plotted. Numbers near the bottom indicate the datasets analyzed for this article.
    Figure 2: Available data during the first month of collections. The average significant wave height in the region south of Haleakalā is also plotted. Numbers near the bottom indicate the datasets analyzed for this article.

    METHODOLOGY

    Our processing method for open-loop tracking of the reflected GNSS signals is based on our previous work in which we produced DDMs and delay maps of the signal-to-noise ratio (SNR) measurements for multiple signal frequencies and received polarizations.

    Pseudorange Model. We start by generating a model of the pseudorange for both the direct and reflected signal. The model only needs to be accurate down to the chip level, since we correlate across several chips of delay for the received signals. Setting a somewhat arbitrary accuracy requirement of 0.5 chips (equivalent to a delay of around 150 meters for L1CA/L2C or 15 meters for L5 signals), allows us to ignore path delays from the ionosphere and troposphere, which should only account for up to several meters of delay. The model has three terms that we estimate relative to GPS System Time (GPST): the receiver clock error, the satellite transmitter clock error and the geometric range. We use a surveyed position of the horn antenna along with International GNSS Service precise orbit and clock products for the transmitter clock error and positions. These allow us to compute the transmitter clock error and path delay for the direct signal. The reflected signal path delay can be found by computing the specular reflection point on the WGS84 ellipsoid and adding the distances from the transmitter to the specular point and the specular point to the receiver. The remaining term to estimate is the receiver clock error. Recall that our USRPs are driven by the Septentrio internal oscillator. Therefore, the clock error in Septentrio measurements is associated with variations in the reference oscillator for the USRPs. We utilize a geodetic detrending technique to estimate these clock variations and apply them to our pseudorange model. To construct the full receiver clock error, we estimate the time-alignment of the samples near the beginning of the collections to GPST by tracking one minute of a strong, mid-elevation-angle satellite and decoding its timing information. This provides us with an estimate of GPST at the start of the file, which we can use to construct a full estimate of the GPST at any sample in the file. Also, given our pseudorange model, we can find the received code phase and the Doppler frequency.

    Figure 3 Example of delay maps from GPS PRN 6. The panels to the left show delay maps for the L1CA, L2C and L5 signals, both RHC and LHC polarizations. The bottom panel shows the corresponding elevation angle over the duration of the pass. The maps to the right show the specular point location during the pass, along with a contour of the WW3 model for significant wave height and swell-significant wave height.
    Figure 3: Example of delay maps from GPS PRN 6. The panels to the left show delay maps for the L1CA, L2C and L5 signals, both RHC and LHC polarizations. The bottom panel shows the corresponding elevation angle over the duration of the pass. The maps to the right show the specular point location during the pass, along with a contour of the WW3 model for significant wave height and swell-significant wave height.

    Signal Correlation. Using the established code phase and Doppler models, we generate correlations for both reflected and direct signals. We correlate a reference signal over each 1-millisecond interval, and for sanity-checking purposes, we compute correlations over ± 3 chips at 0.5 chip spacing. This results in in-phase and quadrature (I/Q) correlation outputs every 1 millisecond. The left panels in Figure 3 show examples of the processed reflected signals for RHC and LHC polarization L1CA, L2C and L5Q signals from PRN 6 on June 13, 2021, at 12:00-13:00 UT. Note that as the satellite sets, at around 4 degrees elevation angle, the reflected signals merge with the stronger direct signal on the L1 and L2 signals. This happens later on L5 due to its higher bandwidth. We use the 0.0 chip bin to obtain I/Q outputs for carrier-phase processing for L1 and L2. For L5, we use the 0.0, -0.5, or -1.0 chip bin to account for model mismatch toward the end of the file.

    Signal Fading and the WW3 Ocean Model. An eventual goal of the Haleakalā reflectometry experiment is to compare the characteristics of processed reflected signals with the ocean surface parameters near the specular point and glistening zone. To this end, we have incorporated data from the Hawaii regional WaveWatcher 3 (WW3) model. The model outputs information about wave height, direction and period due to both wind and swell, and has a resolution of around 5 kilometers. The data from this model is available in NetCDF format from several web services. The right panels of Figure 3 show contours of the wind- and swell-significant wave height in the South Haleakalā region. Meanwhile, note that the reflected signals (left panels) show high variability in the received power throughout the duration of the collection. While we hoped to be able to immediately observe a correlation between these wave parameters and the power fluctuations, it is clear that we need additional processing to tease out such a signal, and the changing satellite geometry will likely make this difficult to observe and validate. Even still, our results at the end of this article will show that there is likely some correlation between fading and wind parameters, though to what extent is unknown. Finally, note that the LHC polarizations (RX6, RX8, RX2) show much stronger reflected signals than the RHC polarizations. Since we are interested in processing the phase for the reflected signals, we report exclusively on the use of the LHC polarization signals in the rest of this article.

    Carrier-Phase Processing. Once the correlations are performed, we take the I/Q correlations for both direct and reflected signals and process them to retrieve the cleaned reflected signal phase. The first series of steps in this process involve processing the direct signal to determine navigation / overlay symbol alignment and to estimate any residual phase fluctuations, which are mostly due to unmodeled receiver clock fluctuations. FIGURE 4 illustrates this process for the L1CA signal. The raw I/Q correlations are shown in the top panel. To these we apply a Costas phase-lock loop (PLL) to track the residual phase fluctuations without being sensitive to navigation / overlay symbol transitions. Next, we remove these residual phase fluctuations to obtain the detrended I/Q values.

    Figure 4 The I/Q data cleaning process for the L1CA direct signal.
    Figure 4: The I/Q data cleaning process for the L1CA direct signal.

    As shown in the second panel, these quadrature components of the detrended I/Q values are centered at zero while the in-phase component now shows the data bits / overlay symbols. We use the detrended I/Q values to estimate the navigation bit sequence on the L1CA and L2C signals. Likewise, we estimate the alignment of the Neumann-Hoffmann overlay sequence for the L5 signal. Finally, we wipe off the estimated data bits or overlay sequence to verify the procedure. The results of wiping off the estimated navigation bits for the L1CA signal are shown in the third panel of Figure 4.

    Having obtained the residual phase fluctuations and navigation / overlay symbols for the direct signal, we next apply these to clean up the reflected signal. Specifically, we remove residual phase fluctuations from the raw reflected signal I/Q values and then wipe off the corresponding navigation bits or overlay code. FIGURE 5 shows an example of the reflected I/Q data before and after this procedure. The navigation bits are clearly removed, but the reflected signal still shows fairly significant fluctuations in the cleaned I/Q values. It is from these values that we hope to extract the residual reflected signal phase.

    Figure 5 The reflected signal raw I/Q (top) and the I/Q after detrending and wiping off navigation bits for the L1CA signal.
    Figure 5: The reflected signal raw I/Q (top) and the I/Q after detrending and wiping off navigation bits for the L1CA signal.

    Under coherent conditions, the phase of the clean reflected I/Q data should contain only the unmodeled effects, including any signature of ocean surface height variation. However, the effect of multipath due to the rough ocean surface causes fluctuations in the received signal amplitude and phase, and can additionally cause cycle slips when we unwrap the phase. To filter out these cycle slips, we apply our simultaneous cycle slip and noise filtering (SCANF) method, which is essentially just a Kalman filter PLL with an additional step that tries to estimate and remove cycle slips. The figures in the next section show the results of applying this entire procedure to the reflected signals. The black and blue lines show the phase before and after applying SCANF. The reflected signal I/Q SNR is also included for reference. Note how the jumps in the black line coincide with SNR fades, and the blue line effectively recreates the phase trend of the black line without these jumps. This is good qualitative evidence that the SCANF algorithm was effective.

    RESULTS

    FIGURES 6, 7, 8, 9, 10, and 11 show the reflected signal SNR and phase for GPS PRN 6 on 6 different days. Note that these days correspond to the marked days in Figure 2, from which we observe that the wind-significant wave height is relatively high on days 1, 5, and 6, moderate on days 2 and 3, and relatively low on day 4. We noticed that the SNR fluctuations on days 1, 5, and 6 are comparatively more frequent than on other days, which we believe may be a signature of the ocean surface conditions. A more detailed analysis of this result is a topic for our future work.

    Figure 6 Reflected signal residual phase before (blue) and after (black) applying the SCANF filtering for the June 11, 2021 dataset. Amplitude and phase are shown in alternating panels for L1CA, L2C and L5 respectively.
    Figure 6: Reflected signal residual phase before (blue) and after (black) applying the SCANF filtering for the June 11, 2021 dataset. Amplitude and phase are shown in alternating panels for L1CA, L2C and L5 respectively.
    Figure 7: Phase processing results for June 13, 2021.
    Figure 7: Phase processing results for June 13, 2021.

    Overall, we observe that the phase trend is not consistent across the three signals (L1CA, L2C, L5) for any of the days. With all the multipath signatures in the cleaned reflected signal, it was uncertain whether the extracted phase will be useful for applications such as ocean surface altimetry, and these qualitative results suggest that they probably will not be. However, season and hours of the day that were processed for our work discussed in this article are very limited. It is possible that processing more data will shed further insight onto whether the reflected signal phase is usable in this experiment.

    Figure 8 Phase processing results for June 21, 2021.
    Figure 8 Phase processing results for June 21, 2021.
    Figure 9 Phase processing results for June 25, 2021.
    Figure 9: Phase processing results for June 25, 2021.

    ACKNOWLEDGMENTS

    The Haleakalā data collection system has been established with support from the University of Hawaii Institute of Astronomy, and the Air Force Research Laboratory. The authors appreciate the assistance from Michael Maberry, Rob Ratkowski, Daniel O’Gara, Craig Foreman, Frank van Graas and Neeraj Pujara. This research is funded by a subaward from the National Oceanic and Atmospheric Administration through the University Corporation for Atmospheric Research to CU Boulder and with partial funding support from the NASA Commercial Smallsat Data Acquisition program.

    This article is based on the paper “Initial Carrier Phase Processing for the Haleakala Mountaintop GNSS-R Experiment” presented at ION ITM 2023, the 2023 International Technical Meeting of the Institute of Navigation, Long Beach, California, Jan. 23–26, 2023.

    Figure 10 Phase processing results for July 1, 2021.
    Figure 10: Phase processing results for July 1, 2021.
    Figure 11 Phase processing results for July 5, 2021.
    Figure 11: Phase processing results for July 5, 2021.

    BRIAN BREITSCH is a postdoctoral fellow at the University of Colorado (CU) Boulder, where he received his Ph.D. in aerospace engineering sciences.
    JADE MORTON is a professor in the Ann and H.J. Smead Department of Aerospace Engineering Sciences and the director of the Colorado Center for Astrodynamics Research at CU Boulder.