Vigilant Aerospace Systems, a provider of multi-sensor detect-and-avoid safety systems for UAVs and advanced air mobility (AAM), has been awarded a contract by the U.S. Air Force to develop a detect-and-avoid system for the Air Force’s new long-endurance UAV.
According to the published project description, the objective is to “integrate a mature detect and avoid capability on an existing long-endurance, Group V UAS platform, for increased aircraft and pilot-in-the-loop operational awareness that leverages new and evolving C-SWaP sensors and sensor fusion software.”
The project is sponsored by the Air Force Research Lab (AFRL) and is a Small Business Innovation Research (SBIR) Phase II project through the SBIR program. The program is designed to bring dual-use technologies, which can help both civilian and military users, into the military, with a focus on high-impact, near-term implementations.
FlightHorizon is detect-and-avoid and airspace management software that combines data from aircraft transponders, radar, UAV autopilots and live Federal Aviation Administration (FAA) data to create a single picture of the airspace around a UAV. The software displays air traffic, predicts trajectories and provides avoidance commands to the remote pilot or autopilot. The system can be used on the ground or onboard the UAV and can be configured for any size of aircraft.
The software is based on two licensed NASA patents and the company has completed contracts with NASA, the FAA and a project with the USAF’s 49th Operating Group’s MQ-9 Reaper fleet to track training flights. It is designed to meet industry technical standards and to help UAS operators fly beyond visual line-of-sight (BVLOS).
The new Air Force project incorporates prior research and development by the company in solving the automatic self-separation and collision avoidance problem for UAVs. To evaluate sensors and algorithms and establish standards-compliance and risk ratios, the company has completed hundreds of hours of flight tests with the system and thousands of simulated aircraft encounters inside the software’s built-in simulation engine, according to Vigilant Aerospace Systems.
SwissDrones, a global manufacturer and operator of long-range uncrewed helicopter systems for inspection, surveillance and public safety applications, has announced its SDO 50 V2 multi-mission, single-turbine uncrewed helicopter system has received Federal Aviation Administration (FAA) authorization.
This authorization allows aerial service provider Phoenix Air Unmanned (PAU), partner of SwissDrones, to operate the SDO 50 V2 beyond visual line of sight (BVLOS) across the U.S. This achievement marks the first-of-its-kind authorization within the United States, allowing PAU to broaden its capabilities in inspection, patrol and survey missions over extensive distances.
SwissDrones and PAU collaborated over the course of three years to build a concept of safe BVLOS operations (CONOPS) and conducted numerous flight trials in the U.S. using the SDO 50 V2. All regulatory and safety requirements were met in cooperation with the FAA to enable extended-range inspection and patrol flights over linear infrastructure under the same regulations as traditional-crewed aircraft.
PAU intends to use this aircraft for a variety of data-gathering tasks, including high-resolution imaging, lidar data collection and thermal imaging.
Depending on the specific sensor package and operating area, PUA inspection flights can span distances of more than 60 miles, allowing operators to conduct multiple inspections efficiently within a single flight.
With a maximum weight of 191 pounds, the SDO 50 V2 can carry sensors weighing between 30 and 70 pounds and maintain flights lasting over three hours. These extended flights make it ideal for missions requiring multiple sensors, offering nearly ten times the endurance and three times the lift capacity compared to aircraft weighing under 55 pounds that operate under Part 107 waivers.
The SDO 50 V2 has also received a Special Airworthiness Certificate (SAC-EC) from the FAA. SwissDrones is among the first organizations to obtain a European drone operator license, the European Union Aviation Safety Agency (EASA) Light UAS Operator Certificate (LUC). This certificate grants SwissDrones the authority to self-authorize flight operations for its aircraft across EASA countries, encompassing BVLOS operations within the specified certificate limits. Additional regulatory approvals from civil aviation authorities will be announced in the coming months.
Topcon Positioning Systems is joining Septentrio’s Agnostic Corrections Partner Program. This program was launched earlier this year to facilitate the use of Septentrio receivers with various high-accuracy services, offering integrators the flexibility to choose the most suitable correction service for their specific application.
Topcon’s Topnet Live is a real-time GNSS corrections service that delivers high-quality centimeter-level real-time kinematic (RTK) corrections data with a broad worldwide network coverage and a variety of subscription options.
“This collaboration with Topcon enables us to bring more high-quality corrections options to our customers,” Gustavo Lopez, senior market access manager at Septentrio said. “Septentrio’s robust GNSS receivers combined with Topcon’s reputable infrastructure creates a powerful synergy that offers high precision and reliability to industrial sectors, including construction and mining, while also catering to emerging applications such as robotics and automation.”
The facility is designed to boost the manufacturing of the company’s world-first AI navigation systems for GPS-denied environments, including its digital fibre-optic gyroscope (DFOG) technology, Boreas.
Advanced Navigation is one of only four companies across the globe able to manufacture strategic-grade fiber-optic gyroscopes, which are designed to enable reliable navigation for marine vessels, space missions, aerospace, defense, autonomous vehicles and flying taxis.
The new facility will be home to extensive research collaborations between Advanced Navigation and the University of Technology Sydney. The collaborations aim to accelerate the production of new technologies, including its light detection, altimetry, and velocimetry (LiDAV) system, cloud ground control and indoor positioning technology designed to guide visually impaired passengers in underground train stations.
The new facility is aligned with the Australian government’s ongoing commitment towards building a STEM workforce and aims to boost employment in robotics, manufacturing, photonics, mechatronics, mechanical engineering and more.
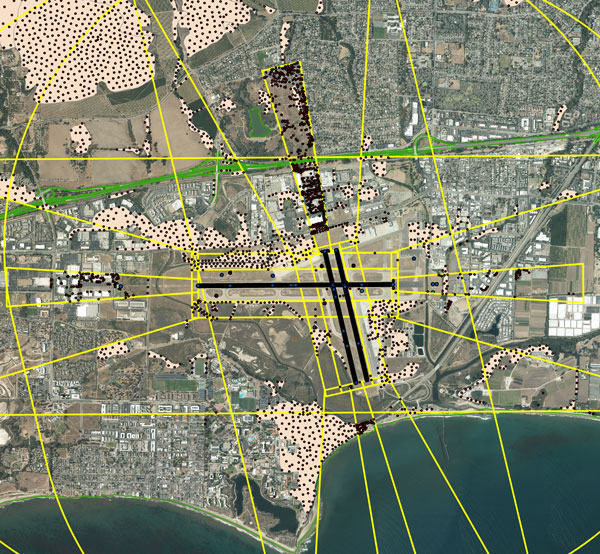
NV5 Geospatial, a large geospatial data company, provides services for airport projects across the United States and U.S. territories — mainly supporting airport planning and engineering firms that must meet FAA survey and mapping requirements for data collection at airports. “We generally are a sub-consultant to them, helping them achieve those survey standards for collecting the data and submitting it to the FAA,” said David Grigg, the company’s Aviation Program Director. Typically, this is around planning projects such as airport layout plans and master plans, but also engineering projects such as runway extensions and runway reconstructions.
As an example, Grigg cited the extension of a runway, which requires new flight procedures to be established. “Two survey missions are required for runway extensions. The primary mission is to establish control for the aerial imagery. Using the imagery, control and design data, we check for obstacles photogrammetrically. That data is sent to the FAA and procedures are developed. After construction is complete, we go back to the airport to survey the changed runway and navigational aids (NAVAIDS) to verify that what was designed was ultimately built.”
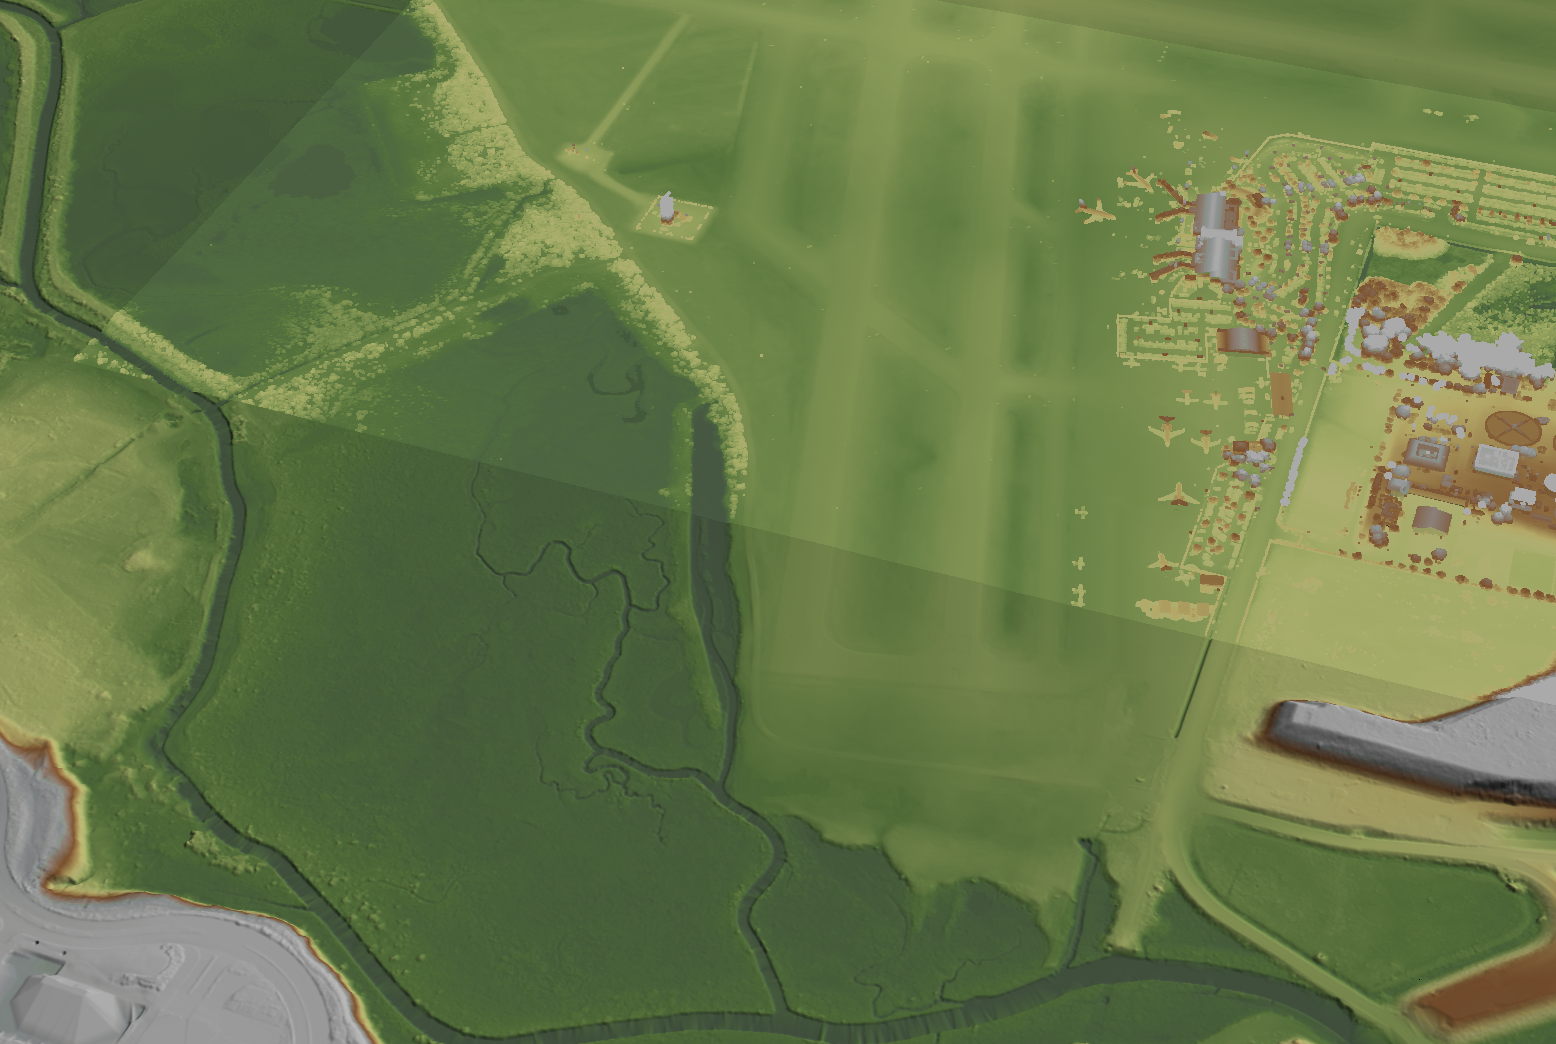
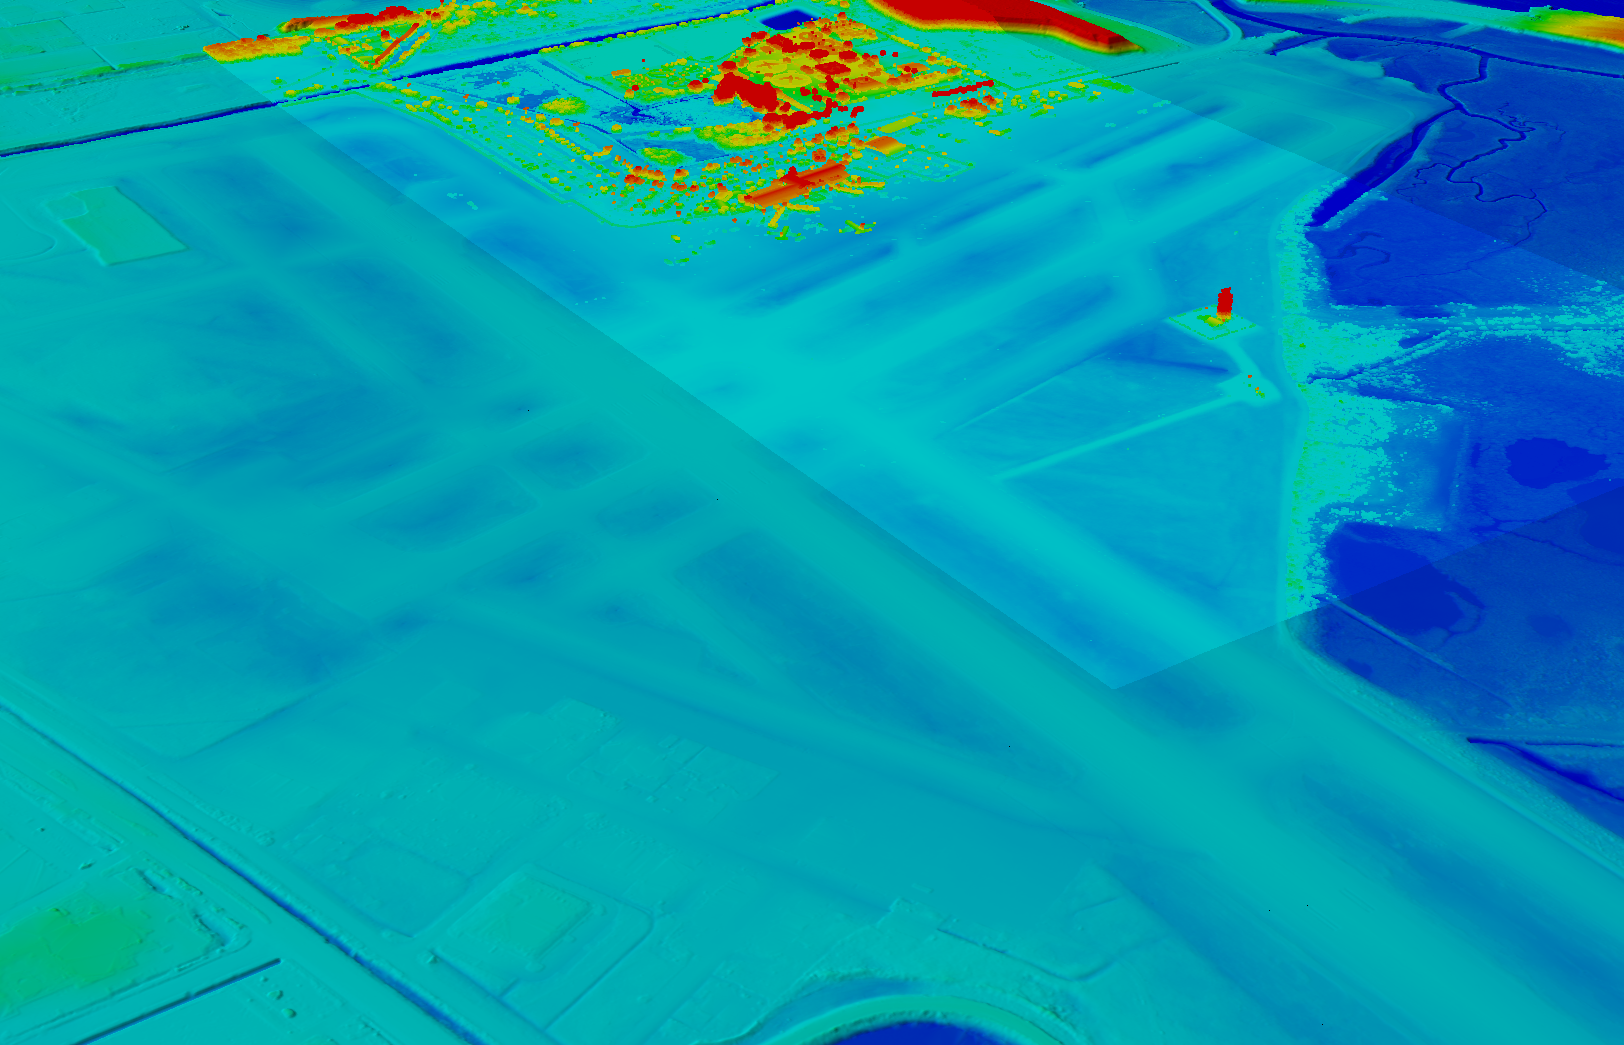
Another way in which NV5 Geospatial supports airport clients is by conducting obstruction studies around them for vegetation management. “That’s generally where we pull in the lidar surveys,” said Grigg. The FAA’s standards for relative and absolute positioning accuracy for trees are “rather generous” by surveying standards, he said. “We’re talking two to three feet vertically and twenty feet horizontally. It’s not like a typical mapping job where you’re guaranteeing it to one foot or better horizontally and half foot or better vertically.”
The FAA, he points out, has published guidance on how lidar may be used. “We mostly use aerial photogrammetry to support projects in the FAA’s airports GIS program. When we collect lidar at an airport, we do it to generate contours and to identify individual tree canopies. Our lidar-derived data is most often developed to benefit airports for tree mitigation not for FAA airports GIS survey projects.”
Image: NV5 Geospatial
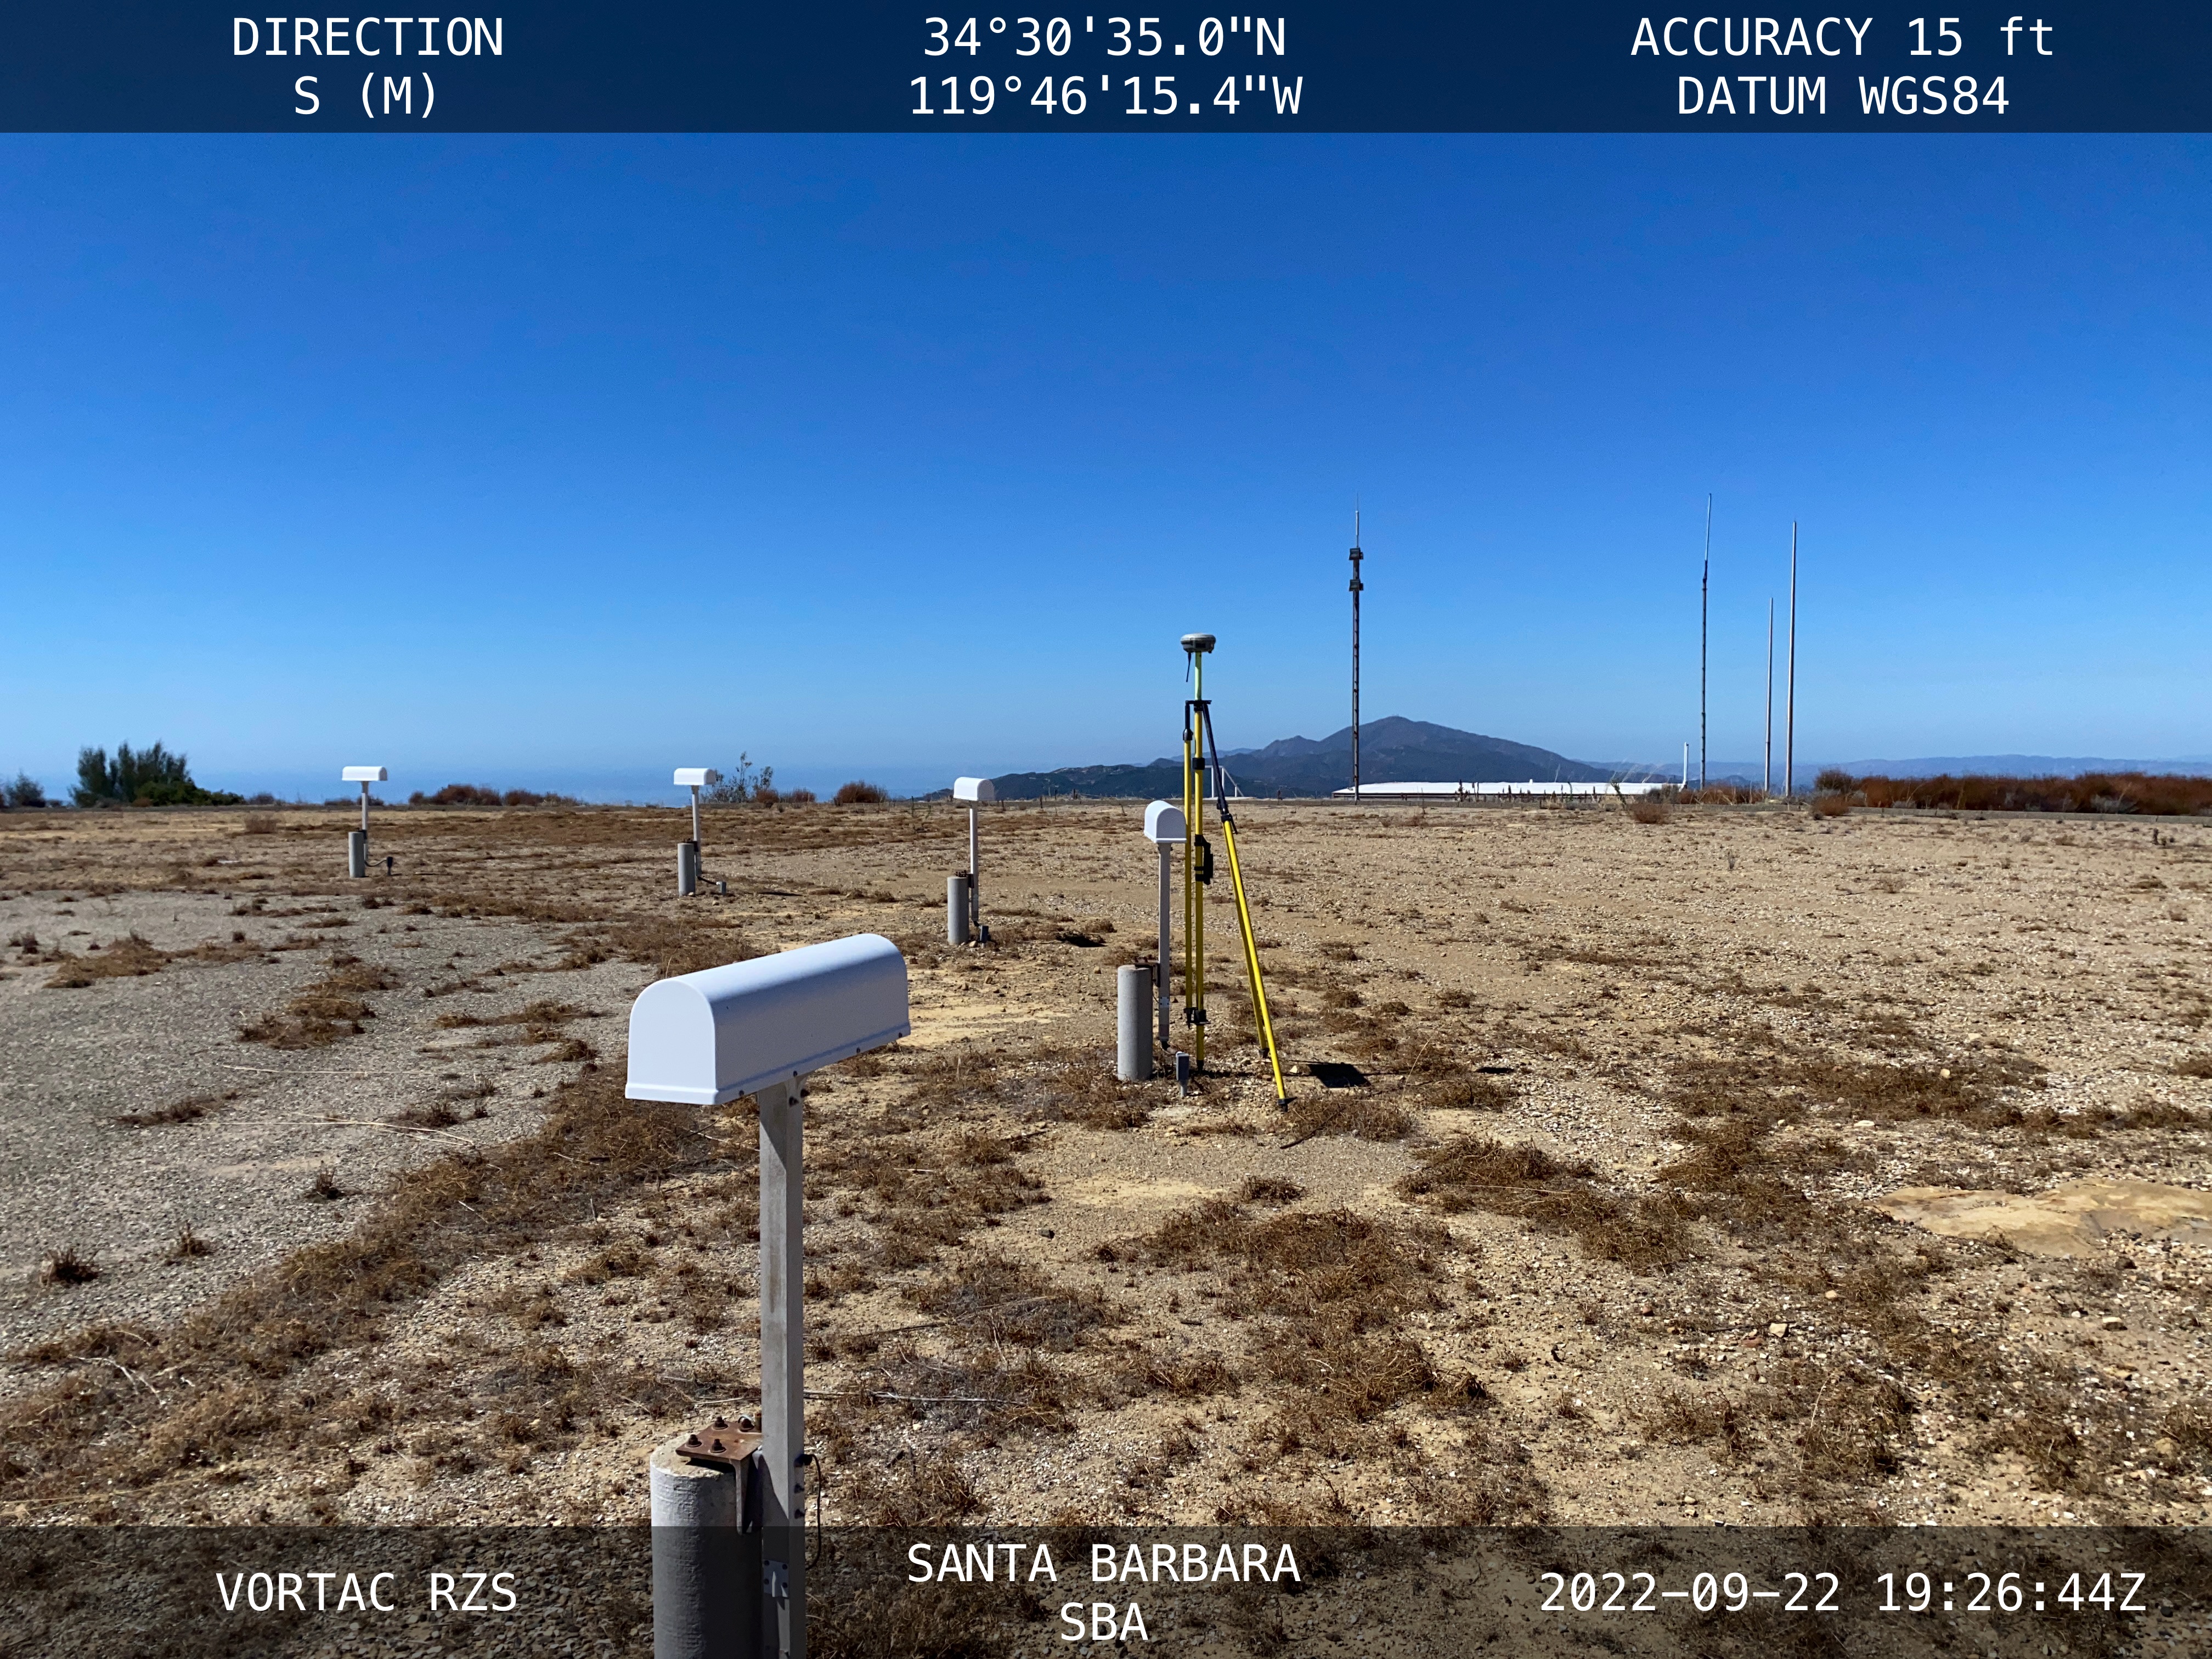
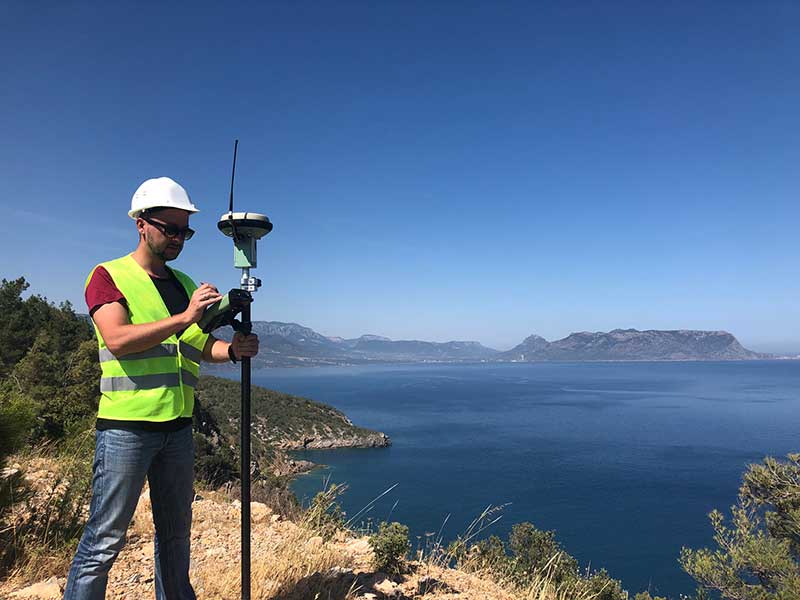
On the other hand, the FAA has strict requirements regarding metadata to document when, where, and how each control point is collected. “At the time of the survey, photographs are taken of the GPS units from different angles and cardinal directions,” Grigg said. “This is visual documentation for NGS that the surveyed point is at the location described. ”
Another challenge for surveyors working at airports is that they are required to pull back for incoming aircraft. “Obviously, you will have some logistical issues at busy airports,” said Grigg. Surveyors are required to have special lights and markings on any vehicles that enter the airport property to ensure ground and air visibility. Aircraft movement also impacts surveyors as they must move away from the runway safety area (RSA) for take-offs and landings. Busier airports are surveyed at night, when air traffic is reduced or runways are closed.
Image: NV5 Geospatial
A typical project for a small airport takes about nine months, while for bigger airports — such as Chicago O’Hare, Dallas-Fort Worth, or Hartsfield-Jackson Atlanta — they can take up to twice as long. “The large hubs update their master plan on a more reoccurring basis, such as every three to five years,” said Doug Fuller, NV5 Geospatial’s Airport Solutions Specialist. “As the airports get smaller, you start stretching out that timeframe.”
Airport survey requirements
[The following was written by NV5 Geospatial and only lightly edited by GPS World.]
Airports have surveys conducted for many different reasons. However, all survey types require the collection, classification and reporting of accurate data about the project. The methodology selected to gather the information is up to the professional surveyor’s judgment. Some features require observation through ground field methods, while others lend themselves to collection via remote sensing technologies.
All surveys start with a search for existing airport control, which are called Primary Airport Control Points (PACS) and Secondary Airport Control Points (SACS). These are points on the airport that have been adjusted by the National Geodetic Survey (NGS). This ensures that the survey is done on the National Spatial Reference System (NSRS).
A typical survey includes surveying the runway, the end points, any displaced thresholds, and a profile along the centerline of the runway. If the centerline marker is not in the correct location or if it is not there at all, the surveyor will make the necessary measurements to establish the proper location and set a new marker. Next the surveyor must locate all NAVAIDS and survey them at the proper location as described in FAA Advisory Circular 150/5300-18B.
After the NAVAIDS are located, the photo control survey will be done. This still requires the PACS and SACS to be the points of origin of the survey. The base requirement as described in FAA Advisory Circular 150/5300-16C is to survey ten photo control points and five check points. The check points are sent to NGS’s Online Positioning User Service (OPUS). This is used to check that the survey was done on the NSRS and that the compilation meets FAA standards.
The standards the surveyor must meet vary depending on the equipment type or photo control point. Examples of the accuracy requirements for the NAVAIDS are as follows:
Point
Horizontal
Vertical
Distance measuring equipment
+/- 1 ft
+/- 1 ft
Glideslope
+/- 1 ft
+/- 0.25 ft
Inner marker
+/- 10 ft
+/- 20 ft
Localizer
+/- 1 ft
+/- 0.25 ft
Runway end point
+/- 1 f ft
+/- 0.25 ft
Runway profile points
+/- 1 f ft
+/- 0.25 ft
Photo control
+/- 1 ft
+/- 1 ft
PACS and SACS
X
Y
Z
Ellip.
Inverse from PACS to SACS
surveyed relative to published
0.09 ft
0.09 ft
0.15 ft
0.13 ft
When surveying on airport property, the largest challenge is always accessing the runway safety area to locate the runway ends and profiles. At small airports Surveyors must work when the runway is not busy; at airports with FAA control towers when the runway is closed. Frequently this is done overnight. Other challenges include access to the FAA NAVAIDS. Some of them must be turned off to be surveyed and others require survey points on which it is not possible to set an instrument. When we are not able to occupy a point, we collect it by surveying multiple equidistant locations around the NAVAID and averaging them.
Image: NV5 Geospatial
NV5 Geospatial surveyors use a combination of real-time (R/T) and post-processing techniques. We also use OPUS with the PACS and SACS and the five check points. Once the PACS and SACS have been determined to be stable, the proper coordinates are applied to them and the R/T points are adjusted using Trimble Business Center (TBC). NV5 Geospatial uses Trimble TRM-R8s and we recently added TRM-R12i receivers to our equipment. We use ground control points to orient the photography and to calibrate the lidar.
On Sept. 10, floodwaters overpowered dams and wiped out entire neighborhoods in eastern Libya, taking the lives of thousands of people and displacing more than 40,000 people, reported the Associated Press.
Maxar Technologies has responded by publicly releasing satellite imagery data that maps the affected areas to support emergency response efforts as a part of its Open Data Program.
The Maxar imagery or data distributed through the program can be quickly integrated into first responder workflows with organizations such as Team Rubicon, the Red Cross and other nonprofits.
Derna and other parts of eastern Libya were hit with extreme flash flooding the night of Sunday, Sept. 10 — an effect of the Mediterranean storm, Daniel.
The National Meteorological Center of Libya had issued early warnings for Daniel 72 hours before it occurred and notified all governmental authorities by e-mail and through media urging them to take preventive measures, reported the Associated Press.
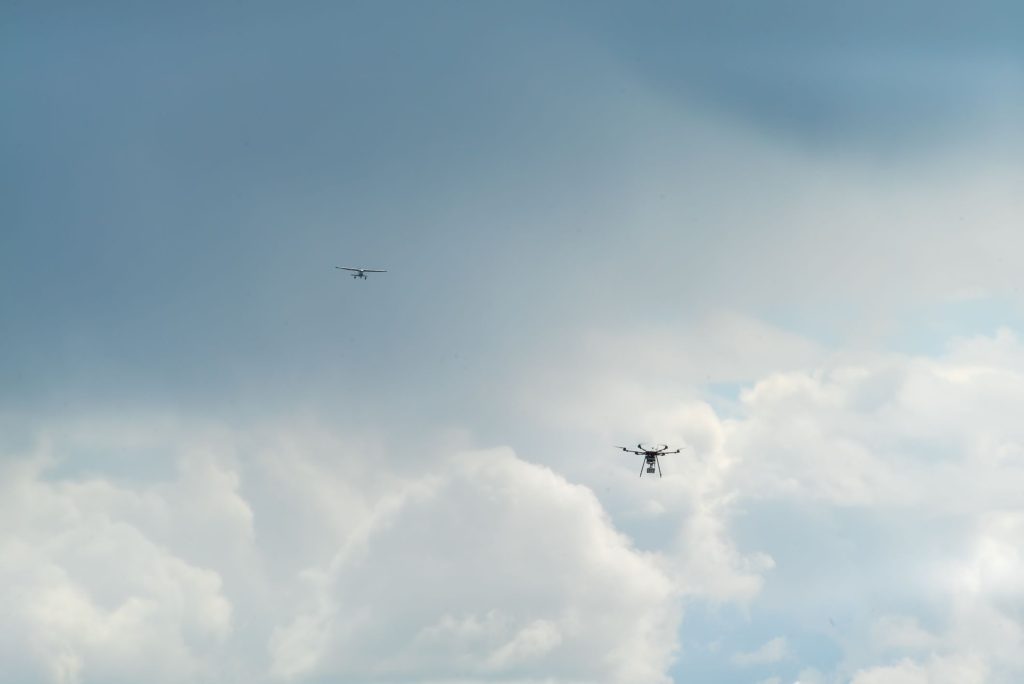
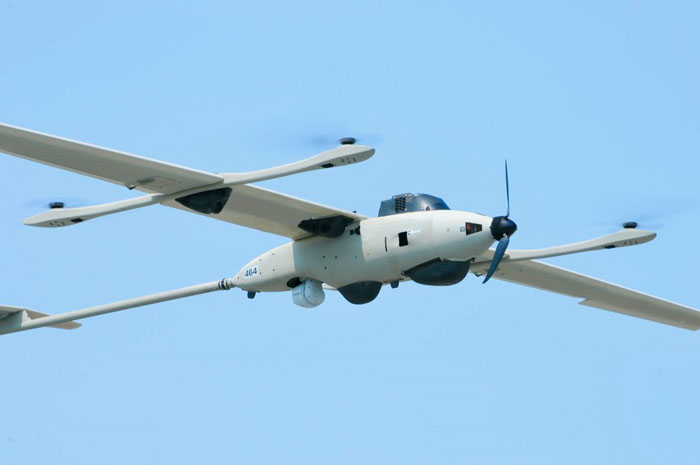
Sentient Vision Systems has completed live demonstrations of its visual detection and ranging (vidar) payload enabled by artificial intelligence (AI) on Edge Autonomy’s VXE30 unmanned aerial vehicle (UAV).
The VXE30 is the latest version of the Stalker series of small UAVs from Edge Autonomy. When coupled with vidar, the VXE30 offers a passive, wide-area search capability, enabling it to serve a variety of maritime operations.
Vidar, developed by Sentient, uses AI, computer vision, and machine learning integrated with electro-optic and infrared (EO/IR) sensors to passively detect objects that are difficult for the human eye to spot or to recognize on a conventional radar.
This technology has been deployed on intelligence, surveillance, and reconnaissance missions (ISR), maritime patrol and border protection, as well as search and rescue missions since 2015. It is proven in conditions up to Sea State 6, which is defined as very rough with waves of 4m to 6m.
Last month’s column highlighted GEO-ESCON and how it supported the advancement of the science of geodesy. That said, the National Geodetic Survey (NGS) has been working to improve the National Spatial Reference System (NSRS) by replacing the North American Datum of 1983 (NAD 83) frame and all vertical datums, including the North American Vertical Datum of 1988 (NAVD 88), with four new terrestrial reference frames and a geopotential datum. Many of my previous GPS Worldcolumns have addressed various phases of the project.
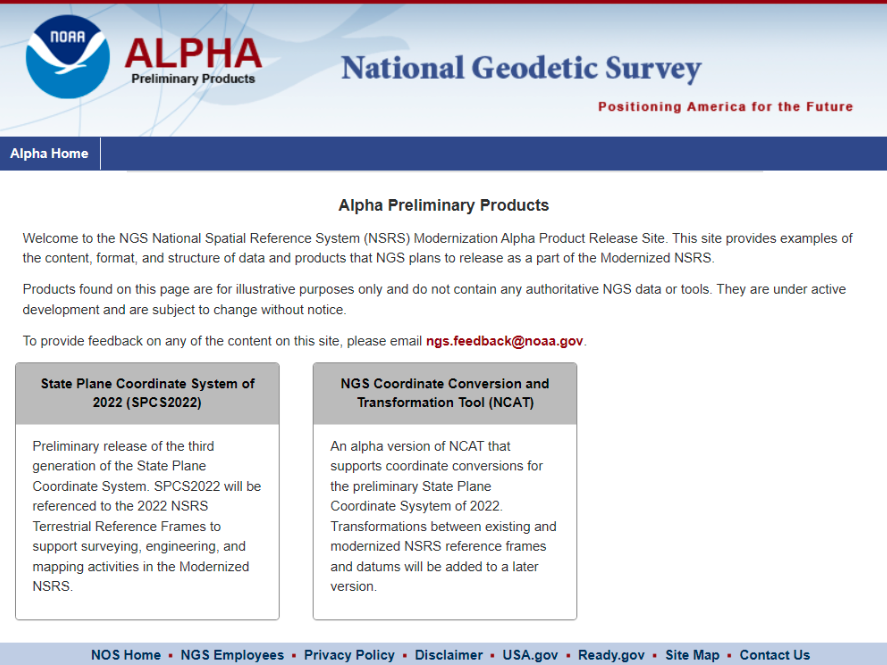
Recently, NGS has developed an Alpha site to enable users to preview preliminary NSRS products and services. I mentioned the Alpha site in my July column, in which I highlighted NGS’s presentations on the new NSRS at the International 2023 FIG Working Week.
Alpha preliminary products page. (Image: NGS)
The concept of the Alpha site is to provide examples of the content, format, and structure of data and products that NGS plans to release as a part of the modernized NSRS.
NGS highlights that these products are for illustrative purposes only and do not contain any authoritative NGS data or tools. It states that they are under active development and are subject to change without notice.
That said, NGS would like everyone to try the Alpha products and provide feedback to NGS. The first two Alpha products are State Plane Coordinate System of 2022 (SPCS2022) and NGS Coordinate Conversion and Transformation Tool (NCAT). On July 20, NGS held a webinar previewing the Alpha site. Readers can download the powerpoint and video of the presentation here.
Webinar on preview of SPCS2022. (Image: NGS)
As usual, Michael Dennis of NGS did a great job of describing the new SPCS2022, and the differences between the State Plane Coordinate System of 1983 (SPCS83) and SPCS2022. I have included a few of his slides that highlight the SPCS2022.
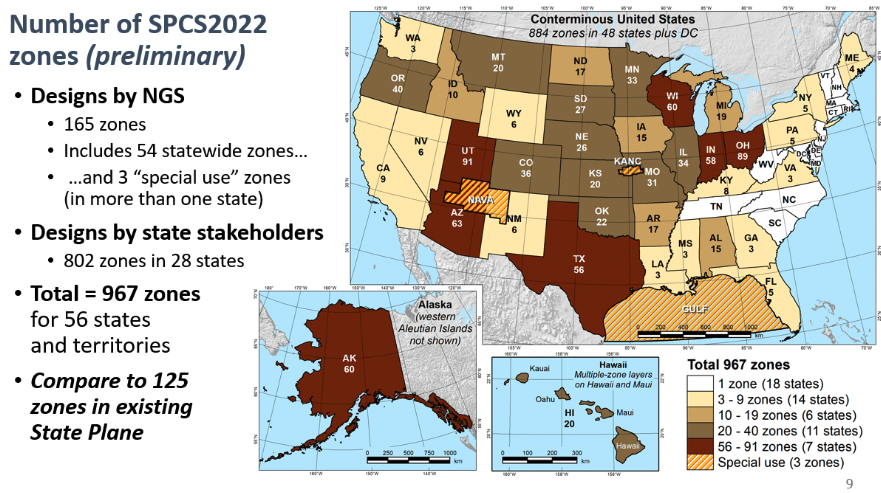
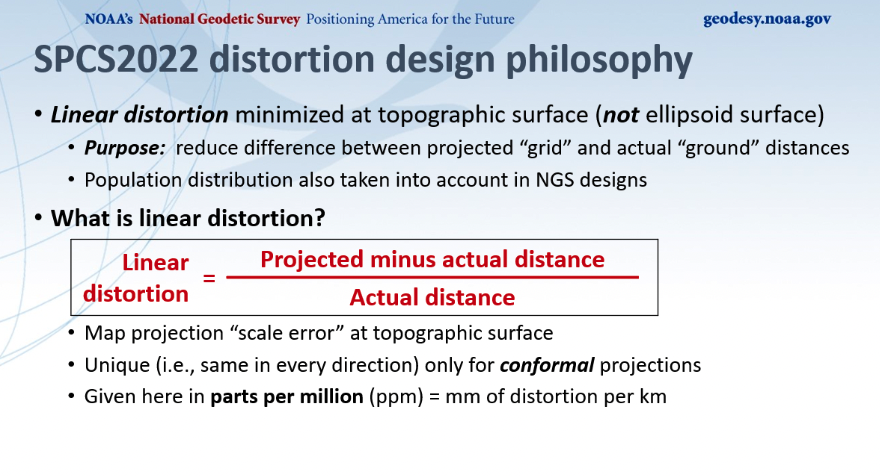
First, SPCS2022 has significantly more zones than the current SPCS83 zones. Second, SPCS83 map projections were designed to minimize linear distortion at ellipsoid surface, whereas the SPCS2022 map projections were designed to minimize linear distortion at topographic surface. The purpose being to reduce the difference between projected “grid” and “actual” ground distances.
Number of SPCS2022 zones. (Image: NGS)Linear distortion of SPCS2022. (Image: NGS)
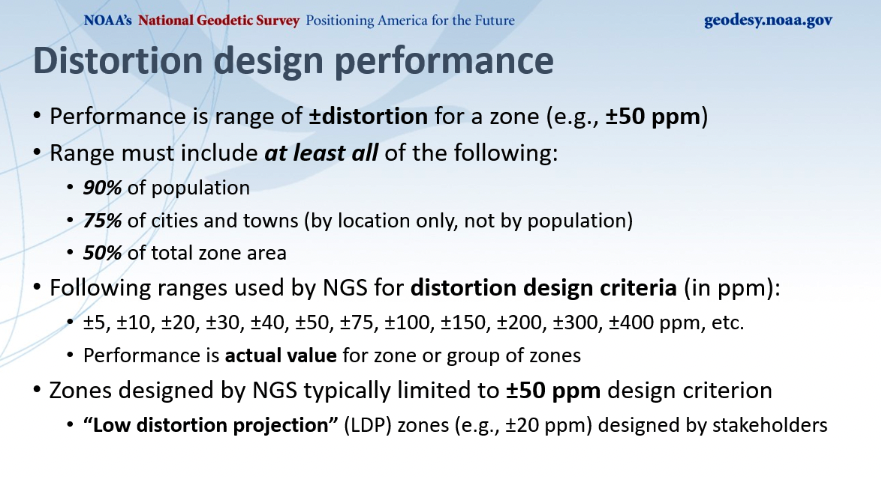
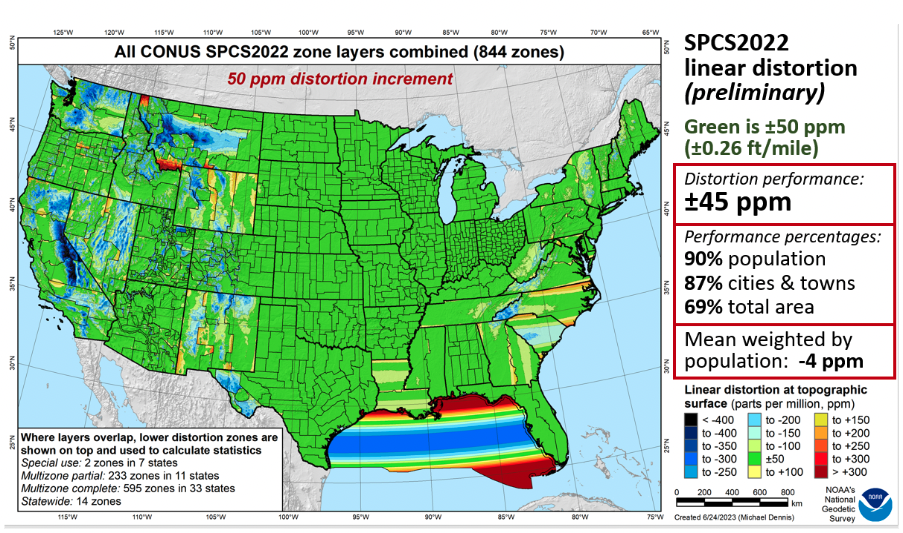
Dennis described NGS’s distortion design performance as seen in the image below. He explained that the performance is a range of +/- distortion for a zone, such as +/-50 ppm. The analysis involved determining parameters where the range includes 90% of the population, 75% of the cities and towns, and 50% of the total area. He highlighted those zones designed by NGS that where typically limited to +/- 50 ppm design criteria, but many low distortion projections (LDP) zones designed by stakeholders consisted of +/- 20 ppm design criteria.
Distortion design performance. (Image: NGS)
Dennis provided a slide depicting SPCS2022 linear distortion for all CONUS zones with a 50 ppm distortion increment as seen below. As indicated on the slide, green is +/- 50 ppm. The distortion performance is +/- 45 ppm.
All CONUS SPCS2022 zone layers. (Image: NGS)
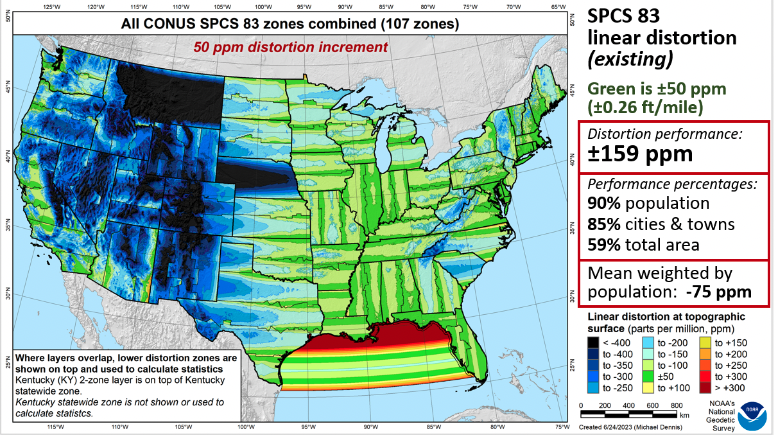
As a comparison to the existing SPCS83 zones, he provided a similar slide for the CONUS SPCS83 zones. See below. As in the previous slide, green represents +/- 50 ppm. The distortion performance is +/- 159 ppm.
All CONUS SPCS83 zone layers. (Image: NGS)
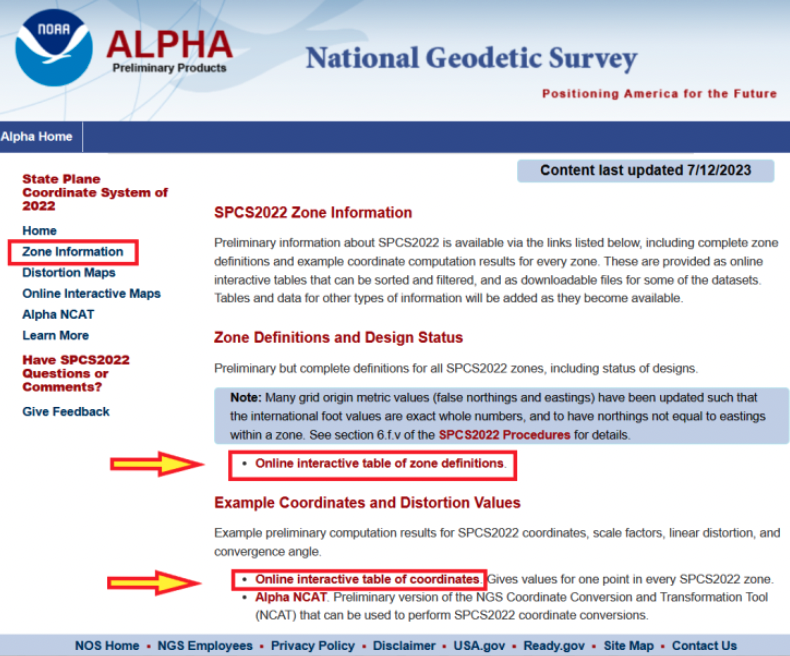
Now, let us look at the Alpha products. First, all zone information can be found here.
SPCS2022 zone information. (Image: NGS)
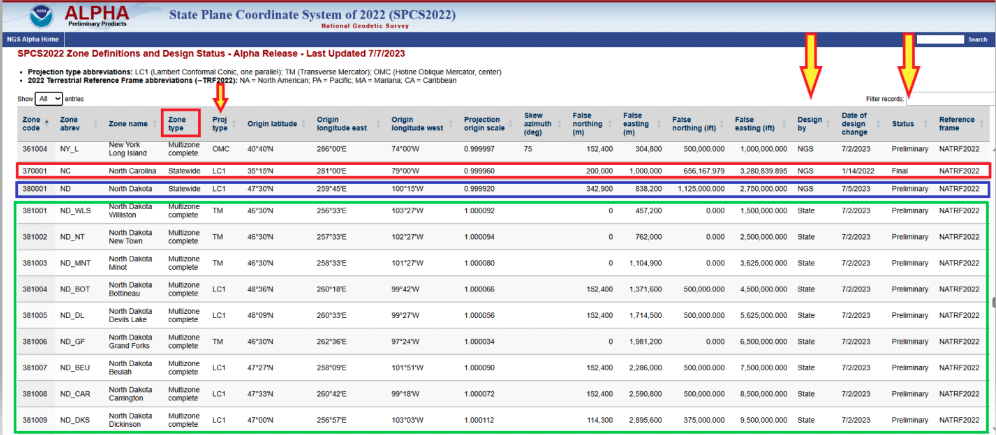
Users can click on the image below for a table of all zone definitions. The table provides the type of projection, if it was designed by NGS or the state, and the zone definition.
Online interactive table of zone definitions. (Image: NGS)
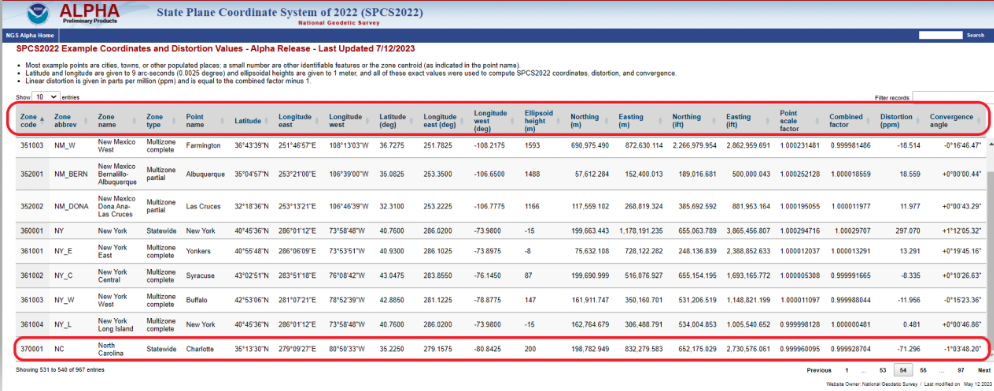
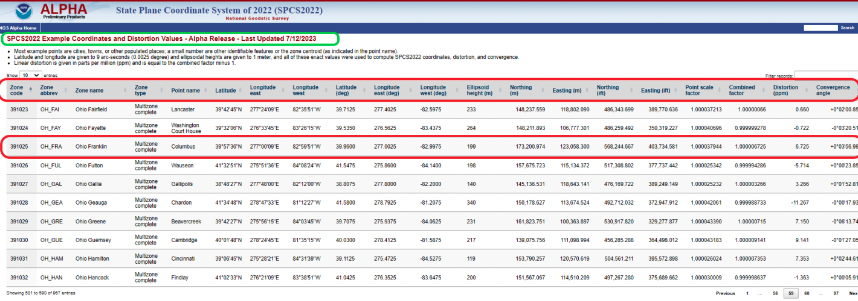
By clicking on the image below, users can obtain information for a point in a particular zone. The table provides northing and easting (meters and feet), scale factor, linear distortion, and convergence angle for a specific coordinate in a particular zone. It should be noted that all values that are provided in feet will be international feet units (ift).
SPCS2022 example of coordinates and distortion values. (Image: NGS)
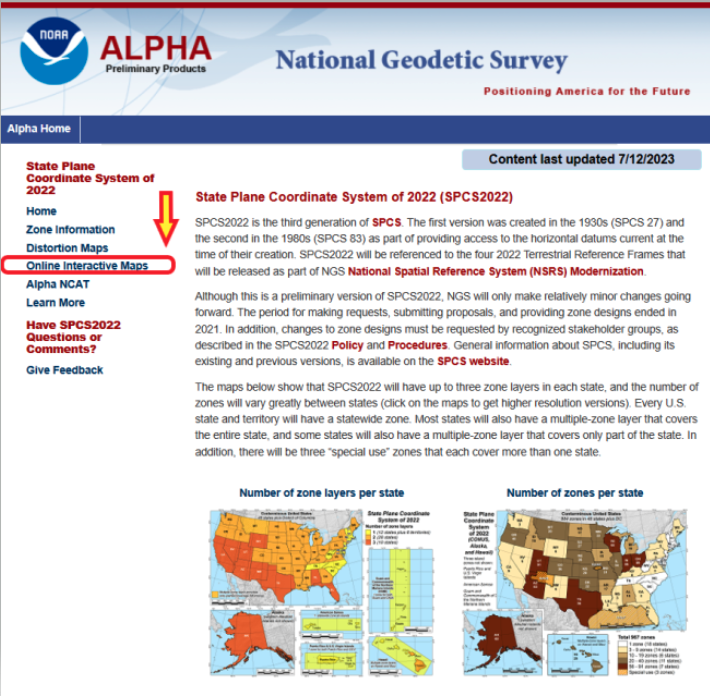
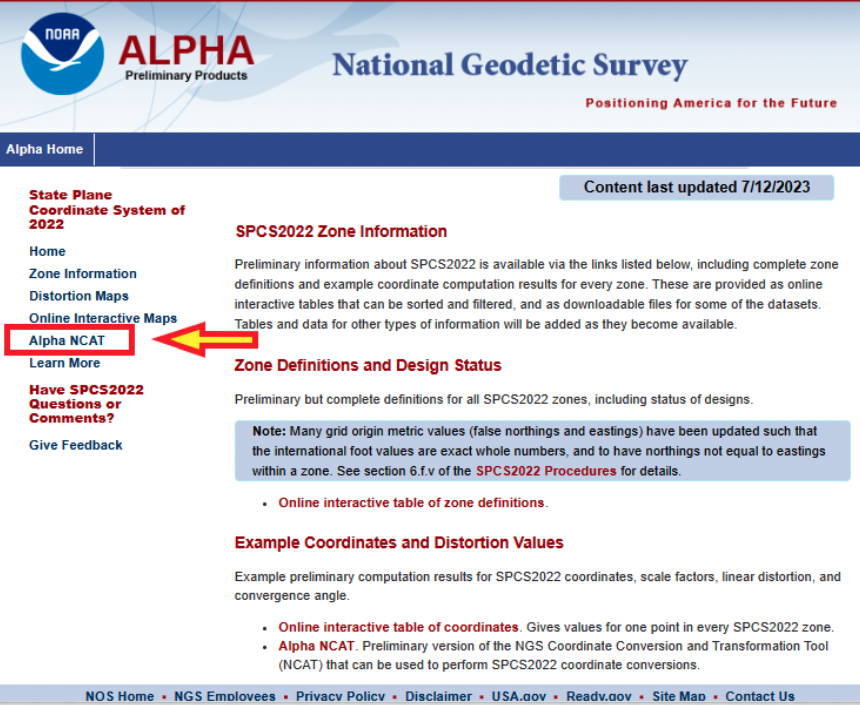
The Alpha page provides an online option to look at all maps. The arrow in the image below highlights the link to access the online interactive maps.
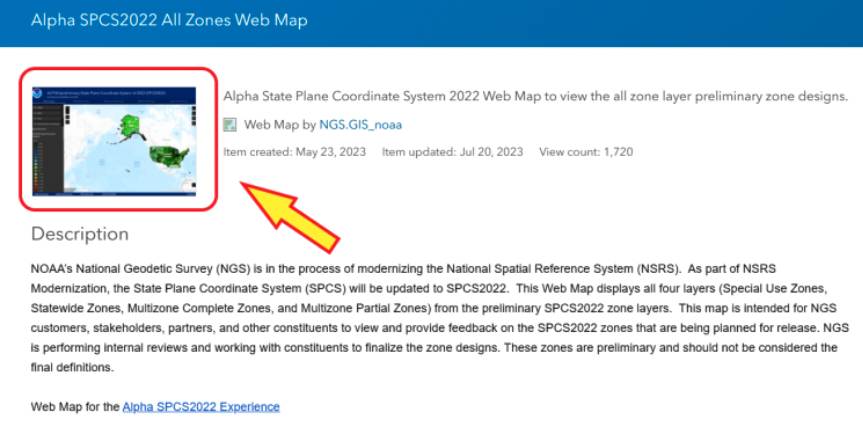
Alpha page for SPCS2022. (Image: NGS)
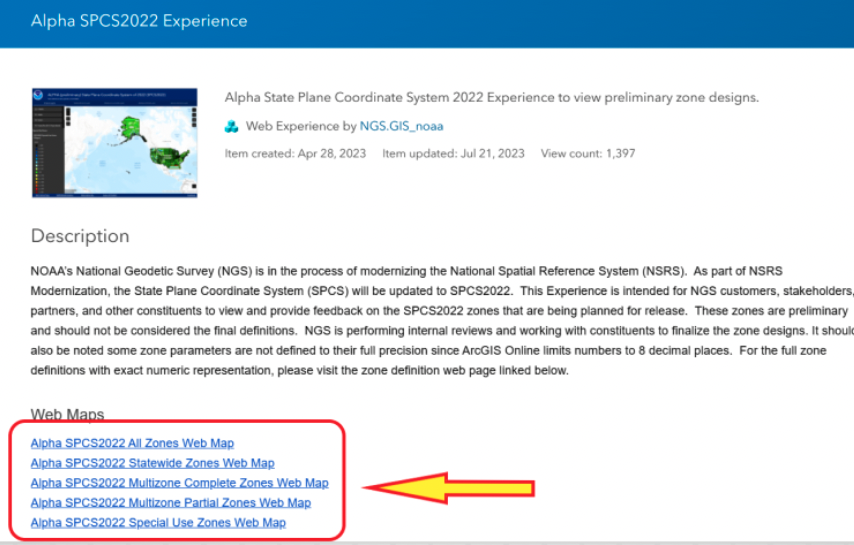
When users click the link on the page, they are directed to an ArcGIS NOAA web map viewer.
Alpha SPCS2022 experience. (Image: NGS)
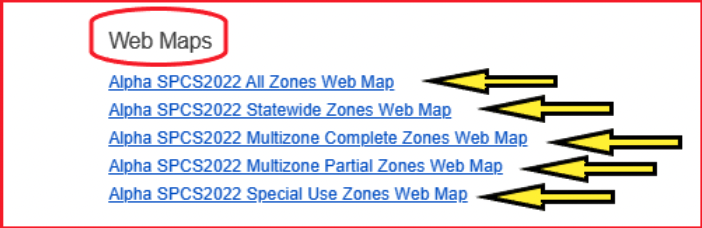
To access the online map function, users need to click one of the Alpha SPCS2022 zone options.
Alpha web maps. (Image: NGS)
Once users click on one of the web map buttons, another map page with a map icon appears on which userswill need to click to get to the map of zones.
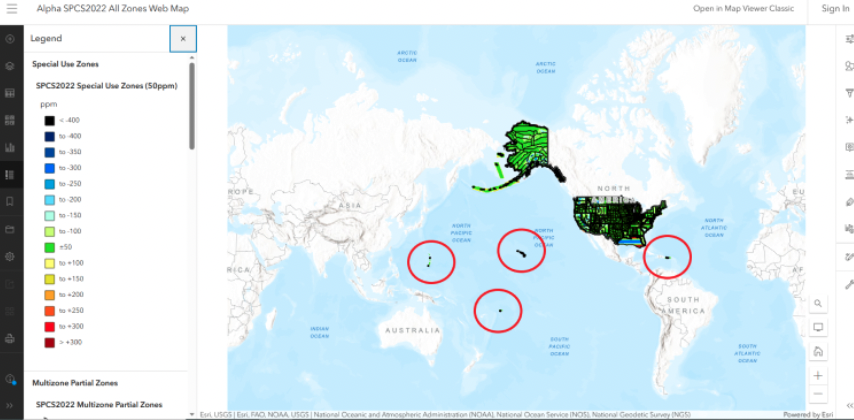
Alpha SPCS2022 all zone web map. (Image: NGS)
After users click on the map icon, they will get another web page that contains the map zones based on their selection. In my example, I selected “all zone web map.” Once users get to this page, they can zoom into any area to find a particular zone.
All zone web map. (Image: NGS)
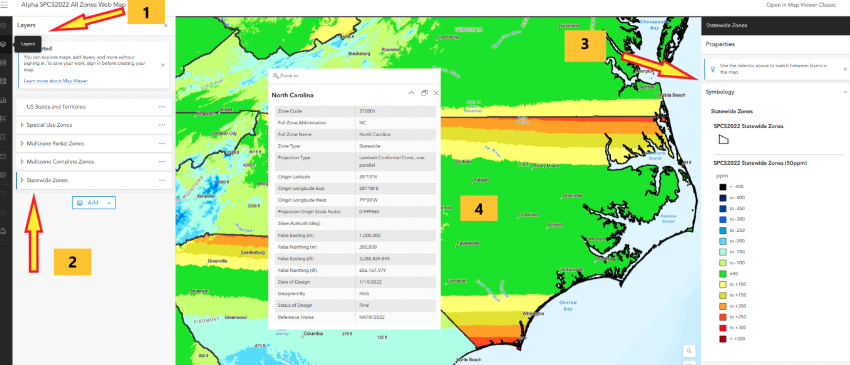
I zoomed down until I located North Carolina’s map zone. The web page provides access to various layers and information. First, if users move their curser over the layer button, a list of layers pops up. Next, select one of the layers, such as Statewide Zones, then the properties of the map are placed on the map. Finally, when readers click on the map itself, the information about the SPCS2022 zone appears on the map.
Alpha North Carolina Statewide Zone web map. (Image: NGS)
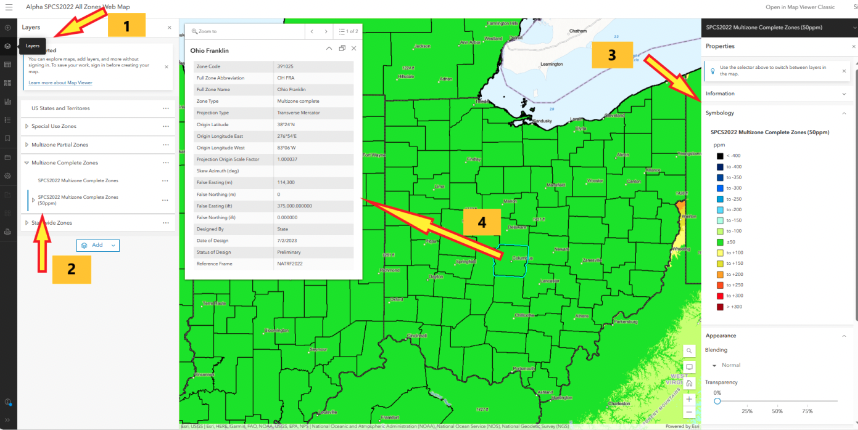
North Carolina is a state that elected to have a single statewide zone. Some states decided to design several LDPs that cover certain areas or cover the entire state. Ohio is a state that designed 89 LDPs that cover the entire state. Again, by selecting the layer button, users have an option to select multizone complete zones, the properties appear on the map, and finally clicking on the map provides the zone information for that zone. In this example, I clicked on Columbus, Ohio, which is in the Ohio Franklin Zone.
Alpha Ohio multizone complete zones web map. (Image: NGS)
Users can obtain specific information for a coordinate located in the Ohio Franklin Zone by clicking on the online interactive table of coordinates. Note that the distortion is 6.725 ppm at the coordinate in the zone.As previously stated, this was a user–defined LDP zone.
SPCS2022 example of coordinates and distortion values in Ohio Franklin Zone. (Image: NGS)
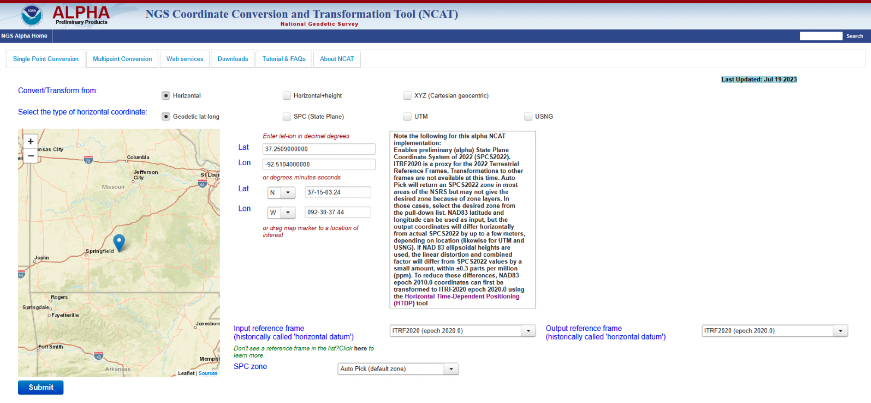
Another Alpha site available for users to evaluate is the NGS Coordinate Conversion and Transformation Tool (NCAT). NCAT is probably the tool that most surveyors will be interested in using and providing feedback to NGS. Users can access NCAT on the Alpha SPCS2022 webpage or by clicking here.
The Alpha NCAT website has a note about the coordinates that users should provide as input to the routine. The bottom line is that the input coordinates need to be in ITRF2020 (epoch 2020.0), or readers may not get their desired zone. NGS recommends that users convert the coordinates to ITRF2020 (epoch 2020.0) using the Horizontal Time-Dependent Positioning (HTDP) tool.
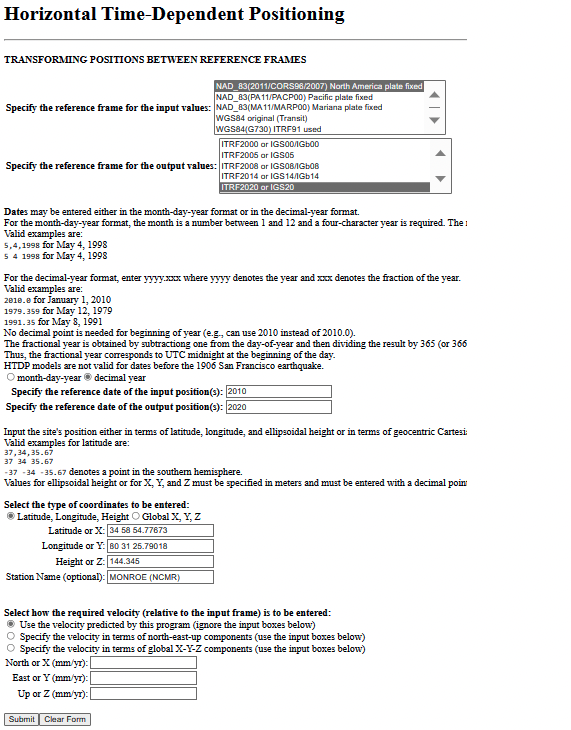
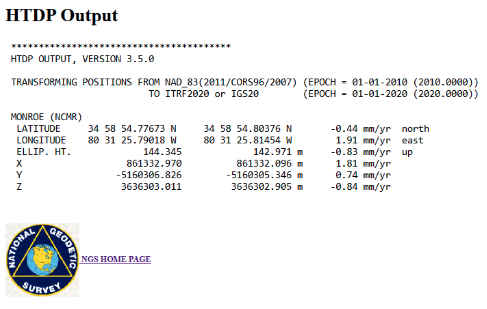
Users can access HTDP here. I provided an example of HTDP for a CORS in North Carolina. I used the NAD 83 (2011) [epoch 2010.0] published coordinates of the CORS as my input values.
Example of a HTDP computation. (Image: NGS)Output of a HTDP computation. (Image: NGS website)
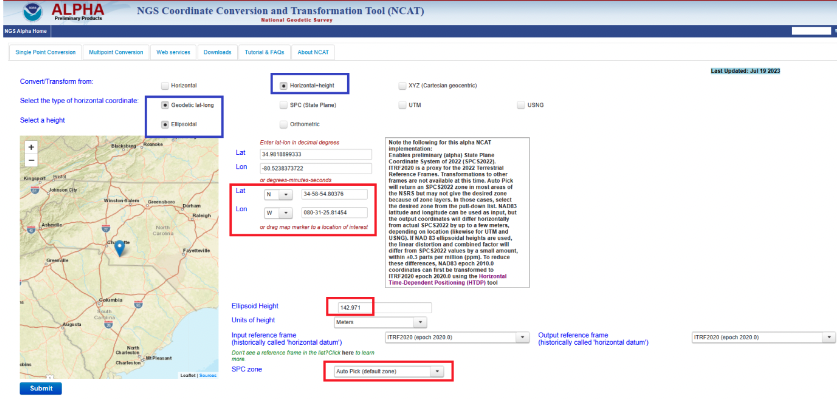
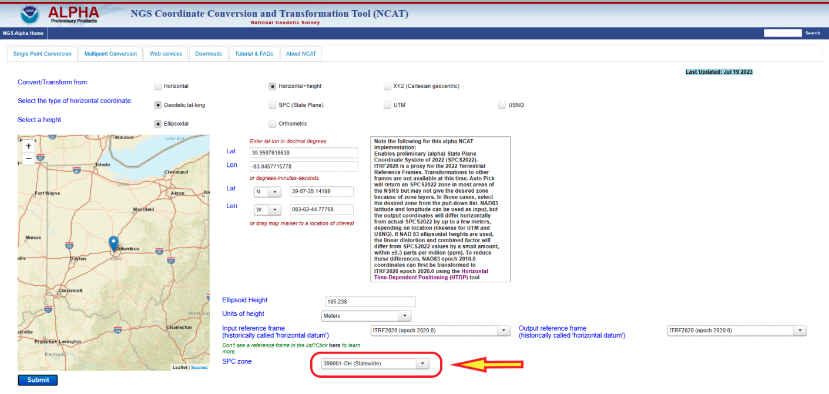
After using HTDP to transform the coordinates from NAD 83 (2011) to ITRF2020, I used the Alpha NCAT tool to compute the SPCS2022 values for the mark. I provided an example of the Alpha NCAT routine using the coordinates of the North Carolina CORS NCMR. The program defaults to horizontal only, so I changed it to the horizontal-height option. The user then enters the latitude, longitude, and height of the mark. Lastly, the user has an option to select the SPC zone or the program will select the zone based on the coordinates of the mark. In my example, I selected the auto pick option.
NCAT input for MONROE CORS (NCMR). (Image: NGS)
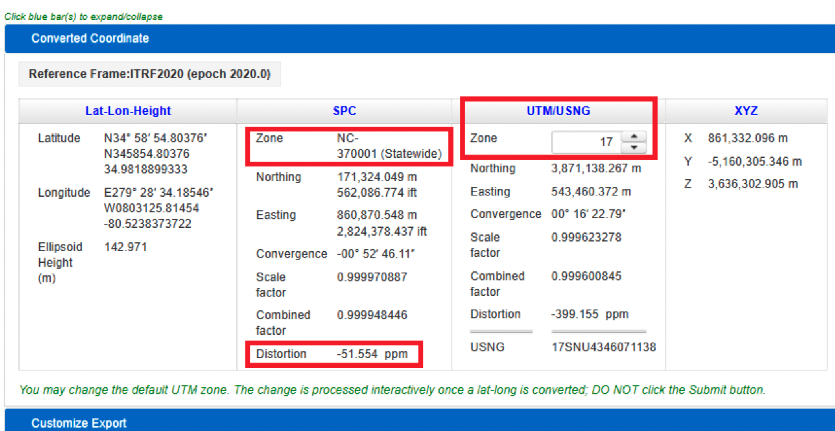
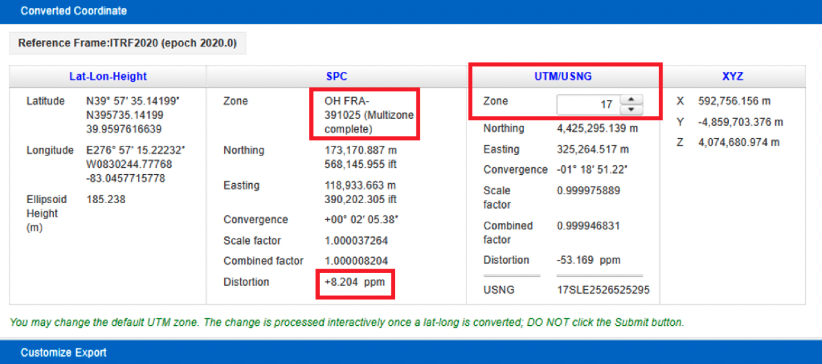
The image below provides the output of NCAT. I have highlighted a few items in the image. First, the program selected North Carolina’s Statewide Zone, the distortion is -54.554 ppm at this mark, and the UTM zone selected is Zone 17. The output also provides the scale and combined factors.
NCAT output for NCMR. (Image: NGS)
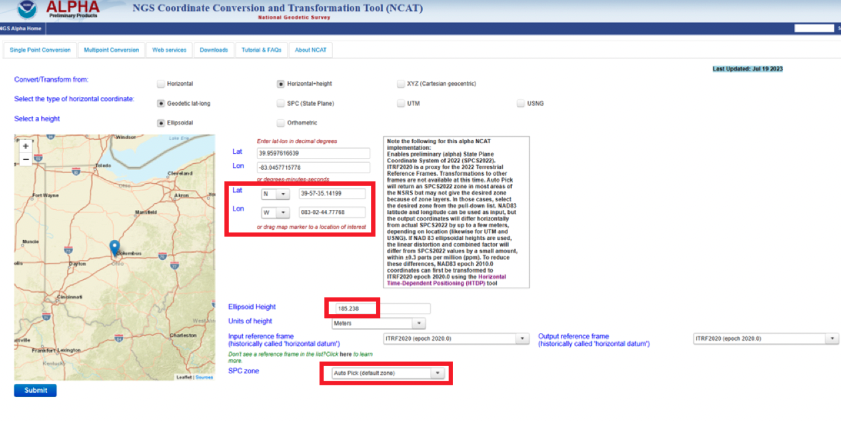
North Carolina is a state that elected to have a single statewide zone, but, as previously mentioned, some states decided to design their own LDPs. Again, Ohio is a state that designed LDPs that cover the entire state. Once again, I entered the coordinates into the input boxes and selected the auto pick (default zone) option. As indicated in the converted coordinates section, the program selected the OH FRA-391025 zone based on the coordinates of the mark. Notice that the distortion is only +8.024 ppm.
NCAT results for Columbus CORS (COLB). (Image) NGS)
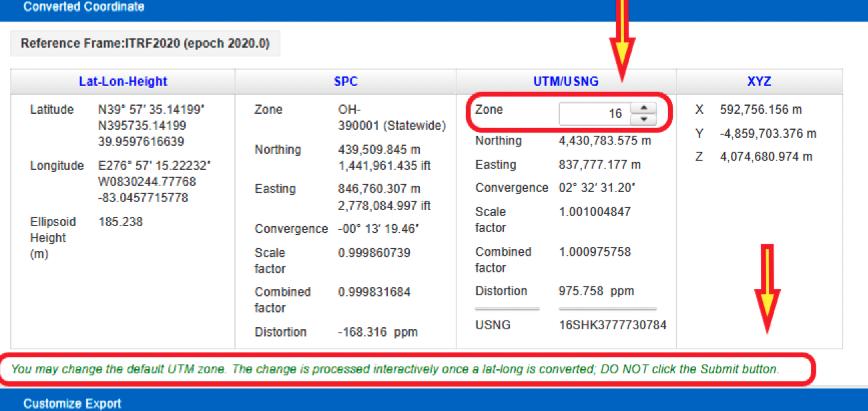
The user has the option to select a different zone than the default zone. The image below provides the SPC values for the COLB mark when selecting the Ohio Statewide Zone. Notice that the distortion value changes from +8.024 ppm to -168.316 ppm. Also, as expected, the UTM and X, Y, and Z values have not changed.
NCAT results for COLB selecting Statewide Zone. (Image: NGS)
One last option to highlight is that the user can change the default UTM zone by clicking on the up or down arrows under the UTM column. In my example, I changed the UTM zone from 17 to 16. Obviously, the values under the UTM column changed.
Option to change default UTM zone. (Image: NGS)
The concept of the NGS’s Alpha site is to provide examples of the content, format, and structure of data and products that NGS plans to release as part of the modernized NSRS. NGS states that these Alpha products are for illustrative purposes only and do not contain any authoritative NGS data or tools. It states that they are under active development and are subject to change without notice.
That said, NGS would like everyone to try these Alpha products and provide feedback to NGS, so that they can improve their products and services. I would encourage readers to try these Alpha sites and provide comments and suggestions to NGS.
Beep Inc, a provider of autonomous shared mobility solutions, and Oxa, an autonomous vehicle software developer, have partnered to deploy autonomous vehicles driven by Oxa in the United States. The collaboration marks Oxa’s entry into the U.S. market.
Under the partnership, Oxa’s autonomy software will be installed in a variety of vehicle types operated by Beep, from current passenger shuttles to future vehicle platforms.
The Oxa Driver is a software platform that combines sensor data from cameras, lidar, and radar to gain a more comprehensive view of the world around it when compared to vehicles that rely on cameras alone. This software uses AI to accurately sense and predict changes to the vehicle’s environment while learning from previous journeys.
Two of the Beep shuttles featuring Oxa software are currently operating at the recently opened SunTrax test facility in Auburndale, Florida, — the first location in the United States specifically designed for connected autonomous vehicle and standard automotive testing in a single site.
Oxa is using the facility to showcase its passenger transportation solution ahead of public availability in late 2023.
“Seen & Heard” is a monthly feature of GPS World magazine, traveling the world to capture interesting and unusual news stories involving the GNSS/PNT industry.
Researchers at the University of Connecticut have conducted one of the largest understory species mapping projects using satellite data and have published the results of the study in the Remote Sensing of Environment journal. In this study, the researchers proposed an automated dense Sentinel-2 time series-based approach for understory plant communities and created maps of four understory classes that include native shrubs of greenbrier and mountain laurel, invasive shrubs of barberry, and the assemblage of mixed invasives at 10 m resolution in Connecticut’s deciduous forests. The researchers developed a strategy that distinguished plant species with an accuracy of 93% and determined that 53% of Connecticut’s understory is now comprised of invasive plant species such as barberry, bittersweet, winged euonymus (burning bush), and multi-flora rose.
Invasive Species VS. UAVs
Image: Donn Bartram
Researchers at West Virginia University are using UAVs to develop tools to detect, map, treat and monitor invasive plant species with a grant from the Richard King Mellon Foundation. Multiflora rose is an invasive shrub that threatens native plants in more than 40 states, including West Virginia and Pennsylvania. This project aims to equip UAVs with sensors to collect environmental data in a designated area of southwestern Pennsylvania over multiple seasons. The research team will use that data, combined with machine learning technology, to develop software that can identify multiflora rose and, eventually, other invasive species.
Protecting Farms with GIS
Image: Daniel Balakov/E+/Getty Images
American Farmland Trust (AFT) is partnering with government agencies and advocacy groups in South Carolina to deploy GIS mapping tools to predict areas at the highest risk of development in the state. Palmetto 2040: Visioning Alternative Futures, Launching Solutions is a geospatial modeling and policy analysis tool designed to identify and model future outcomes. This mapping tool will project what land in South Carolina is at highest risk of development by 2040. The analysis will consider both rapid population growth and climate change impact on settlement patterns and agriculture, according to AFT.
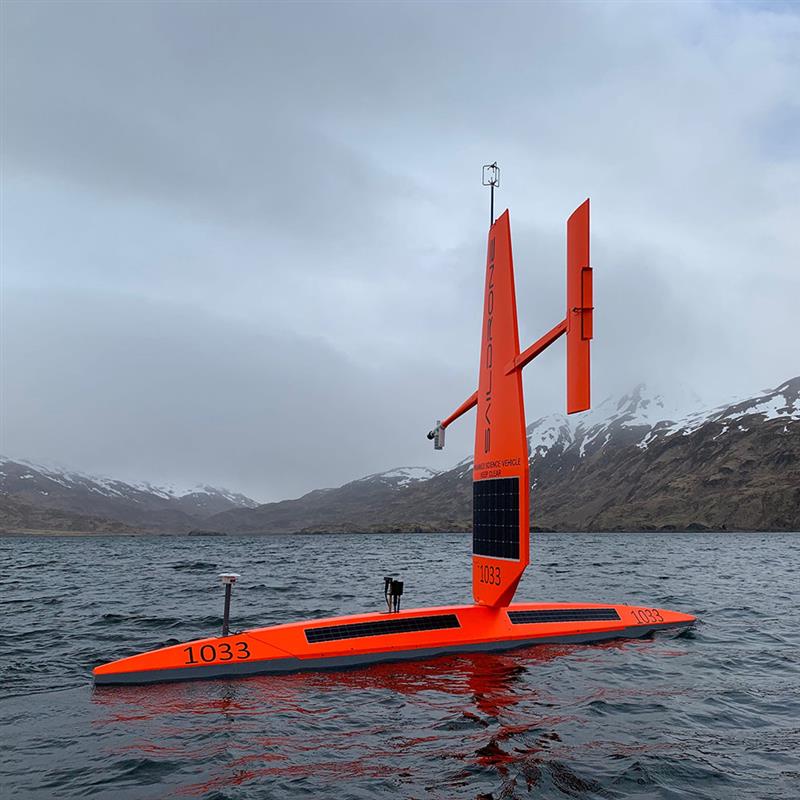
USV Take Hurricanes
Image: SailDrone
Saildrone is deploying 12 uncrewed surface vehicles (USV) into the tropical Atlantic and Gulf of Mexico this summer, supporting research by the National Oceanic and Atmospheric Administration (NOAA) to advance hurricane forecasting. Ten USVs will be deployed from St. Thomas, U.S. Virgin Islands; St. Petersburg, Florida; and Charleston, South Carolina; to operate in areas with a high probability of intercepting a storm, as indicated by historical data. Two vehicles will remain on land, ready for quick deployment in the event of an approaching hurricane. NOAA will use the data collected by the USVs to improve hurricane forecast models.
Inertial Labs has been awarded a General Services Administration (GSA) Multiple Award Schedule (MAS) contract. With the contract in place, federal, state and local government agencies will gain streamlined access to Inertial Labs’ products and services.
The GSA Schedule contract aims to simplify the procurement process, allowing government entities to acquire solutions for navigation, positioning and motion-sensing systems. The products and services offered by Inertial Labs cater to a wide range of applications, including unmanned systems, defense, aerospace, transportation and more.
“We are extremely proud to have been awarded a GSA Schedule contract,” Jamie Marraccini, CEO of Inertial Labs said. “We look forward to supporting the critical missions of our government partners and providing them with the advanced technology they require.”
Researchers at the West Virginia University Davis College of Agriculture, Natural Resources and Design are using UAVs to develop tools to detect, map, treat and monitor invasive plant species with a $175,000 grant from the Richard King Mellon Foundation.
Multiflora rose is an invasive shrub that threatens native plants in more than 40 states, including West Virginia and Pennsylvania. This project aims to equip UAVs with sensors to collect environmental data in a designated area of southwestern Pennsylvania over multiple seasons. The research team will use that data, combined with machine learning technology, to develop software that can identify multiflora rose and, eventually, other invasive species. The software could then be used for targeted delivery of herbicides via UAVs.
WVU is collaborating with two partners to help facilitate the project, including CNX — a natural gas company headquartered in Canonsburg, Pennsylvania that is offering the use of reclaimed mine land — and Resource Environmental Solutions — an ecological restoration company that is providing technical assistance with herbicide selection and deployment.
This project builds upon ongoing UAV-based research conducted by the National Resource Analysis Center (NRAC) with the U.S. Office of Surface Mine Reclamation and Enforcement. The current study focuses on autumn olive, which is one of the most common invasive brush species in West Virginia.
Most of the data collection and analysis focused on multiflora rose will begin in the 2024 spring growing season, but NRAC’s team of researchers is already using autumn olive data to see what information can be gathered about multiflora rose.