Tactical air-lifters such as the Airbus A400M, Lockheed C-130 and Boeing C-17 require precise runway roughness assessments to operate safely on unpaved surfaces. An autonomous rover system developed at the Royal Military Academy of Belgium uses RTK/PPK GNSS positioning and sensor fusion to deliver centimeter-level height measurements, drastically reducing survey time. The system provides a practical solution for rapid runway certification across military operations and humanitarian response missions.
Unpaved runway assessment
The Airbus A400M Atlas, the Lockheed C-130 Hercules and the Boeing C-17 Globemaster III routinely operate from unpaved runways in harsh environments far from established infrastructure. Before these aircraft can safely land, flight crews require accurate runway roughness data to assess whether the surface meets operational limits. This assessment relies on precise, quantitative measurements of the runway’s surface characteristics — a task that traditionally requires specialized survey teams and hours of manual work with GNSS equipment, resources that are often unavailable in high-tempo tactical or emergency response scenarios.
The challenge is particularly acute because different aircraft have specific roughness tolerances. The A400M uses an equivalent bump height (EBH) methodology, while Boeing employs its Boeing Bump Criteria. The EBH requires vertical measurement precision of ±1 cm over wavelengths ranging from 5 to 100 meters. Meeting these stringent requirements with rapid, field-deployable methods has remained an operational gap — until now.
At the Royal Military Academy (RMA) of Belgium, we developed a novel solution to this critical challenge. Our system features a rugged, autonomous unmanned ground vehicle that can rapidly perform a centimeter-accurate runway assessment with minimal user intervention. It represents a fusion of robotics, geodesy, and advanced GNSS techniques, designed specifically for ease of use by military teams in the field. The system is called Belgian Navigational Surface Inspector (BENSI).
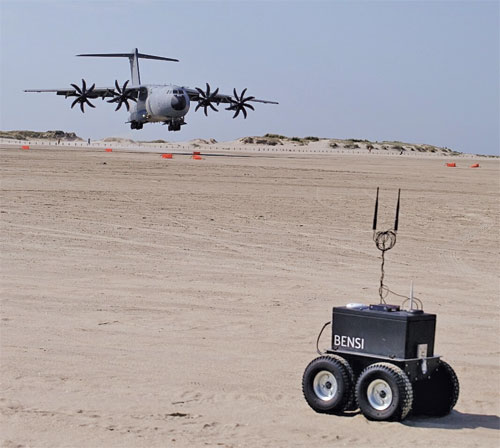
FIGURE 1 shows the BENSI system during a mission at a tactical landing zone with the A400Min the background. FIGURE 2 shows the BENSI system being configured by the operator during a landing preparation.

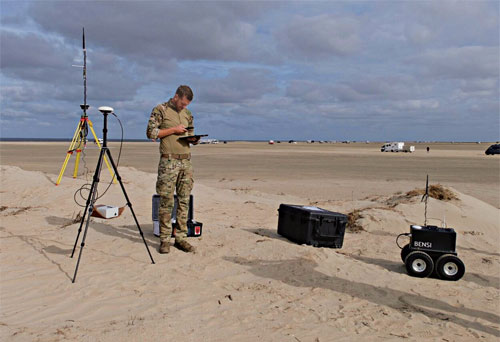
during the beach landing preparation at Rømø, Denmark.
This article details the system’s architecture, the integration of multiple technologies that enable the stringent precision required achieved by GNSS and sensor fusion, self-driving capabilities and its successful deployment in demanding field tests. We present a military graded solution for ensuring tactical airlift safety, enabled by modern, accessible GNSS technology and robotics.
Quantifying runway roughness
Deployable Air Traffic Management (DATM) and Pathfinders are responsible for ensuring the safety of aircraft operations on unpaved runways. They are tasked with assessing the quality of the runway and the Runway Safety Area (RSA) to ensure that the aircraft can land safely. The pilots analyze their assessment and take the final decision to land.
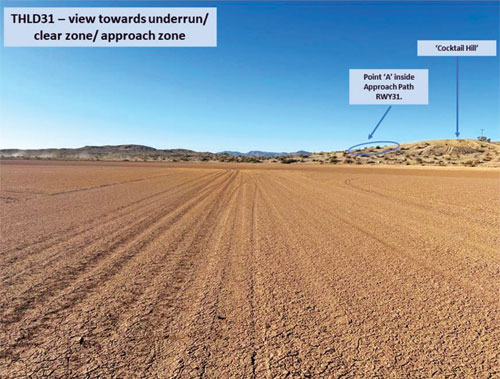
FIGURE 3 is an example of a landing zone having an unpaved runway that needs to be evaluated for landing. FIGURE 4 overviews the landing zone by mapping and indicating features of the runway that need to be considered by the pilots. An important aspect of the DATM’s assessment is the runway’s roughness, which is quantified by the EBH.
For modern military transport aircraft operations, runway roughness assessment is a critical safety parameter. Both major manufacturers — Airbus with its EBH methodology and Boeing with its Boeing Bump Criteria — have developed sophisticated approaches to characterize runway longitudinal roughness profiles. These methods analyze height variations over wavelengths ranging from 5 to 100 meters, requiring vertical measurement precision of ±1 cm. This rigorous assessment is essential to reduce aircraft structural fatigue, minimize maintenance costs, prevent exceedance of design limit loads, and ultimately ensure safe operations. For the A400M specifically, Airbus requires EBH characterization to determine operational limitations of the aircraft’s maximum payload.
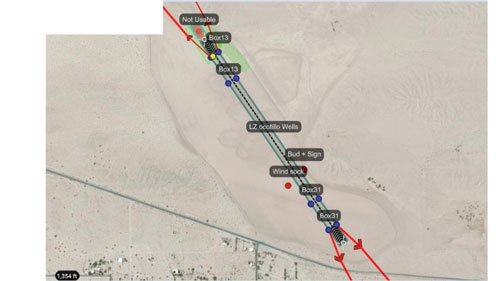
condensed overview of DATM’s assessment.
Traditionally, achieving this precision would involve a painstaking survey conducted by specialists using a GNSS survey system mounted on a trolley requiring human guidance along the measurement tracks totaling more than 3 km of length. For military units like the DATM and Pathfinder teams, who often are the first on the ground, this is impractical. They need a system that is rapid, reliable, simple to operate without a surveying background, and robust enough for field conditions.
A GNSS-Centric design
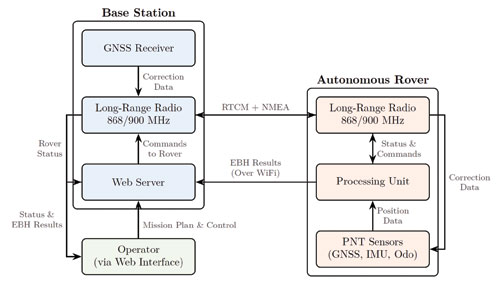
Our solution is a two-part system designed for rapid deployment: a portable GNSS base station and autonomous rover. FIGURE 5 shows a schematic overview of the system architecture.
The base station: The system’s anchor
Housed in a compact, portable case, weighing just 2 kg including tripod and radios (as seen in FIGURE 2), it serves as the operational hub. Once set up on its lightweight tripod, it performs an automatic survey to establish its precise coordinates. Its primary role for positioning is to generate and transmit Radio Technical Commission for Maritime Services (RTCM) 3.x correction data to the rover via a robust long-range radio link (operating in the868/900MHz bands).
Beyond its GNSS duties, the base station acts as a self-contained command center. It hosts a Wi-Fi hotspot and a web server, allowing the operator to connect with any standard tablet, smartphone or laptop. This web interface is used for mission planning, command and control of the rover, and real-time monitoring of survey progress. At the end of the mission, the operator can download the EBH data and additional quality metrics of the runway for analysis such as a summary report of the complete measurement, a gradient analysis, and a runway map highlighting zones with bumps or troughs exceeding the specified criteria.
An autonomous, all-terrain surveyor
The UGV is a lightweight but rugged platform chosen for its durability and open-source software architecture, which allows for deep integration of our custom navigation and control algorithms. The rover has been designed to be able to traverse rough terrain and survive in harsh weather conditions. The UGV consists of two parts, the chassis (11 kg) and the processing payload(8 kg). The heart of the rover is the processing payload, which contains a sophisticated sensor suite designed for high-precision localization and navigation.
■ Primary GNSS receiver. A high-grade, multi-constellation Septentrio receiver with a Calian/Tallysman GNSS antenna provides the main source of positioning information.
■ GNSS heading. A second Calian/Tallysman GNSS antenna, set up in a moving-base configuration, provides degree-accurate true heading, which is critical for maintaining precise track-following.
■ Inertial measurement unit (IMU). An industrial-grade Xsens IMU provides high-frequency data on the rover’s orientation and acceleration, bridging any brief GNSS outages, providing the sensor fusion algorithm with high-rate data, and helping to smooth the final trajectory.
■ Radio communication. The radio modules provide robust long-range communication with the base station operating in the 868/900MHz bands.
■ Wheel odometry. Encoders on the rover’s wheels provide continuous velocity information, acting as a crucial input for the sensor fusion algorithm. All sensor data is fed into an onboard mini-PC running the Robot Operating System, a flexible framework for developing robotic applications.
Path to precision
Achieving centimeter-level accuracy on a moving platform in challenging environments requires more than just a good GNSS receiver. Our approach is built on a robust foundation of sensor fusion and a dual processing strategy using real-time kinematic and post-processing kinematic (RTK/PPK). An extended Kalman filter (EKF) is at the core of the rover’s navigation software. The EKF continuously fuses data from the GNSS receivers, IMU and wheel encoders to produce a single, high-integrity “pose” (position and orientation) estimate.
For runway surveying, we employ two modes of GNSS processing:
RTK. During the mission, the rover uses the RTCM corrections from the base station to compute a centimeter-accurate position in real-time. This is used for autonomous navigation, allowing the rover to follow its generated mission plan configured by the operator with high precision.
PPK. While RTK provides excellent real-time results, the most demanding applications benefit from post-processing. Both the rover and the base station log all raw GNSS observables during the mission. After the survey is complete, these raw data files are processed together which allows for more rigorous quality control and can often resolve ambiguities or fix cycle slips that were not solvable in real-time, providing the definitive, highest accuracy trajectory for the EBH analysis.
A final crucial step is extracting the height profile for each EBH track and subsequently transforming and reformatting this data for Airbus’ AssurTool. The step also is automated and carried out by the software. It takes care of the following:
■ The conversion of the geodetic coordinates (latitude, longitude, and height above the World Geodetic System 1984 [WGS84] ellipsoid) to Universal Transverse Mercator plane coordinates and orthometric heights (heights relative to a geoid).
■ The extraction of the height profile of each EBH track.
■ Quality control of the precision of the height profile flags tracks that do not meet the required accuracy or show inconsistencies.
■ The transformation and reformatting of this data for Airbus’ AssurTool.
Self-driving capabilities
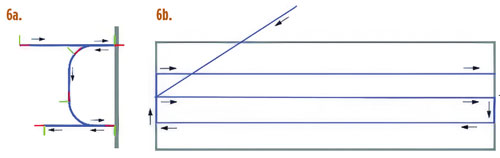
The rover uses a navigation framework with a custom planner for generating smooth, curved paths that match the rover’s turning capabilities and steers the rover using a controller based on the Regulated Pure Pursuit tracking algorithm. A specialized lane-generation algorithm creates optimal survey patterns from runway corner points, with behavior-tree recovery strategies for robust operation.
FIGURE 6 shows a typical EBH survey pattern generated from the mission plan and executed by the rover and a depiction of how the rover plans the smooth curved path between the lanes.
A streamlined workflow
The system was designed from the ground up to be operated by non-surveyors. A typical mission workflow is as follows:
Setup. The operator places the base station on a tripod near the runway and unfolds the rover. The entire hardware setup takes less than 10 minutes.
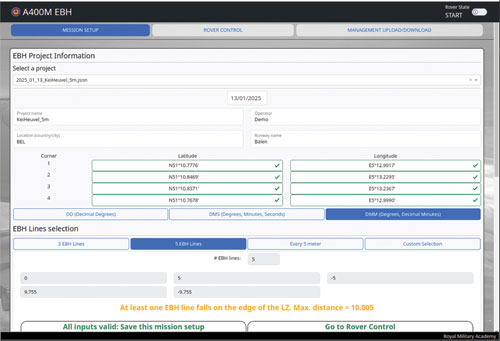
Mission planning. Using a ruggedized tablet (or any other device with a web browser), the operator connects to the base station’s WiFi and opens the web interface. They define the runway by entering the coordinates of the runway’s corners. The software automatically calculates the EBH lines based on the required spacing. FIGURE 7a shows the user interface displayed on a tablet, showing the EBH mission configuration page.
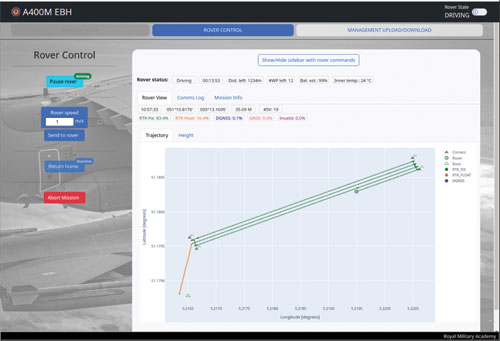
Execution. The operator initiates the mission, and the UGV autonomously navigates to the start of the first line and begins the survey. The operator can monitor and control the rover’s progress, position, and GNSS quality status in real-time on the web interface. FIGURE 7b shows the user interface displayed on a tablet, showing the rover control, the real-time status of the UGV and the measurements.
Data retrieval. Upon completion, the rover returns to the base station. The system automatically processes the data, producing downloadable files formatted for direct import into Airbus’ AssurTool and additional useful quality metrics for the operator. These consist of a summary report of the complete measurement, a gradient analysis, and a runway map highlighting zones with bumps or troughs exceeding the specified criteria.
Analyzing the data
Once the rover completes its survey and returns to the base station, the system automatically initiates post-processing of the collected data. This critical step validates the quality of every measurement and generates operator-ready outputs for both Airbus’ AssurTool and field assessment.
The post-processing pipeline applies rigorous quality criteria to each survey line. Lines failing these criteria are automatically flagged with detailed diagnostics explaining the cause.
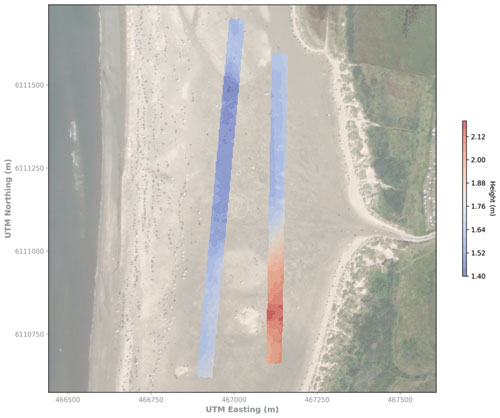
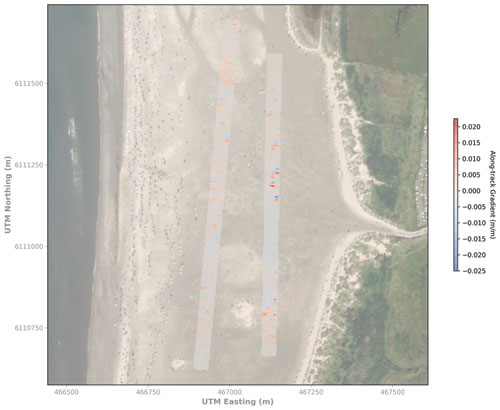
For operational decision-making, the system generates a comprehensive visualization report. The operators receive planimetric maps showing the height profile plots and a detailed gradient analysis identifying critical slope transitions. A key capability is the generation of a 3D interpolated height map of the entire runway surface. This color-coded surface map provides an intuitive view of the runway’s topography, clearly highlighting zones with excessive bumps, depressions, or gradient anomalies that facilitates the assessment of the runway.
These analysis reports are accessible through the web interface for immediate download to the operator’s tablet. FIGURES 8 shows examples of the visualization report.
Proven performance
The UGV system is a mature prototype that has been validated in numerous international military exercises. It has successfully surveyed tactical landing zones in varied environments, from the desert strips of Yuma, Arizona, and 29 Palms, California, to the sandy shores of Denmark and fields in France, Portugal and Italy. In all tests, the system has consistently delivered the sub-centimeter height precision required for A400M EBH certification.
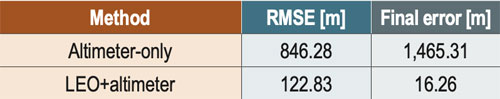
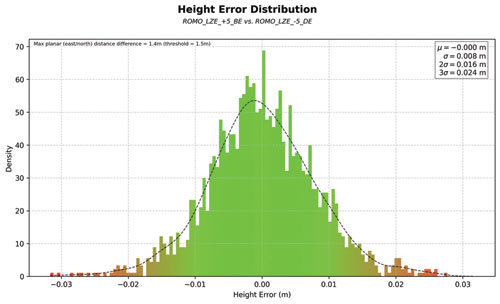
2025 Rømø Head-to-Head Trial. During beach-landing preparations in August 2025, our autonomous rover and a manual system (human-guided trolley) using a professional GNSS survey system ran side-by-side on a 1 000m landing zone on the Rømø beach in Denmark. The BENSI solution matched the manual survey system height profile with a standard deviation of 8mm and demonstrated significantly better lane-tracking consistency (mean deviation: 8,5 cm vs 16 cm and deviation error: 3 cm vs 9 cm). FIGURE 9 shows the height-error distribution between the BENSI system and the manual survey system at Rømø, Denmark.
Rapid humanitarian response
While BENSI was conceived for tactical airlift operations, its capabilities extend naturally to humanitarian assistance and disaster-relief missions. Belgium’s civil rapid-response unit Belgian First Aid & Support Team (B-FAST) routinely deploys doctors, paramedics, firefighters, and other professionals worldwide following earthquakes, floods, or epidemics. Leveraging the A400M’s ability to land on short, unpaved strips away from congested or contested airfields drastically cuts transit times — but only if the runway’s condition can be certified quickly.
The BENSI systems enables a DATM team to quickly relay an EBH report and awareness map of the immediate area to the inbound aircrew. This rapid assessment unlocks critical early access for life-saving medical supplies and personnel when every hour counts.
Conclusion and the Road Ahead
The fusion of autonomous robotics and high-precision GNSS offers a powerful solution to the critical challenge of certifying unpaved runways. Our system saves valuable time, reduces the burden on specialized personnel, and provides objective, high-quality data that directly enhances the safety of tactical airlift operations.
Development is ongoing. Our current efforts focus on several key areas:
■ Improving navigation in degraded environments. We are exploring tighter coupling between the GNSS and IMU to provide more robust navigation through areas of poor satellite visibility.
■ RSA assessment. We are experimenting with integrating a lidar sensor to generate a 3D point cloud of the runway and its surroundings. This will automate obstacle detection and the assessment of the RSA, though we are carefully working to mitigate potential electromagnetic interference from the lidar that can interfere with GNSS reception.
■ Handheld corner point device. To further improve absolute accuracy, we are developing a small, handheld device that uses RTK corrections from the base station, allowing operators to mark the runway corners with centimeter-level precision.
This project demonstrates a clear application of GNSS technology in a demanding military aviation context, with broader implications for any field requiring rapid and precise surface profiling, from civil engineering to disaster response.
Development Team
■ Pieterjan De Meulemeester ([email protected]) is a Ph.D. research engineer at the RMA of Belgium.
■ Alain Muls ([email protected]) is professor at the RMA of Belgium. He teaches the courses Military Satellite Based Positioning andMilitary Geodesy.
■ Jarno Van Audenhoven ([email protected]) is a Robotics Development and Research Engineer at the RMA of Belgium.
■ Pascal De Kimpe is a technician at the RMA of Belgium.
■ The BENSI system was developed by the R&D team at the RMA of Belgium in collaboration with Belgian Defense. The system has been successfully field-tested during international military exercises and is being evaluated for operational deployment.
All photos courtesy of BENSI Development Team of the Royal Military Academy of Belgium